1. Introduction
Due to the onerous environmental responsibility for reducing greenhouse gas emissions, renewable energy is being recognized as the most effective solution by governments and will become the mainstream energy in the world with irresistible trends [
1,
2]. It is expected that renewable energy, represented by wind and solar power, will provide almost 50% of total electricity globally by 2050 as renewable plants rapidly rise and the existing large-scale plants retire [
3,
4]. Most renewable energy use the voltage source converter (VSC) [
5,
6] to connect with the AC system. Therefore, with the continuous penetration of renewable energy, the VSC for integrating renewable energy has become the most common device in the electric network in recent years.
Different from the conventional synchronous generators, due to the adopted control strategy that usually is vector current control (VCC), the VSC cannot provide support to the AC system. Thus, the strength of the AC system meets a continuous decrease with the increasing proportion of the renewable energy integration [
7,
8,
9,
10]. Furthermore, the high proportion of power electronic equipment required for renewable energy access has the characteristics of low inertia, resulting in a decrease in the stability margin of the system, so the power fluctuations caused by the asymmetry of power supply and demand may be more likely to cause system instability. However, it is interesting that the VSC based on VCC will work into unstable conditions when the AC system has a lower short circuit ratio (SCR) [
11] that is generally deemed as an important index of the strength of an AC system with a converter connection [
12,
13,
14]. It has been pointed out that the DC power of VSC is affected by the SCR and the parameters of the phase-locked loop (PLL). When the SCR is reduced, the high-gain PLL will destroy the stability of the system [
15,
16,
17]. Reference [
18] indicates that when the VSC adopts the commonly used VCC mode, it cannot operate stably under an extremely weak AC system. The reason for the system instability is investigated in [
19], in that the coupling relationship between the PLL and the grid impedance is intensified, and the maximum gain of the PLL is decreased as the SCR decreases. The analysis results of [
20] show when the SCR of the AC system is very low, the
dq axis decoupling characteristics of the VCC system are destroyed, which leads to the instability of the VSC. Reference [
21] established a nonlinear phase-locked loop model, and pointed out that the self-synchronization of the PLL is caused due to the influence of the impedance under the weak grid, which leads to the instability of VSC. In [
22], the effect factors of the stability of the VSC that connect to the weak AC system are studied, and the critical short circuit ratio (CSCR) range under various typical operating conditions is also obtained.
Owing to the unstable issue of the VSC under VCC, reference [
23] proposed a power synchronization control (PSC) in 2010, which could make the VSC under PSC work similarly, as part of the characteristic of the synchronous generators. This method uses a power-synchronization loop (PSL) instead of a conventional PLL to maintain synchronization between the VSC and the AC system, which enhances the stability of the VSC especially when it works in a weak AC system [
24,
25]. Reference [
26] adds a current loop on the basis of power synchronization control, which provides the converter with the ability to inertially support. In addition, reference [
27] uses the same power symmetry as synchronous generators but avoids their inherent problems, and reference [
28] improved the control strategy proposed in [
27] so that its active power synchronization controller includes the control of the DC link voltage. However, when the SCR of the AC system is relatively high, the VSC based on PSC may have a slower adjustment speed, lower damping, and poorer AC side fault ride-through capability [
29]. Reference [
30] analyzes the power transmission limit and small-signal stability of the VSC based on PSC from SCR, impedance angle of system, and power flow direction, and draws the conclusion that the stability of the VSC based on PSC decreases with the increase of SCR.
Due to that the operating stability of the VSC is highly related to the strength of the AC system, a single control strategy configuration may not be suitable for the VSC for renewable energy integration. How to choose the control strategy of VSC for different strengths of AC systems becomes an essential issue for maintaining the symmetry between high proportion of renewable energy integration and stable operation of AC system. In addition, most of the existing papers analyze the impact on the system under the condition of constant SCR, but do not consider the impact of change in SCR on system stability, VSC control strategies, etc. Due to the system occurring fault, generator tripping or putting into operation will cause the decrease or increase of SCR, in order to clarify the impact of the continuous change process of the SCR on the power system, and provide the theoretical basis for the follow-up study of reliable and flexible control strategies of grid-connected VSC under the complex operating conditions. It is necessary to compare and analyze the system stability of VCC and PSC strategies under continuous SCR change, so as to achieve the best performance of the converter and keep the symmetry of power supply and demand under different strengths of an AC system.
In this paper, the two common VSC control strategies, VCC and PSC, are analyzed to obtain the operation zones of the control strategies of the VSC under different strengths of the AC system. The contribution of this paper is summarized as follows:
The principle of two recently available control modes, namely VCC and PSC, are introduced and their applicable scenes are analyzed.
Based on the SCR and the power limit output calculation under steady-state conditions of the VSC, the operation zones of the VCC and PSC are proposed, respectively.
With the CSCR analysis, small-signal stability analysis and transient stability analysis, the proposed operation zones of the VCC and PSC are analyzed by changing the SCR of the modified IEEE 33 bus system in a medium voltage MMC system built in PSCAD/EMTDC.
The rest of this paper is as follows. In
Section 2, the definition of SCR and the basic principles of VCC and PSC are introduced. In
Section 3, operation zones of VSC based on VCC and PSC are given, respectively.
Section 4 introduces the medium voltage MMC system in PSCAD/EMTDC and tests and analyzes its CSCR, the small-signal stability and transient stability with the changes of strength of the modified IEEE 33 bus system. Finally,
Section 5 reports the conclusions.
3. Analysis of Operation Zones of VSC
VCC is one of the most widely used control strategies for grid-connected VSC, but when connected to a weak AC system, a high-gain PLL will deteriorate the dynamic characteristics of the system and then affect the system stability [
30]. Reference [
34] proposes that due to the existence of grid impedance, there is a coupling relationship between the PLL of the grid-connected converter and the grid impedance. When the SCR of the AC system decreases, the grid impedance increases and the coupling relationship between the PLL and the grid impedance intensifies, leading to the decrease of maximum gain of the PLL and the weakening of system stability. The gain of PLL will significantly affect the stability of the converter, especially under weak grid conditions. Reference [
19] draws the conclusion from the simulation that the converter working at VCC is difficult to operate stably when the SCR is close to 1.3. Some references, including [
29], also mentioned that when the SCR < 1.5, it is necessary to install synchronous condensers or take other measures to increase the short-circuit capacity of the AC system and ensure the stable operation of the system. Reference [
35] points out that when the SCR of the system is lower than 2.0, the small-signal instability will occur in the VSC based on VCC. Based on the above, the operation zone of VSC based on VCC is shown in
Figure 8a. When SCR is extremely low, the system will not be able to operate stably. As the SCR increases, the critical fault duration that enables the system to operate stably increases, and the AC fault ride-through ability of the converter improves.
A grid-connected VSC based on PSC basically resembles the dynamic behavior of a synchronous generator, so in principle, there is no requirement for the short-circuit capacity of the connected AC system. However, due to the limitation of the maximum power that the converter can output and the constraint of weakened damping when connected to a strong AC system, the rated power may exceed the power limit when SCR is quite low, and the higher SCR will lead to the reduction of the operating stability. Thus, the actual operation zone of the VSC based on PSC is shown in
Figure 8b.
Reference [
30] proposes that the maximum power that the converter can output under steady-state conditions is
where
Smax_pu is the maximum capacity of the VSC,
φ is the system impedance angle, and
Pmax_pu is the maximum active power that the converter can output. Assuming that
φ is 75 degrees and
Smax_pu = 1.0526, when the reference active power is 10 MW, the system has reached its power operating limit when the SCR is approximately equal to 0.53. Furthermore, reference [
30] mentioned that although the PSC can make the power approach the operating limit and keep the symmetry between supply and demand power of the system, as the operating point approaches its steady-state limit, the system response time becomes longer, resulting in an insufficient small-signal stability margin. In fact, it is impossible to get very close to the power limit, so when SCR < 0.6, the system cannot operate stably even if there is no fault. At this time, the power angle cannot be stabilized at a certain value, so the system loses transient stability. On the other hand, when SCR is high, the damping ratio of the system will become lower, which will reduce the system stability and AC fault ride-through ability. Thus, with the increase of SCR, the VSC gradually works into the marginal zone, in which the system is critically stable.
Through the above comparison, it can be seen that the VCC has strong stability when the SCR is high, while the PSC is superior to the traditional VCC for VSC connected to weak AC systems. However, due to the constraints of power limit and system damping ratio, the system may be unstable when SCR is quite high or quite low.
4. Case Studies
In order to analyze the small-signal stability and transient stability of the grid-connected VSC based on VCC and PSC, respectively, under SCR changes, a medium voltage MMC model, as shown in
Figure 9, is built in PSCAD/EMTDC. The AC system adopts a modified IEEE 33 bus system, and the system impedance angle is maintained at approximately 75 degrees. The configuration and parameters of the IEEE 33 bus system are referred to in [
36]. As shown in
Figure 9, firstly, the voltage level of the IEEE 33 bus system is changed from the original 12.66 kV to 10 kV. In addition, a converter is connected to bus 19 with an adjustable impedance Z
s, which can be written as R
s + jX
s. The purpose of adjusting R
s and X
s is to conveniently realize the SCR change of the IEEE 33 bus system, so as to realize the direct comparison between VCC and PSC under different strengths of the AC system. The detailed parameters of the model are shown in
Table 1.
The basic control parameters of VSC based on VCC are shown in
Table 2, the converter adopts constant active power control and constant reactive power control.
The basic control parameters of VSC based on PSC are shown in
Table 3.
Then, the CSCR, small-signal stability and transient stability under different control modes are simulated and analyzed as follows.
4.1. Case 1: CSCR Analysis
CSCR needs to be simulated to verify the operation zones of
Section 3. Through the analysis of the CSCR, the operating boundaries of VSC based on VCC and PSC can be obtained, respectively.
It is assumed that the initial SCR of the connected AC system is 3, at this time, R
s is 0.3190 Ω and X
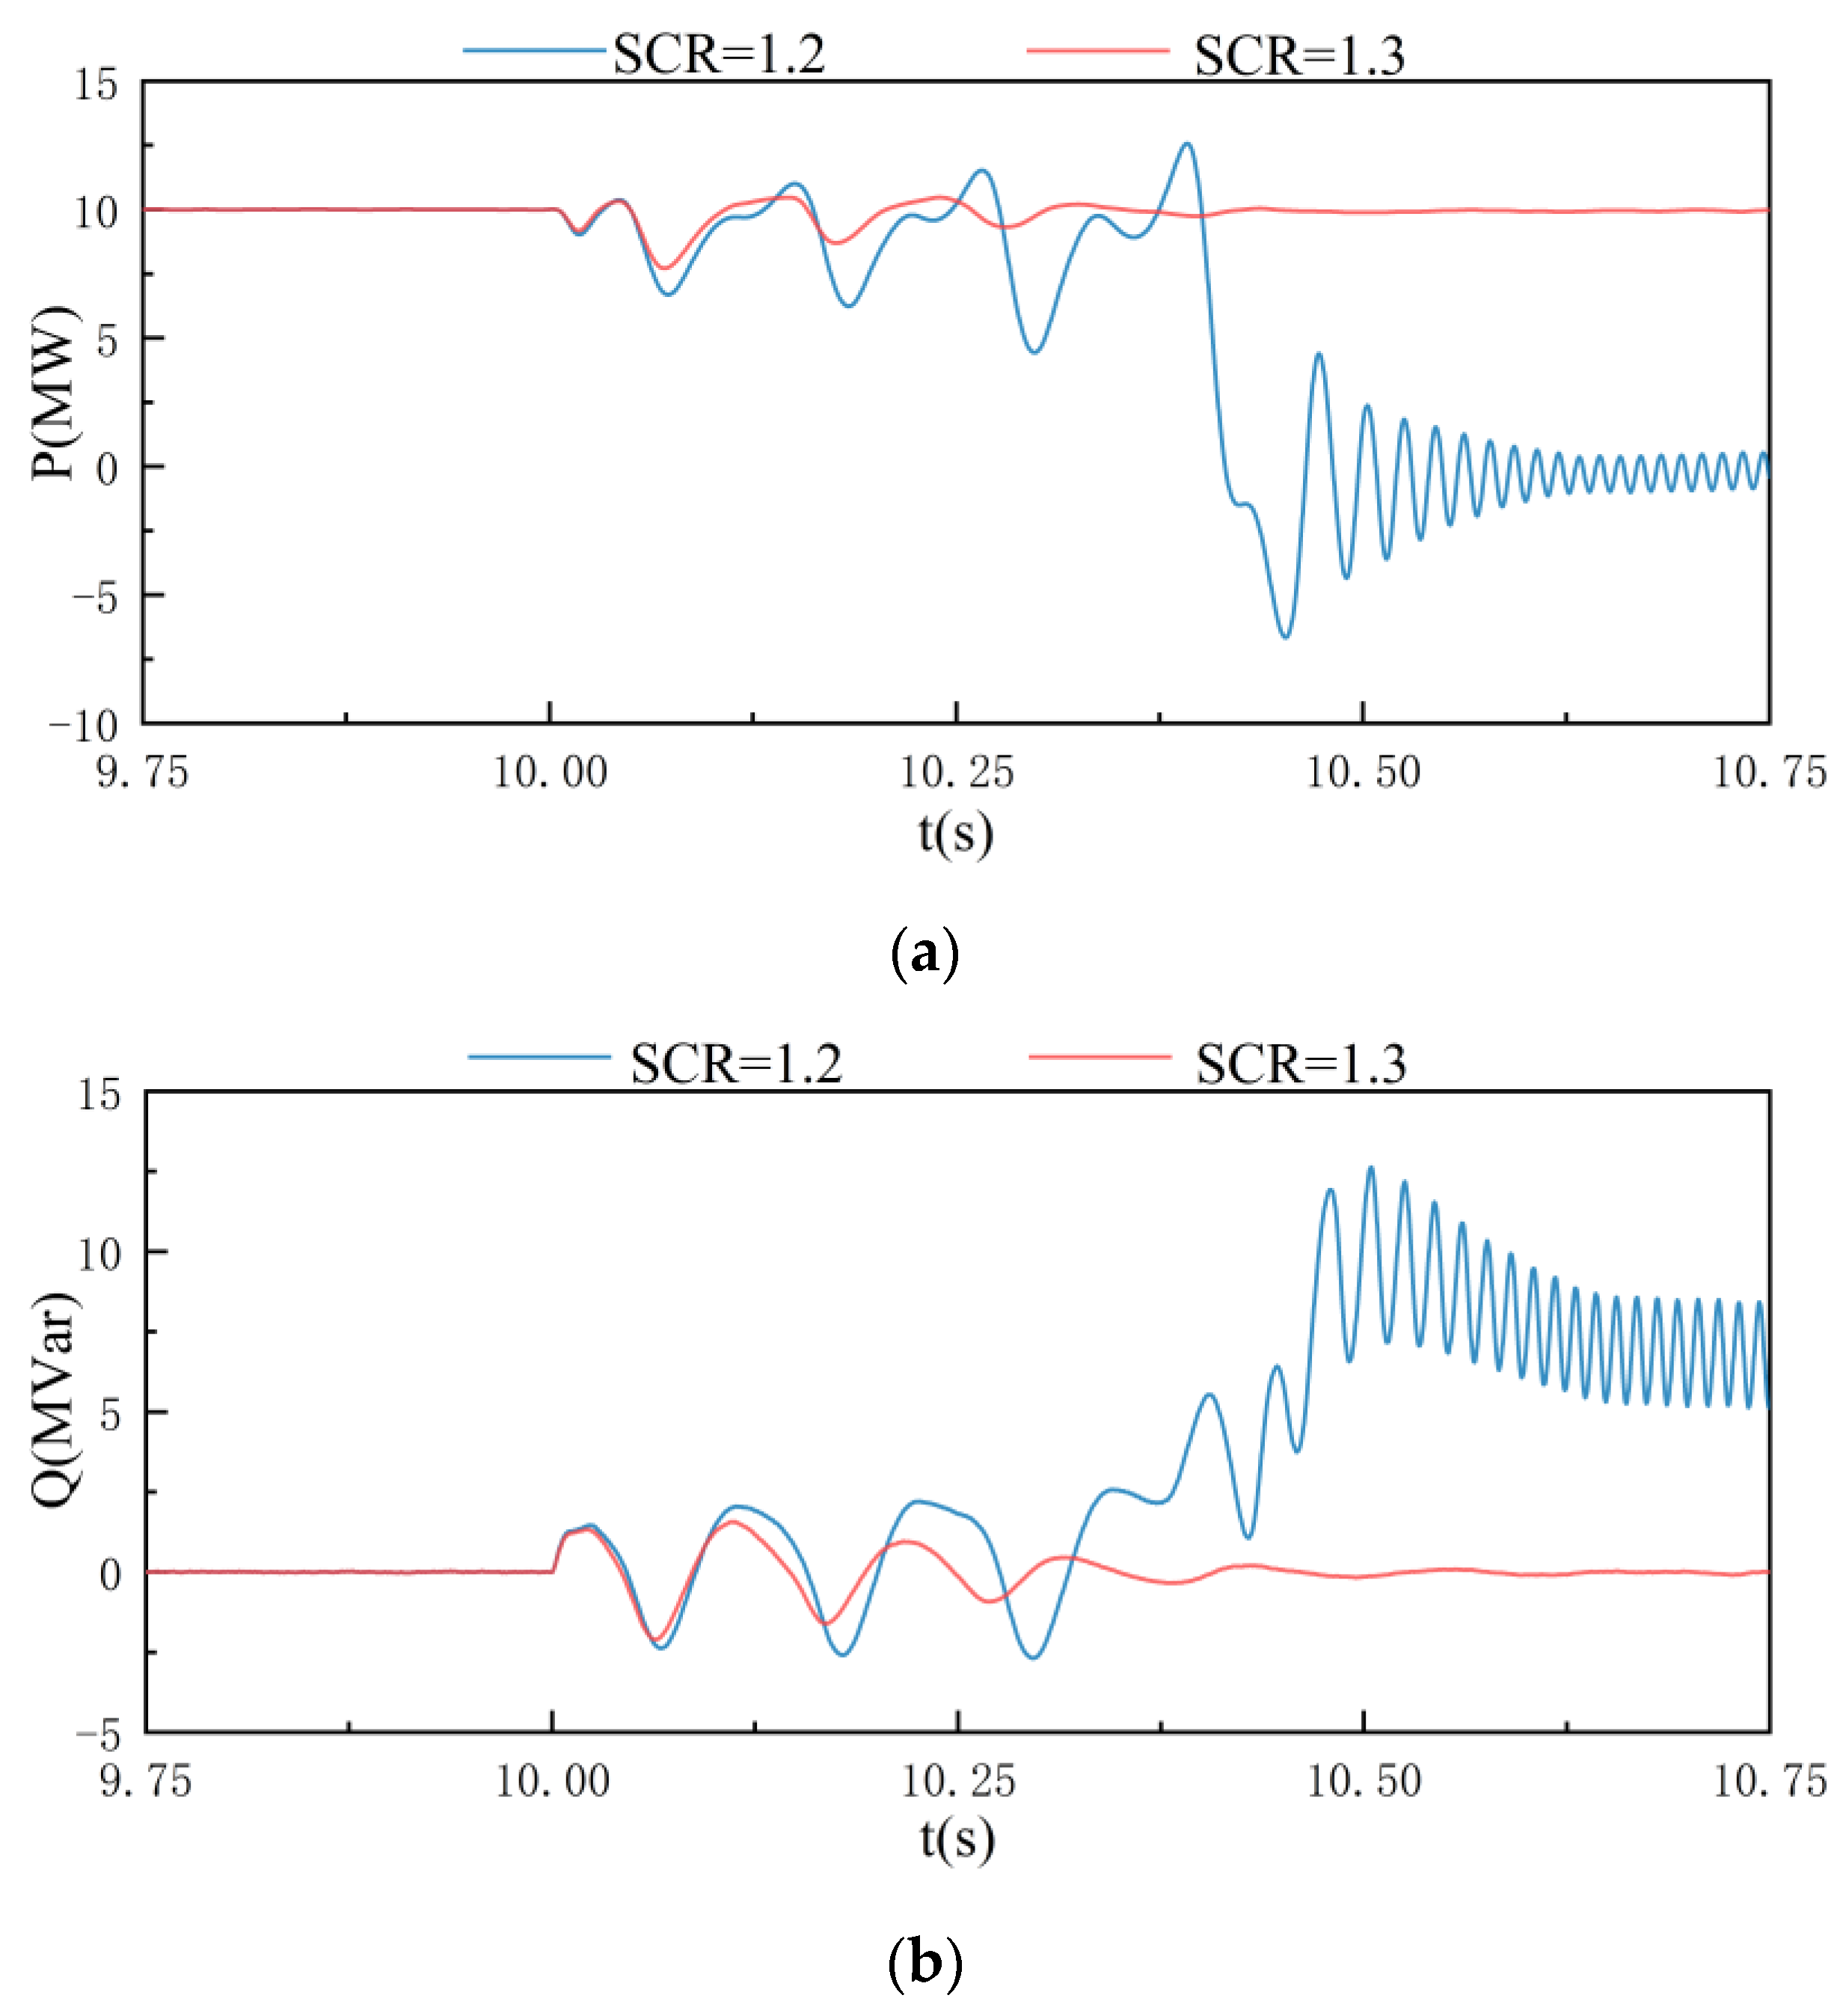
s is 1.9431 Ω, and the converter works at VCC. Change the SCR at 10 s, and the simulation results of the active power and the reactive power of the system are shown in
Figure 10. In the simulation, R
s is changed from 0.3190 Ω to 1.1817 Ω and 1.0711 Ω, respectively, and X
s is changed from 1.9431 Ω to 5.1629 Ω and 4.7500 Ω, respectively, which leads to that the SCR of the modified IEEE 33 bus system is changed from 3 to 1.2 and 1.3, respectively.
It can be seen that when SCR = 1.3, the system can remain stable after a short period of oscillation, and when SCR = 1.2, the system is unstable. Therefore, the CSCR of the system is 1.3 under the above parameter conditions. When the VSC works at VCC, the weak AC system will destroy the symmetrical decoupling characteristics of the d-axis and the q-axis, and will deteriorate the performance of the PLL. As a result, when SCR is lower than 1.3, the system is difficult to operate stably.
In order to improve the reliability of the results, TSAT is used to analyze the waveform of the active power. The power waveform is decoupled into multiple modes with the natural frequency and damping ratio, and the first six modes arranged in descending order of amplitude are shown in
Table 4. It can be seen that when SCR is 1.2, the damping ratios of the reference mode marked blue and the dominant mode marked grey are negative, so the system cannot operate stably. When SCR is 1.3, there is no mode with a negative damping ratio, which means that the system is small-signal stable.
Then, make the system work at PSC, and its initial SCR is 1.2. For low SCR cases, Rs is changed from 1.1817 Ω to 2.6196 Ω and 2.2087 Ω, respectively, and Xs is changed from 5.1629 Ω to 10.5291 Ω and 8.9959 Ω, respectively, which leads to that the SCR of the modified IEEE 33 bus system is changed from 1.2 to 0.6 and 0.7, respectively. For high SCR cases, Rs is changed from 1.1817 Ω to 0.2830 Ω, 0.2513 Ω and 0.1979 Ω, respectively, and Xs is changed from 5.1629 Ω to 1.8090 Ω, 1.6907 Ω and 1.4913 Ω, respectively, which leads to that the SCR of the modified IEEE 33 bus system is changed from 1.2 to 3.2, 3.4 and 3.8, respectively.
The PSC does not rely on the PLL to track the frequency and phase of the grid, so the VSC based on PSC can operate stably when connected to a weak AC system. However, the VSC based on PSC is also unstable under some conditions. When SCR < 0.7, the system is no longer stable, as shown in
Figure 11a,b, and the system is in a critical stable state when SCR is 3.8 as shown in
Figure 11c,d. That is because when SCR is extremely low, the rated operating power of the VSC will exceed its power transmission limit, so it cannot operate stably under a reference power of 10 MW; when connected to a strong AC system, the response adjustment speed will slow down because of the low system damping.
Similarly, use TSAT to analyze the obtained waveform, and the results are shown in
Table 5 and
Table 6. It can be seen that when SCR = 0.7 and SCR = 3.2, the damping ratios of all modes are positive; when SCR is 0.6, the damping ratios of most modes are negative, so the system is unstable; when SCR is 3.8, the damping ratio of the dominant mode marked grey is close to 0, so the waveform is almost in constant amplitude oscillation state.
4.2. Case 2: Small-Signal Stability Analysis
Small-signal stability is static stability, which represents the ability of the system to resume stable operation after a small disturbance. In this paper, the small-signal stability is tested by adding load on the AC side and then cutting off as a small disturbance.
In the built medium voltage MMC model, an AC resistive load of 4 MW is added at 10 s and cut at 10.05 s. In the simulation, when SCR = 1.6, R
s is 0.8222 Ω and X
s is 3.8221 Ω, and when SCR = 2.4, R
s is 0.4627 Ω and X
s is 2.4797 Ω. The simulation results of the active power and reactive power of the system are shown in
Figure 12. As the strength of the AC system weakens, the stability of the system after a small disturbance gradually deteriorates until the system collapses.
The VSC based on PSC is simulated under the same load condition, and when SCR = 0.8, R
s is 1.9006 Ω and X
s is 7.8460 Ω. The results of the active power and frequency of the system are shown in
Figure 13. It can be seen that as SCR increases, it takes longer and longer to return to a stable state after a small disturbance. Therefore, when the SCR of the AC system gradually increases, the small-signal stability of the system shows a decreasing trend.
Figure 12 and
Figure 13 show that the change in the strength of the AC system has a significant impact on the small-signal stability of the system. Comparing the above two figures, it can be concluded that the VSC based on VCC and the VSC based on PSC will show opposite stability characteristics as the SCR changes.
4.3. Case 3: Transient Analysis
Transient stability is also the basis for judging system performance, so the model is still used to analyze the transient characteristics of VSC based on VCC and PSC, respectively, after a three-phase short-circuit fault occurs. In the case of SCR = 2, Rs is set to 0.6065 Ω, and Xs is set to 3.0151 Ω. In the case of SCR = 1, Rs is set to 1.4693 Ω, and Xs is set to 6.2361 Ω.
Figure 14 shows the simulation results of a three-phase short-circuit on the AC side in 10 s when the converter works at VCC under different strengths of the AC system. The fault duration is 0.05 s. When the SCR is high, the active power and reactive power can be quickly restored to a stable state after the fault is removed, and the system has good transient stability. However, when SCR is 1.3, the system cannot ride through the three-phase short-circuit fault on the AC side. Therefore, with the decrease of SCR, the transient stability of VSC based on VCC shows a decreasing trend.
Figure 15 shows the simulation results of a three-phase short-circuit on the AC side in 10 s when the converter works at PSC under different strengths of the AC system. The fault duration is 0.05 s. Contrary to VCC, the system has good transient stability when the SCR is low. When the SCR increases, the time required for the active power and frequency to return to a stable state becomes longer, and the amplitude of the transient oscillation becomes larger.
The strength of the AC system also has a significant impact on the transient stability of the system, as shown in
Figure 14 and
Figure 15. Similar to the characteristics of the small-signal stability, when SCR increases, the transient stability of the VSC based on VCC increases. On the contrary, the transient stability of the VSC based on PSC decreases. Therefore, the VCC is more suitable for strong AC systems, while the PSC has better performance when connected to weak AC systems. In addition, according to the comparison of SCR = 2 in
Figure 14 and
Figure 15, the response speed of VSC based on PSC is slower than that of VSC based on VCC.
5. Conclusions
In order to adapt to the requirements of power grid operation under different working conditions and achieve the power symmetry of the system under SCR changes, this paper proposes and compares the operation zones of VSC based on two recently available control strategies, respectively, namely VCC and PSC, through the simulation analysis of CSCR, and studies the influence of strength of an AC system on the small-signal stability and transient stability of the system under above control modes. The simulation results show that:
Under the system parameters in this paper, the CSCR of the VSC based on VCC is 1.3. That is to say, the performance criterion for stable operation of the VSC based on VCC is SCR = 1.3. For VSC based on PSC, when SCR < 0.6, the system cannot operate stably because the power exceeds its limit, and the system is already in a critical stable state when SCR is 3.8, and the power and frequency are in constant amplitude oscillation.
Whether it is small-signal stability or transient stability, as the SCR of the AC system decreases within a certain range, the VSC based on VCC gradually works into the unstable conditions, while the stability of VSC based on PSC gradually improves.
The conclusions of this paper can be applied to the changes in the operating conditions of the AC system to provide a theoretical reference for the selection of converter control strategies and the stable operation of the system. However, the operation zones proposed in this paper also have some limitations. Firstly, the DC side of the converter uses a DC power supply, which results in that the system’s DC voltage is maintained at a stable 20 kV. Therefore, this paper does not consider the situation that the VSC adopts constant DC voltage control. In addition, this paper ignores the influence of time delay, which has an important impact on converter control and system stability.
In future work, the control strategy of the grid-connected converter and system stability of the renewable energy under the changing operating conditions of the AC system will be studied, and the influence of the time delay on the converter control will be considered in our further research.


