Article

Modeling Test and Numerical Simulation of Vertical Bearing Performance for Rigid-Flexible Composite Pouch Piles with Expanded Bottom (RFCPPEB)

1
Deportment of Civil Engineering, Zhejiang University City College, Hangzhou 310015, China
2
School of Civil Engineering & Architecture, Anhui University Science & Technology, Huainan 232001, China
3
School of Civil Engineering, Zhejiang University of Technology, Hangzhou 310014, China
4
Henan Province Highway Engineering Bureau Group Co., Ltd., Zhengzhou 450052, China
*
Author to whom correspondence should be addressed.
Symmetry 2022, 14(1), 107; https://doi.org/10.3390/sym14010107
Submission received: 8 December 2021 / Revised: 27 December 2021 / Accepted: 6 January 2022 / Published: 8 January 2022
(This article belongs to the Section Computer)

Abstract

:
Rigid-flexible composite pouch piles with expanded bottom (RFCPPEB) are generally considered as new symmetrical piles in practical engineering, but their bearing characteristics and design method are still not completely understood. The objective of this study is to investigate the vertical bearing performance and the optimal design scheme of RFCPPEB. Hence, laboratory modeling tests for this symmetric structure and an ABAQUS three-dimensional (3D) numerical simulation analysis were used to study the vertical bearing characteristics on bottom-expanded piles and rigid-flexible composite piles with expanded bottom. The vertical bearing capacity, shaft resistance, pile tip resistance distribution rule, and load sharing ratio of RFCPPEB were analyzed and verified using different bottom expansion dimensions and cemented soil thicknesses. The results revealed that the optimal bottom expansion ratio of rigid bottom-expanded piles was 1.8 when the ratio of pile body to bottom-expanded pile head was 9:1. When the bottom expansion ratio (D/d) was increased, the bearing capacity of bottom-expanded piles was significantly increased at D/d = 1.4 and D/d = 1.8 compared to that of D/d = 1.0, reaching 1.67 and 2.29 times, respectively, while for D/d = 1.6 and D/d = 2.0, the ultimate bearing capacity remained unchanged. Besides, shaft resistance played an important role in the bearing process of the rigid bottom-expanded piles and RFCPPEB. When the shaft resistance was increased, the ultimate bearing capacity of the pile foundation was significantly improved. The shaft resistance of RFCPPEB was increased with increasing cemented soil thickness. The increases in the shaft resistance and thickness of the cemented soil showed a nonlinear growth, and the maximum shaft resistance was approximately 75 cm from the pile top. When the diameter of the expanded head was 1.8 times the diameter of the pipe pile and slightly larger than the thickness of the cemented soil (0.5 times the diameter of the pipe pile), the optimal amount of concrete 425.5 kN/m3 required for per unit volume around piles was obtained, with the RFCPPEB ultimate bearing capacity of 7.5 kN. For RFCPPEB, the soil pressure at the pile tip was directly proportional to the pile top load under small load and was decreased in the form of a half quadric curve under large load. It reached the most reasonable position where the slope of the quadric curve was the largest when the thickness of the cemented soil was larger than 0.5 times the diameter of the pipe pile.

1. Introduction

Pile foundations are the most widely used types of foundations in geotechnical engineering. The bearing capacity provided by conventional pile foundations has failed to meet the existing engineering requirements due to the continuous development in traffic and construction engineering around the world. There are many special shape-derived piles, such as X-section-in-place concrete (XCC) piles [1,2,3], Y-shaped piles [4,5,6], instrumented winged piles [7], static drill rooted nodular piles [8,9,10,11], and pre-bored grouted planted (PGPN) piles [12,13]. The shaft or tip resistance of a single pile with a special shape can be increased due to the changes in the shape of the pile body that enlarges the contact area between the pile and the soil or by virtue of an expanded head at the bottom of conventional piles in order to increase the bearing capacity of the pile body. The high usage of special shape piles enabled scholars to observe the limited effect they provide in improving the bearing capacity of a single pile for soft foundations by only changing the shape of the pile body to increase the contact area between the pile and soil. To tackle this problem, both rigid and flexible piles were combined to form rigid-flexible composite piles [14,15,16]. In addition, the use of flexible piles changes the shear strength parameters of soil around the pile (cohesion, c, and internal friction angle, ϕ) and the characteristics of the contact area between pile and soil, thus resulting in an increase in the bearing performance of the composite foundations. A study was performed by Liu et al. [17] to examine the bearing characteristics of a rigid-flexible pile composite foundation with geogrid reinforced cushion (RFPCFGRC). The results indicated that RFPCFGRC could effectively transfer loads to the foundation and reduce the load sharing ratio of the rigid piles when compared with geogrid-reinforced pile-supported embankments. In addition, Wang et al. [18] investigated the mechanical properties of embankments using coaxial rigid-flexible compound (CRFC) piles by conducting field tests. The results showed that the lateral displacement and total settlement within the founded soil reinforced by CRFC piles were smaller than those encountered for foundations treated by cement mixing piles. Meanwhile, jet grouting soil-cement-pile strengthened piles (JPP) [19,20] are described as rigid-flexible composite piles formed by high-pressure jet grouting cement soil piles and prestressed concrete piles. The upper load is carried by the inner core of a prestressed concrete pile, and the load is transferred to the cemented soil around the pile during the downward transformation, which is transferred to the soil around the pile by the cemented soil, thus forming a dual transfer mode. Ren et al. [21] examined the uplift bearing characteristics of JPP piles when the cemented soil around the pile was located in different positions from the precast pipe of the pile body. The authors used model tests in their investigation, and the results revealed that shaft resistance could be fully used. Besides, the uplift bearing capacity can be improved when the cemented soil and precast pipe pile are set at the middle and lower parts of the pile body, respectively.
Pouch grouting refers to the technology where a pouch is placed at a designated position and solidified slurry is injected into the pouch. The pouch will automatically be expanded during this process, thereby filling the surrounding spaces and forming a fixed shape after grouting. The injected slurry is guaranteed to not spill into the surrounding soil, which can cause environmental pollution. Pouch grouting is mainly used in sealing pipes [22,23], filling cracks [24,25], and reinforcing foundations [26,27]. It is also used in new structures, such as pouch grouting soil nails, pouch grouting bolts, and pouch grouting piles, that are widely used in the field of practical engineering. Li et al. [28] used model tests to study the compaction effect of bag grouting piles. The outcome of the study showed that the range of horizontal displacement during pile formation and bag grouting pile compaction was about six times the diameter of the pile. The study was mainly focused on the specific form of pile and pouch grouting technology. Hence, further studies are needed for investigating different forms of pile and pouch grouting combination technologies. Based on JPP piles, the prestressed pipe piles serve as rigid piles, and the expanded heads are formed through grouting and expansion in pouches preset at the bottom part of the pile. Then, the prestressed pipe piles are organically combined with field grouting to develop RFCPPEB. As a new pile form, RFCPPEB have been used in engineering construction, but most scholars still consider its surplus bearing capacity as a safety reserve. This may cause overplus bearing capacity, construction cost burden, and other related problems. At present, there are only a few studies on RFCPPEB and its corresponding bearing characteristics; load transfer mechanism and design methods are not yet specified. Therefore, in this study, model tests and a three-dimensional (3D) numerical simulation were used to systematically explore the load transfer mechanism of RFCPPEB. Laboratory model tests were first performed to determine the vertical bearing characteristics of the rigid bottom-expanded piles when the length ratio of pile body to expanded head at the pile bottom was 9:1. Secondly, the vertical bearing characteristics of RFCPPEB at different cemented soil thicknesses were studied when the rigid bottom-expanded piles with D/d = 1.8 were selected according to the results obtained from the laboratory tests. Following this, the ABAQUS finite element model was developed based on the laboratory tests to examine the optimal thickness range of the cemented soil around the RFCPPEB.

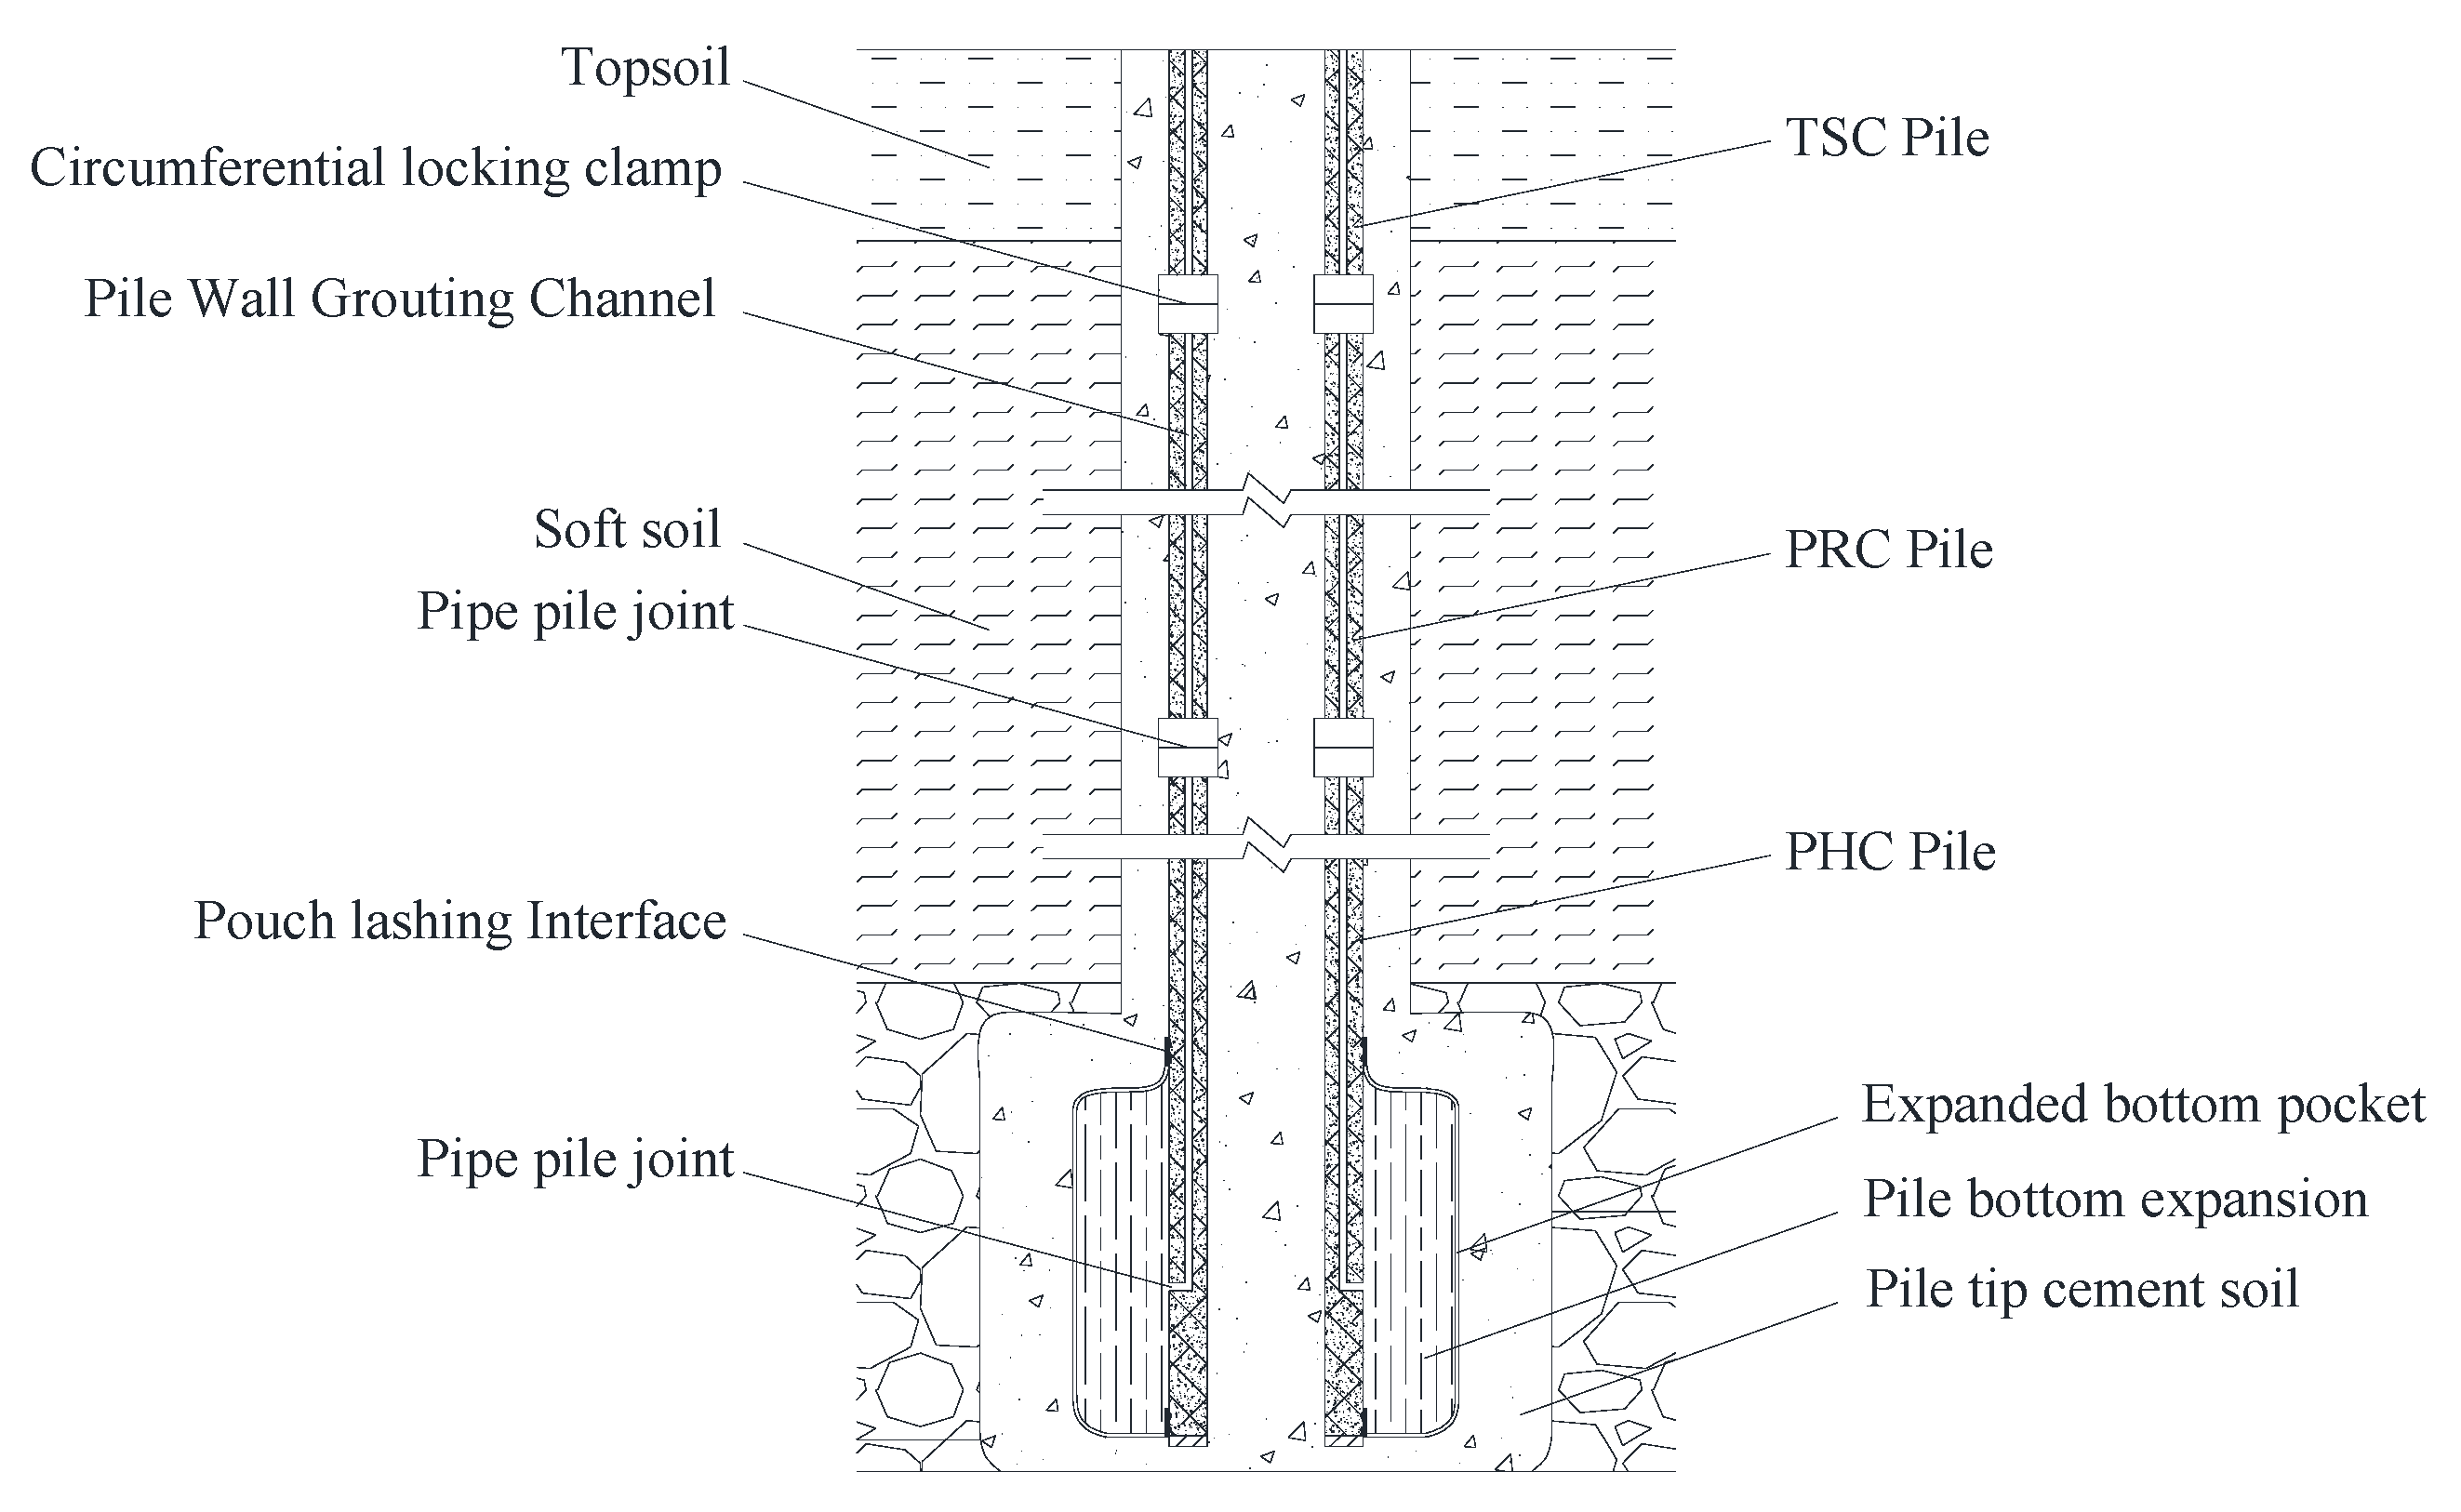
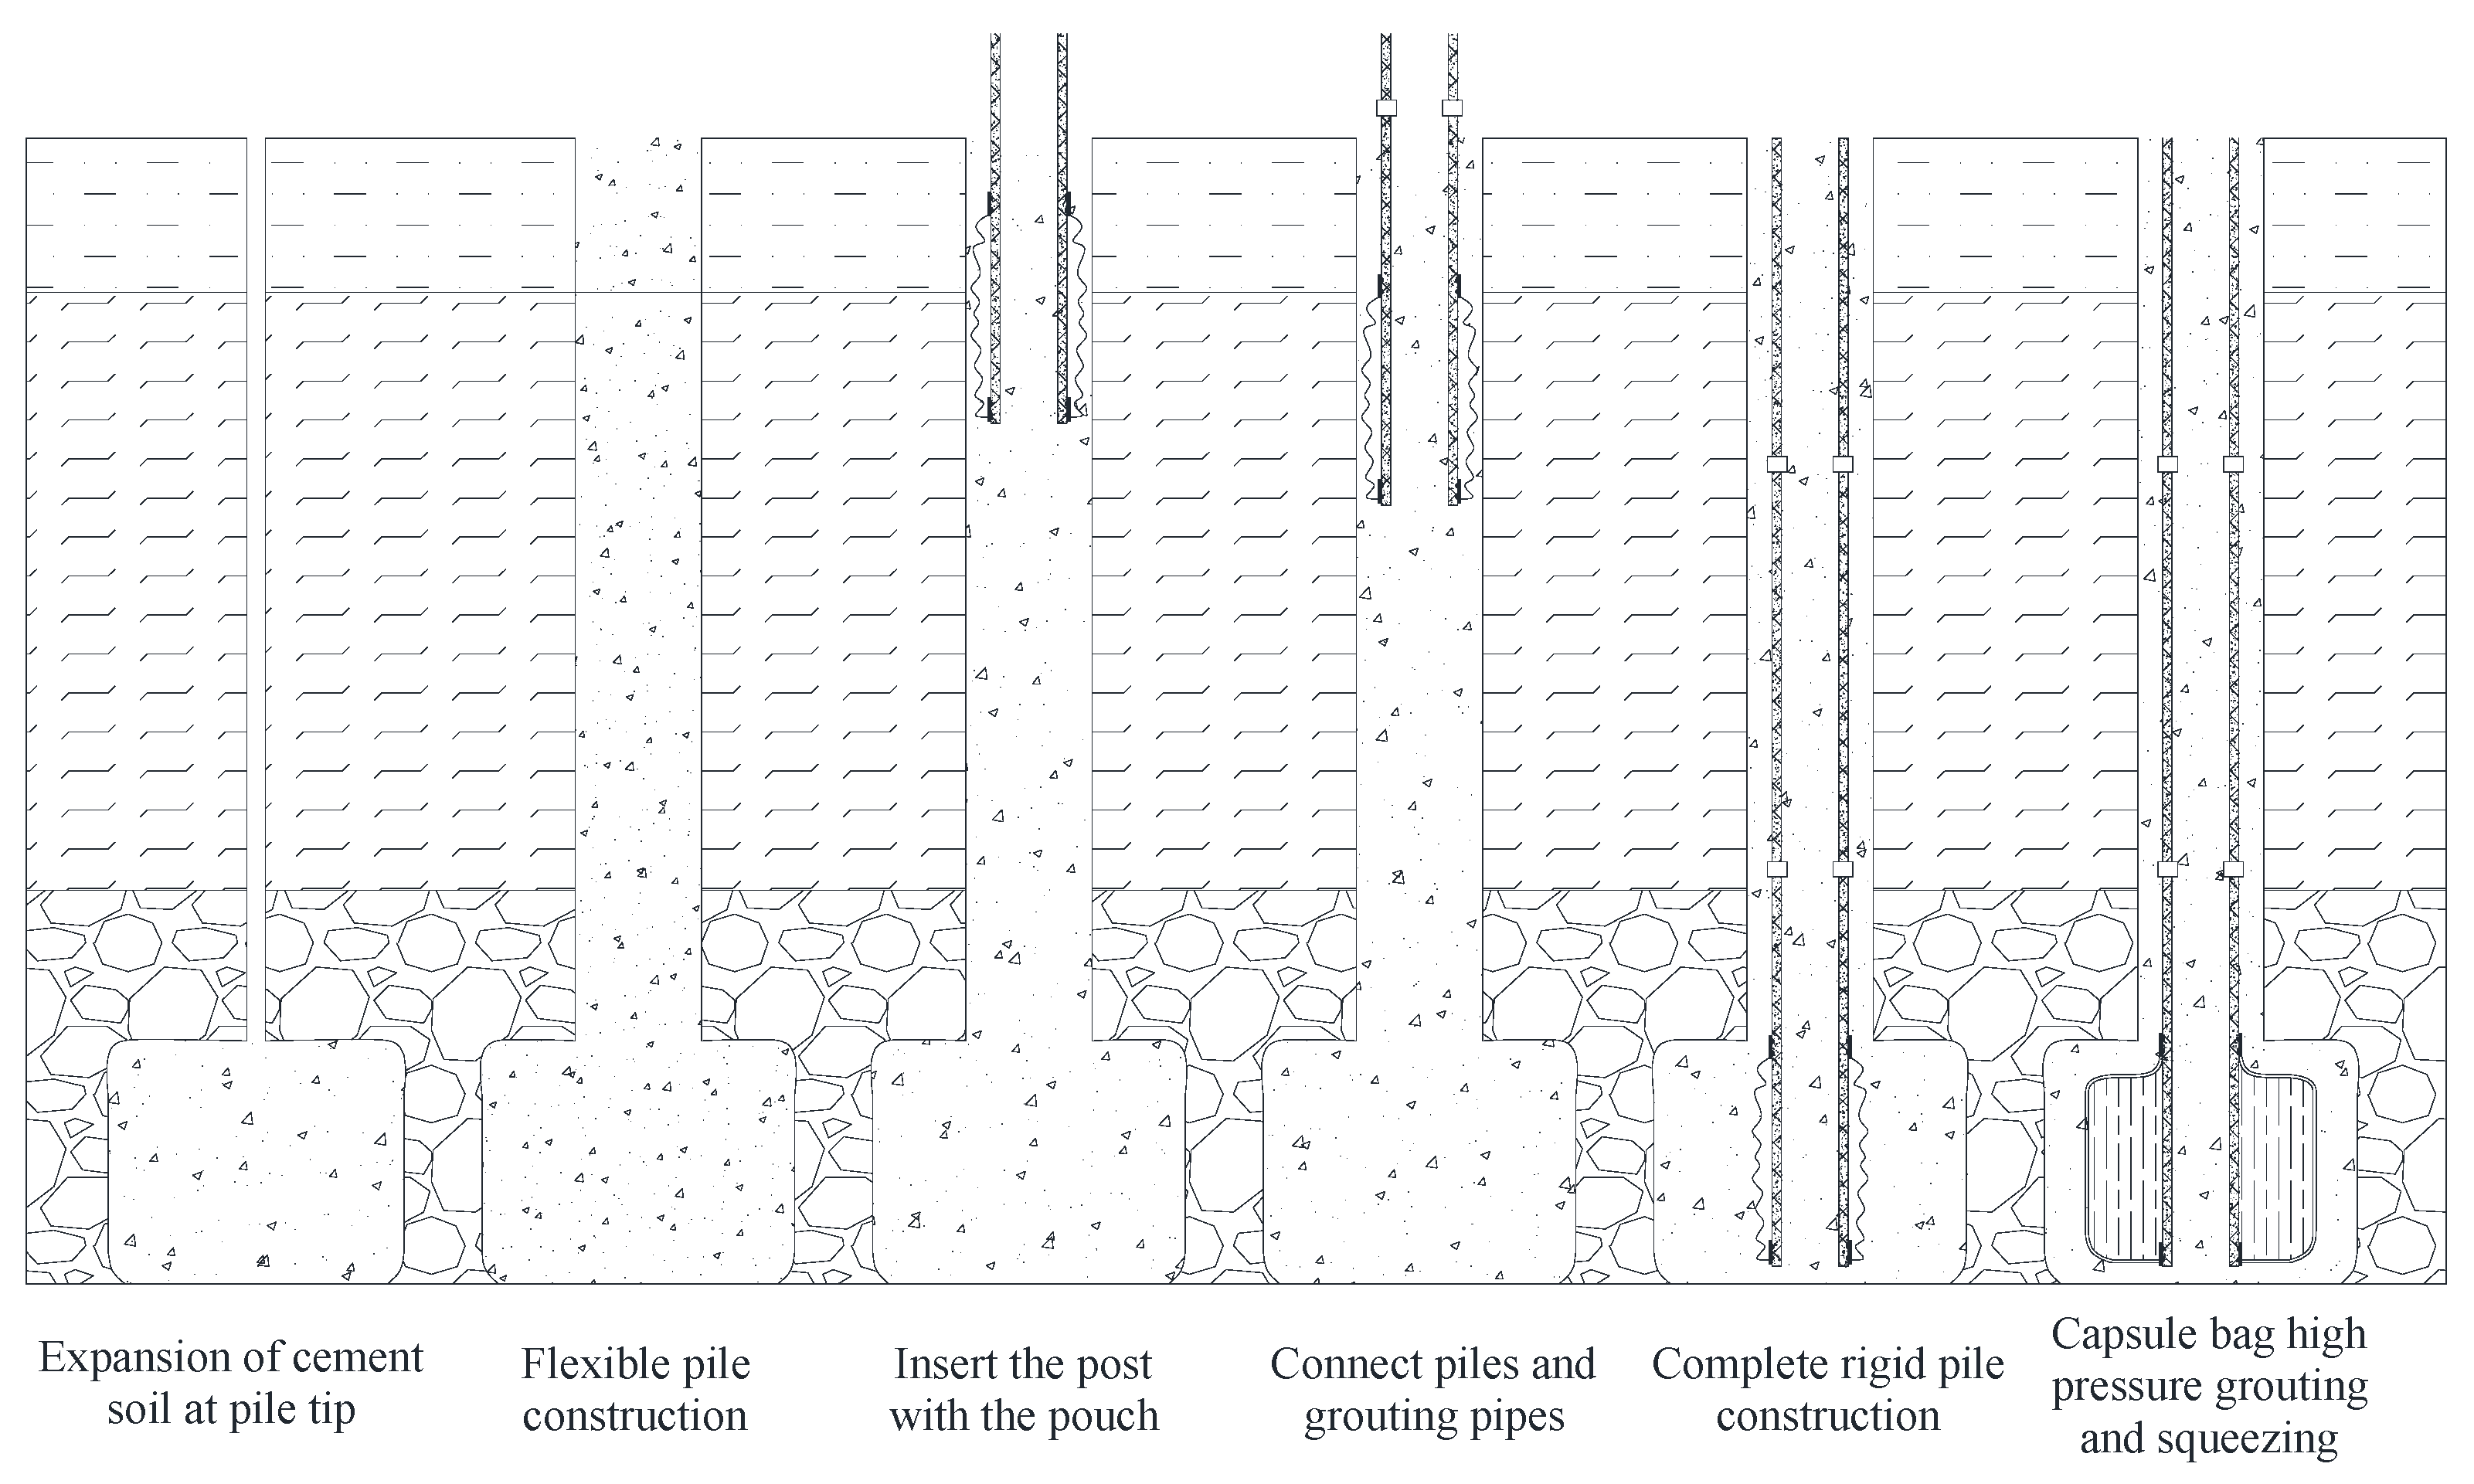
2. Technology of RFCPPEB

RFCPPEB are the rigid-flexible composite piles equipped with prestressed pipe piles (rigid piles) that are placed in the center and high-pressure jet grouting piles (rigid bottom-expanded piles) and flexible piles. During the construction processes, high-pressure jet grouting is injected first to form the expanded pile bottom. Then, the cemented soil around the pile is formed by elevating the constant jet grouting after reducing the jet pressure. Next, the prestressed high-strength concrete (PHC) pipe piles connected with the expanded bottom pouch are placed into the cemented soil by hoisting. Pile splicing is conducted after the PHC piles are lowered to a certain depth. After that, the pile bodies are temporarily fixed, and the corresponding grouting pipes are inserted into the grouting channels of the pile walls. The telescopic pipes are pressed down and adjusted to make the newly inserted grouting pipes into the grouting pipe joints. The prestressed pipe piles with mixed reinforcement (PRC piles) and precast high-strength concrete thin-walled steel pipe piles (TSC piles) are successively lowered by hoisting. After the pouch grouting, compaction, and expansion, the pipe bodies are continuously fixed until the cemented soil strength reaches 80% of the design strength. This is to ensure a high construction quality of RFCPPEB. Figure 1 shows the structure and a detailed description of RFCPPEB, and Figure 2 shows different phases of RFCPPEB construction.
RFCPPEB are still under assessment due to the presence of crucial scientific and technical problems during their construction, design, detection, and application processes. The optimal design scheme for RFCPPEB needs to be studied, especially the optimal diameter expansion ratio and the optimal thickness of cemented soil around the pile.

3. Design Procedures for Laboratory Tests

3.1. Testing Materials

Sand was selected as the soil to be placed around the pile, and clay with 0.5 m thickness was selected for the bearing layer at the bottom of pile during the modeling test. The soil was filled and compacted in several layers with the thickness of 0.1 m each. Sieve analysis was performed to measure the particle size of the sand and to plot the particle size distribution curve. Figure 3 shows the particle size distribution of the sand used in this study. After calculation, the uniformity coefficient, Cu = 1.87, and the curvature coefficient, Cc = 4.087, revealed that the used sand was classified as fine sand. The sand was obtained from the Qiantang River in Hangzhou, while the clay soil was collected from an engineering site in Shaoxing. The basic physical and mechanical properties of the soil samples used for testing are shown in Table 1.

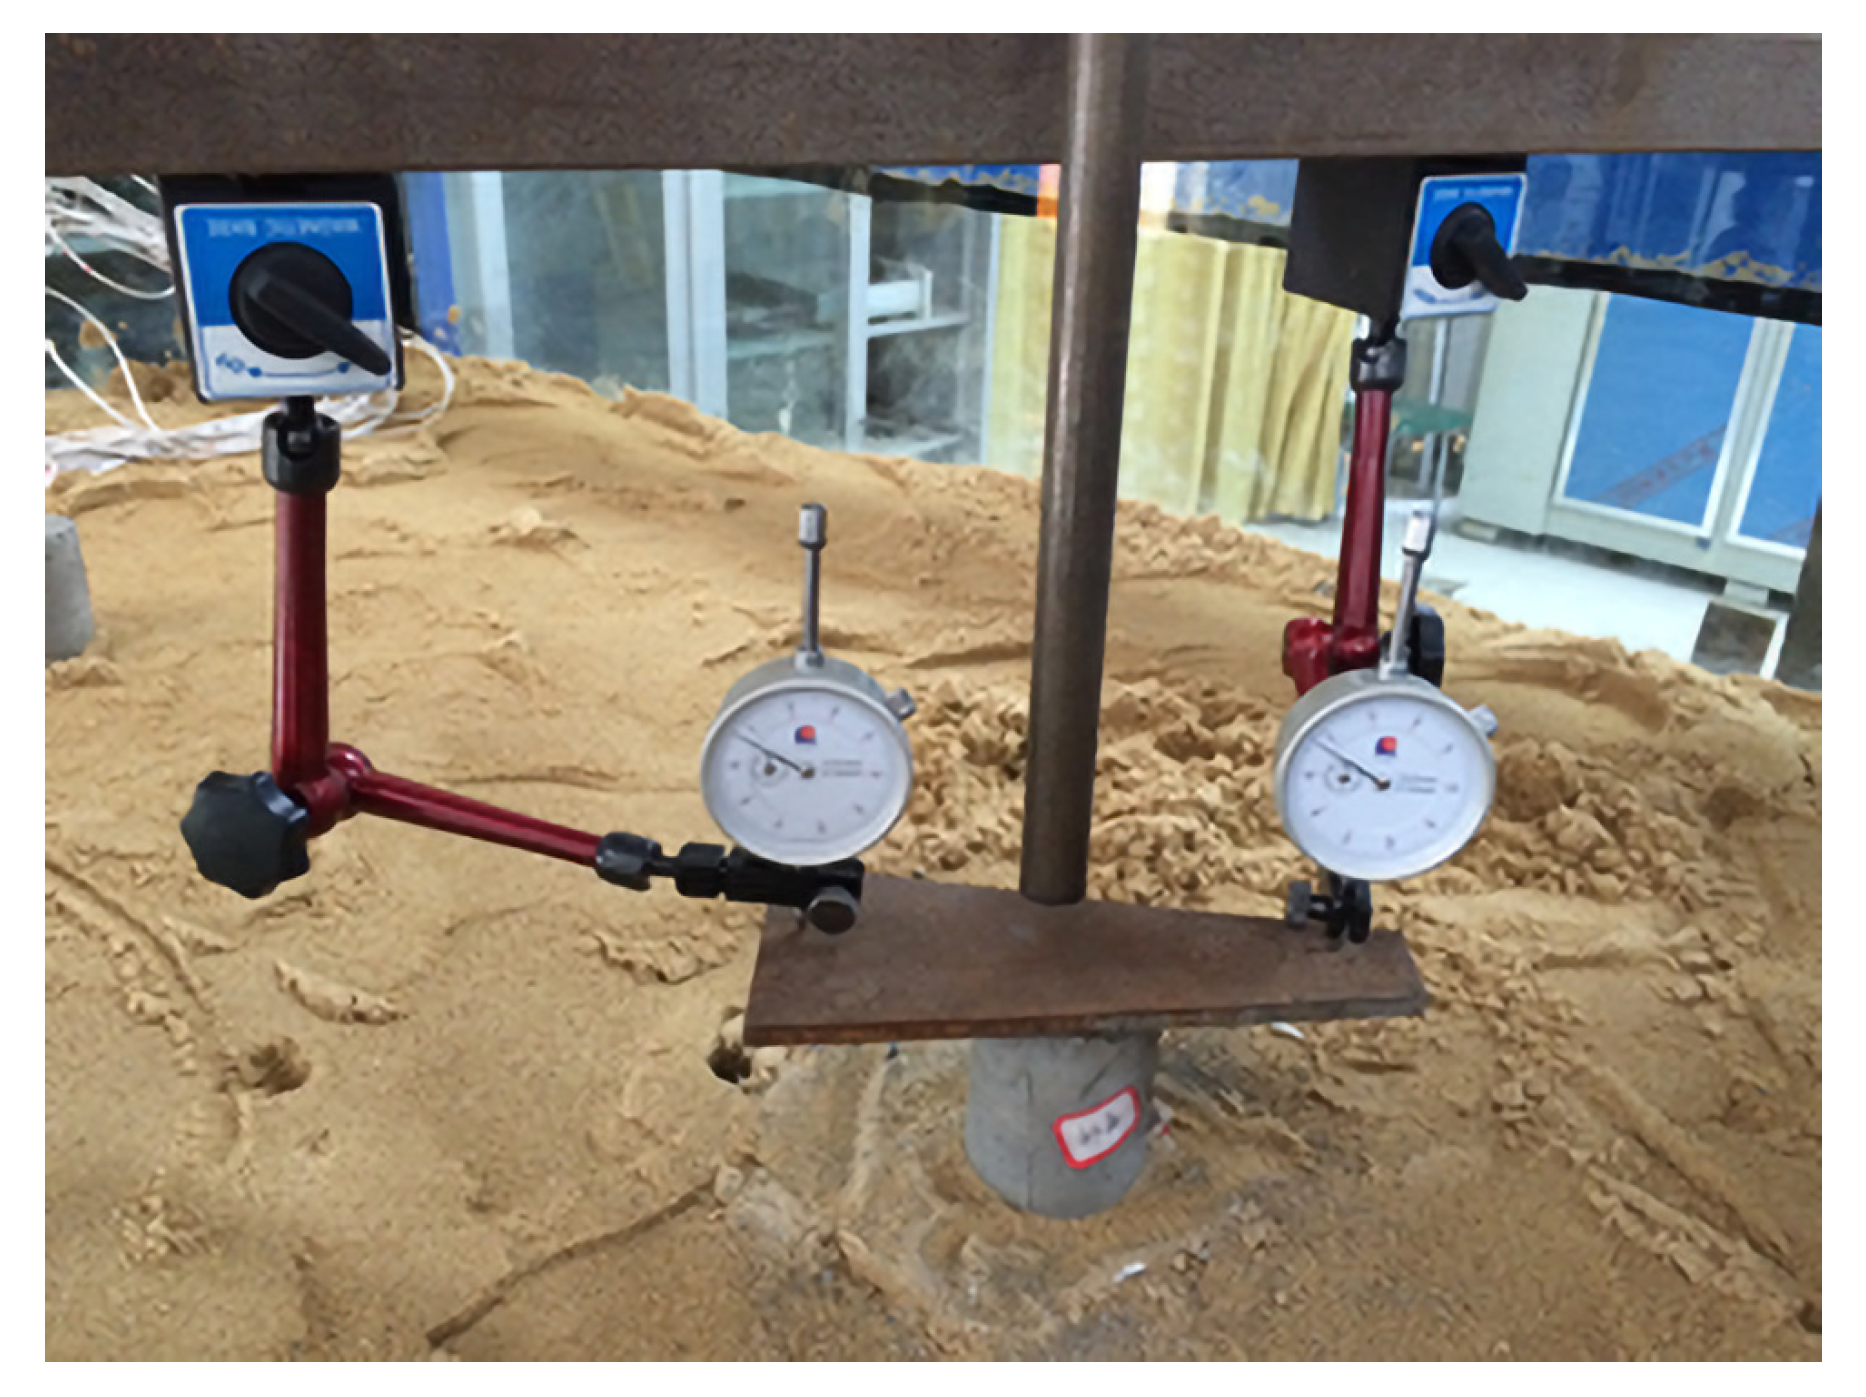
3.2. Modeling Box and Loading Device

The modeling box used in this study had a dimension of 1.5 m × 1.0 m × 1.5 m, which was loaded pursuant to the lever principle (Figure 4). The column of the loading system was joined by the upper and lower round steel openings whose lower section was fixed to the base, while the upper one was designed to be able to rotate freely and to be fixed at any position. The lever consisted of two sections at which the pressure was provided by adding more weight to the long arm section while the tension was provided by adding more weight to the short arm section. Moreover, the hoop on the lever was designed to move freely along the length of the lever and to be fixed at any required position. The model slot could be loaded at any position because of the movement feature provided by the round steel rotation and the hoop. The loading device together with its components is revealed in Figure 4.

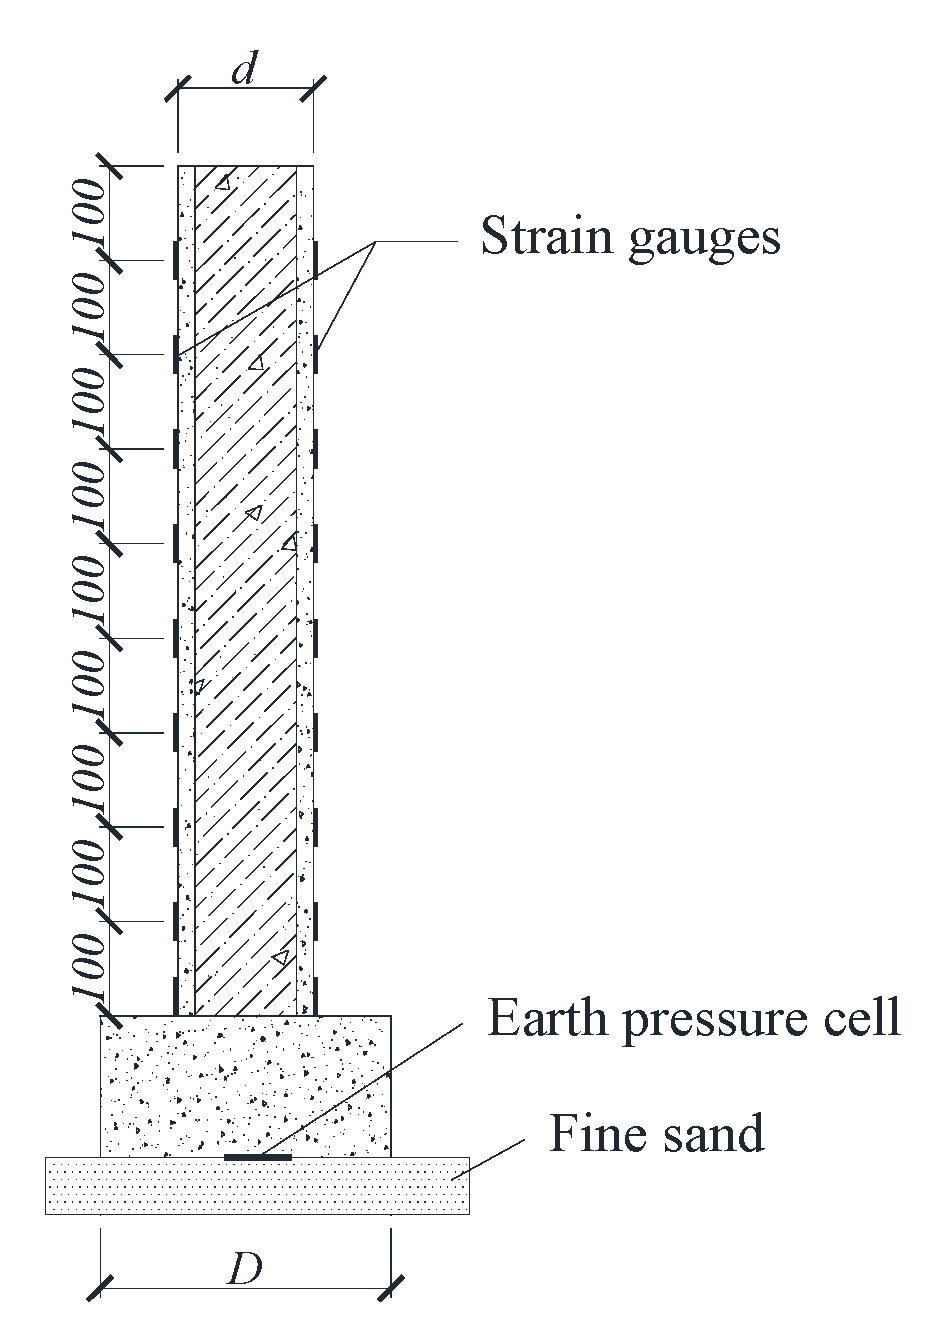
3.3. Model Pile Manufacturing and Measuring Points

Based on the dimensions of the most commonly used RFCPPEB in practical engineering applications, a prototype for the rigid composite pouch expanded bottom pile was simulated in this model test. The actual pile diameter was 600 mm, wall thickness was 110 mm, pile length was 10 m, the bottom expansion diameter was 1000 mm, and the thickness of cemented soil around the pile was 30 cm. The geometrical similarity ratio of the pile foundation was first determined as per the similarity theorem. The similarity ratio was found to have the value of 10 on the grounds of the indoor model slot size, manufacturing specifications of model test equipment, accuracy of data measurement, collection system, etc. The other physical quantities were determined according to the similarity constant.
The tested pile types included pipe, bottom-expanded and RFCPPEB piles at which the total pile length, l, was 1.0 m, the diameter of the straight pile section, d, was 60 mm, the length of the expanded bottom section, l1, was 0.1 m, and the diameter of the expanded head was D. To explore the effect of the expanded bottom size, D/d was set at 1.0 (pipe pile), 1.4, 1.6, 1.8, and 2.0 and numbered as C1, C1.4, C1.6, C1.8, and C2.0, respectively. The optimal bottom expansion ratio D/d was determined according to results of the tests for rigid bottom-expanded piles. Then, the effect of different thicknesses of the cemented soil on the bearing characteristics of a single pile was studied on this basis. The cemented soil thickness, h, was taken as 5, 10, 20, 30, and 40 mm and numbered as P5, P10, P20, P30, and P40, respectively. The reinforcement cages used for model piles are shown in Figure 5. The modeling piles are shown in Figure 6 and Figure 7. The specific design parameters of the modeling piles used in the modeling test are revealed in Table 2.
PVC pipes of 63 mm were used as pile molds of the straight pile section. The 0.5 mm thick aluminum film templates were used as the external molds at the bottom expansion end, while aluminum flakes were utilized as templates for the cemented soil. The reinforcement cage was made of 4 Φ2 main reinforcing bars and was firmly bounded with fine wires. The concrete was made from P42.5 cement with a mix proportion of cement:water:sand:stone equals to 1:0.53:1.79:3, respectively. After the concrete was poured, standard cubic samples were developed based on the specifications. A total of 15% P32.5 cement (water to cement ratio = 1.5) was added around the formed rigid bottom-expanded piles to develop the composite bottom-expanded piles.
For the measurement of the strain during testing, several points were set on the pile body. There was a total of 9 measuring points with a 0.1 m interval between each of the two points, and the first measuring point was set at 0.1 m from the top of pile. Strain gauges were vertically attached to the concrete surface and symmetrically arranged along the diameter. Besides, an earth pressure cell was set at the bottom of the pile, and a static strain indicator was used to measure the strain of the pile body and pile tip stress. Figure 7 shows the layout and arrangement of the strain gauges.

3.4. Methods Used during Testing

Modeling piles were placed in the middle of the modeling box as demonstrated in Figure 8. The modeling piles were buried in the form of non-compaction piles. The specific operation methods started by compacting the bottom clay, and the modeling pile was located to fix the pile body. The strain gauges around the pile were connected to the static resistance strain indicator, and the fine sand was filled and compacted until approaching the top of the pile in layers. Then, two dial indicators were placed symmetrically at the top of the pile to measure the displacement, and a pressure sensor was also placed to measure the pressure at the top of the pile. Next, loading of the model was carried out step-by-step according to 1/10 of the ultimate compression bearing capacity as specified in the JGJ 106-2014 standard [29]. After loading in each step, if the settlement at the top of the pile within a 10 min period of time was less than 0.1 mm, the settlement was considered stable and the loading in the next step would be carried out until the failure conditions were observed.

4. Results and Discussion

4.1. Results of Modeling Test for Rigid Bottom-Expanded Piles

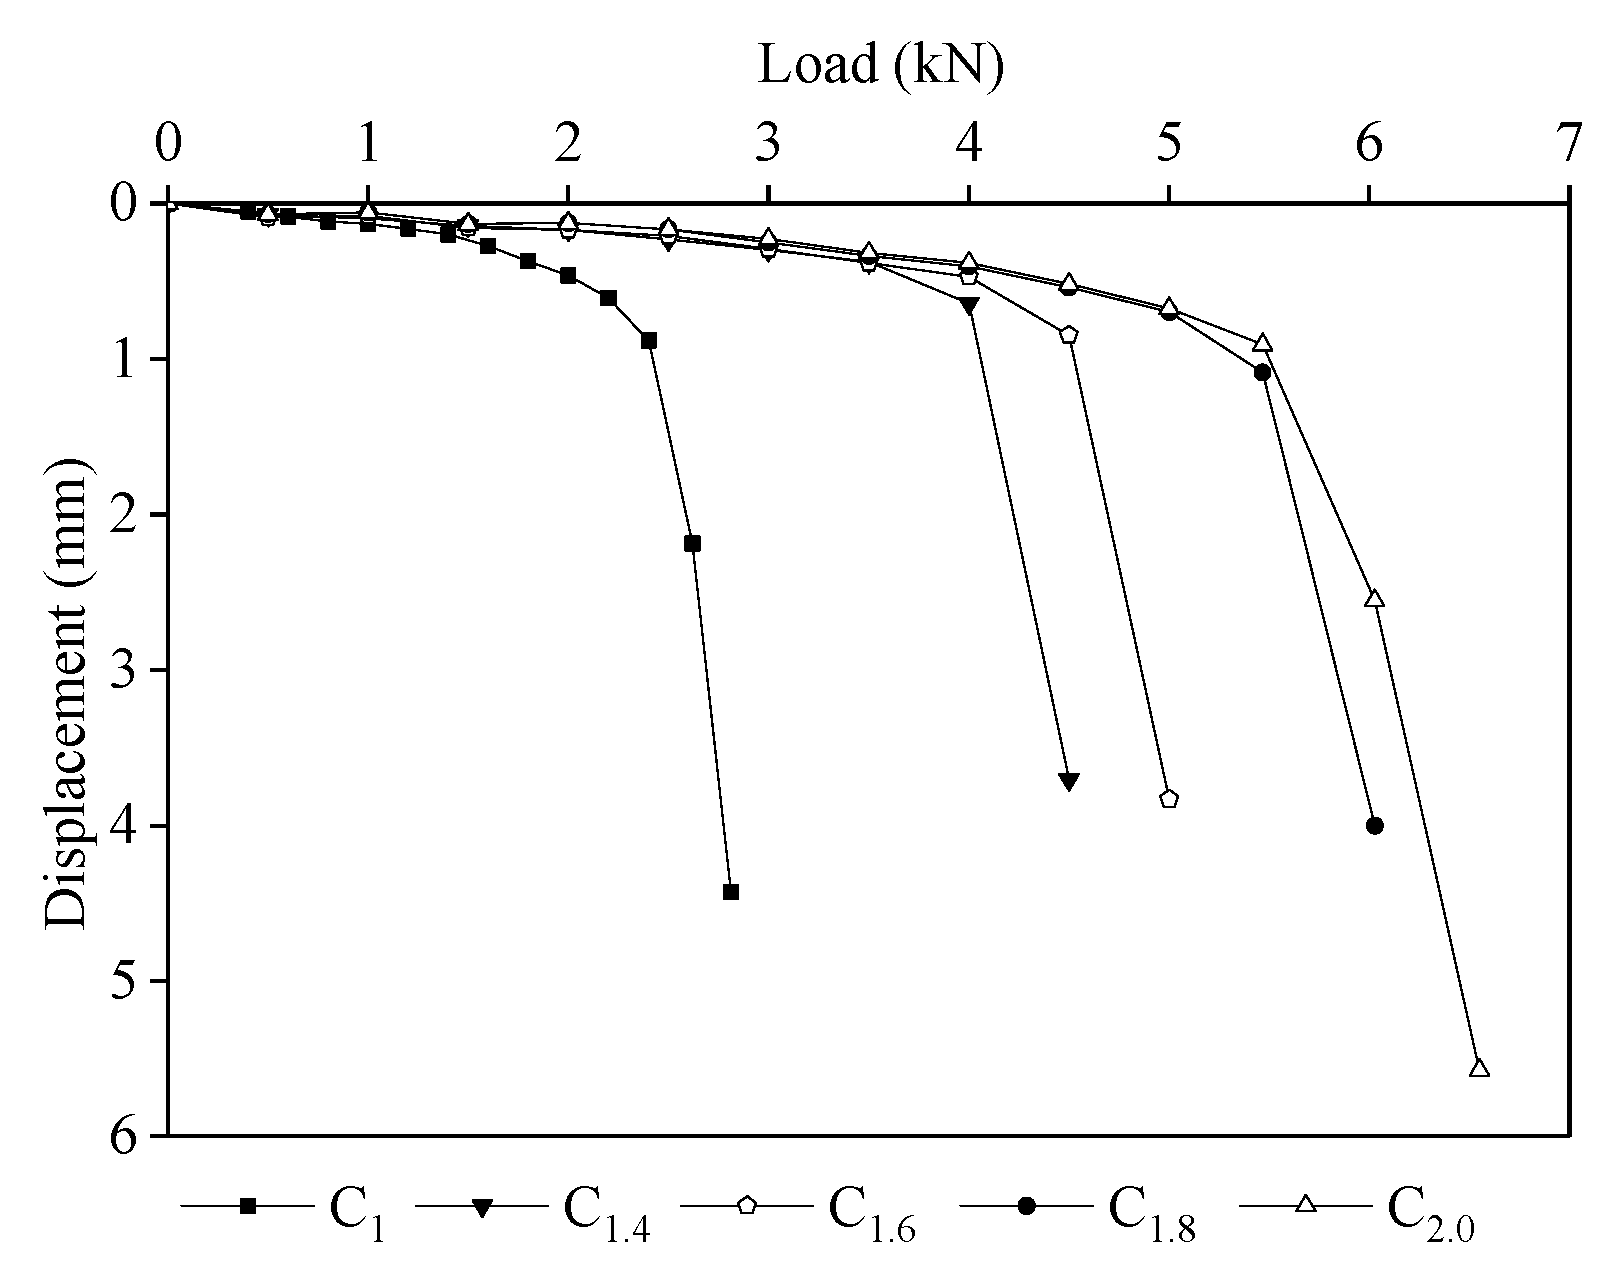
4.1.1. Load and Settlement Relationship

The load and settlement relationships of the five tested piles are shown in Figure 9. The results showed a sharp drop type for all the tested piles. When the load of the point prior to the point of drop was taken as the ultimate bearing capacity of a single pile as per the specification [26], the ultimate bearing capacities of C1, C1.4, C1.6, C1.8, and C2.0 piles were 2.4, 4.0, 4.0, 5.5, and 5.7 kN, respectively. The settlement of rigid bottom-expanded piles under the same load was, in all cases, lower than that of pipe piles in the early loading steps. The resistance in the tips of pipe piles was much smaller than that encountered for the bottom-expanded piles in the later loading steps, resulting in rapid settlement for pipe piles. Moreover, the ultimate bearing capacity of rigid bottom-expanded piles was further increased with the increased diameter of bottom-expanded piles.
Table 3 depicts the ultimate bearing capacities of rigid bottom-expanded piles with different bottom expansion diameters. The results demonstrated that the bearing capacities of bottom-expanded piles was significantly improved compared with those of pipe piles. The ultimate bearing capacity was the largest for pile C2.0 (2.38 times). When the diameter of bottom expansion was increased, the bearing capacity of bottom-expanded piles was significantly increased at D/d = 1.4 and D/d = 1.8, reaching 1.67 and 2.29 times, respectively, while for D/d = 1.6 and D/d = 2.0, the ultimate bearing capacity remained unchanged. The ratio of concrete amount of the five tested piles (C1, C1.4, C1.6, C1.8, and C2.0) was 1.00:1.10:1.16:1.22:1.30, and the ratio of concrete bearing capacity per unit volume of the piles was 1.00:1.52:1.44:1.87:1.82. The results of the tests showed that when the radius of the pile tip was expanded, the head was enlarged and the concrete bearing capacity per unit volume of the piles was increased first and then decreased. In addition, the ratio was the largest for pile C1.8, with a value of 1.87. For improving the ultimate bearing capacity and saving the amount of concrete, the bottom expansion size of the rigid expanded bottom pile was more economical when D/d = 1.8.

4.1.2. Pile Axial Force

The pile axial forces of C1, C1.4, C1.6, C1.8, and C2.0 are shown in Figure 10a,b. In Figure 10a, when the load at the top of the pile was 2 kN, the change rules of axial force around the pipe and rigid bottom-expanded piles were consistent because the load at the top of the pile did not reach their ultimate bearing capacity. The axial force was recorded as the largest at the top of the pile within the pile body range and was encountered to be the smallest at the bottom of the pile, showing a gradual decrease trend from top to bottom. The rates in the middle and lower parts of the piles were significantly increased. With the increasing load at the top of the pile, the axial force of the piles was differentially increased within depth. During the loading of the five tested piles in this group, the slope of the curve was large at 0–30 cm from the upper parts of the piles. The slope of the curve was gradually declined at the lower parts of the piles, indicating that the load on the top of the pile was not sufficiently transferred to the soil around the pile. The slope of the curve between the measuring points was gradually reduced. The axial force of the piles was gradually transferred from the piles to the soil around the piles and then decreased rapidly with increasing pile depth.
When the load at the top of the pile was 5 kN, the axial force of C1 was not shown in Figure 10b because of reaching the test termination conditions. According to Figure 10b, the load at the top of the pile for C1.4 and C1.6 exceeded the ultimate bearing capacity, and the piles were penetrated causing the shaft resistance to remain constant. The slope of the axial force curves of C1.8 and C2.0 gradually declined at the depth of 20–80 cm and was increased quickly at the depth of 80–90 cm. The comparison with the axial force curves of C1.4 and C1.6 indicated that since the bottom expansion effects at the bottom of C1.8 and C2.0 did not reach the ultimate bearing capacity, the continuing load on the top of the pile could be further borne by the pile tip expanded head.

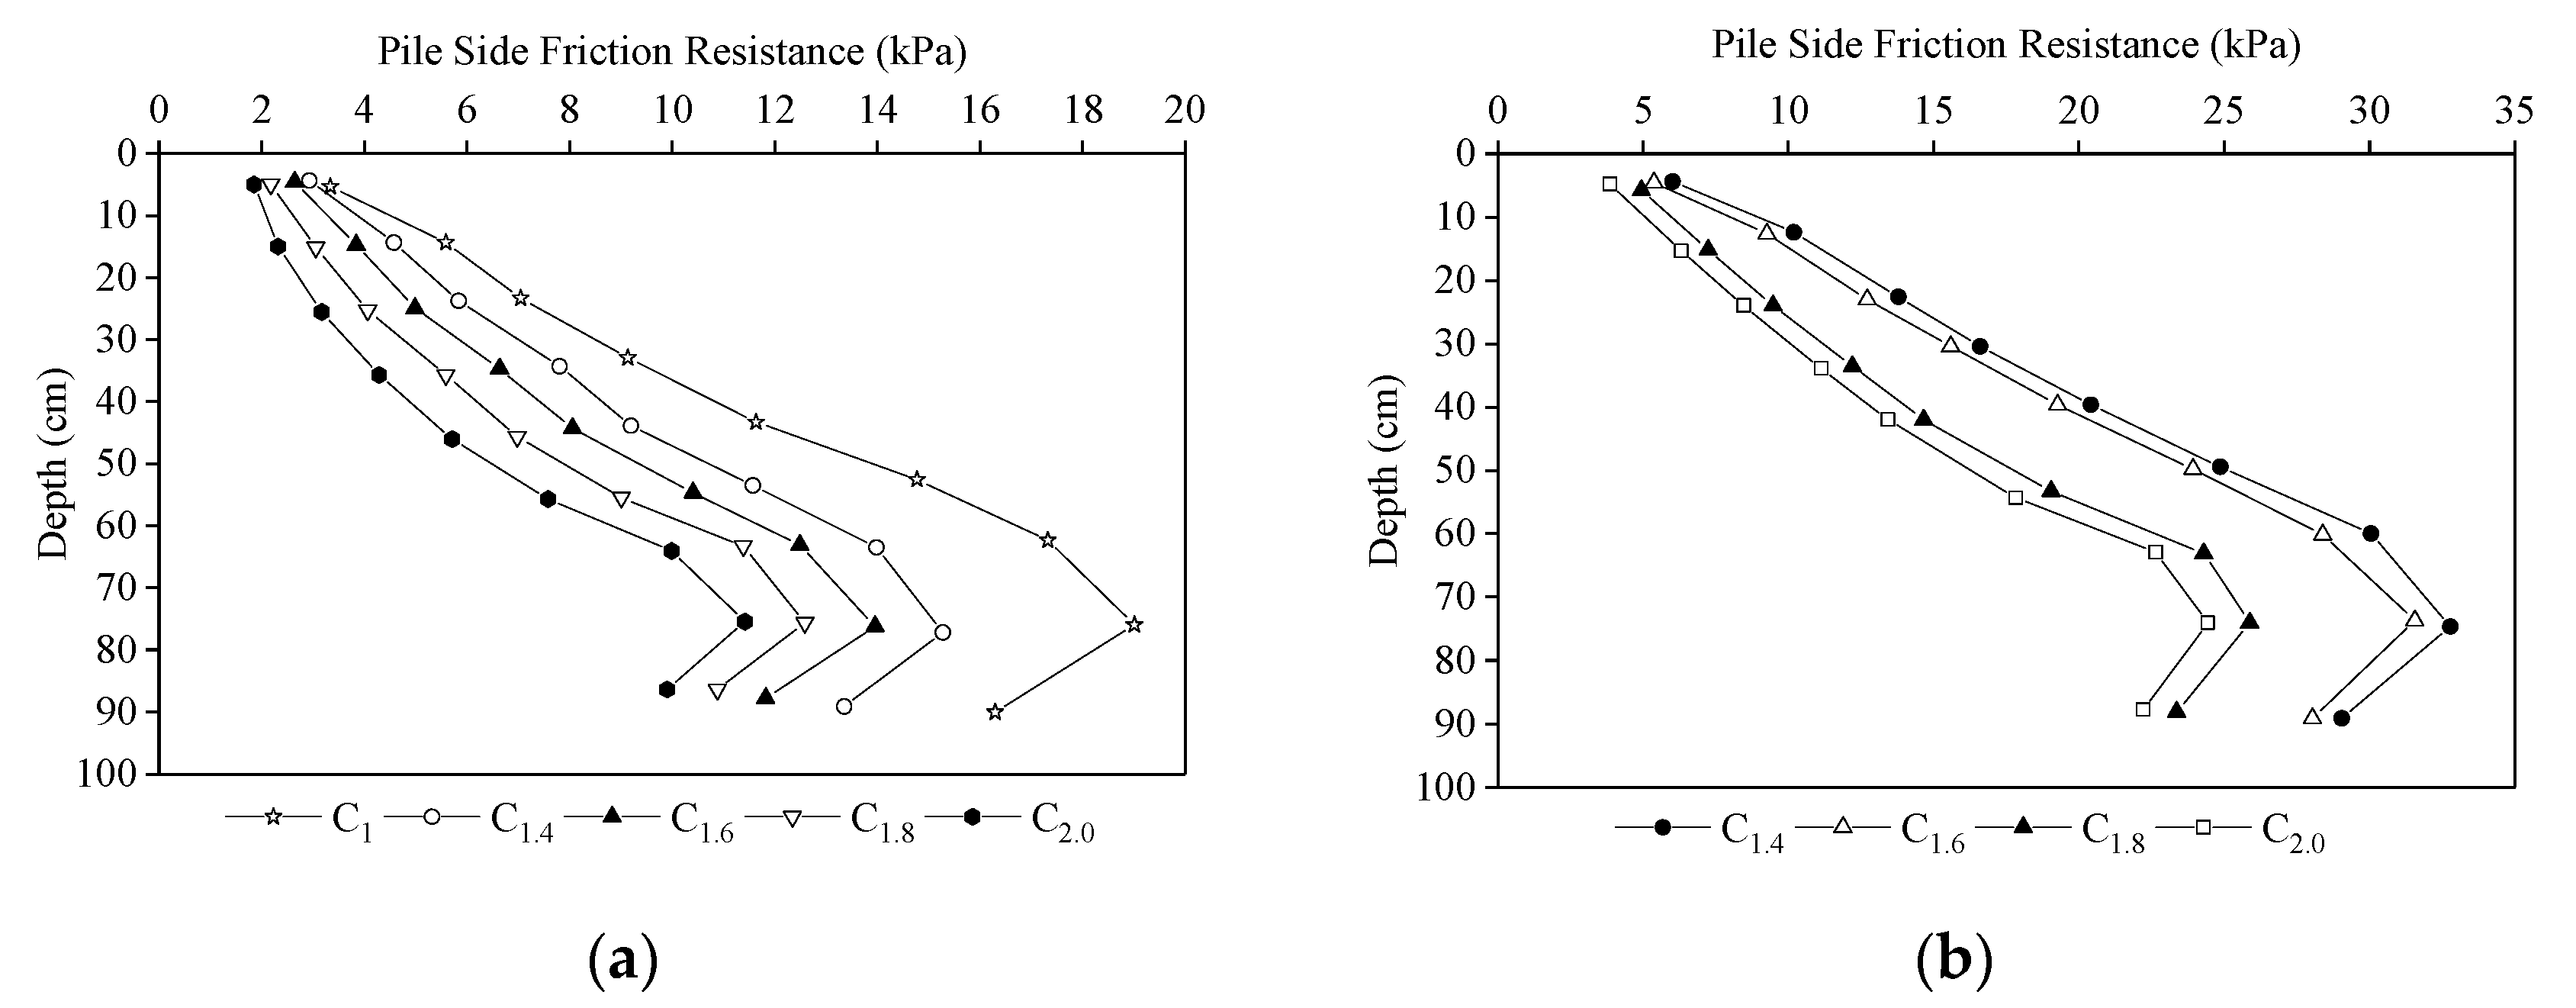
4.1.3. Shaft Resistance

The shaft resistance was calculated based on the pile axial force measured by resistance strain gauges attached to the piles by using Equation (1) [30]:
f s i = N i N i + 1 A i
where, fsi denotes the mean shaft resistance between sections ii + 1, Ni denotes the pile axial force at the section i, Ni+1 indicates the pile axial force at the section i + 1, and Ai designates the pile surface area of the layer i.
Figure 11 reveals the curves of the pile body resistance and depth for rigid bottom-expanded piles when the load at the top of the pile was 2 and 5 kN. Compared with the load and settlement relationships in Section 4.1.1, it was found that when the applied load was 2 kN, all the five tested piles failed to reach the ultimate bearing capacity, and the soil around the piles did not collapse (Figure 11a). Hence, the resistance change rules of the piles for all tests were basically consistent. The shaft resistance curves of C1–C2.0 were in order from right to left, displaying a “left turn √ shape”. In addition, the shaft resistance was gradually increased with increasing depth. When the depth of each pile ranged from 0 to 0.8 m and the pile body resistance was decreased at the depth of 0.8–0.9 m, the pile tip resistance could have an adverse effect on the pile body resistance. By comparing C1 with other four rigid bottom-expanded piles, the shaft resistance of each section of C1 was greater than that of rigid bottom-expanded piles. The pile body resistance was decreased gradually at the same depth with the increasing bottom expansion diameter of rigid bottom-expanded piles. This indicates that the pile tip expanded head affects the action of the pile body resistance, which in turn reduces the shaft resistance. As shown in Figure 11b, when the load was increased to 5 kN, C1.4 and C1.6 reached the ultimate load, and the soil around the piles had a shear failure mode. The shaft resistance reached the limit, and the load was continuously transferred downwards and borne by the pile tip expanded head. The pile top load of C1.8 and C2.0 did not reach the ultimate value, and the soil around the piles was free from the shear friction. The shaft resistance was not fully utilized; hence, the pile top load could be applied further.

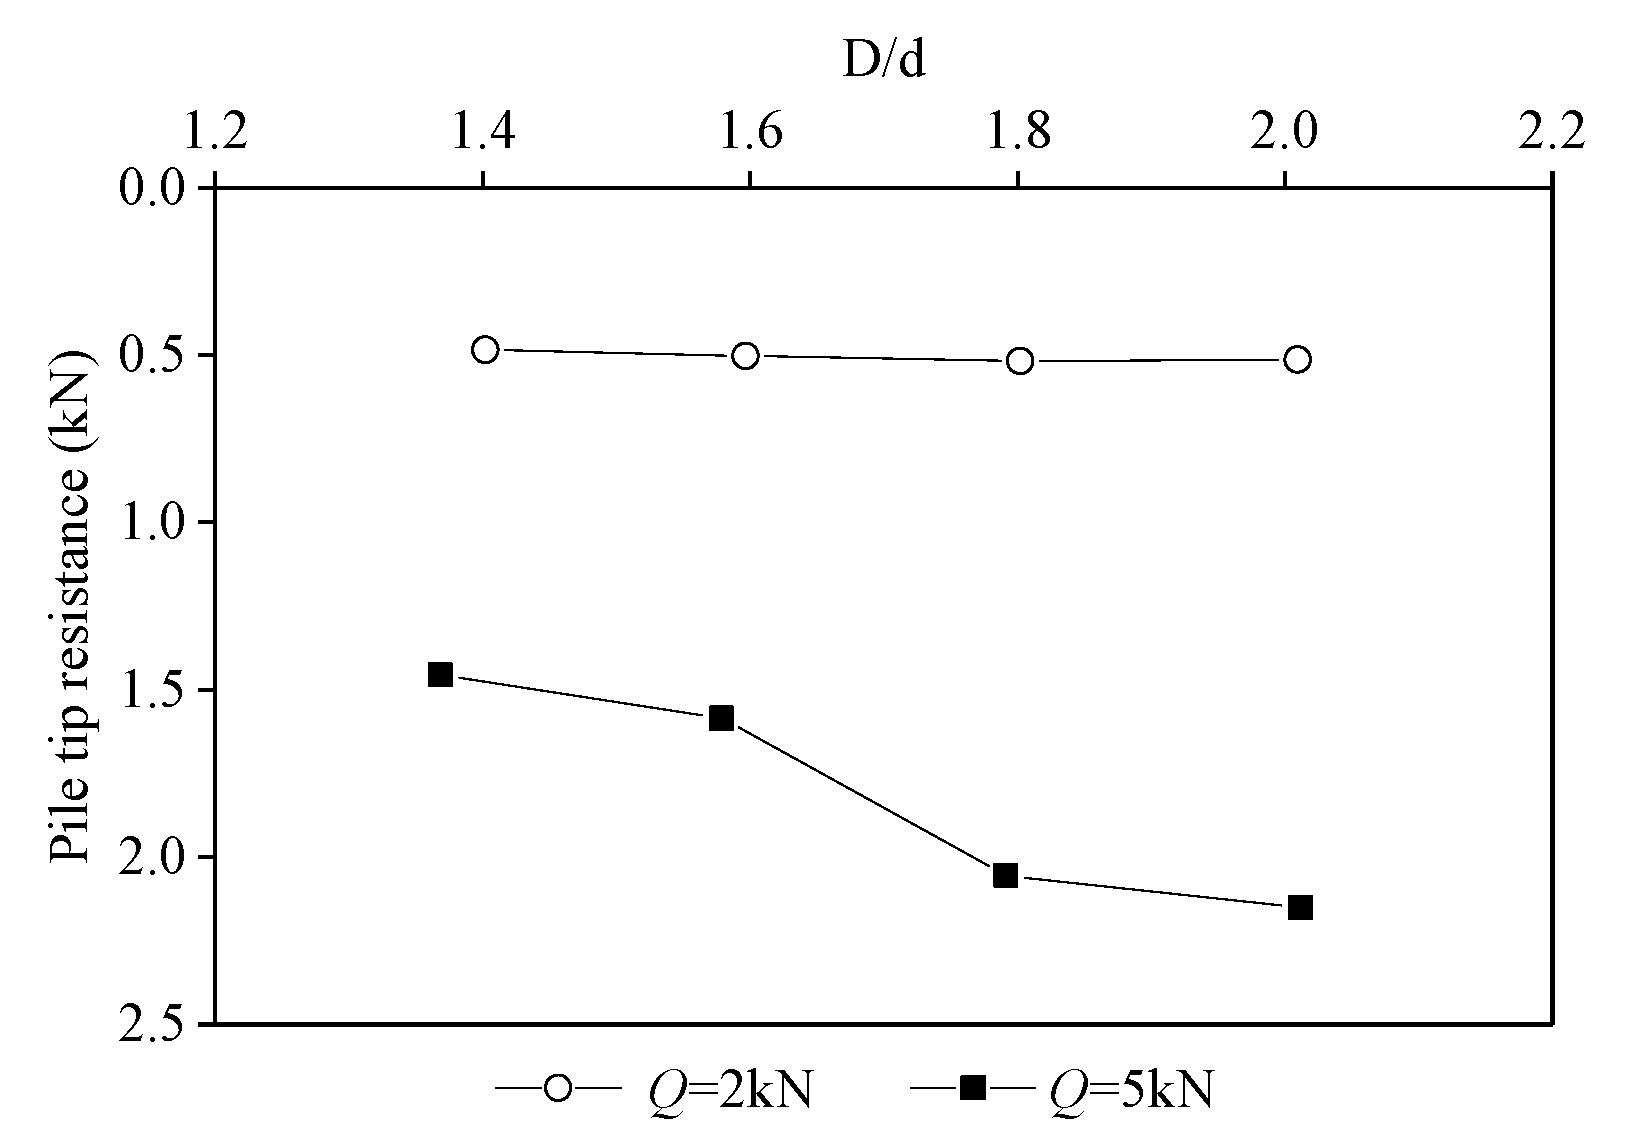
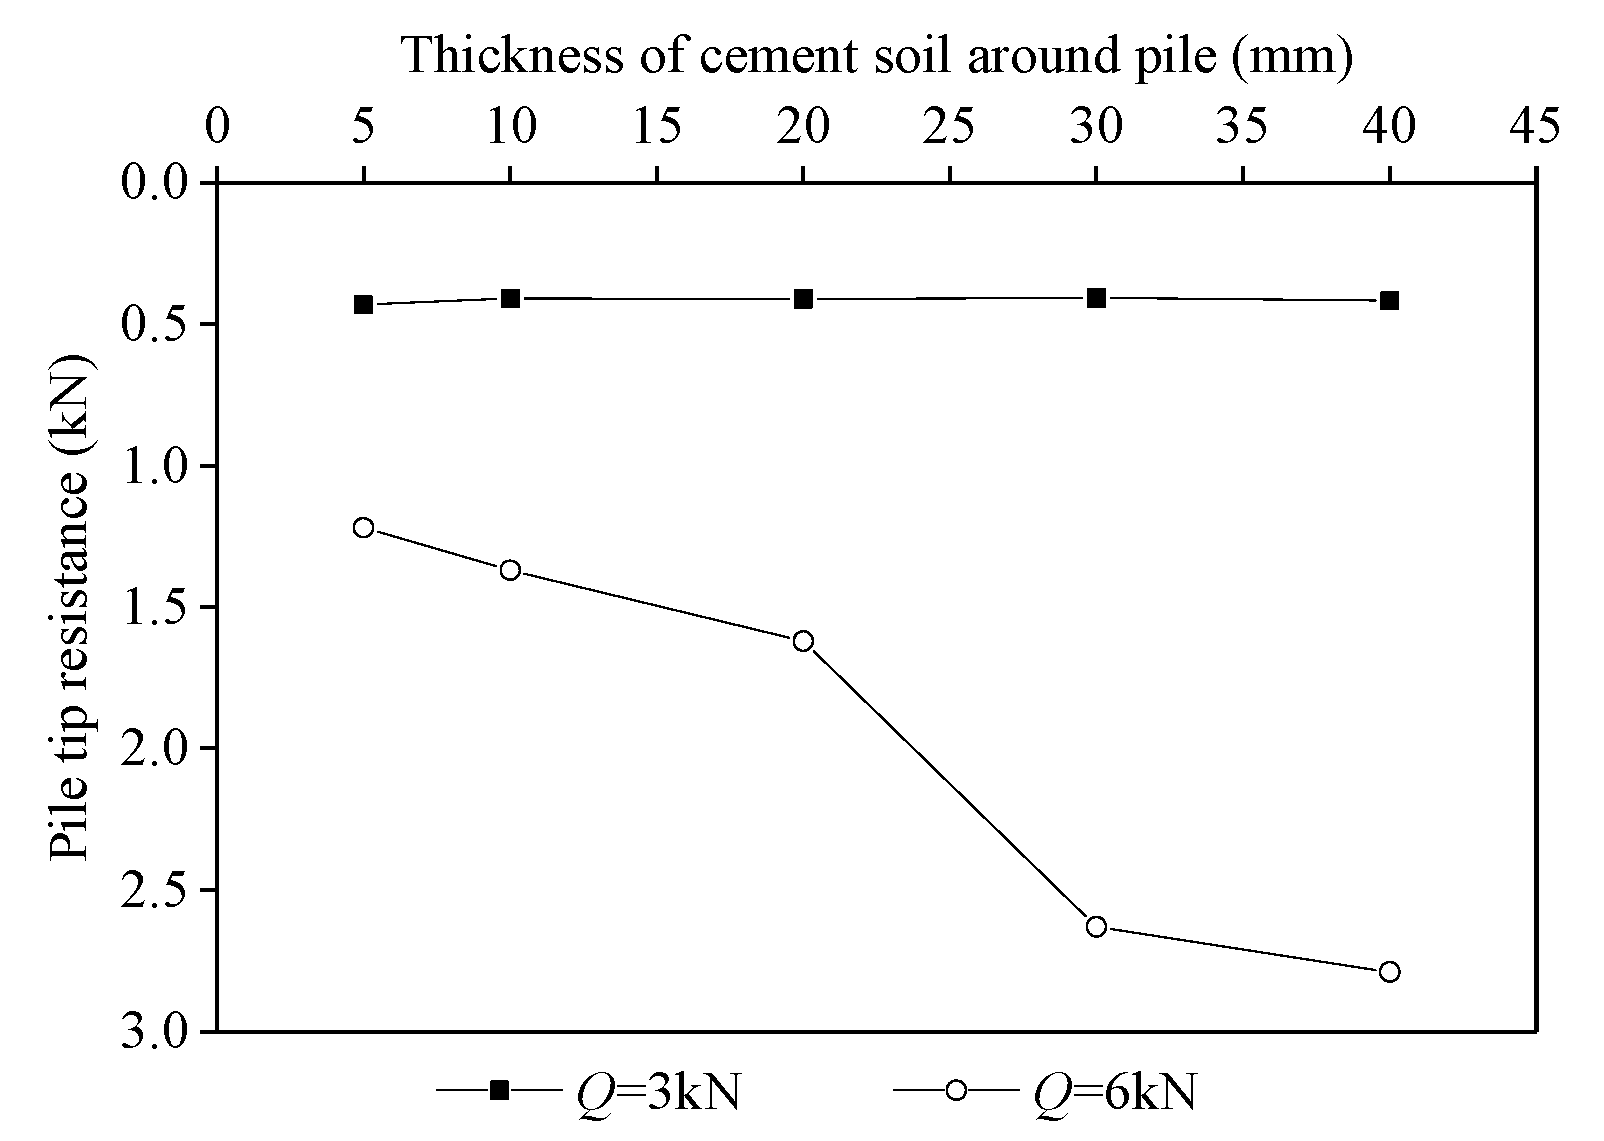
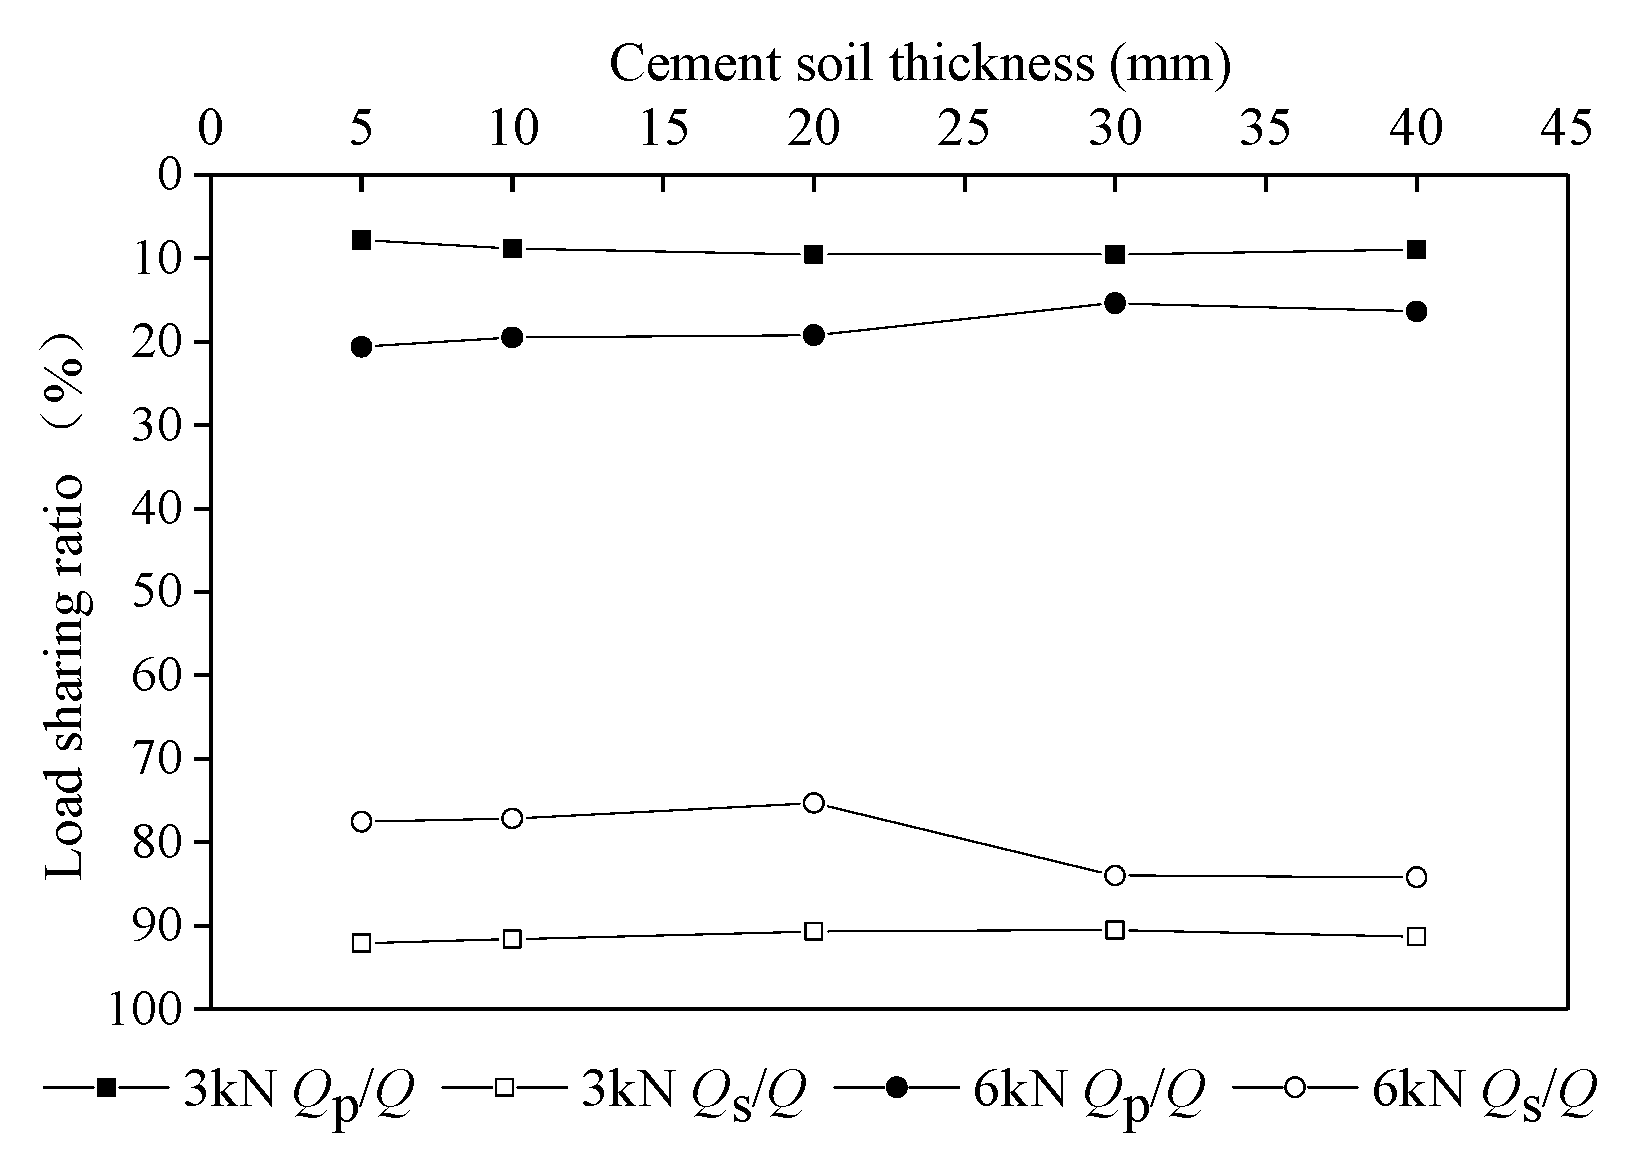
4.1.4. Pile Tip Resistance and Load Sharing Ratio

According to the earth pressure cell buried at the bottom of the pile, a static resistance strain indicator was used to read the strain value of the pressure cell. The pile tip resistance of the tested piles can be calculated using Equation (2).
P = K μ ε
where, P is the corresponding soil pressure, με denotes the soil strain measured during the tests, and K designates the conversion coefficient.
The results of the soil pressure at the pile tip of rigid bottom-expanded piles are presented in Figure 12. When the load at the top of the pile was 2 kN, the soil pressure curve at the top of the pile was straight and leveled. This suggests that the load borne by the expanded bottom tip is small under small pile top load applied, and the load at the top of the pile is almost borne by the shaft resistance. When the pile top load was 5 kN, the pile tip resistance of the rigid bottom-expanded piles was increased with increasing expanded tip diameter, and the tip resistance was abruptly increased in C1.8. The pile tip pressure distribution curves of C1.8 and C2.0 showed that the tip resistance played a limited role when the bottom expansion diameter was larger than a certain value.
The sharing ratio of shaft resistance and pile tip resistance are an important index to evaluate the pile bearing performance. Figure 13 reveals the sharing ratio of shaft resistance and pile tip resistance of each pile when the load was 2 and 5 kN. In the figure, Qp is the resistance value at the pile tip and Qs is the sum of the pile top load minus the pile tip resistance, i.e., the friction around the pile. The external load was mainly carried by the shaft resistance in the early loading steps with a sharing ratio of more than 90%. Thus, the size of the pile tip expanded head has little effect on load sharing. When the load was continuously increased to a value approximately close to the ultimate bearing capacity, the shaft resistance was close to the limit value, and the sharing ratio of the tip resistance was significantly increased. Furthermore, the larger the diameter of the expanded head, the more obvious the increase in the tip resistance bearing ratio. When the external load was 5 kN, the shaft resistance sharing ratios of C1.4, C1.6, C1.8, and C2.0 were 84.3, 82.9, 75.6, and 74.4%, respectively. These values were much higher than the sharing ratio of pile tip resistance. In other words, even if the bottom expansion diameter is increased for the bottom-expanded piles, the frictional resistance is still the main component of the pile bearing capacity.

4.2. Results of Modeling Test for RFCPPEB

4.2.1. Load Settlement Curves (Q–S Curves)

The influence of different expanded bottom diameters on the bearing capacity of the pile foundation was discussed in the above sections. According to the principle of control variables, the expanded bottom diameter remained unchanged, and 1.8 d (the optimal diameter of the expanded bottom) was selected to assess the influence of the cemented soil thickness on the bearing capacity of composite piles with expanded bottom.
The load and settlement curves of C1.8 and P5–P40 are shown in Figure 14. The settlement curves were similar to those obtained for the piles with expanded bottom, and the ultimate bearing capacities of C1.8 and P5, P10, P20, P30, and P40 were 5.5, 5.7, 6.0, 6.2, 7.5, and 7.7 kN, respectively. With C1.8 as a reference, the comparative analysis of the ultimate bearing capacities of RFCPPEB with different cemented soil thicknesses is shown in Table 4. It was observed that the bearing capacity of the composite piles with expanded bottom could be noticeably improved due to the presence of the cemented soil around the piles. Besides, the increase in bearing capacity was more apparent with the increasing thickness of cemented soil. When the thickness of cemented soil for P30 was 30 mm, the bearing capacity of the composite piles with expanded bottom was the highest, and the ultimate bearing capacity of the cemented soil per unit volume was also the greatest. D/d = 1.5 is the most reasonable thickness for the cemented soil at which the bearing capacity can be improved and the cemented soil can be saved.

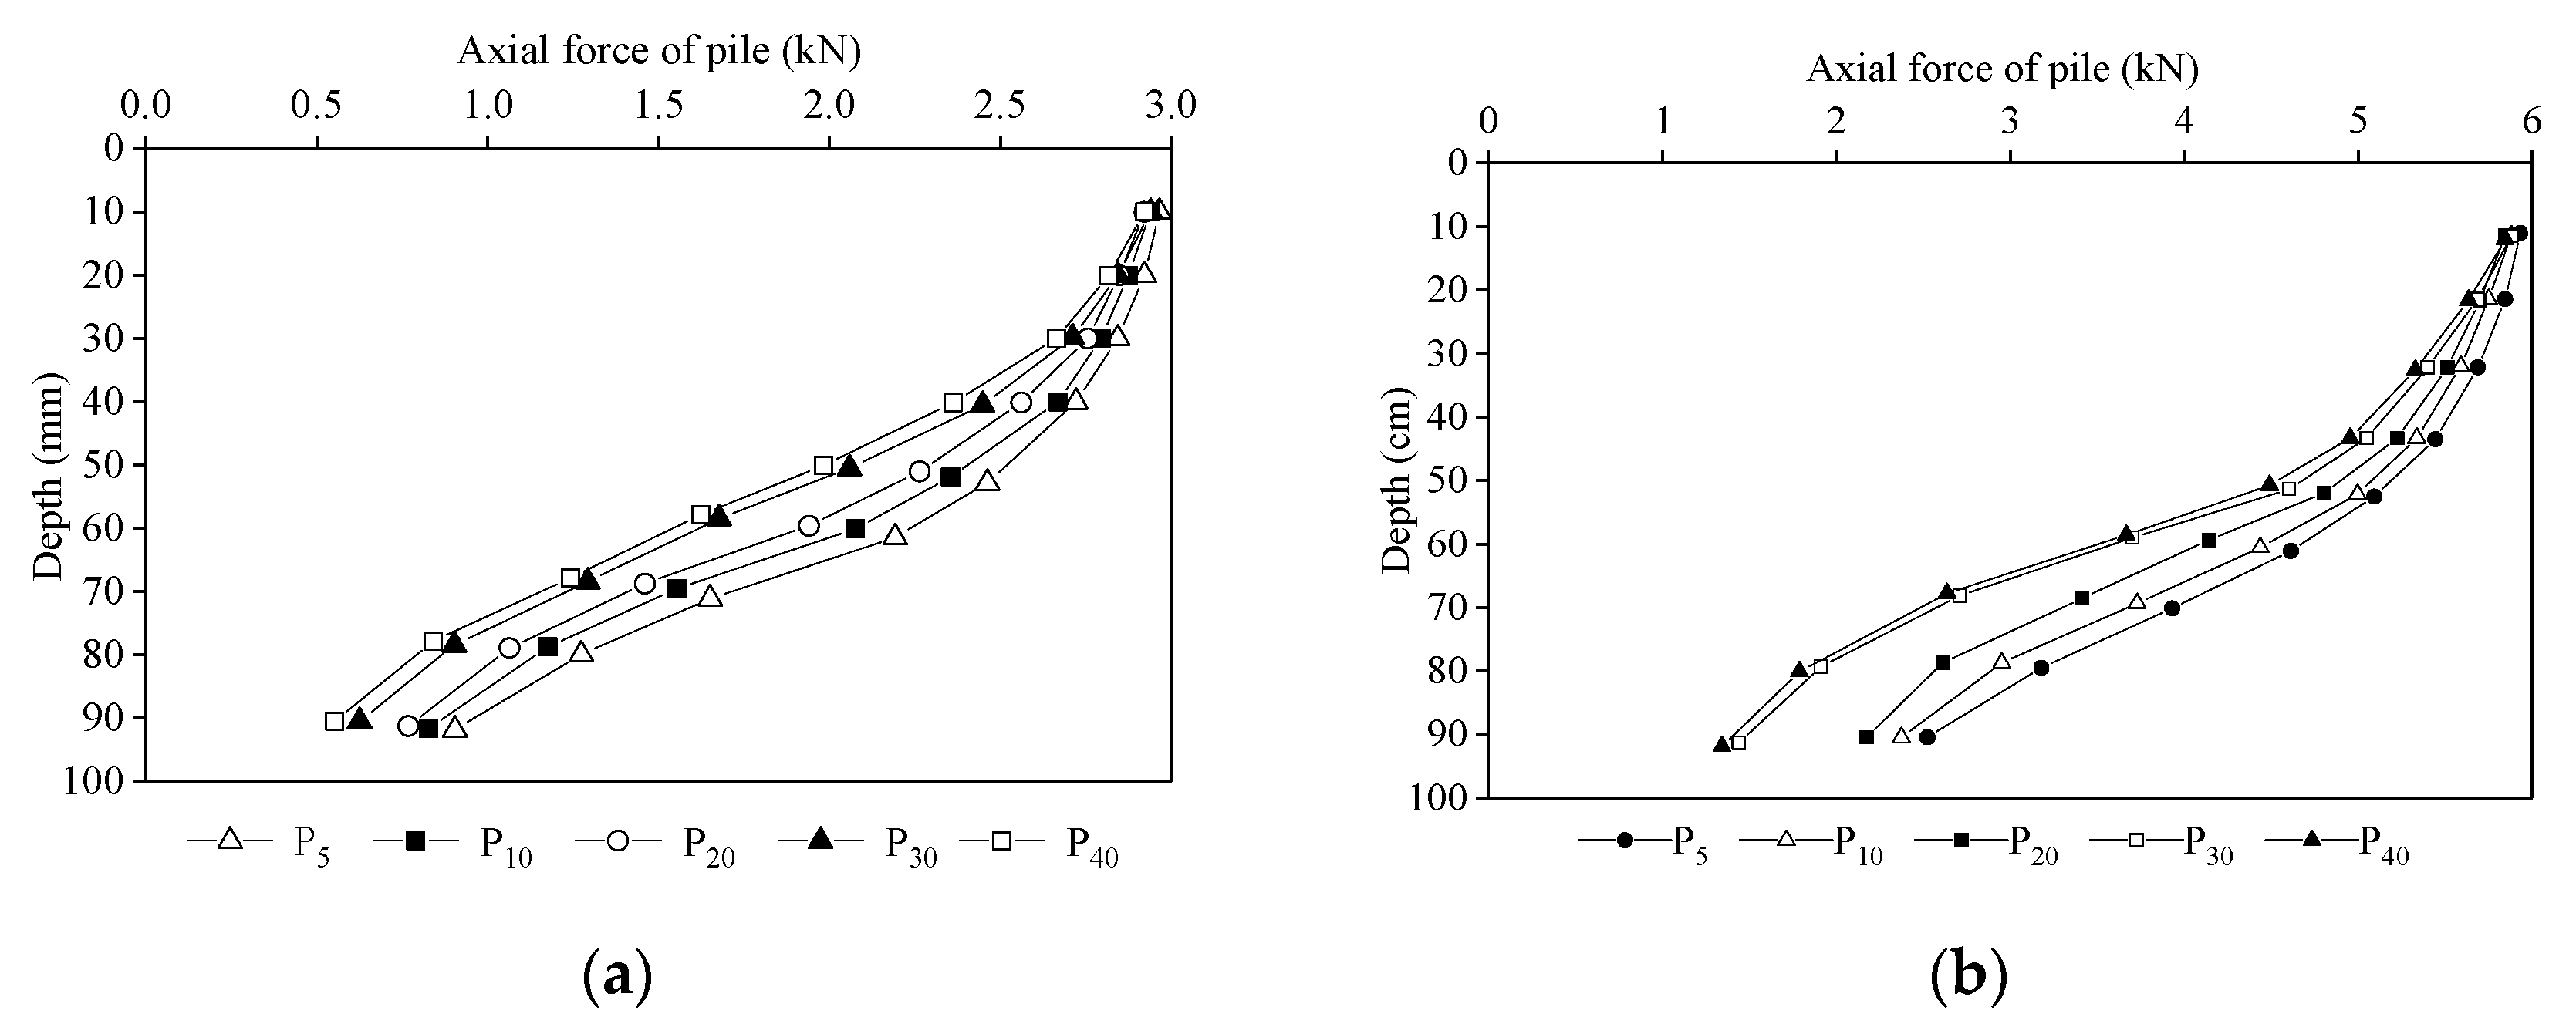
4.2.2. Axial Force of the Pile

The curves of the axial forces of RFCPPEB with different thicknesses for cemented soil and under 3 and 6 kN are shown in Figure 15a,b, respectively. As shown in Figure 15a, the axial forces in the middle and upper parts of the piles were relatively large, while those at the bottom of the piles were relatively small when Q = 3 kN. Since the pile top load was relatively small, the load was mainly taken by the shaft resistance of the pile body. A small part of load was borne by the pile tip resistance of the expanded head at the bottom of the piles. When the thickness of the cemented soil was increased, the axial force of the pile tip was gradually decreased, indicating that the increased thickness of the cemented soil could improve the shaft resistance. The pile tip resistance provided by the expanded head of the pouch started to work gradually with increasing load.
It was observed from Figure 15b that the axial force at the pile tip increased when Q = 6 kN, and a large part of the bearing capacity was supplied by the pile tip resistance at the expanded head of the pouch. The axial force of the pile body was decreased with the increased thickness of cemented soil around the piles, especially in the middle and lower parts. This phenomenon showed that the efficiency of pile–soil load transfer could be improved by increasing the thickness of the cemented soil around the piles and the axial force of the pile body could be reduced, thus, improving the vertical compressive bearing capacity of rigid-flexible composite pouch piles. In addition, when the thickness of cemented soil was increased from 20 to 30 mm, the axial force at the bottom of the pile body was rapidly decreased. However, when the thickness was further increased to approximately 40 mm, the axial force at the bottom of the pile body was slightly declined. It was observed that when the pile top load was 6 kN, the shaft resistance of P5, P10, and P20 was fully exerted from top to bottom until reaching the ultimate shaft resistance. Moreover, the load was further transferred to be borne by the pile tip soil. The shaft resistance of the pile body provided by P30 was greatly improved with the increasing thickness of the cemented soil around the piles to about 30 mm. The pile top load was transferred to the soil around the pile in the upper and middle parts of the pile body. Therefore, the axial force at the lower part of the pile body was relatively small. When the thickness of the cemented soil around the piles was increased to 40 mm, the shaft resistance of the middle and upper parts of the pile body was increased by the cemented soil around the pile until reaching a certain value. The pile top load was transferred to the soil around the pile from the middle parts of the pile body. Hence, the shaft resistance of the expanded head at the bottom of P30 and P40 was not fully exerted.

4.2.3. Shaft Resistance

It is of great importance to analyze the distribution of the shaft resistance around the pile body because the load transfer between pile and soil is mainly realized through the gradual exertion of shaft resistance. Figure 16a,b shows the relation curves between the shaft resistance and depth for RFCPPEB using the pile top loads of 3 and 6 kN, respectively. When the curves in Figure 16 were compared with those in Figure 11, it was found that the shaft resistance of RFCPPEB was generally greater than that of the rigid piles with expanded bottom. This can be justified by the load transfer law of the rigid piles with expanded bottom that can be changed by the cemented soil around the piles forming a transfer mode from the concrete pile to the cemented soil and then to the soil, which causes the shaft resistance to be fully exerted [26]. Furthermore, the increases in the shaft resistance and thickness of the cemented soil showed a nonlinear growth, and the maximum shaft resistance was approximately 75 cm from the pile top (Figure 16). When the pile top load was 3 kN, the shaft resistance of RFCPPEB was increased with the increasing thickness of the cemented soil in a linear growth relationship. In addition, the maximum shaft resistance of P5 was 37 kPa, suggesting that the 5-mm increase in the thickness of cemented soil could rarely increase the shaft resistance when the pile top load was 6 kN. The maximum shaft resistance of P10 and P20 was increased, and the shaft resistance started to play its role. The maximum shaft resistance of P30 rose significantly compared with that of P20. The maximum shaft resistance of P30 indicated that when the thickness of the cemented soil was 0.5 of the pile diameter, the shaft resistance had the best performance. This could be due to the fact that the thickness of the cemented soil was at its optimum to improve the shaft resistance. However, when the thickness exceeded 0.5 of the pile diameter, it was of little significance to improve the shaft resistance.

4.2.4. Pile Tip Resistance and Load Sharing Ratio

Due to the existence of the cemented soil around the piles, the shaft resistance was larger than that of the rigid piles with expanded bottom, and the soil pressure at the pile tip was smaller. As shown in Figure 17, the soil pressure at the tip of RFCPPEB was basically the same at 3 kN of pile top load. For 6 kN pile top load, the soil pressure at the tip of RFCPPEB was not decreased linearly with the increasing thickness of the cemented soil, but it was decreased in the form of the quadratic curve. When the thickness of the cemented soil was equal to 0.5 of the pile diameter, the soil pressure reached the most reasonable position at the maximum slope of the quadratic curve.
The load sharing ratio of RFCPPEB under loads of 3 and 6 kN is shown in Figure 18. The ratio of the shaft resistance QS/Q was decreased with the increasing thickness of the cemented soil using a load of 3 kN, but such reduction was not obvious, and an opposite trend was found in the pile tip resistance. On the other hand, the load ratio of the shaft resistance QS/Q of P5, P10, and P20 was gradually decreased from 77.5 to 75.3% at the load of 6 kN, indicating that there was no significant decline in shaft resistance. This may be attributed to the insufficient thickness of the cemented soil. Although the thickness of the cemented soil could improve the shaft resistance, it was still limited. When the thickness of the cemented soil was increased to 0.5 of the pile diameter (30 mm), the load ratio of the shaft resistance of P30 was significantly increased at the QS/Q of 84.0%. The ratio of pile tip resistance (QP/Q) was greatly decreased and the shaft resistance was considerably improved. With further increase in the thickness of the cemented soil, the load ratio of the shaft resistance (QS/Q) of P40 was slightly decreased, while that of the pile tip was slightly increased.

5. Numerical Modeling

To further explore the bearing characteristics of RFCPPEB, the vertical bearing capacities of the rigid piles with expanded bottom and a single RFCPPEB were verified and analyzed using the ABAQUS finite element software. Besides, the best expanded bottom diameter and the best thickness of cemented soil were obtained by a subsequent analysis combined with the conclusions of indoor modeling tests.

5.1. Basic Assumptions and Simplified Calculation

This model was built using the following assumptions:
  • It was assumed that the boundary of the pile and soil displayed the no-node displacement. This means that the regularity of the analysis is not affected by the pile and soil relationships.
  • The rigid pile with expanded bottom was a line elastomer.
  • The soil and cemented soil were homogeneous, continuous, and isotropic elastic–plastic solids.
  • It was assumed that the load was borne by the top surface of the rigid pile with expanded bottom.

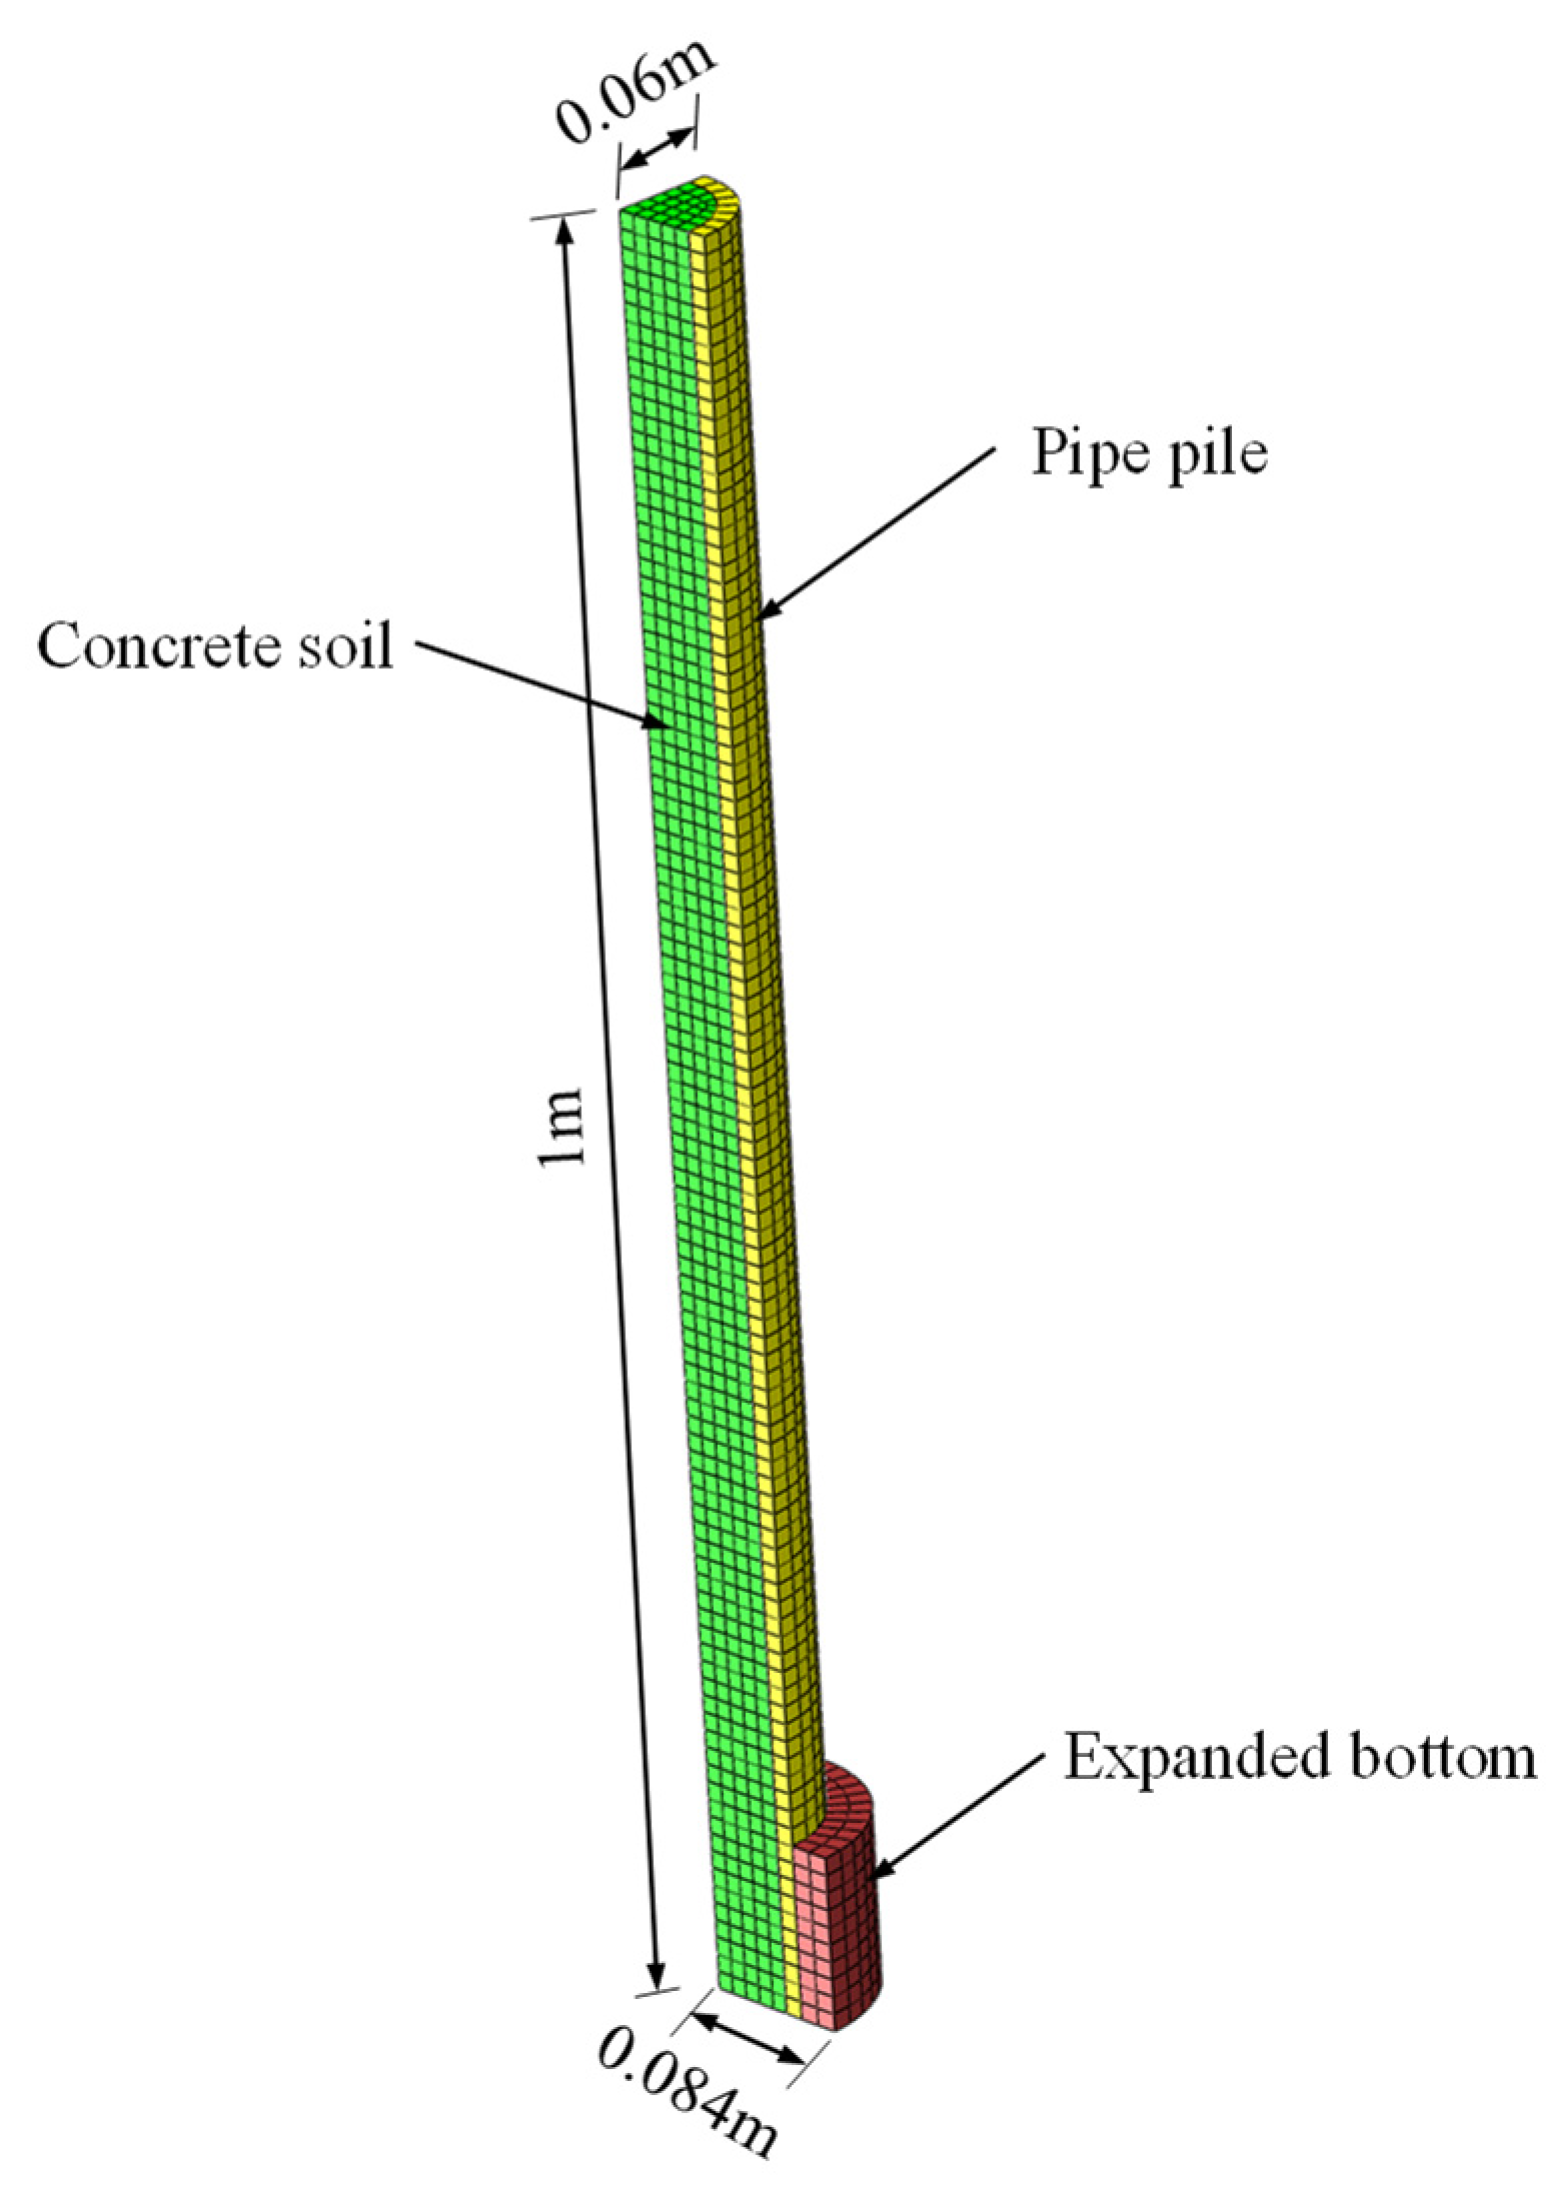
5.2. Establishment of Finite Element Model

According to the setting of modeling piles used in the indoor modeling tests, two models of the rigid pile with expanded bottom and RFCPPEB were established. In light of the working conditions of the indoor models, the models were established for different expanded bottom diameters and different thicknesses of the cemented soil around piles. The best design thickness of the cemented soil for rigid-flexible composite piles was further analyzed and studied. The 1/4 model was established in the horizontally and vertically axisymmetric structure; the stress, deformation, and settlement of the whole model were learned in an axisymmetric way in the post-treatment. The calculation range of the circumferential soil model was 20 times the pile diameter, and the vertical soil model was double the pile length. A Mohr–Coulomb model was adopted for the cemented soil, sandy soil, and clay. The friction models of the two interfaces of the rigid pile with expanded bottom-cement soil–soil were both Lagrange friction models. On the interface between the rigid pile with expanded bottom and the cemented soil pile, the friction coefficient (μ) was 0.6. Meanwhile, on the interface between the cemented soil and the sandy soil, the friction coefficient (μ) was 0.3. Due to the friction and extrusion between the RFCPPEB and the cemented soil around the pile under an external load, a large displacement may have been encountered. Thus, the cemented soil was considered as the elastic–plastic material. The parameters of the model are shown in Table 5. The steps of analysis included the stress balance and static analysis. Hard contact was adopted in the pile and soil interaction, and the pressure load was adopted in the load application. The boundary conditions were all set as Symmetry/Antisymmetry/Encastre. The structural units were adopted in the physical partition, and the unit type was C3D8R. The dimensions of the finite element model of the two types of the pile are shown in Table 6. Figure 19 shows the modeling of a C1.4 rigid pile with expanded bottom. Figure 20 shows the pile and soil modeling using ABAQUS finite element software.

5.3. Reliability Validation of the Numerical Model

According to the calculated results of the finite element software ABAQUS, the comparison diagram of QS curves between indoor tests and the numerical simulation of pile P30 was obtained (Figure 21). The comparison of the QS curve between the measured value P30 and the simulated value J30 revealed that the QS curve of P30 had a gradual upward trend simulated by the numerical calculation. It exhibited poor fitting when compared with the QS curve of the indoor modeling pile test, and the Pearson correlation coefficient was 0.77. It was speculated that there was a big error between the ultimate bearing capacity obtained from the modeling test and that obtained from the numerical simulation. The error was caused by the disturbance of the clay at the bottom of the pile during the pile foundation test in the laboratory, thus resulting in a lower clay density than that usually obtained in actual projects. Besides, the inevitable external and human factors were noted in the process of sand backfilling and compaction. Since the results of the numerical simulation reflected similar development law with that of indoor model tests, this model could still be used for the subsequent simulation. Figure 22 shows the QS curves of RFCPPEB with different cemented soil thicknesses.

5.4. Simulation Results of RFCPPEB

The QS curves of RFCPPEB with different cement soil thicknesses and belled diameter obtained by a finite element simulation are shown in Figure 22. The loads at the first level before the steep drop of QS curves were selected as the ultimate bearing capacity. Table 7 shows the ultimate bearing capacities of different pile types. According to Figure 22 and Table 7, it was found that the ultimate bearing capacity of the pile foundation was increased with the increasing cemented soil thickness of different rigid bottom-expanded piles. The stress ratio of the pile tip soil was decreased due to an increase in the expanded bottom. The bearing capacity of the pile tip was strengthened, and the overall ultimate bearing capacity of RFCPPEB was strengthened. However, the ultimate bearing capacity of the pile foundation remained constant when the thickness of the cemented soil was increased. The ultimate bearing capacities of C1.8 and C2.0 were both 7.5 kN at a thickness of 25 mm for the cemented soil. This indicates that when the expanded head of the pile bottom is fixed, the increased thickness of the cemented soil has little effect on the ultimate bearing capacity. At the cemented soil of 30 mm, the ultimate bearing capacity of the pile foundation was increased with increasing thickness. Meanwhile, at 35 mm thickness, the ultimate bearing capacity of the pile with expanded bottom was not increased with increasing cemented soil thickness, which was larger than 30 mm (0.5 of the pile diameter) obtained in the laboratory experiment.
To sum up, the 1.8-d rigid pile with expanded bottom and thickness of 35 mm for the cemented soil contributed to the optimal bearing capacity of RFCPPEB. Besides, the 2.0-d rigid pile with expanded bottom had the same ultimate bearing capacity as the 1.8-d rigid pile with expanded bottom as a whole. Thus, 1.8-d rigid pile with expanded bottom and the thickness of 35 mm for the cemented soil are the ideal choices.

6. Conclusions

An indoor modeling test and ABAQUS numerical simulation were conducted in this study. The vertical bearing capacity and the influential mechanism of the rigid piles with expanded bottom and RFCPPEB were systematically investigated. The indoor modeling test was conducted to assess the vertical bearing characteristics of the rigid piles with expanded bottom using different expanded bottom diameters at which the expanded head of the pile bottom was 9:1. The results of the indoor tests were used in the selection of the rigid pile with expanded bottom featured by D/d = 1.8. Moreover, the vertical bearing characteristics of RFCPPEB with different cemented soil thicknesses were studied. The ABAQUS finite element model was established based on the indoor modeling tests, and the optimum thickness interval of the cemented soil around RFCPPEB was determined. The main conclusions can be drawn as follows:
  • The bearing capacity of the rigid piles with expanded bottom was better than that of the pipe piles. When the bottom expansion ratio (D/d) was increased, the bearing capacity of bottom-expanded piles was significantly increased at D/d = 1.4 and D/d = 1.8 compared to that of D/d = 1.0, reaching 1.67 and 2.29 times, respectively, while for D/d = 1.6 and D/d = 2.0, the ultimate bearing capacity remained unchanged. Besides, D/d = 1.8 was the favorable range for the ultimate bearing capacity of the rigid piles with expanded bottom that reduced the consumption of cement. Part of the load of the rigid pile with expanded bottom was borne by the expanded bottom. Moreover, with the increase in the expanded bottom diameter, the ultimate bearing capacity of the pile tip was increased, and such increase was most obvious when D/d = 1.8.
  • Shaft resistance played an important role in the bearing process of the rigid piles with expanded bottom and RFCPPEB. The pile body was mainly destroyed by the shearing of the soil around piles. Hence, improving the shaft resistance could effectively enhance the bearing capacity of the pile foundation.
  • The increases in the shaft resistance of RFCPPEB and thickness of the cemented soil showed a nonlinear growth, and the maximum shaft resistance was approximately 75 cm from the pile top. It had a linear relationship under the relatively small load, but the increase was small. The maximum shaft resistance of P10 and P20 was increased and the shaft resistance started to play its role. The maximum shaft resistance of P30 rose significantly compared with that of P20, indicating that when the thickness of the cemented soil was 0.5 of the pile diameter, the shaft resistance had the best performance. However, when the thickness of the cemented soil exceeded this value, it was of little significance to improve the shaft resistance and pile tip resistance.
  • The soil pressure at the pile tip of RFCPPEB was smaller than that of the rigid piles with expanded bottom. The soil pressure at the pile tip was proportional to the pile top load under the relatively small load. The load ratio of the shaft resistance QS/Q for P5, P10, P20, P30, and P40 piles were 77.5%, 77.1%, 75.3%, 84.0%, and 84.2% respectively. When the pile top load was large, the soil pressure at the pile tip of RFCPPEB was decreased in the form of half of the quadratic curve. It reached the most reasonable position at the maximum slope of the quadratic curve when the thickness of the cemented soil was slightly greater than 0.5 times the diameter of the pipe pile. Relatively small thickness for the cemented soil led to poor effects. When thickness exceeded a certain value, the effect on the ultimate bearing capacity of the pile foundation was not obvious.

Author Contributions

Supervision, writing—review and editing, X.W.; Conceptualization, methodology, writing—original draft preparation, Y.Q. and K.W.; software, validation, formal analysis, H.D.; data curation, Q.L.; investigation, Y.C.; project administration, D.L. All authors have read and agreed to the published version of the manuscript.

Funding

The Science and technology project supported by the Department of transportation of Henan Province (2020J-2-13), Natural Science Foundation of China (52109139, 52009122), Zhejiang Provincial Natural Science Foundation of China (LQ20E080022, LQ21E090002), Science and technology project supported by the Department of transportation of Zhejiang Province (2019007) is acknowledged.

Institutional Review Board Statement

Not applicable.

Informed Consent Statement

Not applicable.

Data Availability Statement

Not applicable.

Conflicts of Interest

The authors declare no conflict of interest.

References

  1. Zhou, H.; Liu, H.; Li, Y.; Ding, X. Limit lateral resistance of XCC pile group in undrained soil. Acta Geotech. 2019, 15, 1673–1683. [Google Scholar] [CrossRef]
  2. Liu, F.; Yi, J.; Cheng, P.; Yao, K. Numerical simulation of set-up around shaft of XCC pile in clay. Geomech. Eng. 2020, 21, 489–501. [Google Scholar]
  3. Zhou, H.; Yuan, J.; Liu, H.; Kong, G. Analytical model for evaluating XCC pile shaft capacity in soft soil by incorporating penetration effects. Soils Found. 2018, 58, 1093–1112. [Google Scholar] [CrossRef]
  4. Wang, X.-Q.; Chen, Y.-H.; Lin, F.; Lü, X.-Y.; Zhang, T. Evaluation of ultimate bearing capacity of Y-shaped vibro-pile. J. Central South Univ. Technol. 2008, 15, 186–194. [Google Scholar] [CrossRef]
  5. Ren, L.W.; Guo, W.D.; Yang, Q.W. Analysis on bearing performance of Y-shaped piles under compressive and tensile loading. Proc. Inst. Civ. Eng. Geotech. Eng. 2020, 173, 58–69. [Google Scholar] [CrossRef]
  6. Lv, Y.; Ng, C.W.; Lam, S.Y.; Liu, H.; Ding, X. Comparative study of Y-shaped and circular floating piles in consolidating clay. Can. Geotech. J. 2016, 53, 1483–1494. [Google Scholar] [CrossRef]
  7. Murphy, G.; Doherty, P.; Cadogan, D.; Gavin, K. Field experiments on instrumented winged monopiles. Proc. Inst. Civ. Eng. Geotech. Eng. 2016, 169, 227–239. [Google Scholar] [CrossRef]
  8. Zhou, J.-J.; Wang, K.-H.; Gong, X.-N.; Zhang, R.-H. Bearing capacity and load transfer mechanism of a static drill rooted nodular pile in soft soil areas. J. Zhejiang Univ. A 2013, 14, 705–719. [Google Scholar] [CrossRef] [Green Version]
  9. Zhou, J.-J.; Gong, X.-N.; Wang, K.-H.; Zhang, R.-H. A field study on the behavior of static drill rooted nodular piles with caps under compression. J. Zhejiang Univ. A 2015, 16, 951–963. [Google Scholar] [CrossRef] [Green Version]
  10. Zhou, J.J.; Gong, X.N.; Wang, K.H.; Zhang, R.H. Performance of static drill rooted nodular piles under compression. J. Zhejiang Univ. 2014, 48, 835–842. [Google Scholar]
  11. Zhou, J.J.; Gong, X.N.; Wang, K.H.; Zhang, R.H.; Yan, T.L. A model test on the behavior of a static drill rooted nodular pile under compression. Mar. Georesour. Geotechnol. 2016, 34, 293–301. [Google Scholar] [CrossRef]
  12. Zhou, J.J.; Gong, X.N.; Wang, K.H.; Zhang, R.H. Shaft capacity of the pre-bored grouted planted pile in dense sand. Acta Geotech. 2018, 13, 1227–1239. [Google Scholar] [CrossRef]
  13. Zhou, J.-J.; Yu, J.-L.; Gong, X.-N.; Yan, T.-L. Field tests on behavior of pre-bored grouted planted pile and bored pile embedded in deep soft clay. Soils Found. 2020, 60, 551–561. [Google Scholar] [CrossRef]
  14. Chao, G.; Lu, Z. Frost heaving of foundation pit for seasonal permafrost areas. Mag. Civ. Eng. 2019, 86, 61–71. [Google Scholar]
  15. Zheng, J.J.; Lu, S.Q.; Cao, W.Z.; Jing, D. Numerical simulation of composite rigid-flexible pile-supported retaining wall under the action of high-filled expansive soil. Rock Soil Mech. 2019, 40, 395–402. (In Chinese) [Google Scholar]
  16. Liu, K.F.; Cao, L.L.; Hu, Y.; Xu, J.P. Model test on the deformation behavior of geogrid supported by rigid-flexible piles under static load. In Proceedings of the GeoShanghai International Conference, Singapore, 27–30 May 2018; pp. 338–346. [Google Scholar]
  17. Liu, K.F.; Hu, Y.; Zhu, Y.J.; Wang, H. Effect of Flexible Pile on Rigid Flexible Pile Composite Foundation with Geogrid Reinforced Cushion. Adv. Mater. Res. 2014, 1065, 119–122. [Google Scholar] [CrossRef]
  18. Wang, X.Q.; Zhang, T.; Qi, C.G.; Cui, Y.L.; Zhang, S.M.; Chen, H.S. Field Test on Mechanical Behaviors of Coaxial Rigid-flexible Compound Pile Reinforced Embankment. China J. Highw. Transp. 2016, 29, 13–20. [Google Scholar]
  19. Zhang, H.D.; Wang, Q.H.; Lei, Z.G. Technology and application of jg soil-cement-pile strengthened pile in industrial projects. J. Eng. Geol. 2008, 16, 373–376. (In Chinese) [Google Scholar]
  20. Liu, H.L.; Ren, L.W.; Zheng, H.; Xiao, Y.Z. Full-scale model test on load transfer mechanism for jet grouting soil-cement-pile strengthened pile. Rock Soil Mech. 2010, 31, 1395–1401. (In Chinese) [Google Scholar]
  21. Ren, L.W.; Lu, C.C.; Zhang, J.W.; Xiao, Y.; Zhang, M.X. Model test on uplift bearing behavior of JPP pile under different combinations. Tumu Jianzhu Yu Huanjing Gongcheng J. Civ. 2018, 40, 94–101. (In Chinese) [Google Scholar]
  22. Zhou, D.Q.; Wang, X.L.; Guo, C.Y.; Zhou, J.J.; Wang, K. Research and application of hydraulic fracturing borehole bag sealing technology. IOP Conf. Ser. Earth Environ. Sci. 2021, 781, 022008. [Google Scholar] [CrossRef]
  23. Li, B.; Wang, F.; Fang, H.; Yang, K.J.; Zhang, X.J.; Ji, Y.T. Experimental and numerical study on polymer grouting pretreatment technology in void and corroded concrete pipes. Tunn. Undergr. Space Technol. 2021, 113, 103842. [Google Scholar] [CrossRef]
  24. Yang, W.S.; Yang, C.L. Creative Grouting Method Used in Blocking Water Inflow in a Shaft Wall. Int. Mine Water Assoc. Congr. Mine Water-Manag. Chall. 2011, 129–131. [Google Scholar]
  25. Fu, J.H.; Li, X.L.; Wang, Z.M. A novel sealing material and a bag-grouting sealing method for underground CBM drainage in China. Constr. Build. Mater. 2021, 299, 124016. [Google Scholar] [CrossRef]
  26. Wang, D.; Cao, J. The Experimental Research on the Bag-Grouting-Pile Composite Foundation in Coastal Soft Foundation Treatment. Appl. Mech. Mater. 2013, 275, 1411–1414. [Google Scholar] [CrossRef]
  27. Xu, Z.; Zhu, Z.J.; Fan, Y.X.; Li, K.X.; Chen, X.; Jiang, Q.C.; Liu, R.T. Field Test Research on Film Bag Grouting in Strongly Weathered Stratum Overlying Subway. IOP Conf. Ser. Earth Environ. Sci. 2020, 570, 052054. [Google Scholar] [CrossRef]
  28. Li, Q.; Wu, Z.; Zhang, D. Soil Compaction Effect of Bagged Grouting Piles in Saturated Soft Clay Subgrade. J. Southwest Jiaotong Univ. 2018, 53, 1026–1032. [Google Scholar]
  29. JGJ. JGJ 106-2014. Technical Code for Testing of Building Foundation Piles; China Architecture and Building Press: Beijing, China, 2014; pp. 13–16. (In Chinese) [Google Scholar]
  30. Cui, Y.L.; Qi, C.G.; Zheng, J.H.; Wang, X.Q.; Zhang, S.M. Field test research on post-grouting effect for super-long cast-in-place bored pile in thick soft foundation. Geotech. Geol. Eng. 2021, 39, 4833–4842. [Google Scholar] [CrossRef]
Figure 1. The structure and the components forming the RFCPPEB.
Symmetry 14 00107 g001
Figure 2. Different phases of RFCPPEB construction.
Symmetry 14 00107 g002
Figure 3. Particle size distribution curve of the sand utilized in this study.
Symmetry 14 00107 g003
Figure 4. Loading device used during testing.
Symmetry 14 00107 g004
Figure 5. Reinforcement cages.
Symmetry 14 00107 g005
Figure 6. Rigid bottom-expanded piles.
Symmetry 14 00107 g006
Figure 7. Layout of the strain gauges along with the tested pile (unit: mm).
Symmetry 14 00107 g007
Figure 8. Layout showing the dial indicators placed on top of the pile.
Symmetry 14 00107 g008
Figure 9. Load and settlement relationships for rigid bottom-expanded piles under modeling test.
Symmetry 14 00107 g009
Figure 10. Changes in the axial force of the pile for rigid bottom-expanded piles at different thicknesses of cemented soil: (a) Q = 2 kN; (b) Q = 5 kN.
Symmetry 14 00107 g010
Figure 11. Change rules of shaft resistance for rigid bottom-expanded piles: (a) Q = 2 kN; (b) Q = 5 kN.
Symmetry 14 00107 g011
Figure 12. Pile tip soil pressure distribution curve of rigid bottom-expanded piles.
Symmetry 14 00107 g012
Figure 13. QsQp sharing ratio of rigid bottom-expanded piles.
Symmetry 14 00107 g013
Figure 14. QS curves of RFCPPEB.
Symmetry 14 00107 g014
Figure 15. The curves of the axial forces of pile body based on different thicknesses of cemented soil: (a) Q = 3 kN; (b) Q = 6 kN.
Symmetry 14 00107 g015
Figure 16. Variation laws of shaft resistance for RFCPPEB: (a) Q = 3 kN; (b) Q = 6 kN.
Symmetry 14 00107 g016
Figure 17. Distribution curves of the soil pressure at the tip of RFCPPEB.
Symmetry 14 00107 g017
Figure 18. QSQP sharing ratio of RFCPPEB.
Symmetry 14 00107 g018
Figure 19. Modeling pile for the C1.4 rigid pile with expanded bottom.
Symmetry 14 00107 g019
Figure 20. Pile and soil modeling with ABAQUS finite element software.
Symmetry 14 00107 g020
Figure 21. QS curve comparison of the measured value P30 and the simulated value J30.
Symmetry 14 00107 g021
Figure 22. QS curves of RFCPPEB with different cemented soil thicknesses: (a) h = 25 mm; (b) h = 30 mm; (c) h = 35 mm; (d) h = 40 mm.
Symmetry 14 00107 g022
Table 1. Physical and mechanical properties of the tested sand and clay soils.
Soil TypeDensity, ρ (g/cm3)Internal Angle of Friction, φ Cohesion, c (kPa)Compression Modulus, Es MPaWater Content (%)
Sand1.5139.00.017.422.795
Clay1.9228.224.74.6928.30
Table 2. Testing parameters used for the design of modeling piles.
Test GroupPile No.TypeCement GradeGrade of Cemented Soil around PileL (m)d (mm)D (mm)h (mm)
1C1Rigid expanded bottom pileP42.5-160600
C1.4160840
C1.6160960
C1.81601080
C2.01601200
2P5RFCPPEBP32.51601085
P1016010810
P2016010820
P3016010830
P4016010840
Table 3. Ultimate bearing capacities of the rigid bottom-expanded piles.
Tested PileC1C1.4C1.6C1.8C2.0
Ultimate bearing capacity (kN)2.44.04.05.55.7
Ratio to ultimate bearing capacity of pile C11.001.671.672.292.38
The concrete amount of the pile body (cm3) 2826.03097.33266.83459.13673.8
Ratio to pile body concrete amount of pile C11.001.101.161.221.30
Concrete ultimate bearing capacity per unit volume of pile (N/cm3)0.851.291.221.591.55
Ratio to concrete ultimate bearing capacity per unit volume of pile C11.001.521.441.871.82
Table 4. Comparative analysis of the ultimate bearing capacities of RFCPPEB.
MethodsTested Pile
C1.8P5P10P20P30P40
Ultimate bearing capacity of each pile (kN)5.55.76.06.27.57.7
Comparison of the ultimate bearing capacity of each pile with C1.8 (kN)0+0.2+0.5+0.7+2+2.2
Ratio of the increased bearing capacity of each pile to the ultimate bearing capacity of C1.8 03.6%9.1%12.7%36.4%40.0%
Ratio of the cemented soil thickness around piles to the pile diameter-1/121/61/31/22/3
Cemented soil content around piles (m3)00.00070.00140.00290.00470.0065
Ratio of the cemented soil content around pile P5 -1.002.004.146.719.29
Bearing capacity provided by the cemented soil per unit volume around piles (kN/m3)-285.7357.1241.4425.5338.5
Ratio of the ultimate bearing capacity provided by cemented soil per unit volume around pile P5 -1.001.250.841.491.18
Table 5. Values of parameters used for the modeling test.
MaterialsQuality Density (kg/mm3)Elastic Modulus Es (MPa)Poisson’s
Ratio
Cohesion c (kPa)Internal Friction
Angle φ (°)
Sandy soil1.51 × 10−6100.183530
Cemented soil2.15 × 10−61500.3030018
C30 cement2.5 × 10−630,0000.23//
Table 6. The dimensions of the finite element model for the two types of pile.
Tested PilePile Type for the Rigid Pile with Expanded Bottom d (mm)l (m)D (mm)h (mm)
H0C1.4601840
H258425
H308430
H358435
H408440
I0C1.6601960
I259625
I309630
I359635
I409640
J0C1.86011080
J2510825
J3010830
J3510835
J4010840
K0C2.06011200
K2512025
K3012030
K3512035
K4012040
Table 7. Ultimate bearing capacity of RFCPPEB.
Thickness of Cemented Soil, h25 mm30 mm35 mm40 mm
Pile Type
C1.46.5 kN7.0 kN7.5 kN7.5 kN
C1.67.0 kN7.5 kN8.5 kN8.5 kN
C1.87.5 kN8.0 kN9.5 kN9.5 kN
C2.07.5 kN8.0 kN9.5 kN9.5 kN
Publisher’s Note: MDPI stays neutral with regard to jurisdictional claims in published maps and institutional affiliations.

