
Neurofunctional Symmetries and Asymmetries during Voluntary out-of- and within-Body Vivid Imagery Concurrent with Orienting Attention and Visuospatial Detection

 ,
,
Abstract
1. Introduction
1.1. Background: Out-of-Body vs. within-Body Experience in Visual Mental Imagery, Neural and Phenomenological Aspects
1.2. Functional Asymmetry in Visual Mental Imagery
1.3. The Interaction between Visual Imagery and Externally Directed Attention
EEG Findings
1.4. ERPs of Visual Mental Imagery
Converging Findings from fMRI Research
1.5. The Interaction between Visual Mental Imagery and Visuospatial Perception
1.6. The Present Study: Attention-Perception-Imagery Interactions and Functional Asymmetry
2. Materials and Methods
2.1. Participants
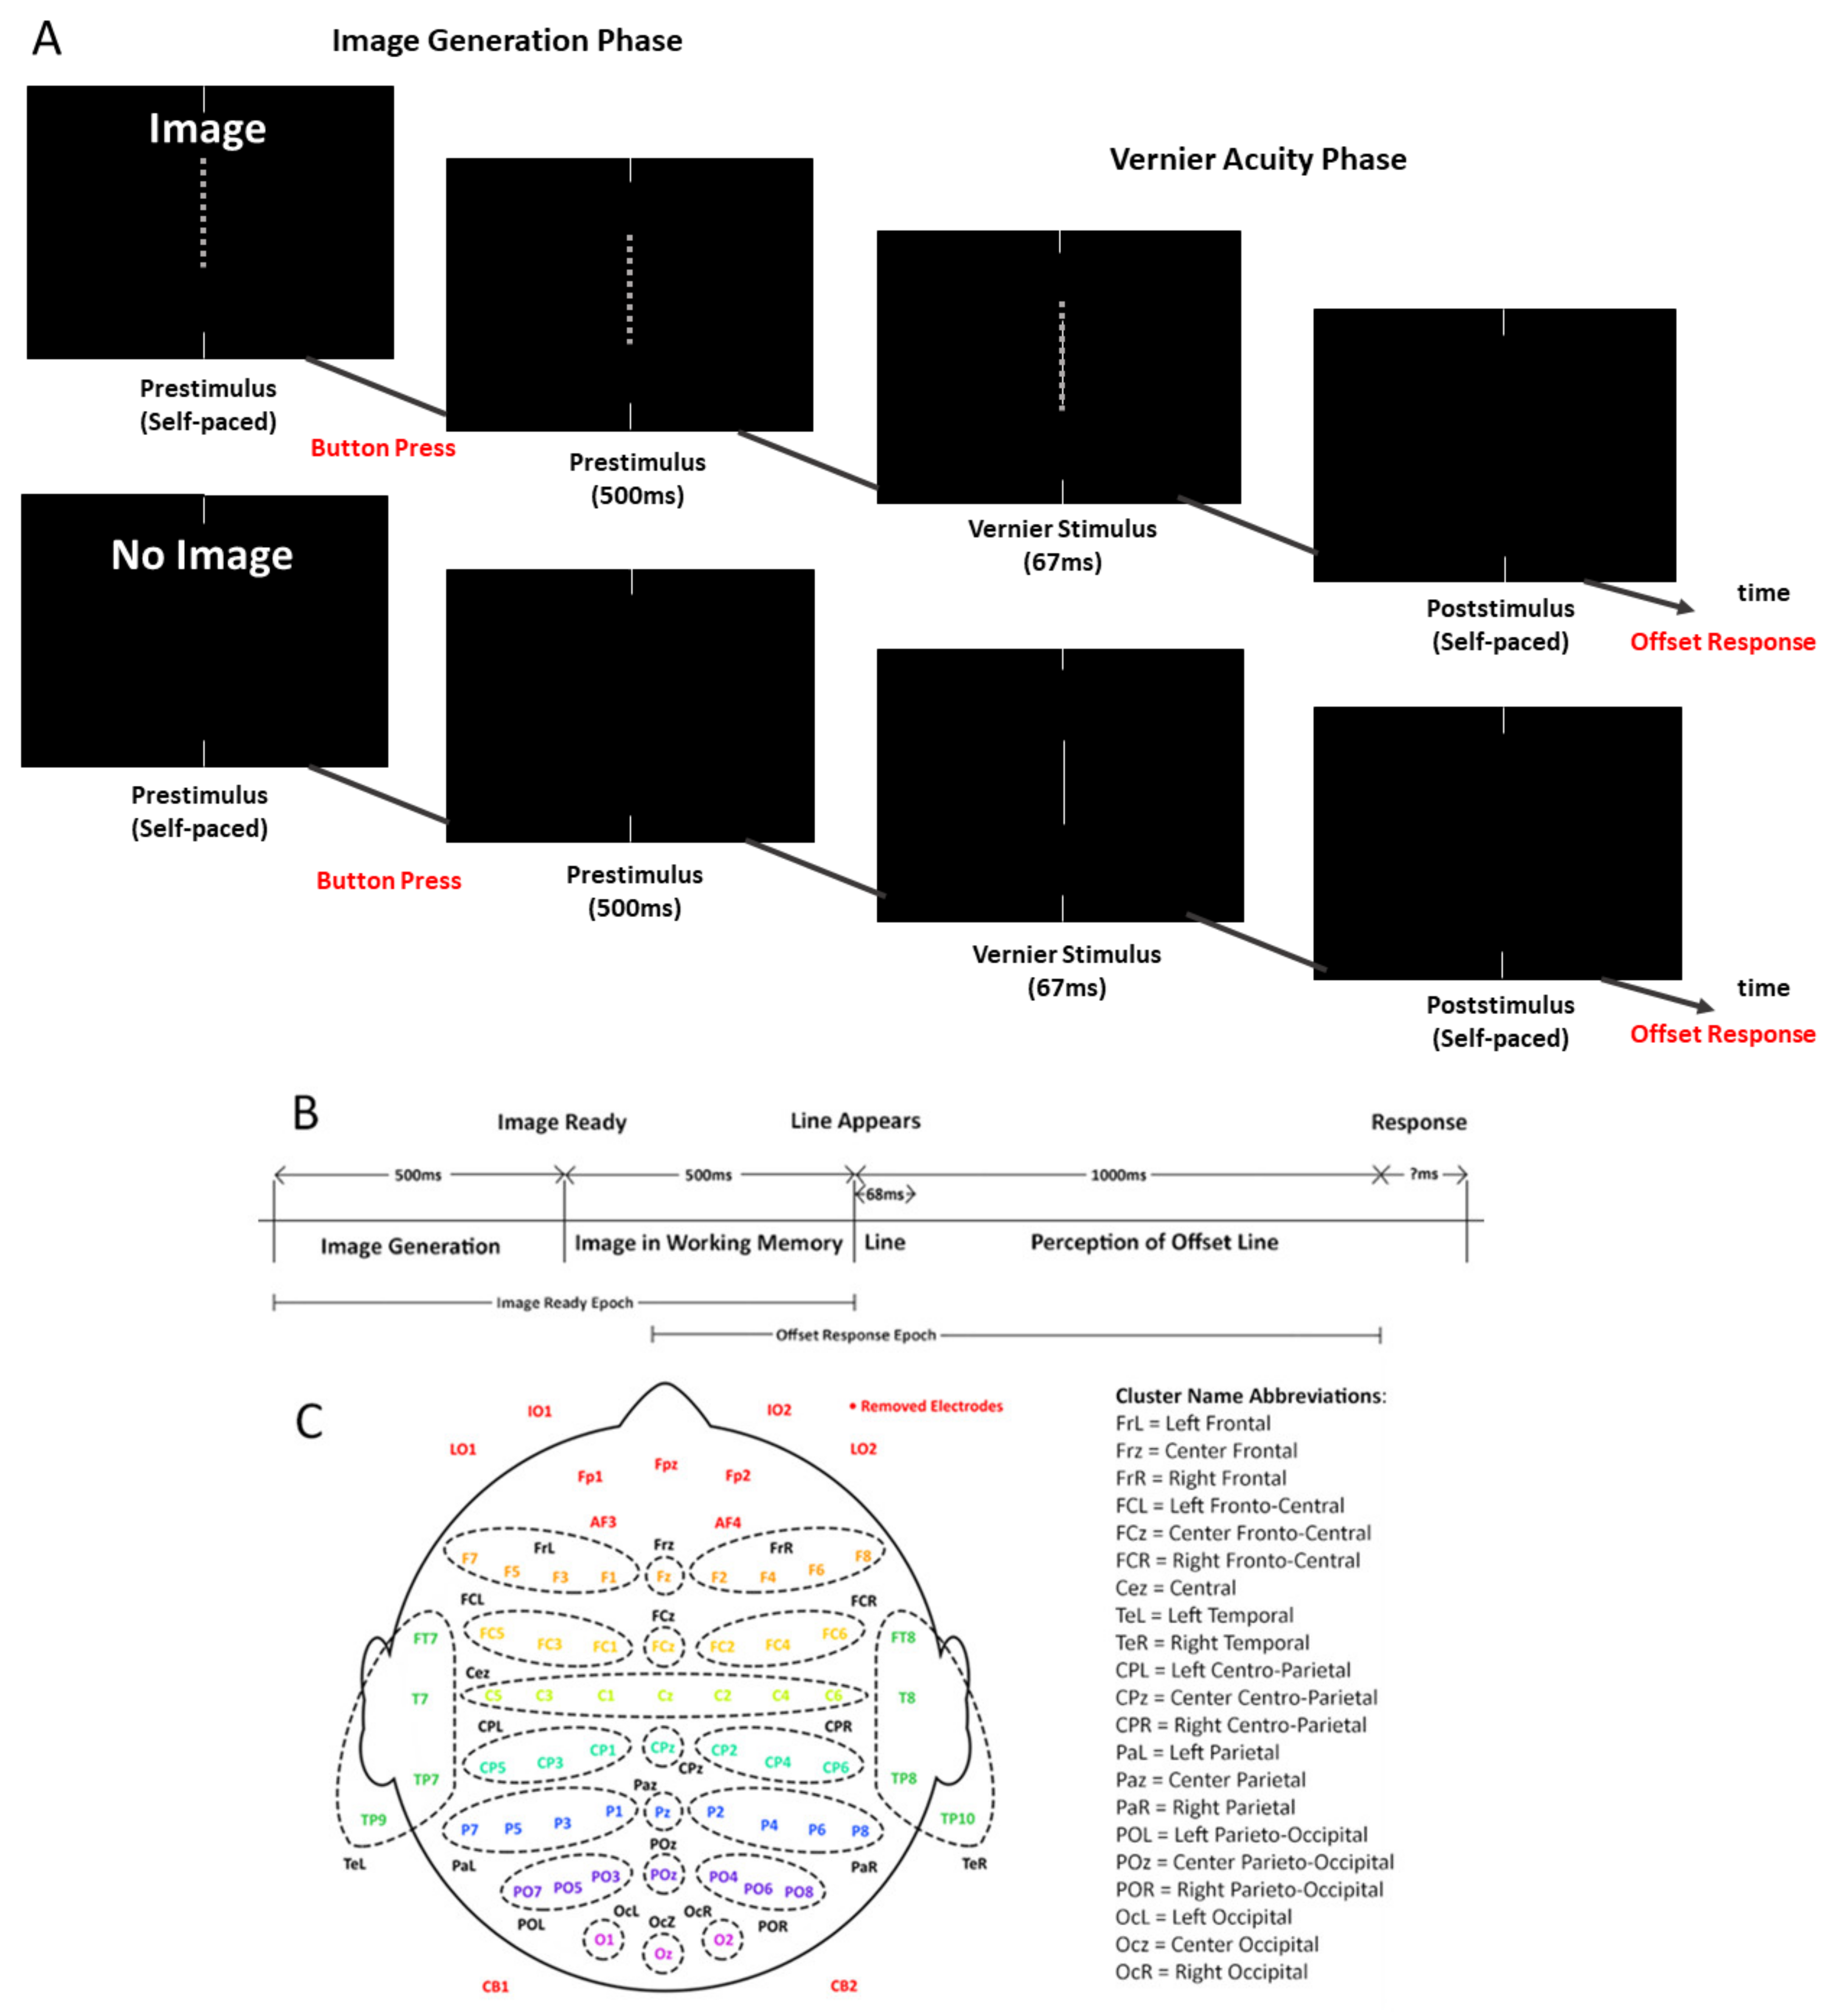
2.2. Task and Apparatus
2.3. Calculation of Acuity Reduction
2.4. EEG Acquisition and Preprocessing
Participant Setup and EEG Procedure
2.5. ERP Processing and Analysis
2.5.1. ERP Epoching and Clustering
2.5.2. ERP Statistical Permutations Analysis
2.5.3. False Discover Rate Correction
2.6. Partial Least Squares Analysis
2.7. Event-Related Frequency Band Power (ERBP)
2.8. Source Dipole Localization Analysis
2.9. Statistical Analysis Strategy
3. Results
3.1. Hyperacuity Behavioural Performance
3.2. Event-Related Potentials
3.2.1. Image Generation Phase
3.2.2. Visuospatial Detection
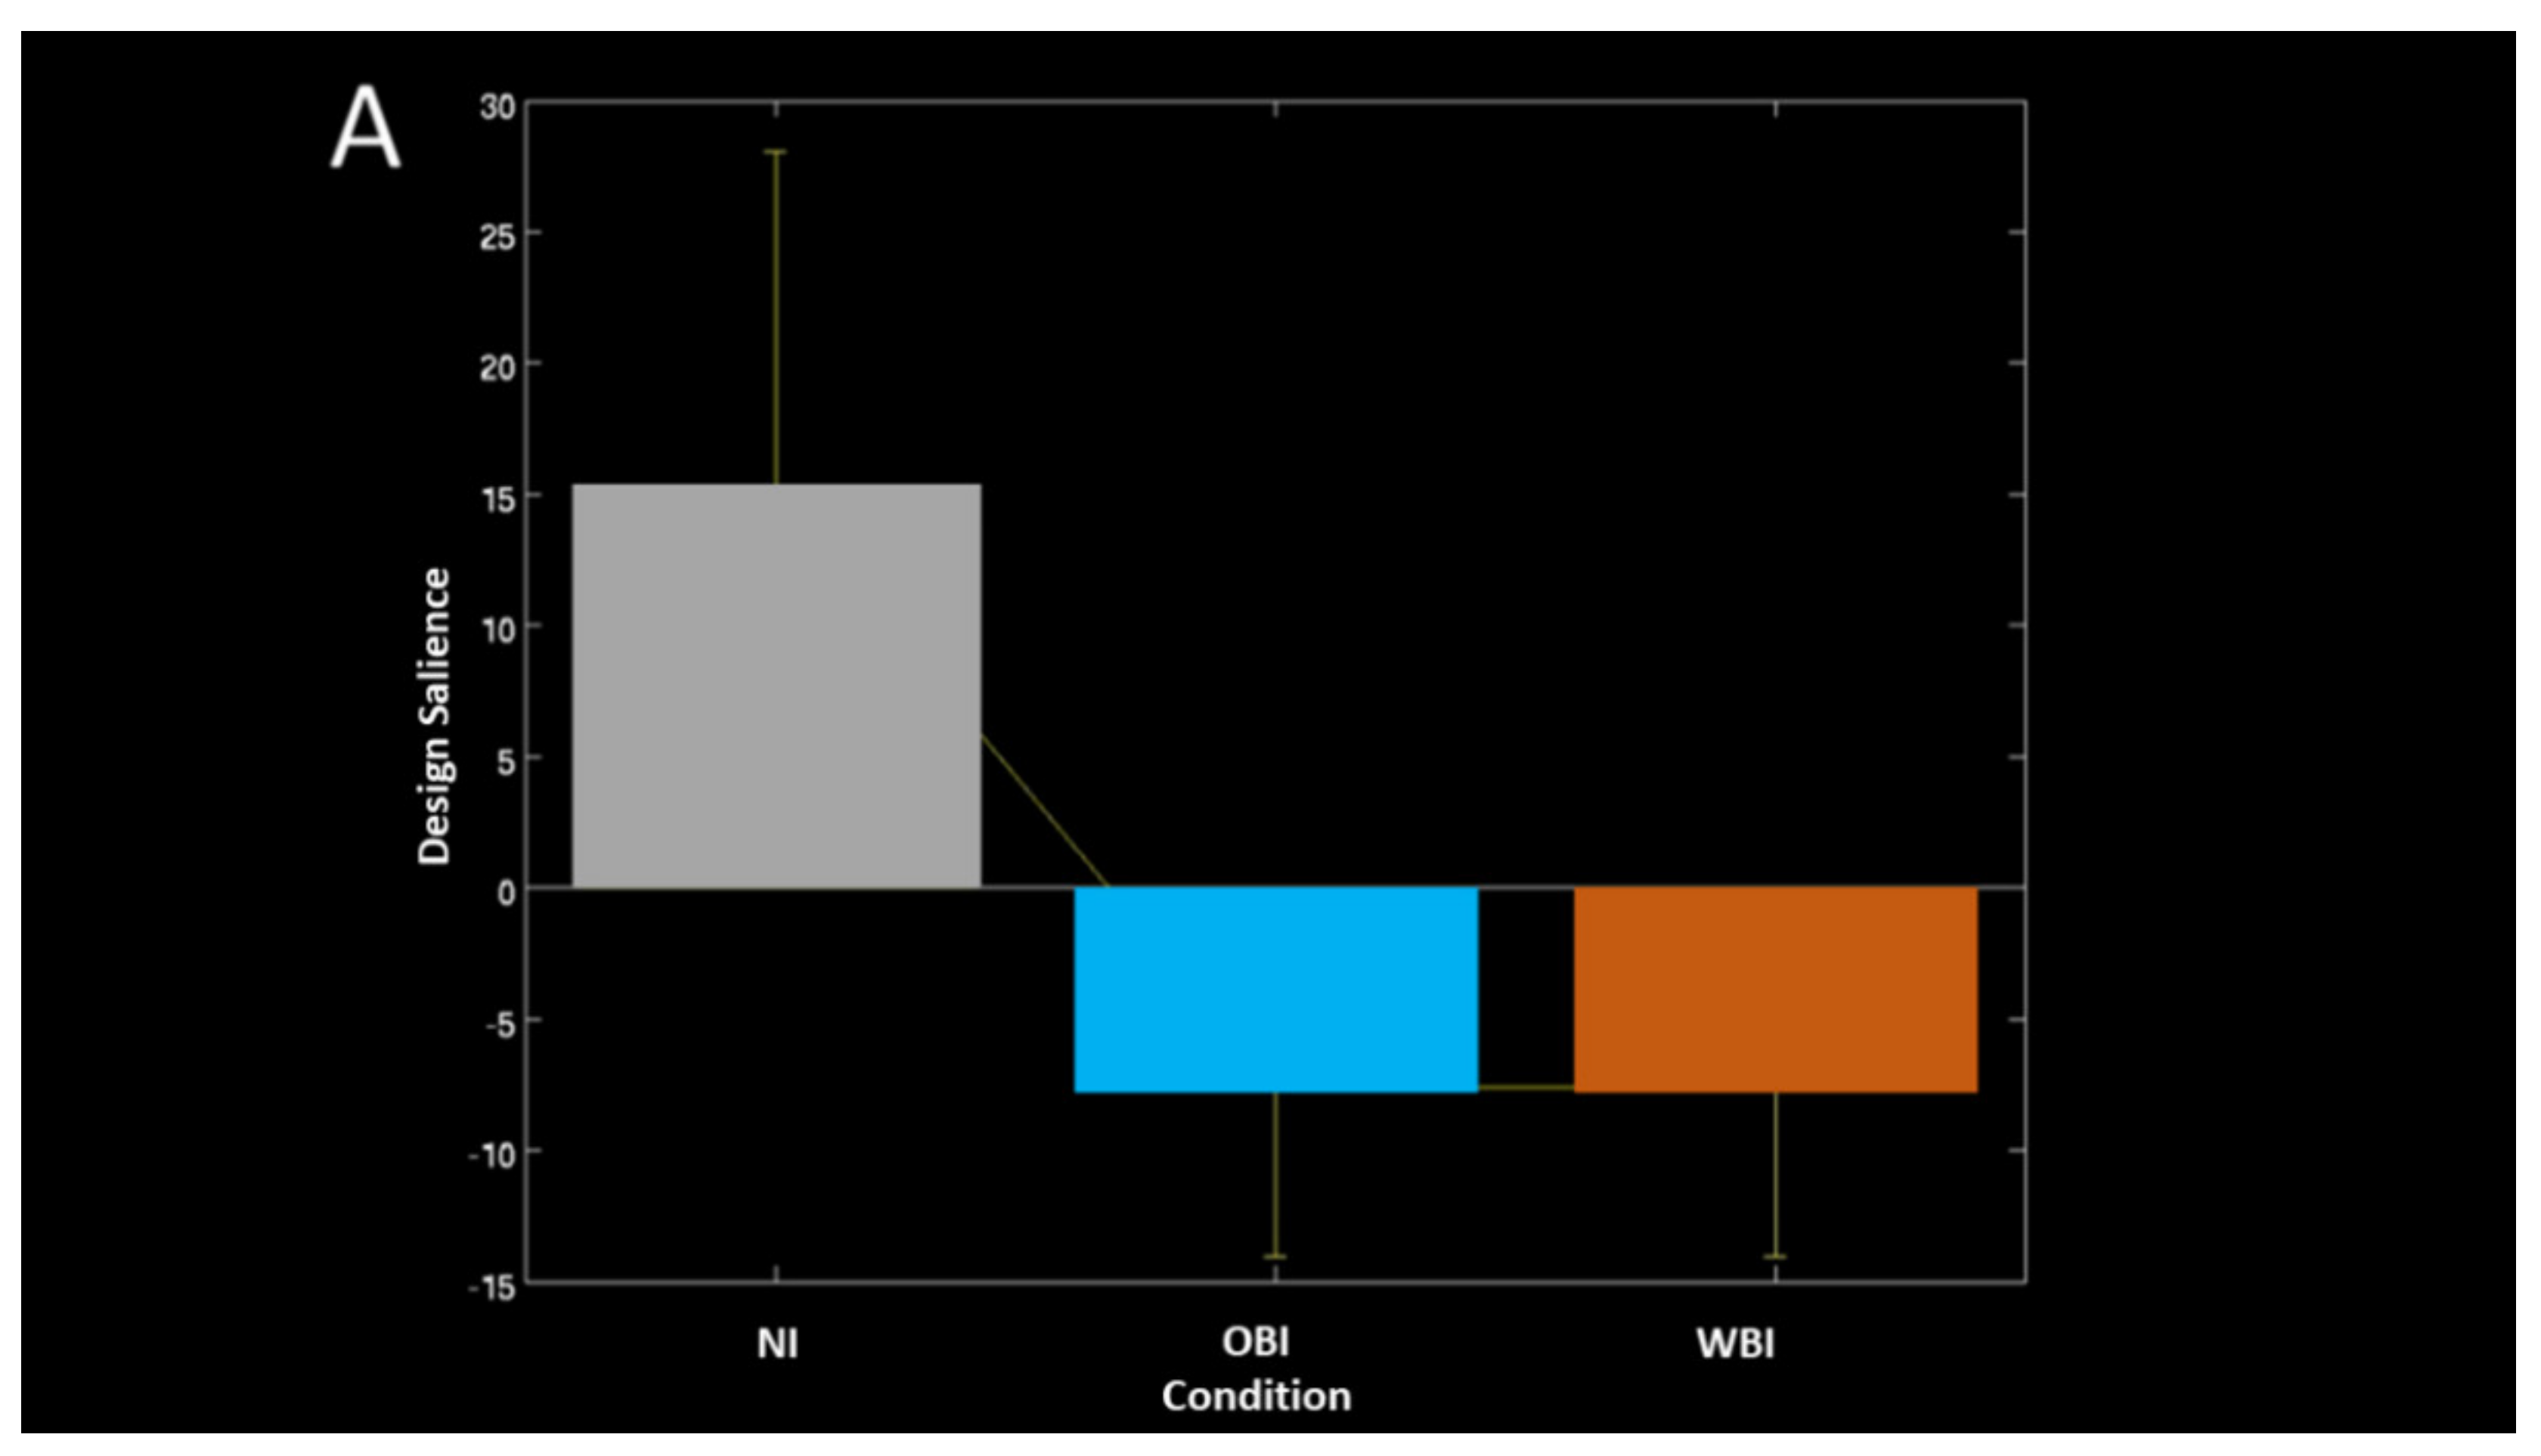
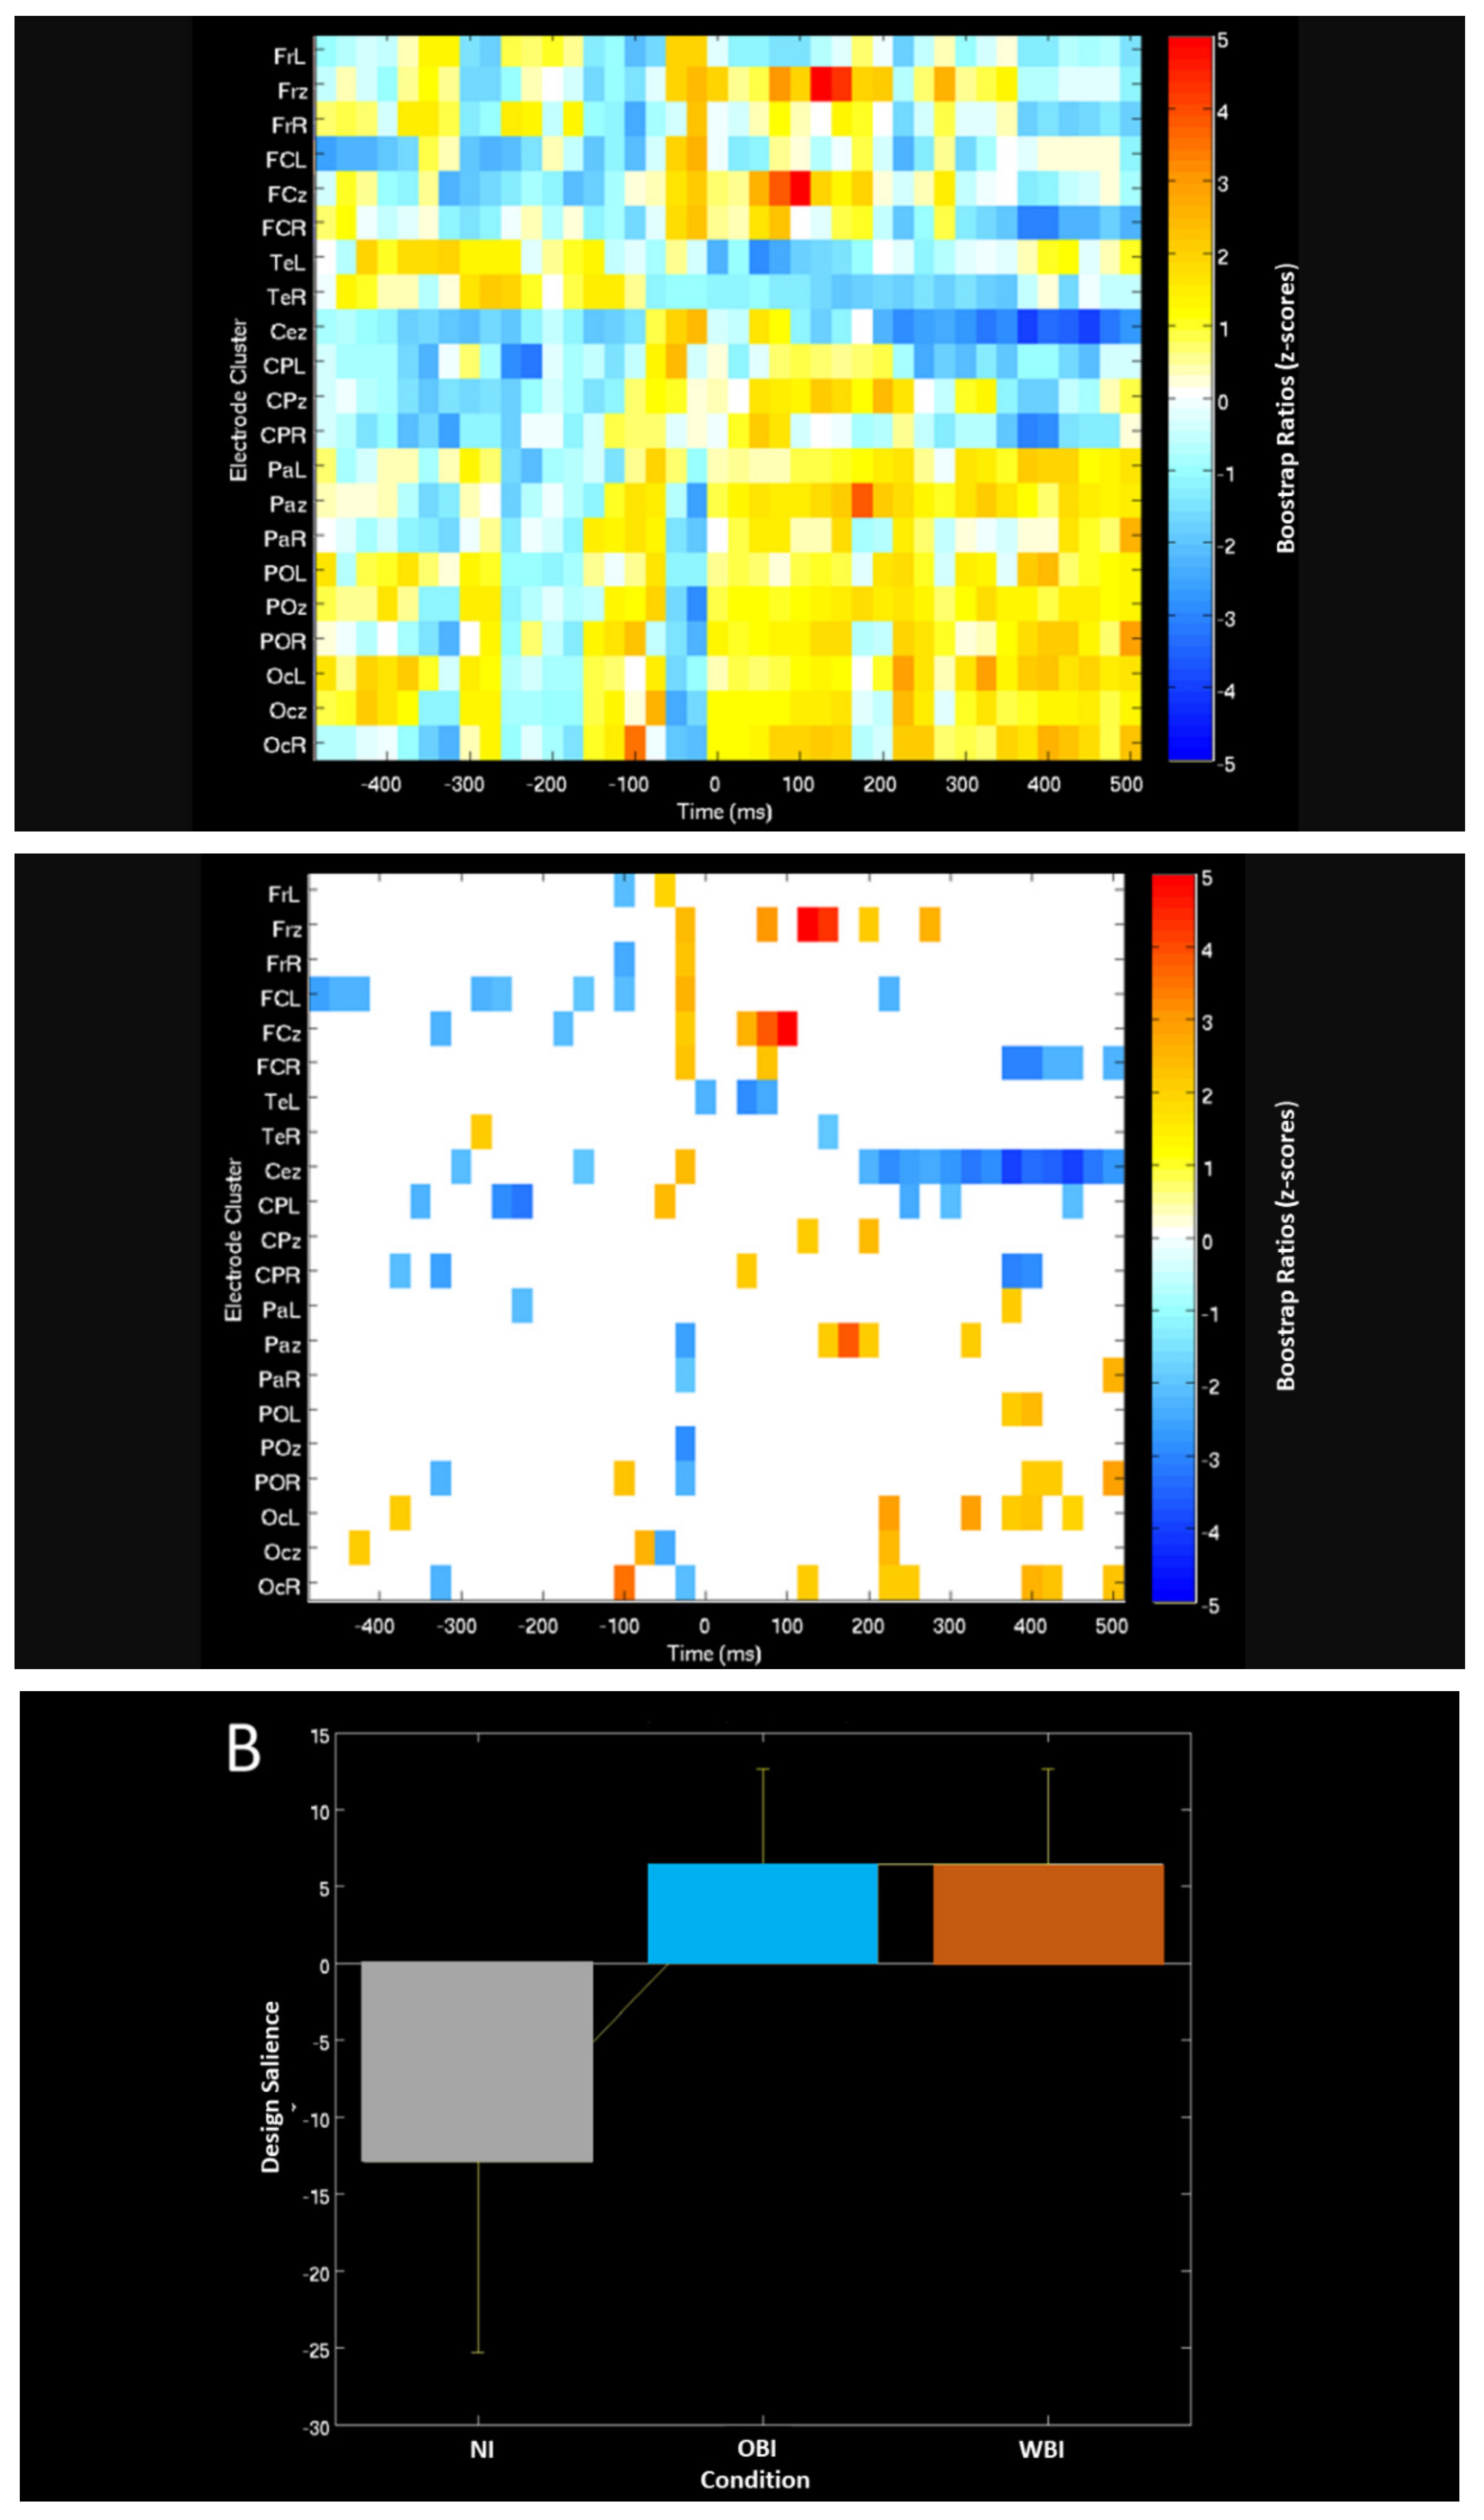
3.3. Partial Least Squares (PLS)
3.3.1. ERPs of Task-Related Imagery-Baseline Contrasts
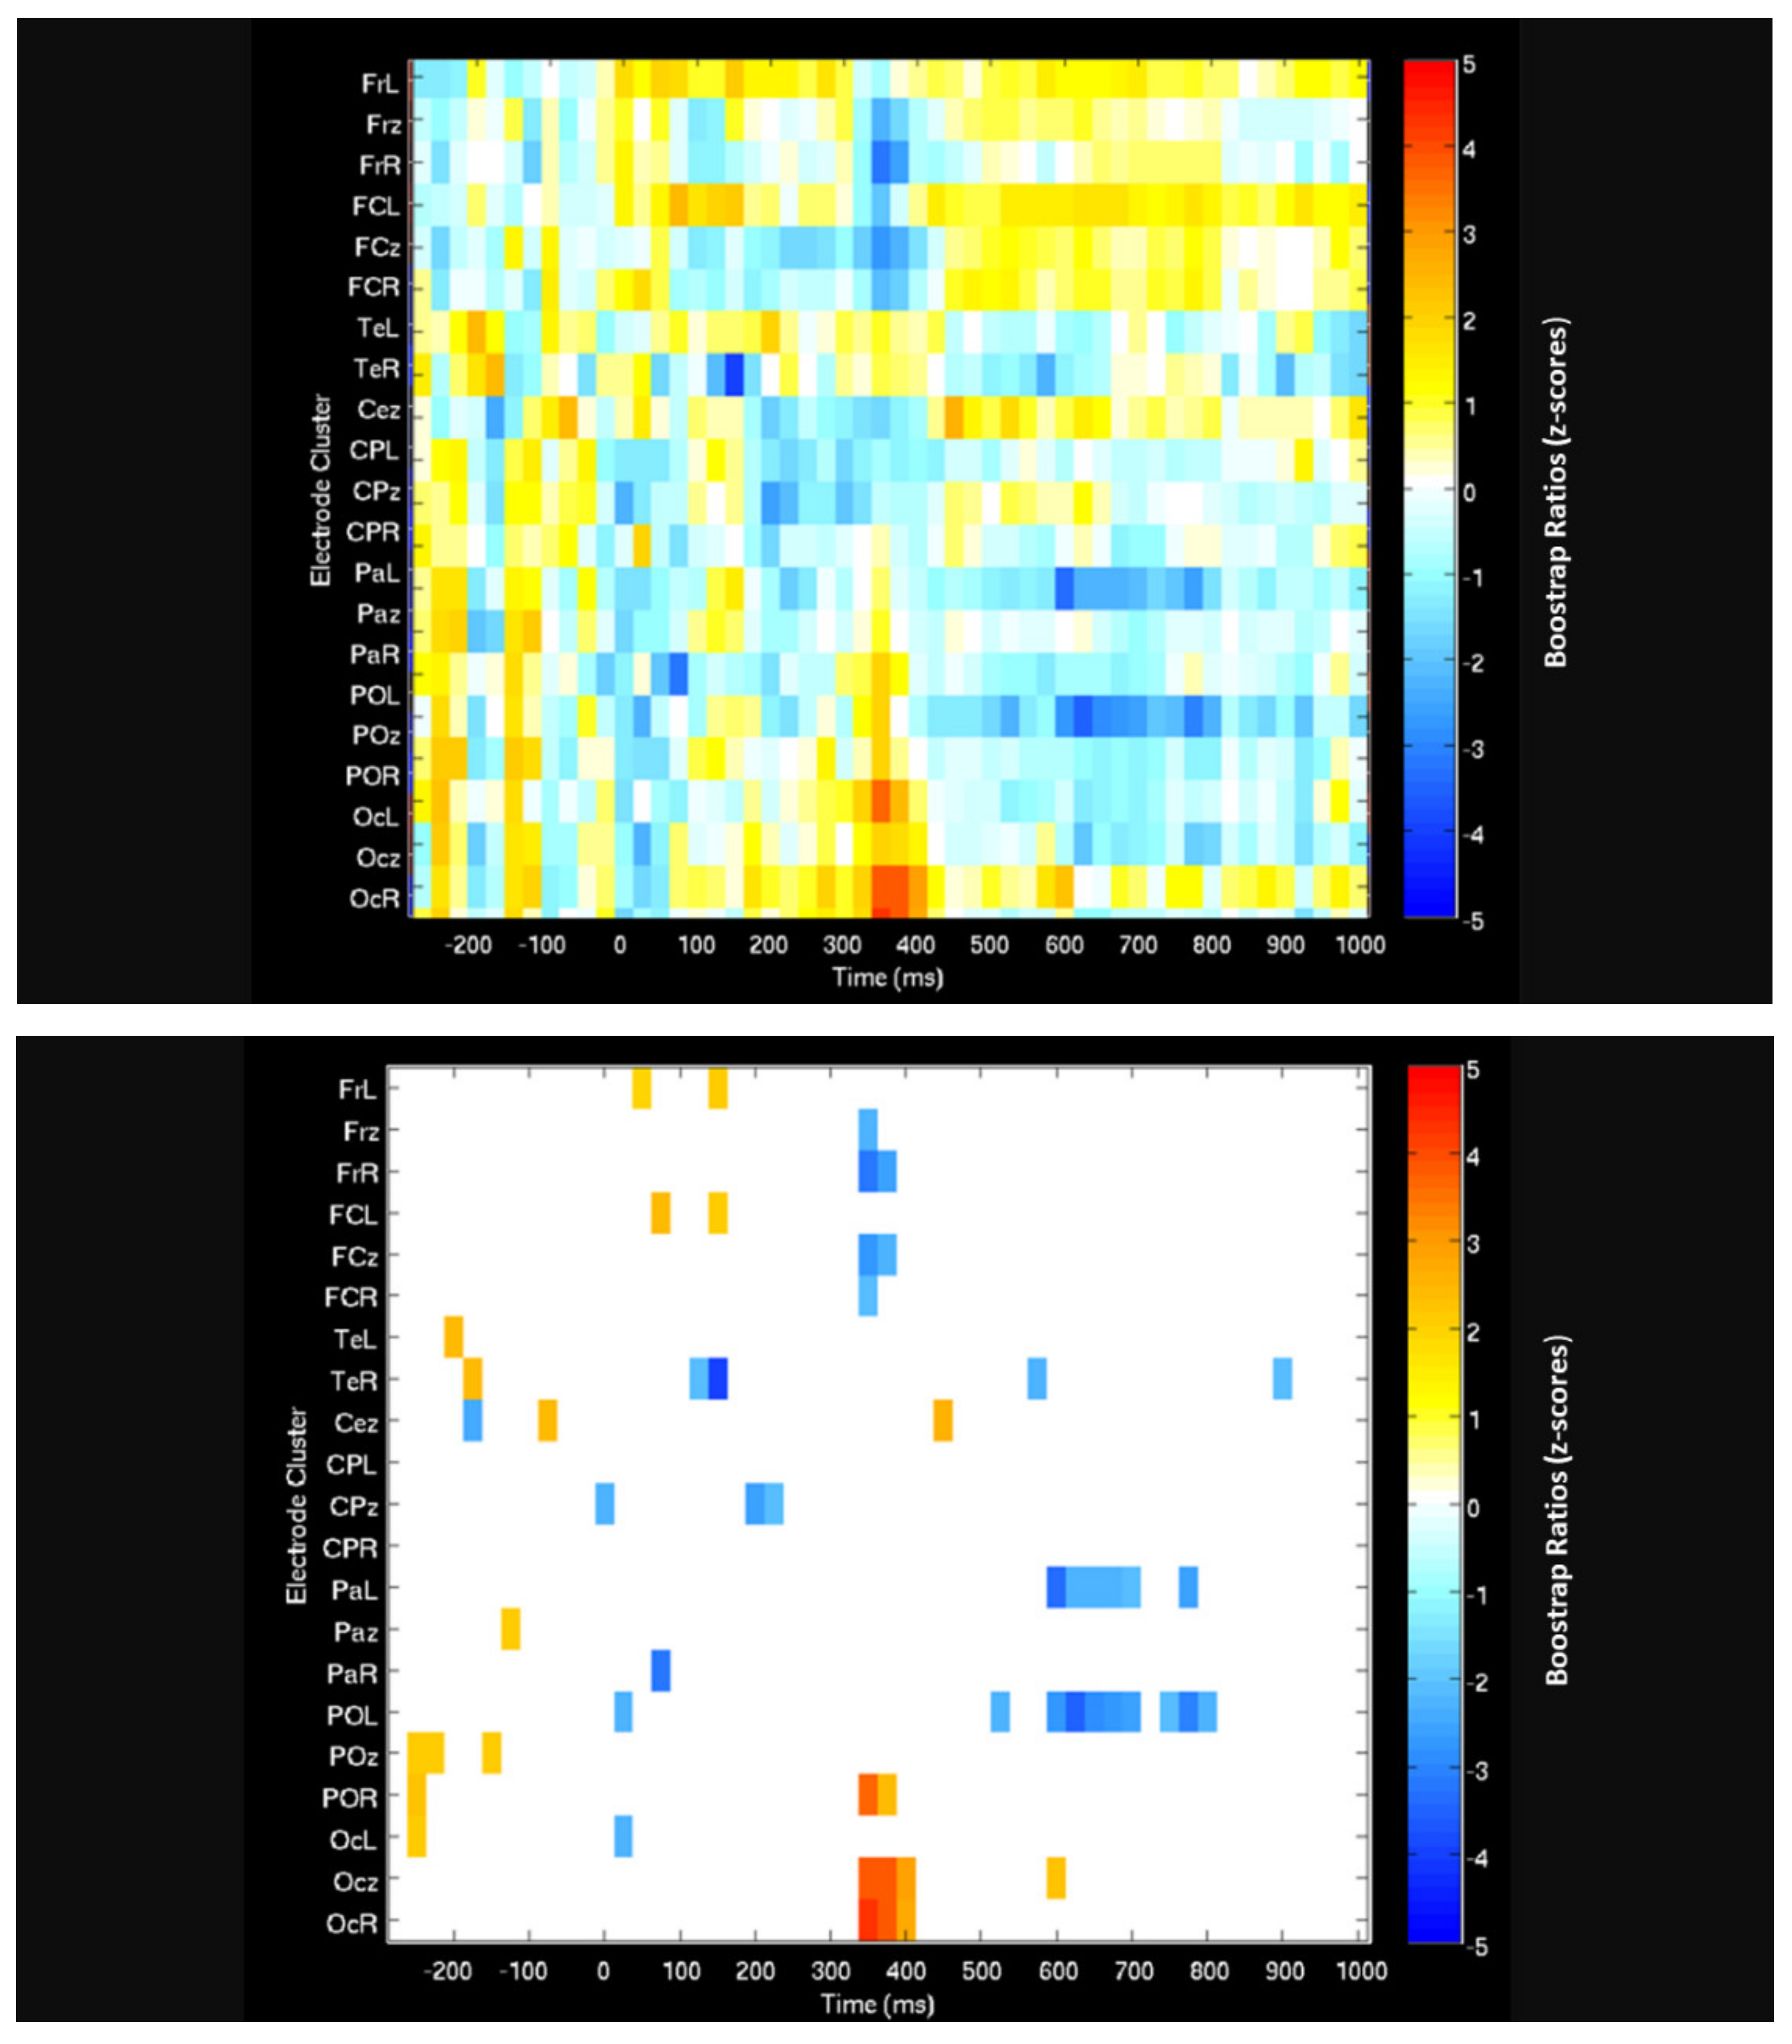
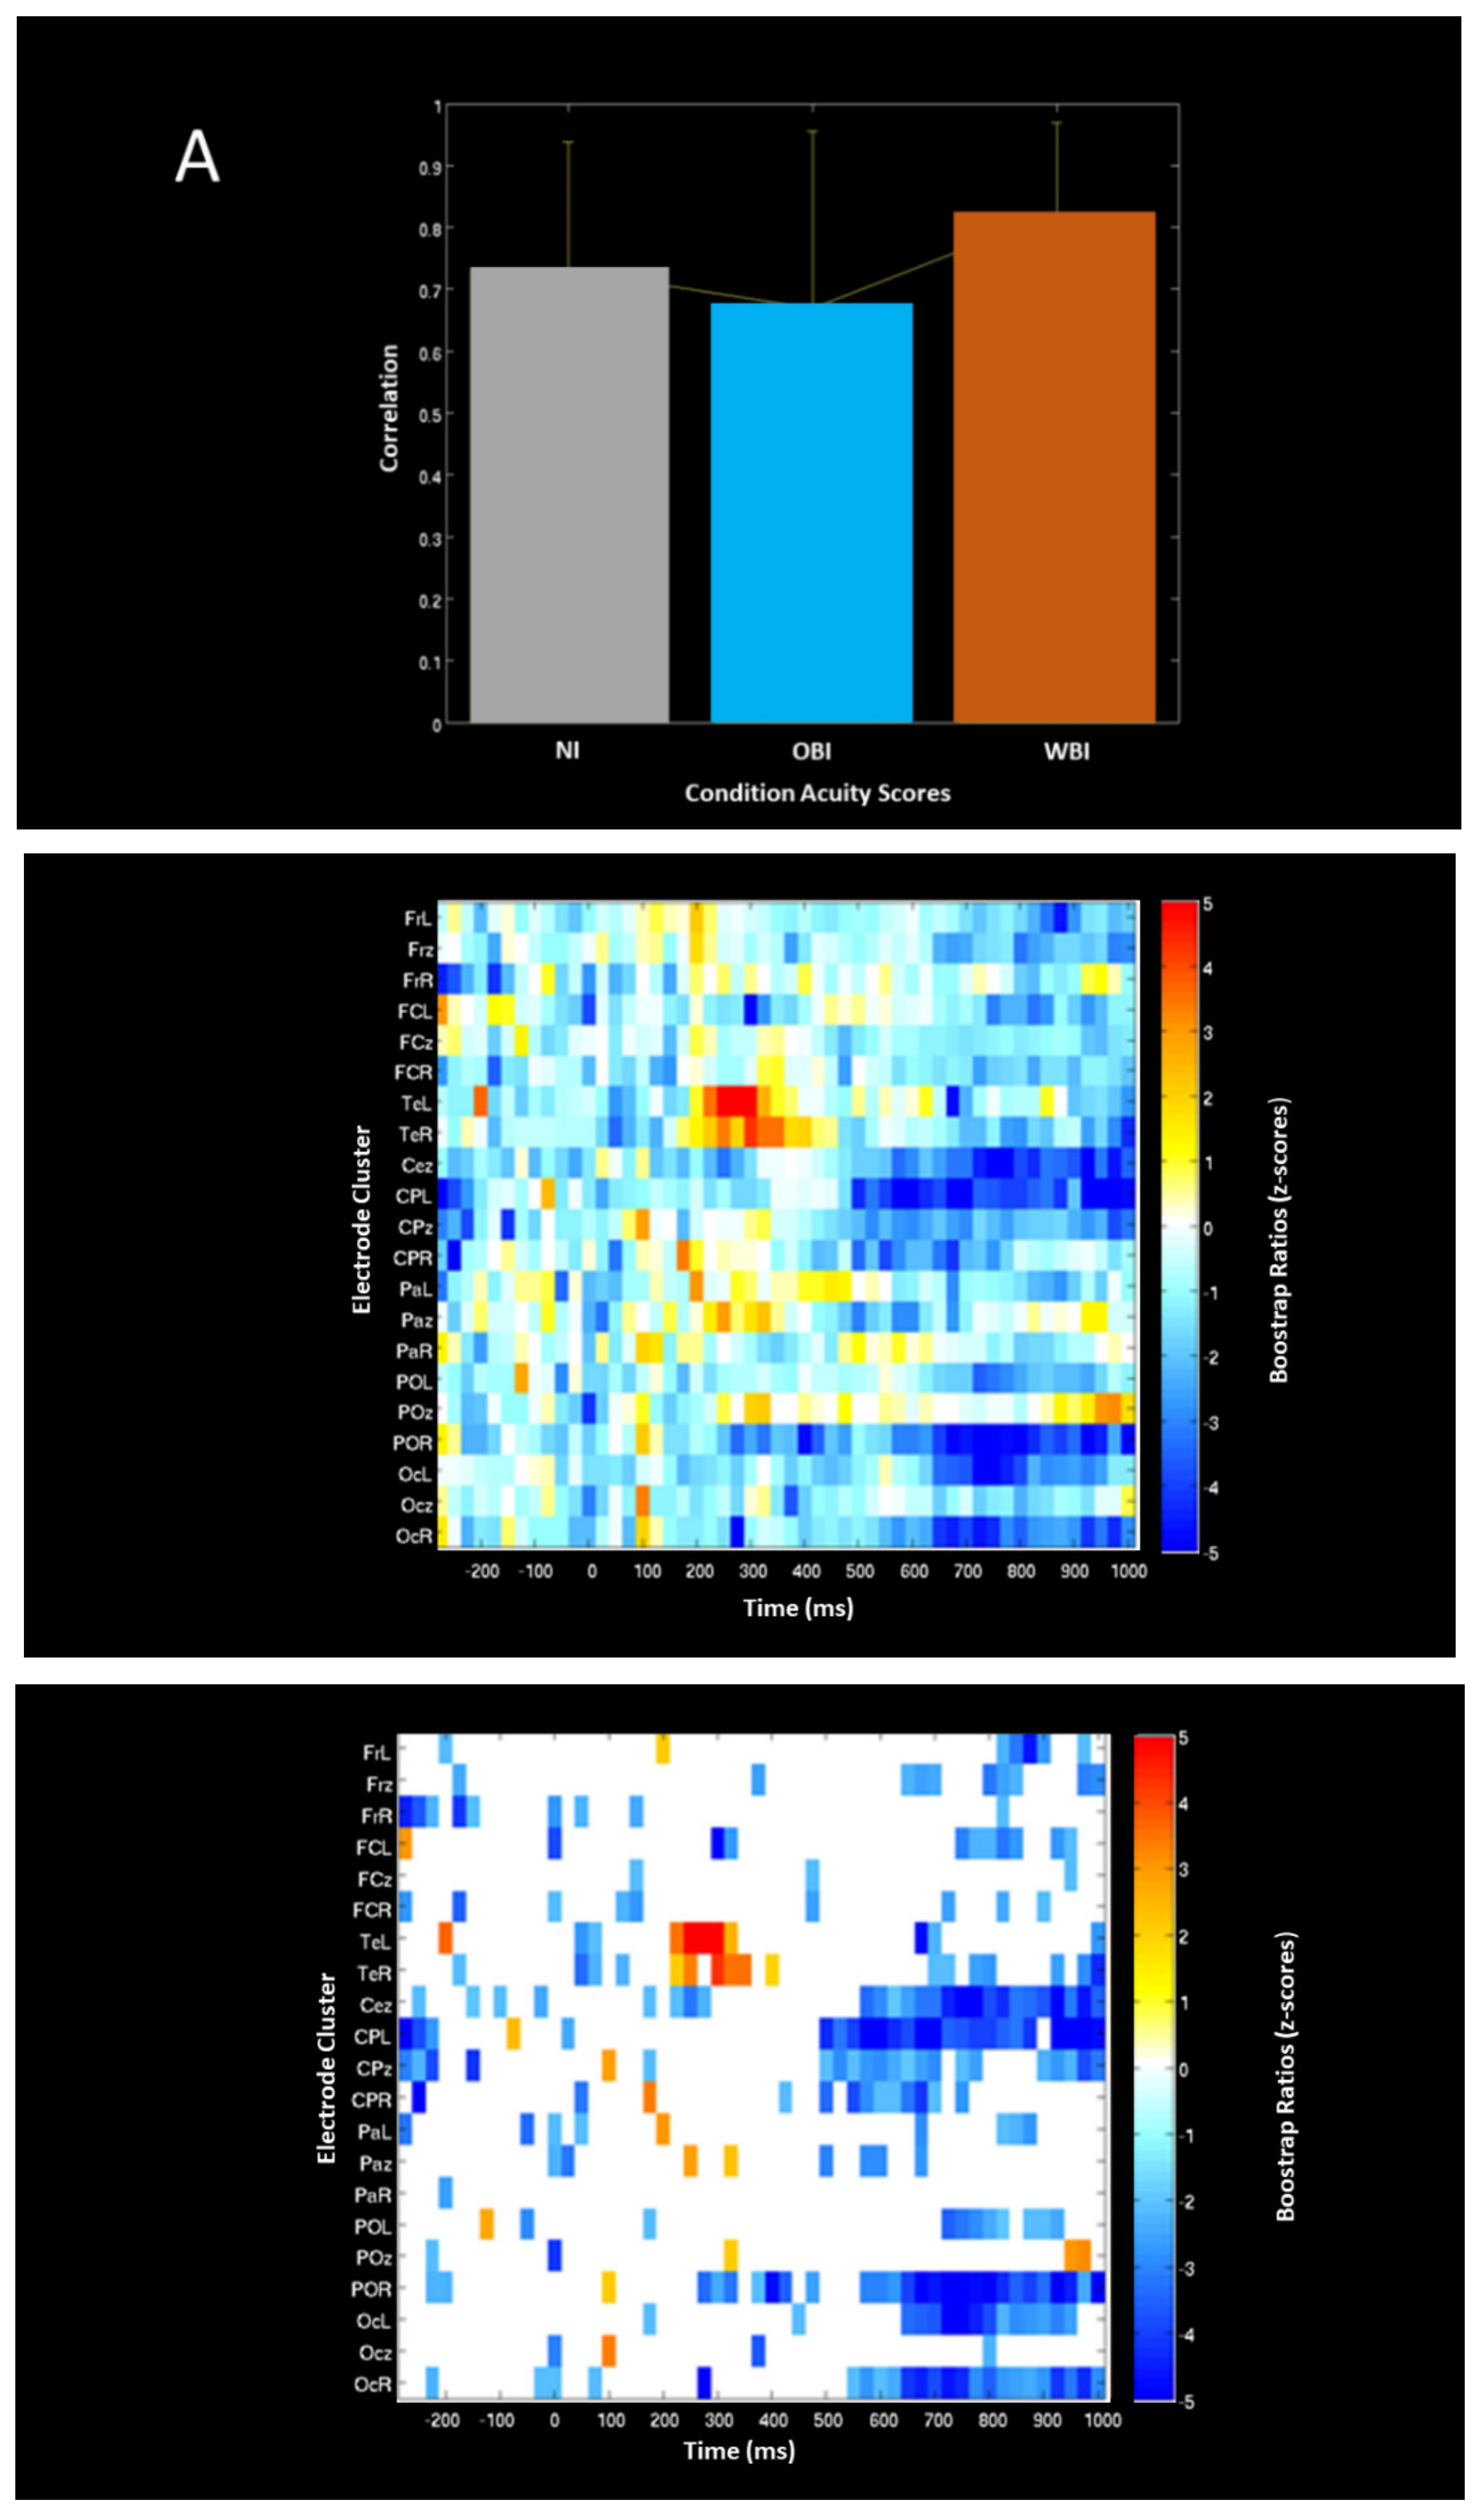
3.3.2. Correlation between ERPs and Vernier Acuity Performance
3.4. Event-Related Band Power PLS Analysis
3.4.1. Image Generation Phase
3.4.2. Visuospatial Detection
3.5. Dipole Source Localization Analysis
4. Discussion
4.1. Neural Differentiation between Out-Of-Body (OBI) and Within-Body (WBI) Imagery
4.2. Findings of Neural Activity Hemispheric A/Symmetries and Their Functional Implications
5. Conclusions
Author Contributions
Funding
Institutional Review Board Statement
Informed Consent Statement
Data Availability Statement
Acknowledgments
Conflicts of Interest
References
- Hebb, D.O. Concerning imagery. Psychol. Rev. 1968, 75, 466–477. [Google Scholar] [CrossRef] [PubMed]
- Edelman, G.M. Bright Air, Brilliant Fire: On the Matter of the Mind; Basic Books: New York, NY, USA, 1992. [Google Scholar]
- Kosslyn, S.M.; Behrmann, M.; Jeannerod, M. The cognitive neuroscience of mental imagery. Neuropsychologia 1995, 33, 1335–1344. [Google Scholar] [CrossRef]
- Baddeley, A.D.; Andrade, J. Working memory and the vividness of imagery. J. Exp. Psychol. Gen. 2000, 129, 126–145. [Google Scholar] [CrossRef] [PubMed]
- Reeder, R.R. Individual differences shape the content of visual representations. Vis. Res. 2017, 141, 266–281. [Google Scholar] [CrossRef] [PubMed]
- Runge, M.; Cheung, M.W.; D’Angiulli, A. Meta-analytic comparison of trial-versus questionnaire-based vividness reportability across behavioral, cognitive and neural measurements of imagery. Neurosci. Conscious. 2017, 2017, nix006. [Google Scholar] [CrossRef] [PubMed]
- Haustein, S.; Vellino, A.; D’Angiulli, A. Insights from a Bibliometric Analysis of Vividness and Its Links with Consciousness and Mental Imagery. Brain Sci. 2020, 10, 41. [Google Scholar] [CrossRef]
- Sherrington, C. The Integrative Action of the Nervous System; Yale University Press: Yale, CT, USA, 1906. [Google Scholar]
- Velmans, M. Understanding Consciousness; Routledge/Taylor & Francis: London, UK, 2009. [Google Scholar]
- Feinberg, T.E. Neuroontology, neurobiological naturalism, and consciousness: A challenge to scientific reduction and a solution. Phys. Life Rev. 2012, 9, 13–34. [Google Scholar] [CrossRef] [PubMed]
- Thompson, E. Representationalism and the phenomenology of mental imagery. Synthese 2008, 160, 397–415. [Google Scholar] [CrossRef]
- Thomas, N.J.T. Mental Imagery. In The Stanford Encyclopedia of Philosophy (Spring 2021 Edition); Edward, N.Z., Ed.; Metaphysics Research Lab, Stanford University: Stanford, CA, USA, 2021; Available online: https://plato.stanford.edu/archives/spr2021/entries/mental-imagery (accessed on 20 August 2021).
- Damasio, A. Self Comes to Mind: Constructing the Conscious Brain; Pantheon/Random House: New York, NY, USA, 2010. [Google Scholar]
- Damasio, A.R. The Strange Order of Things: Life, Feeling, and the Making of Cultures; Vintage Books: New York, NY, USA, 2019. [Google Scholar]
- Ceunen, E.; Vlaeyen, J.W.; Van Diest, I. On the origin of interoception. Front. Psychol. 2016, 7, 743. [Google Scholar] [CrossRef]
- Craig, A.D. How do you feel? Interoception: The sense of the physiological condition of the body. Nat. Rev. Neurosci. 2002, 3, 655–666. [Google Scholar] [CrossRef]
- Barrett, L.F.; Simmons, W.K. Interoceptive predictions in the brain. Nat. Rev. Neurosci. 2015, 16, 419–429. [Google Scholar] [CrossRef] [PubMed]
- Critchley, H.D.; Wiens, S.; Rotshtein, P.; Öhman, A.; Dolan, R.J. Neural systems supporting interoceptive awareness. Nat. Neurosci. 2004, 7, 189–195. [Google Scholar] [CrossRef] [PubMed]
- Seth, A.K. Interoceptive inference, emotion, and the embodied self. Trends Cogn. Sci. 2013, 17, 565–573. [Google Scholar] [CrossRef]
- Barrett, L.F.; Bar, M. See it with feeling: Affective predictions during object perception. Philos. Trans. R. Soc. Lond. B Biol. Sci. 2009, 364, 1325–1334. [Google Scholar] [CrossRef]
- Bastos, A.M.; Usrey, W.M.; Adams, R.A.; Mangun, G.R.; Fries, P.; Friston, K.J. Canonical Microcircuits for Predictive Coding. Neuron 2012, 76, 695–711. [Google Scholar] [CrossRef]
- Mechelli, A.; Price, C.J.; Friston, K.J.; Ishai, A. Where bottom-up meets top-down: Neuronal interactions during perception and imagery. Cereb. Cortex 2004, 14, 1256–1265. [Google Scholar] [CrossRef]
- Dijkstra, N.; Bosch, S.E.; Gerven, M.A.V. Vividness of Visual Imagery Depends on the Neural Overlap with Perception in Visual Areas. J. Neurosci. 2017, 37, 1367–1373. [Google Scholar] [CrossRef]
- Bone, M.B.; St-Laurent, M.; Dang, C.; McQuiggan, D.A.; Ryan, J.D.; Buchsbaum, B.R. Eye Movement Reinstatement and Neural Reactivation during Mental Imagery. Cereb. Cortex 2019, 29, 1075–1089. [Google Scholar] [CrossRef]
- Azzalini, D.; Rebollo, I.; Tallon-Baudry, C. Visceral signals shape brain dynamics and cognition. Trends Cogn. Sci. 2019, 23, 488–509. [Google Scholar] [CrossRef] [PubMed]
- Dadds, M.R.; Bovbjerg, D.H.; Redd, W.H.; Cutmore, T.R. Imagery in human classical conditioning. Psychol. Bull. 1997, 122, 89. [Google Scholar] [CrossRef] [PubMed]
- Kveraga, K.; Boshyan, J.; Bar, M. Magnocellular projections as the trigger of top down facilitation in recognition. J. Neurosci. 2007, 27, 13232–13240. [Google Scholar] [CrossRef] [PubMed]
- Bäckryd, E. Pain as the perception of someone: An analysis of the interface between pain medicine and philosophy. Health Care Anal. 2019, 27, 13–25. [Google Scholar] [CrossRef] [PubMed]
- Ocklenburg, S.; Güntürkün, O. Hemispheric asymmetries: The comparative view. Front. Psychol. 2012, 3, 1–9. [Google Scholar] [CrossRef]
- Marshall, J.C.; Fink, G.R. Spatial cognition: Where we were and where we are. Neuroimage 2001, 14, 2–7. [Google Scholar] [CrossRef]
- Olulade, O.A.; Seydell-Greenwald, A.; Chambers, C.E.; Turkeltaub, P.E.; Dromerick, A.W.; Berl, M.M.; Gaillard, W.D.; Newport, E.L. The neural basis of language development: Changes in lateralization over age. Proc. Natl. Acad. Sci. USA 2020, 117, 23477–23483. [Google Scholar] [CrossRef]
- O’Regan, L.; Serrien, D.J. Individual Differences and Hemispheric Asymmetries for Language and Spatial Attention. Front. Hum. Neurosci. 2018, 12, 380. [Google Scholar] [CrossRef]
- Demareva, V.; Mukhina, E.; Bobro, T.; Abitov, I. Does Double Biofeedback Affect Functional Hemispheric Asymmetry and Activity? A Pilot Study. Symmetry 2021, 13, 937. [Google Scholar] [CrossRef]
- Liu, J. Hemispheric asymmetries in visual mental imagery. Brain Struct Funct. 2021. [Google Scholar] [CrossRef]
- Corballis, P.M.; Funnell, M.G.; Gazzaniga, M.S. Hemispheric asymmetries for simple visual judgments in the split brain. Neuropsychologia 2002, 40, 401. [Google Scholar] [CrossRef]
- Westerhausen, R. A primer on dichotic listening as a paradigm for the assessment of hemispheric asymmetry. Laterality 2019, 24, 740–771. [Google Scholar] [CrossRef] [PubMed]
- Vasilkov, V.A.; Ishchenko, I.A.; Tikidji-Hamburyan, R.A. Modeling of localization phenomena of the auditory image caused by brain regions dysfunctions. Biophysics 2013, 58, 428–433. [Google Scholar] [CrossRef]
- Sun, Y.; Li, J.; Suckling, J.; Feng, L. Asymmetry of Hemispheric Network Topology Reveals Dissociable Processes between Functional and Struc-tural Brain Connectome in Community-Living Elders. Front. Aging Neurosci. 2017, 9, 361. [Google Scholar] [CrossRef] [PubMed]
- Burdakov, D.S. Self-regulation of individuals with different types of functional brain asymmetry and mental strain. Exp. Psychol. 2010, 3, 123–134. [Google Scholar]
- Cao, R.; Shi, H.; Wang, X.; Huo, S.; Hao, Y.; Wang, B.; Guo, H.; Xiang, J. Hemispheric Asymmetry of Functional Brain Networks under Different Emotions Using EEG Data. Entropy 2020, 22, 939. [Google Scholar] [CrossRef] [PubMed]
- Kosslyn, S.M.; Thompson, W.L.; Ganis, G. The Case for Mental Imagery; Oxford University Press: Oxford, UK, 2006. [Google Scholar]
- Kosslyn, S.M. Image and Brain; MIT Press: Cambridge, MA, USA, 1994. [Google Scholar]
- Pearson, J. The human imagination: The cognitive neuroscience of visual mental imagery. Nat. Rev. Neurosci. 2019, 20, 624–634. [Google Scholar] [CrossRef]
- Van der Ham, I.J.M.; Ruotolo, F. On Inter and Intra Hemispheric Differences in Visuospatial Perception. In The Neuropsychology of Space; Postma, A., van der Ham, I.J.M., Eds.; Elsevier Academic Press: Cambridge, MA, USA, 2016. [Google Scholar]
- Kosslyn, S.M. Seeing and imagining in the cerebral hemispheres: A computational approach. Psychol. Rev. 1987, 94, 148. [Google Scholar] [CrossRef]
- Hellige, J.B. Hemispheric asymmetry for visual information processing. Acta Neurobiol. Exp. 1996, 56, 485–497. [Google Scholar]
- Hellige, J.B.; Cumberland, N. Categorical and coordinate spatial processing: More on contributions of the transient/magnocellular visual system. Brain Cogn. 2001, 45, 155–163. [Google Scholar] [CrossRef]
- Howard, M.F.; Reggia, J.A. A theory of the visual system biology underlying development of spatial frequency lateralization. Brain Cogn. 2007, 64, 111–123. [Google Scholar] [CrossRef]
- Van der Ham, I.J.; Postma, A.; Laeng, B. Lateralized perception: The role of attention in spatial relation processing. Neurosci. Biobehav. Rev. 2014, 45, 142–148. [Google Scholar] [CrossRef]
- Kosslyn, S.M.; Alpert, N.M.; Thompson, W.L.; Maljkovic, V.; Weise, S.B.; Chabris, C.F.; Hamilton, S.E.; Buonanno, F.S. Visual mental imagery activates topographically organized visual cortex: PET investigations. J. Cogn. Neurosci. 1993, 5, 263–287. [Google Scholar] [CrossRef]
- Kosslyn, S.M.; Thompson, W.L.; Kim, I.J.; Alpert, N.M. Topographical representations of mental images in primary visual cortex. Nature 1995, 378, 496–498. [Google Scholar] [CrossRef] [PubMed]
- Kosslyn, S.M.; Pascual-Leone, A.; Felician, O.; Camposano, S.; Keenan, J.P.; Thompson, W.L.; Alpert, N.M. The role of area 17 in visual imagery: Convergent evidence from PET and rTMS. Science 1999, 284, 167–170. [Google Scholar] [CrossRef]
- Kosslyn, S.M.; Sukel, K.E.; Bly, B.M. Squinting with the mind’s eye: Effects of stimulus resolution on imaginal and perceptual comparisons. Mem. Cogn. 1999, 27, 276–287. [Google Scholar] [CrossRef][Green Version]
- van Essen, D.C.; Maunsell, J.H. Hierarchical organization and functional streams in the visual cortex. Trends Neurosci. 1983, 6, 370–375. [Google Scholar] [CrossRef]
- Kosslyn, S.M.; Thompson, W.L. When is early visual cortex activated during visual mental imagery? Psychol. Bull. 2003, 129, 723–746. [Google Scholar] [CrossRef]
- Mazard, A.; Tzourio-Mazoyer, N.; Crivello, F.; Mazoyer, B.; Mellet, E. A PET meta-analysis of object and spatial mental imagery. Eur. J. Cogn. Psychol. 2004, 16, 673–695. [Google Scholar] [CrossRef]
- Dijkstra, N.; Zeidman, P.; Ondobaka, S.; Gerven, M.A.V.; Friston, K. Distinct Top-down and Bottom-up Brain Connectivity during Visual Perception and Imagery. Sci. Rep. 2017, 7, 1–9. [Google Scholar] [CrossRef] [PubMed]
- Hegel, G.W.F. The Phenomenology of Mind, Trans. In JB Baillie 1807; Harper: New York, NY, USA, 1807. [Google Scholar]
- Dixon, M.L.; Fox, K.C.; Christoff, K. A framework for understanding the relationship between externally and internally directed cognition. Neuropsychologia 2014, 62, 321–330. [Google Scholar] [CrossRef] [PubMed]
- D’Angiulli, A. Is the Spotlight an Obsolete Metaphor of “Seeing with the Mind’s Eye”? A Constructive Naturalistic Approach to the Inspection of Visual Mental Images. Imagin. Cogn. Personal. 2008, 28, 117–135. [Google Scholar]
- Cole, H.W.; Ray, W.J. EEG correlates of emotional tasks related to attentional demands. Int. J. Psychophysiol. 1985, 3, 33–41. [Google Scholar] [CrossRef]
- Ray, W.J.; Cole, H.W. EEG activity during cognitive processing: Influence of attentional factors. Int. J. Psychophysiol. 1985, 3, 43–48. [Google Scholar] [CrossRef]
- Ray, W.J.; Cole, H.W. EEG alpha activity reflects attentional demands, and beta activity reflects emotional and cognitive processes. Science 1985, 228, 750–752. [Google Scholar] [CrossRef] [PubMed]
- Lacey, J.I.; Lacey, B.C. Some autonomic-central nervous system interrelationships. In Physiological Correlates of Emotion; Black, P., Ed.; Academic Press: New York, NY, USA, 1970. [Google Scholar]
- Schupp, H.T.; Lutzenberger, W.; Birbaumer, N.; Miltner, W.; Braun, C. Neurophysiological differences between perception and imagery. Cogn. Brain Res. 1994, 2, 77–86. [Google Scholar] [CrossRef]
- Klimesch, W.; Schimke, H.; Ladurner, G.; Pfurtscheller, G. Alpha frequency and memory performance. J. Psychophysiol. 1990, 4, 381–390. [Google Scholar]
- Klimesch, W.; Doppelmayr, M.; Schwaiger, J.; Auinger, P.; Winkler, T.H. Paradoxical alpha synchronization in a memory task. Cogn. Brain Res. 1999, 7, 493–501. [Google Scholar] [CrossRef]
- Klimesch, W.; Doppelmayr, M.; Röhm, D.; Pöllhuber, D.; Stadler, W. Simultaneous desynchronization and synchronization of different alpha responses in the human electroencephalograph: A neglected paradox? Neurosci. Lett. 2000, 284, 97–100. [Google Scholar] [CrossRef]
- Von Stein, A.; Chiang, C.; König, P. Top-down processing mediated by interareal synchronization. Proc. Natl. Acad. Sci. USA 2000, 97, 14748–14753. [Google Scholar] [CrossRef] [PubMed]
- Sarnthein, J.; Petsche, H.; Rappelsberger, P.; Shaw, G.L.; Von Stein, A. Synchronization between prefrontal and posterior association cortex during human working memory. Proc. Natl. Acad. Sci. USA 1998, 95, 7092–7096. [Google Scholar] [CrossRef] [PubMed]
- von Stein, A.; Sarnthein, J. Different frequencies for different scales of cortical integration: From local gamma to long range alpha/theta synchronization. Int. J. Psychophysiol. 2000, 38, 301–313. [Google Scholar] [CrossRef]
- von Stein, A.; Sarnthein, J. EEG frequency and the size of cognitive neuronal assemblies. Behav. Brain Sci. 2000, 23, 413–414. [Google Scholar] [CrossRef]
- Sauseng, P.; Klimesch, W.; Doppelmayr, M.; Pecherstorfer, T.; Freunberger, R.; Hanslmayr, S. EEG alpha synchronization and functional coupling during top-down processing in a working memory task. Hum. Brain Mapp. 2005, 26, 148–155. [Google Scholar] [CrossRef]
- Cooper, N.R.; Croft, R.J.; Dominey, S.J.; Burgess, A.P.; Gruzelier, J.H. Paradox lost? Exploring the role of alpha oscillations during externally vs. internally directed attention and the implications for idling and inhibition hypotheses. Int. J. Psychophysiol. 2003, 47, 65–74. [Google Scholar] [CrossRef]
- Villena-González, M.; López, V.; Rodríguez, E. Orienting attention to visual or verbal/auditory imagery differentially impairs the processing of visual stimuli. Neuroimage 2016, 132, 71–78. [Google Scholar] [CrossRef] [PubMed]
- D’Angiulli, A.; Griffiths, G.; Marmolejo-Ramos, F. Neural correlates of visualizations of concrete and abstract words in preschool children: A developmental embodied approach. Front. Dev. Psychol. 2015, 6, 856. [Google Scholar] [CrossRef] [PubMed]
- Marmolejo-Ramos, F.; Hellemans, K.; Comeau, A.; Heenan, A.; Faulkner, A.; Abizaid, A.; D’Angiulli, A. ERP signatures to perceived and imagined emotional and food real-life photos. Neurosci. Bull. 2015, 31, 317–330. [Google Scholar] [CrossRef]
- Farah, M.J.; Weisberg, L.L.; Monheit, M.; Peronnet, F. Brain activity underlying mental imagery: Event-related potentials during mental image generation. J. Cogn. Neurosci. 1989, 1, 302–316. [Google Scholar] [CrossRef] [PubMed]
- Farah, M.J.; Péronnet, F.; Gonon, M.A.; Giard, M.H. Electrophysiological evidence for a shared representational medium for visual images and visual percepts. J. Exp. Psychol. Gen. 1988, 117, 248. [Google Scholar] [CrossRef]
- Farah, M.J.; Peronnet, F. Event-related potentials in the study of mental imagery. J. Psychophysiol. 1989, 3, 99–109. [Google Scholar]
- Farah, M.J. Is visual imagery really visual? Overlooked evidence from neuropsychology. Psychol. Rev. 1988, 95, 307. [Google Scholar] [CrossRef]
- D’Esposito, M.; Detre, J.A.; Aguirre, G.K.; Stallcup, M.; Alsop, D.C.; Tippet, L.J.; Farah, M.J. A functional MRI study of mental image generation. Neuropsychologia 1997, 35, 725–730. [Google Scholar] [CrossRef]
- Gonsalves, B.; Paller, K.A. Brain potentials associated with recollective processing of spoken words. Mem. Cogn. 2000, 28, 321–330. [Google Scholar] [CrossRef] [PubMed][Green Version]
- Gonsalves, B.; Reber, P.J.; Crawford, M.; Paller, K.A. Reading the mind’s eye using an occipital brain potential that indexes vividness of visual imagery. In Journal of Cognitive Neuroscience; MIT Press: Cambridge, MA, USA, 2002; p. 138. [Google Scholar]
- Winlove, C.I.; Milton, F.; Ranson, J.; Fulford, J.; MacKisack, M.; Macpherson, F.; Zeman, A. The neural correlates of visual imagery: A co-ordinate-based meta-analysis. Cortex 2018, 105, 4–25. [Google Scholar] [CrossRef] [PubMed]
- Damasio, A.; Meyer, K. Consciousness: An overview of the phenomenon and of its possible neural basis. In The Neurology of Consciousness: Cognitive Neuroscience and Neuropathology; Laureys, S., Tononi, G., Eds.; Elsevier: New York, NY, USA, 2009; pp. 3–14. [Google Scholar]
- Keogh, R.; Pearson, J. The sensory strength of voluntary visual imagery predicts visual working memory capacity. J. Vis. 2014, 14, 7. [Google Scholar] [CrossRef]
- Pearson, J.; Naselaris, T.; Holmes, E.A.; Kosslyn, S.M. Mental Imagery: Functional Mechanisms and Clinical Applications. Trends Cogn. Sci. 2015, 19, 590–602. [Google Scholar] [CrossRef] [PubMed]
- Bergmann, J.; Genç, E.; Kohler, A.; Singer, W.; Pearson, J. Smaller Primary Visual Cortex Is Associated with Stronger, but Less Precise Mental Imagery. Cereb. Cortex 2016, 26, 3838–3850. [Google Scholar] [CrossRef] [PubMed]
- Pearson, J.; Clifford, C.W.; Tong, F. The functional impact of mental imagery on conscious perception. Curr. Biol. 2008, 18, 982–986. [Google Scholar] [CrossRef]
- Ganis, G.; Schendan, H.E. Visual mental imagery and perception produce opposite adaptation effects on early brain potentials. Neuroimage 2008, 42, 1714–1727. [Google Scholar] [CrossRef] [PubMed]
- Freeman, W.J. The physiological basis of mental images. Biol. Psychiatry 1983, 18, 1107–1125. [Google Scholar]
- Schneider, G.E. Brain Structure and Its Origins: In Development and in Evolution of Behavior and the Mind; MIT Press: Cambridge, MA, USA, 2013. [Google Scholar]
- Feinberg, T.E.; Mallatt, J. The Ancient Origins of Consciousness; MIT Press: Cambridge, MA, USA, 2016. [Google Scholar]
- Jonkisz, J. Consciousness: Individuated information in action. Front. Psychol. 2015, 6, 1035. [Google Scholar] [CrossRef]
- Denton, D.A.; McKinley, M.J.; Farrell, M.; Egan, G.F. The role of primordial emotions in the evolutionary origin of consciousness. Conscious. Cogn. 2009, 18, 500–514. [Google Scholar] [CrossRef]
- Keller, A. The evolutionary function of conscious information processing is revealed by its task-dependency in the olfactory system. Front. Psychol. 2014, 5, 62. [Google Scholar] [CrossRef]
- Tartaglia, E.M.; Bamert, L.; Mast, F.W.; Herzog, M.H. Human perceptual learning by mental imagery. Curr. Biol. 2009, 19, 2081–2085. [Google Scholar] [CrossRef]
- Grzeczkowski, L.; Tartaglia, E.M.; Mast, F.W.; Herzog, M.H. Linking perceptual learning with identical stimuli to imagery perceptual learning. J. Vis. 2015, 15, 13. [Google Scholar] [CrossRef]
- Moulton, S.T.; Kosslyn, S.M. Imagining predictions: Mental imagery as mental emulation. Philos. Trans. R. Soc. Lond. B Biol. Sci. 2009, 364, 1273–1280. [Google Scholar] [CrossRef]
- Neisser, U. Perceiving, Anticipating, and Imagining; University of Minnesota Press: Minneapolis, MN, USA, 1978. [Google Scholar]
- Ishai, A.; Sagi, D. Visual imagery facilitates visual perception: Psychophysical evidence. J. Cogn. Neurosci. 1997, 9, 476–489. [Google Scholar] [CrossRef] [PubMed][Green Version]
- McDermott, K.B.; Roediger, H.L. Effects of imagery on perceptual implicit memory tests. J. Exp. Psychol. Learn. Mem. Cogn. 1994, 20, 1379. [Google Scholar] [CrossRef] [PubMed]
- Perky, C.W. An Experimental Study of Imagination. Am. J. Psychol. 1910, 21, 422. [Google Scholar] [CrossRef]
- Segal, S.J. Processing of the stimulus in imagery and perception. In Imagery; Academic Press: New York, NY, USA, 1971; pp. 69–100. [Google Scholar]
- Ishai, A.; Sagi, D. Visual imagery: Effects of short-and long-term memory. J. Cogn. Neurosci. 1997, 9, 734–742. [Google Scholar] [CrossRef] [PubMed][Green Version]
- Pearson, J.; Rademaker, R.L.; Tong, F. Evaluating the mind’s eye: The metacognition of visual imagery. Psychol. Sci. 2011, 22, 1535–1542. [Google Scholar] [CrossRef]
- Levi, D.M.; Manny, R.E.; Klein, S.A.; Steinman, S.B. Electrophysiological correlates of hyperacuity in the human visual cortex. Nature 1983, 306, 468–470. [Google Scholar] [CrossRef] [PubMed]
- Hou, C.; Kim, Y.J.; Verghese, P. Cortical sources of Vernier acuity in the human visual system: An EEG-source imaging study. J. Vis. 2017, 17, 2. [Google Scholar] [CrossRef] [PubMed]
- Westheimer, G. Hyperacuity. In Encyclopedia of Neuroscience; Squire, L.A., Ed.; Academic Press: Oxford, UK, 2008. [Google Scholar]
- Bach, M. Visual Acuity-Hyperacuity 2020. Available online: https://michaelbach.de/ot/lum-hyperacuity/ (accessed on 20 August 2021).
- Palva, S.; Palva, J.M. New vistas for α-frequency band oscillations. Trends Neurosci. 2007, 30, 150–158. [Google Scholar] [CrossRef] [PubMed]
- Roux, F.; Uhlhaas, P.J. Working memory and neural oscillations: Alpha–gamma versus theta–gamma codes for distinct WM information? Trends Cogn. Sci. 2014, 18, 16–25. [Google Scholar] [CrossRef]
- Craver-Lemley, C.; Reeves, A. How visual imagery interferes with vision. Psychol. Rev. 1992, 99, 633–649. [Google Scholar] [CrossRef] [PubMed]
- D’Angiulli, A.; Reeves, A. The relationship between self-reported vividness and latency during mental size scaling of everyday items: Phenomenological evidence of different types of imagery. Am. J. Psychol. 2007, 521–551. [Google Scholar] [CrossRef]
- D’Angiulli, A. Mental image generation and the contrast sensitivity function. Cognition 2002, 85, B11–B19. [Google Scholar] [CrossRef]
- Berg, P.; Scherg, M. A multiple source approach to the correction of eye artifacts. Electroencephalogr. Clin. Neurophysiol. 1994, 90, 229–241. [Google Scholar] [CrossRef]
- Ille, N.; Berg, P.; Scherg, M. A spatial components method for continuous artifact correction in EEG and MEG. Biomed. Technol. 1997, 42, 80–83. [Google Scholar]
- Ille, N.; Berg, P.; Scherg, M. Artifact correction of the ongoing EEG using spatial filters based on artifact and brain signal topographies. J. Clin. Neurophysiol. 2002, 19, 113–124. [Google Scholar] [CrossRef]
- Luck, S. An Introduction to the Event-Related Potential Technique, 2nd ed.; MIT Press: Cambridge, MA, USA, 2014. [Google Scholar]
- Berman, S.; Friedman, D. The development of selective attention as reflected by event-related brain potentials. J. Exp. Child Psychol. 1995, 59, 1–31. [Google Scholar] [CrossRef]
- Maris, E.; Oostenveld, R. Nonparametric statistical testing of EEG- and MEG-data. J. Neurosci. Methods 2007, 164, 177–190. [Google Scholar] [CrossRef]
- Krishnan, A.; Williams, L.J.; McIntosh, A.R.; Abdi, H. Partial Least Squares (PLS) methods for neuroimaging: A tutorial and review. Neuroimage 2011, 56, 455–475. [Google Scholar] [CrossRef]
- McIntosh, A.R.; Mišić, B. Multivariate statistical analyses for neuroimaging data. Annu. Rev. Psychol. 2013, 64, 499–525. [Google Scholar] [CrossRef]
- Kovacevic, N.; Abdi, H.; Beaton, D.; McIntosh, A.R. Revisiting PLS Resampling: Comparing Significance versus Reliability Across Range of Simulations. In New Perspectives in Partial Least Squares and Related Methods. Springer Proceedings in Mathematics & Statistics; Abdi, H., Chin, W., Esposito Vinzi, V., Russolillo, G., Trinchera, L., Eds.; Springer: New York, NY, USA, 2013; Volume 56. [Google Scholar]
- McIntosh, A.R.; Lobaugh, N.J. Partial least squares analysis of neuroimaging data: Applications and advances. Neuroimage 2004, 23, S250–S263. [Google Scholar] [CrossRef]
- Efron, B.; Tibshirani, R. Bootstrap methods for standard errors, confidence intervals and other measures of statistical accuracy. Stat. Sci. 1986, 1, 54–77. [Google Scholar] [CrossRef]
- Al-Fahoum, A.S.; Al-Fraihat, A.A. Methods of EEG signal features extraction using linear analysis in frequency and time-frequency domains. Int. Sch. Res. Not. 2014, 2014, 730218. [Google Scholar] [CrossRef] [PubMed]
- Pfurtscheller, G.; Da Silva, F.L. Event-related EEG/MEG synchronization and desynchronization: Basic principles. Clin. Neurophysiol. 1999, 110, 1842–1857. [Google Scholar] [CrossRef]
- Gilbertson, T.; Lalo, E.; Doyle, L.; Di Lazzaro, V.; Cioni, B.; Brown, P. Existing motor state is favored at the expense of new movement during 13–35 Hz oscillatory synchrony in the human corticospinal system. J. Neurosci. 2005, 25, 7771–7779. [Google Scholar] [CrossRef]
- Romei, V.; Brodbeck, V.; Michel, C.; Amedi, A.; Pascual-Leone, A.; Thut, G. Spontaneous fluctuations posterior alpha-band EEG activity reflect variability in excitability of human visual areas. Cereb. Cortex 2008, 18, 2010–2018. [Google Scholar] [CrossRef]
- Romei, V.; Gross, J.; Thut, G. On the role of prestimulus alpha rhythms over occipito-parietal areas in visual input regulation: Correlation or causation? J. Neurosci. 2010, 30, 8692–8697. [Google Scholar] [CrossRef]
- Engel, A.K.; Fries, P. Beta-band oscillations—Signalling the status quo? Curr. Opin. Neurobiol. 2010, 20, 156–165. [Google Scholar] [CrossRef] [PubMed]
- Haegens, S.; Nacher, V.; Luna, R.; Romo, R.; Jensen, O. alpha-Oscillations in the monkey sensorimotor network influence discrimination performance by rhythmical inhibition of neuronal spiking. Proc. Natl. Acad. Sci. USA 2011, 108, 19377–19382. [Google Scholar] [CrossRef] [PubMed]
- Jensen, O.; Bonnefond, M.; VanRullen, R. An oscillatory mechanism for prioritizing salient unattended stimuli. Trends Cogn. Sci. 2012, 16, 200–206. [Google Scholar] [CrossRef] [PubMed]
- van Ede, F.; Koster, M.; Maris, E. Beyond establishing involvement: Quantifying the contribution of anticipatory alpha- and beta-band suppression to perceptual improvement with attention. J. Neurophysiol. 2012, 108, 2352–2362. [Google Scholar] [CrossRef]
- Thut, G.; Nietzel, A.; Brandt, S.A.; Pascual-Leone, A. Alpha-band Electroencephalographic activity over occipital cortex indexes visuospatial attention bias and predicts visual target detection. J. Neurosci. 2006, 26, 9494–9502. [Google Scholar] [CrossRef] [PubMed]
- van Ede, F.; Jensen, O.; Maris, E. Tactile expectation modulates prestimulus beta-band oscillations in human sensorimotor cortex. Neuroimage 2010, 51, 867–876. [Google Scholar] [CrossRef] [PubMed]
- Haegens, S.; Händel, B.F.; Jensen, O. Top-down controlled alpha band activity in somatosensory areas determines behavioral performance in a discrimination task. J. Neurosci. 2011, 31, 5197–5204. [Google Scholar] [CrossRef] [PubMed]
- Händel, B.F.; Haarmeier, T.; Jensen, O. Alpha oscillations correlate with the successful inhibition of unattended stimuli. J. Cogn. Neurosci. 2011, 23, 2494–2502. [Google Scholar] [CrossRef]
- Klimesch, W.; Doppelmayr, M.; Russegger, H.; Pachinger, T.; Schwaiger, J. Induced alpha band power changes in the human EEG and attention. Neurosci. Lett. 1998, 244, 73–76. [Google Scholar] [CrossRef]
- Hyvärinen, A.; Oja, E. A fast fixed-point algorithm for independent component analysis. Neural Comput. 1997, 9, 1483–1492. [Google Scholar] [CrossRef]
- Delorme, A.; Makeig, S. EEGLAB: An open source toolbox for analysis of single-trial EEG dynamics including independent component analysis. J. Neurosci. Methods 2004, 134, 9–21. [Google Scholar] [CrossRef]
- D’Angiulli, A.; Pham, D.A.T.; Leisman, G.; Goldfield, G. Evaluating Preschool Visual Attentional Selective-Set: Preliminary ERP Modeling and Simulation of Target Enhancement Homology. Brain Sci. 2020, 10, 124. [Google Scholar] [CrossRef]
- Lancaster, J.; Fox, P.; Tailarach.org. Research Imaging Institute of the University of Texas Health Science Center San Antonio. Available online: http://www.talairach.org/index.html (accessed on 20 August 2021).
- Papademetris, X.; Jackowski, M.P.; Rajeevan, N.; DiStasio, M.; Okuda, H.; Constable, R.T.; Staib, L.H. BioImage Suite: An integrated medical image analysis suite: An update. Insight J. 2006, 2006, 209. [Google Scholar] [PubMed]
- Rosenthal, R.; Rosnow, R.L.; Rubin, D.B. Contrasts and Effect Sizes in Behavioral Research: A Correlational Approach; Cambridge University Press: Cambridge, UK, 2000. [Google Scholar]
- Todd, N.P.; Govender, S.; Colebatch, J.G. The human electrocerebellogram (ECeG) recorded non-invasively using scalp electrodes. Neurosci. Lett. 2018, 682, 124–131. [Google Scholar] [CrossRef]
- Craver-Lemley, C.; Reeves, A. Visual Imagery Selectively Reduces Vernier Acuity. Perception 1987, 16, 599–614. [Google Scholar] [CrossRef] [PubMed]
- Miller, G.H. Cathode-Ray Tube. In McGraw-Hill Encyclopedia of Science and Technology, 8th ed.; Parker, S., Ed.; McGraw-Hill: New York, NY, USA, 1997. [Google Scholar]
- Sherwood, R.; Pearson, J. Closing the mind’s eye: Incoming luminance signals disrupt visual imagery. PLoS ONE 2010, 5, e15217. [Google Scholar] [CrossRef]
- Ganis, G.; Thompson, W.L.; Kosslyn, S.M. Brain areas underlying visual mental imagery and visual perception: An fMRI study. Cogn. Brain Res. 2004, 20, 226–241. [Google Scholar] [CrossRef]
- Falasca, N.W.; D’Ascenzo, S.; Di Domenico, A.; Onofrj, M.; Tommasi, L.; Laeng, B.; Franciotti, R. Hemispheric lateralization in top-down attention during spatial relation processing: A Granger causal model approach. Eur. J. Neurosci. 2015, 41, 914–924. [Google Scholar] [CrossRef] [PubMed]


| Participant | NI Score | Acuity | OBI Score | Acuity | Decrease a | WBI Score | Acuity | Decrease a |
|---|---|---|---|---|---|---|---|---|
| P1 | 50 | 1 | 50 | 1 | 0.00% | 50 | 1 | 0.00% |
| P2 | 50 | 1 | 50 | 1 | 0.00% | 50 | 1 | 0.00% |
| P3 | 50 | 1 | 50 | 1 | 0.00% | 49 | 0.98 | 2.00% |
| P4 | 42 | 0.84 | 36 | 0.72 | 14.29% | 34 | 0.68 | 19.05% |
| P5 | 46 | 0.92 | 41 | 0.82 | 10.87% | 44 | 0.88 | 4.35% |
| P6 | 45 | 0.9 | 45 | 0.9 | 0.00% | 47 | 0.94 | −4.44% |
| P7 | 44 | 0.88 | 41 | 0.82 | 6.82% | 42 | 0.84 | 4.55% |
| P8 | 44 | 0.88 | 40 | 0.8 | 9.09% | 39 | 0.78 | 11.36% |
| P9 | 41 | 0.82 | 45 | 0.9 | −9.76% | 40 | 0.8 | 2.44% |
| P10 | 46 | 0.92 | 38 | 0.76 | 17.39% | 40 | 0.8 | 13.04% |
| Mean | 45.8 | 0.916 | 43.6 | 0.872 | 4.87% | 43.5 | 0.87 | 5.23% |
| SD | 3.29 | 0.0659 | 5.19 | 0.104 | - | 5.42 | 0.108 | - |
| Measure (Condition) | Approx. Time Range (ms) | Comparison | A/Symmetry | Lobe | Processing Characteristics | Figure # |
|---|---|---|---|---|---|---|
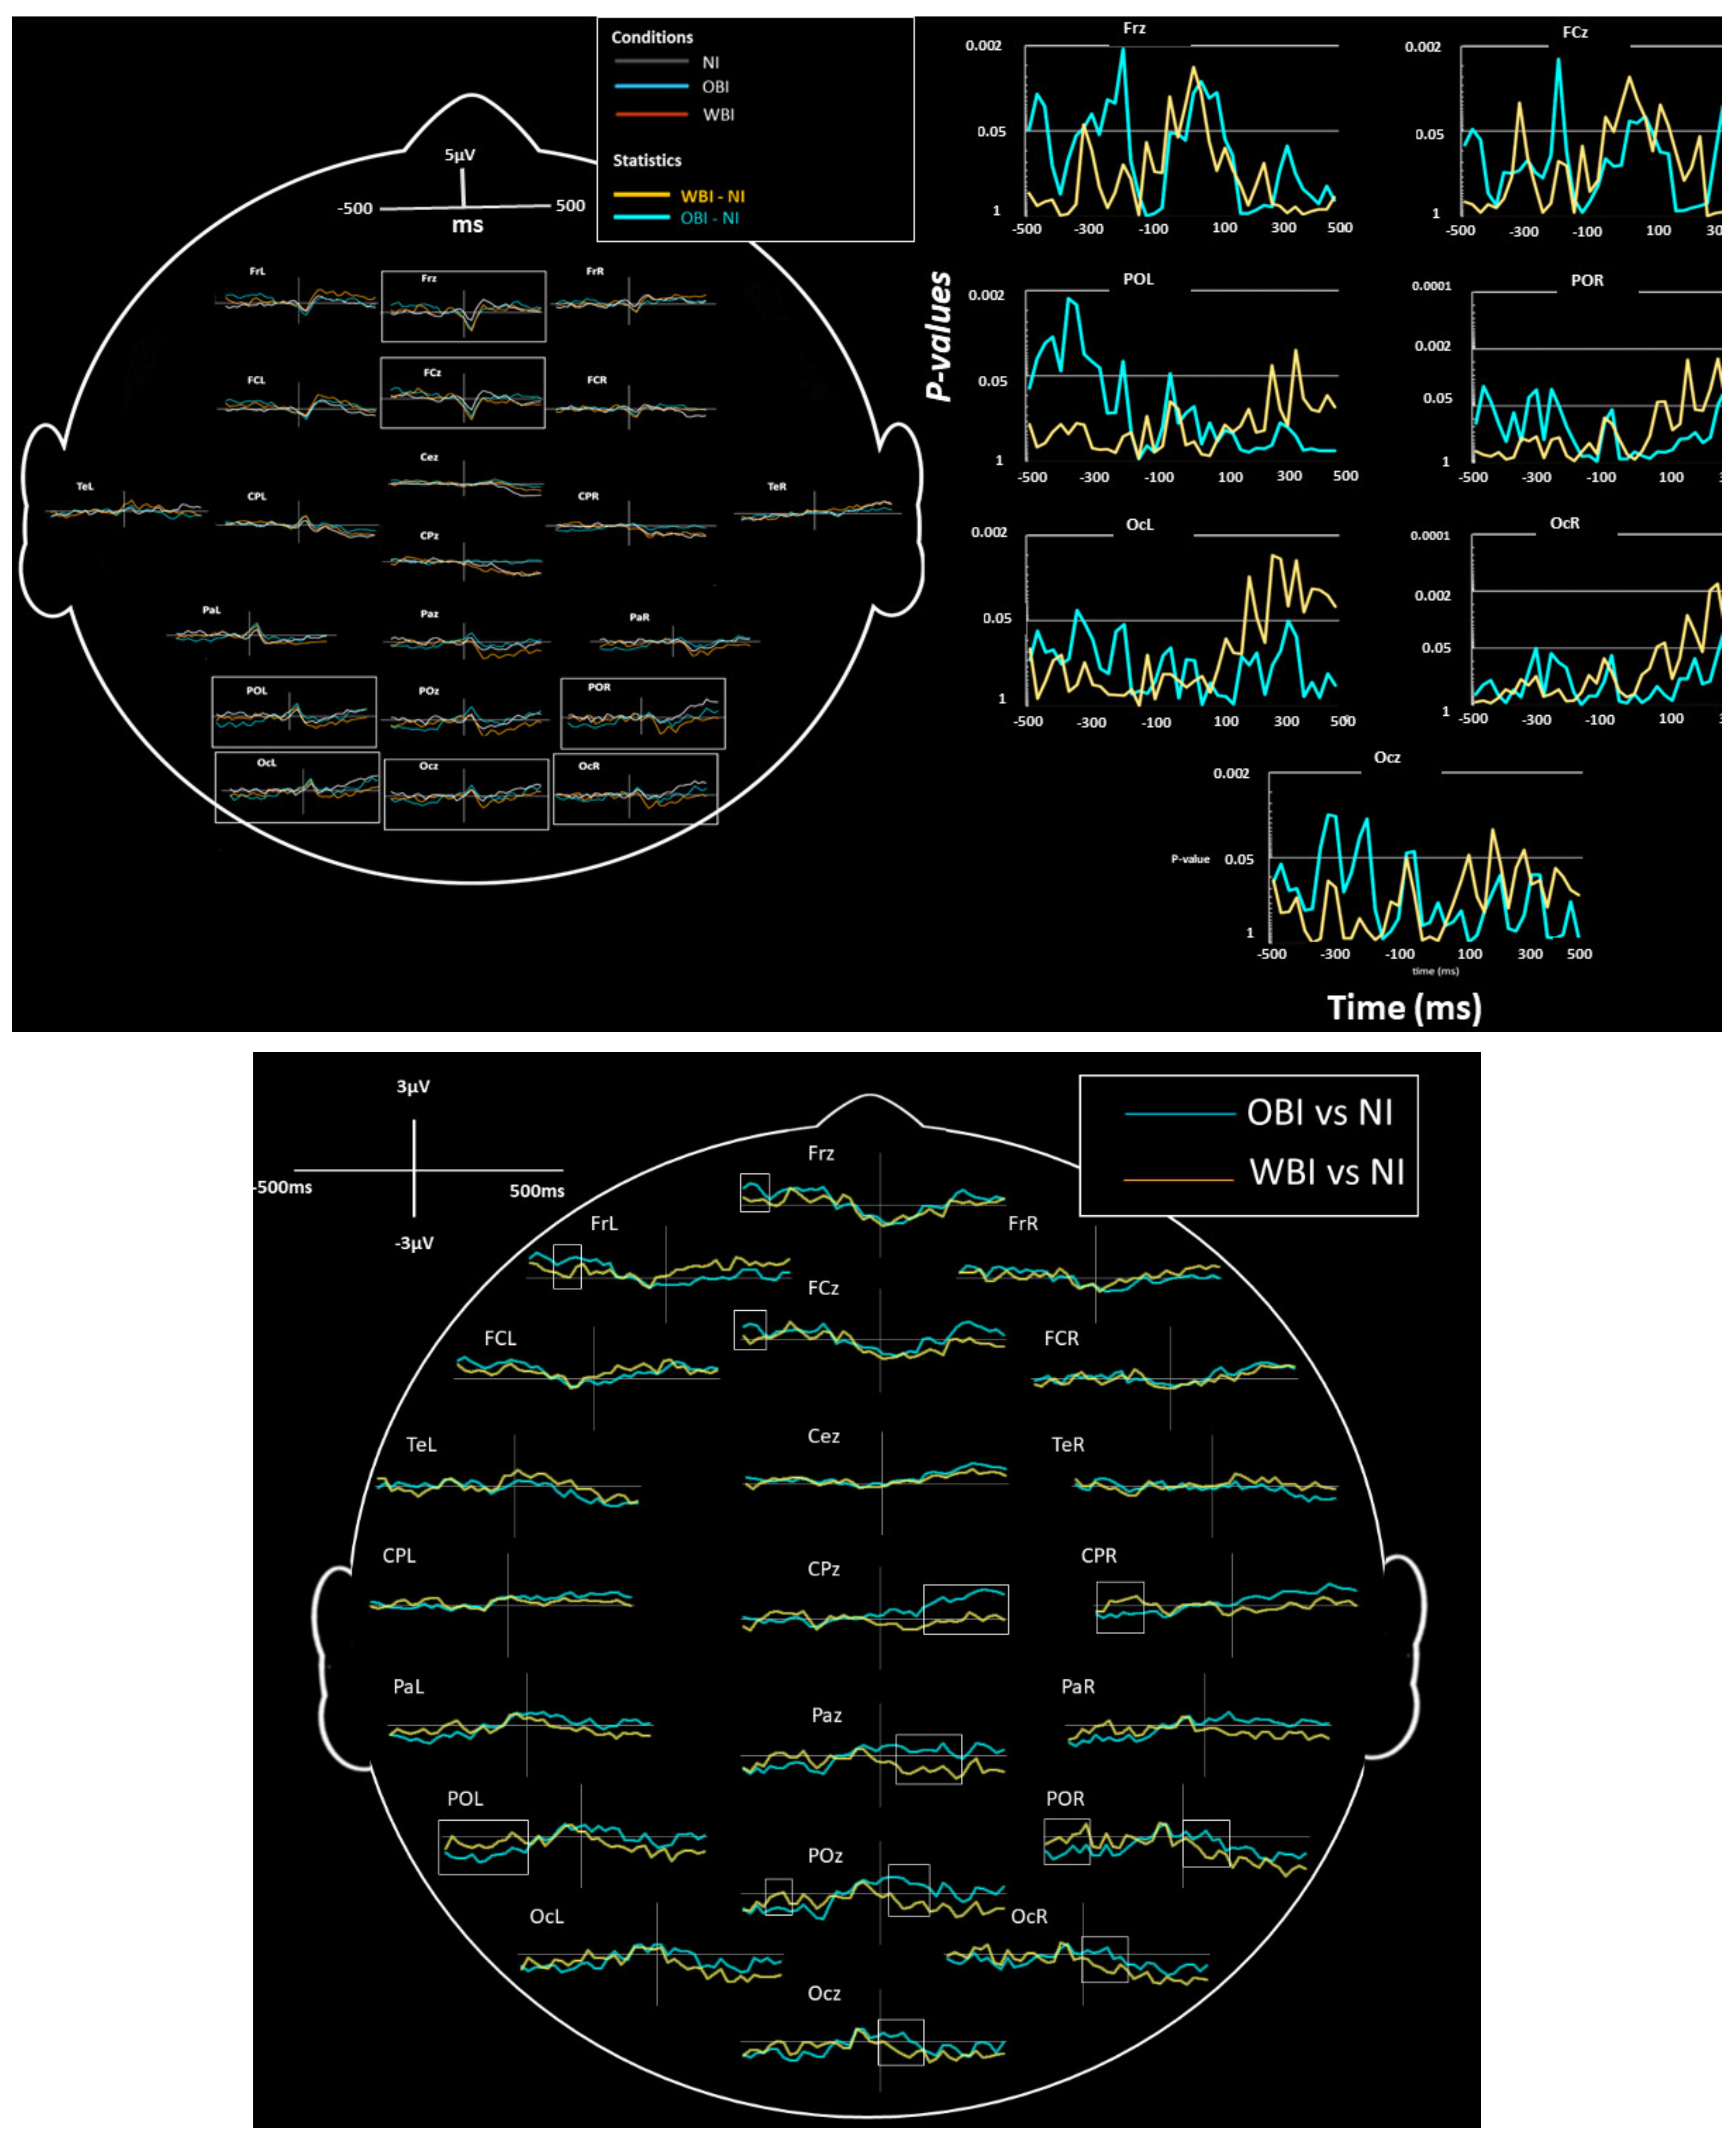
| ERPs (Image recall) | −500 to −300 | OBI vs. NI sig. WBI vs. NI ns. | Left and Midline | Frontal | Positivity | Figure 2 |
| ERPs (Image recall) | −500 to −300 | OBI-NI sig. WBI-NI ns. | Midline | Parietal-Occipital | Negativity | Figure 2 |
| ERPs (Image hold) | 0 to 200 | WBI vs. NI sig. OBI vs. NI ns. | Right | Parietal-Occipital and Occipital | Negativity | Figure 2 |
| ERPs (Image hold) | 100 to 400 | WBI vs. NI sig. OBI vs.NI ns. | Midline | Centro-Parietal to Occipital | Negativity | Figure 2 |
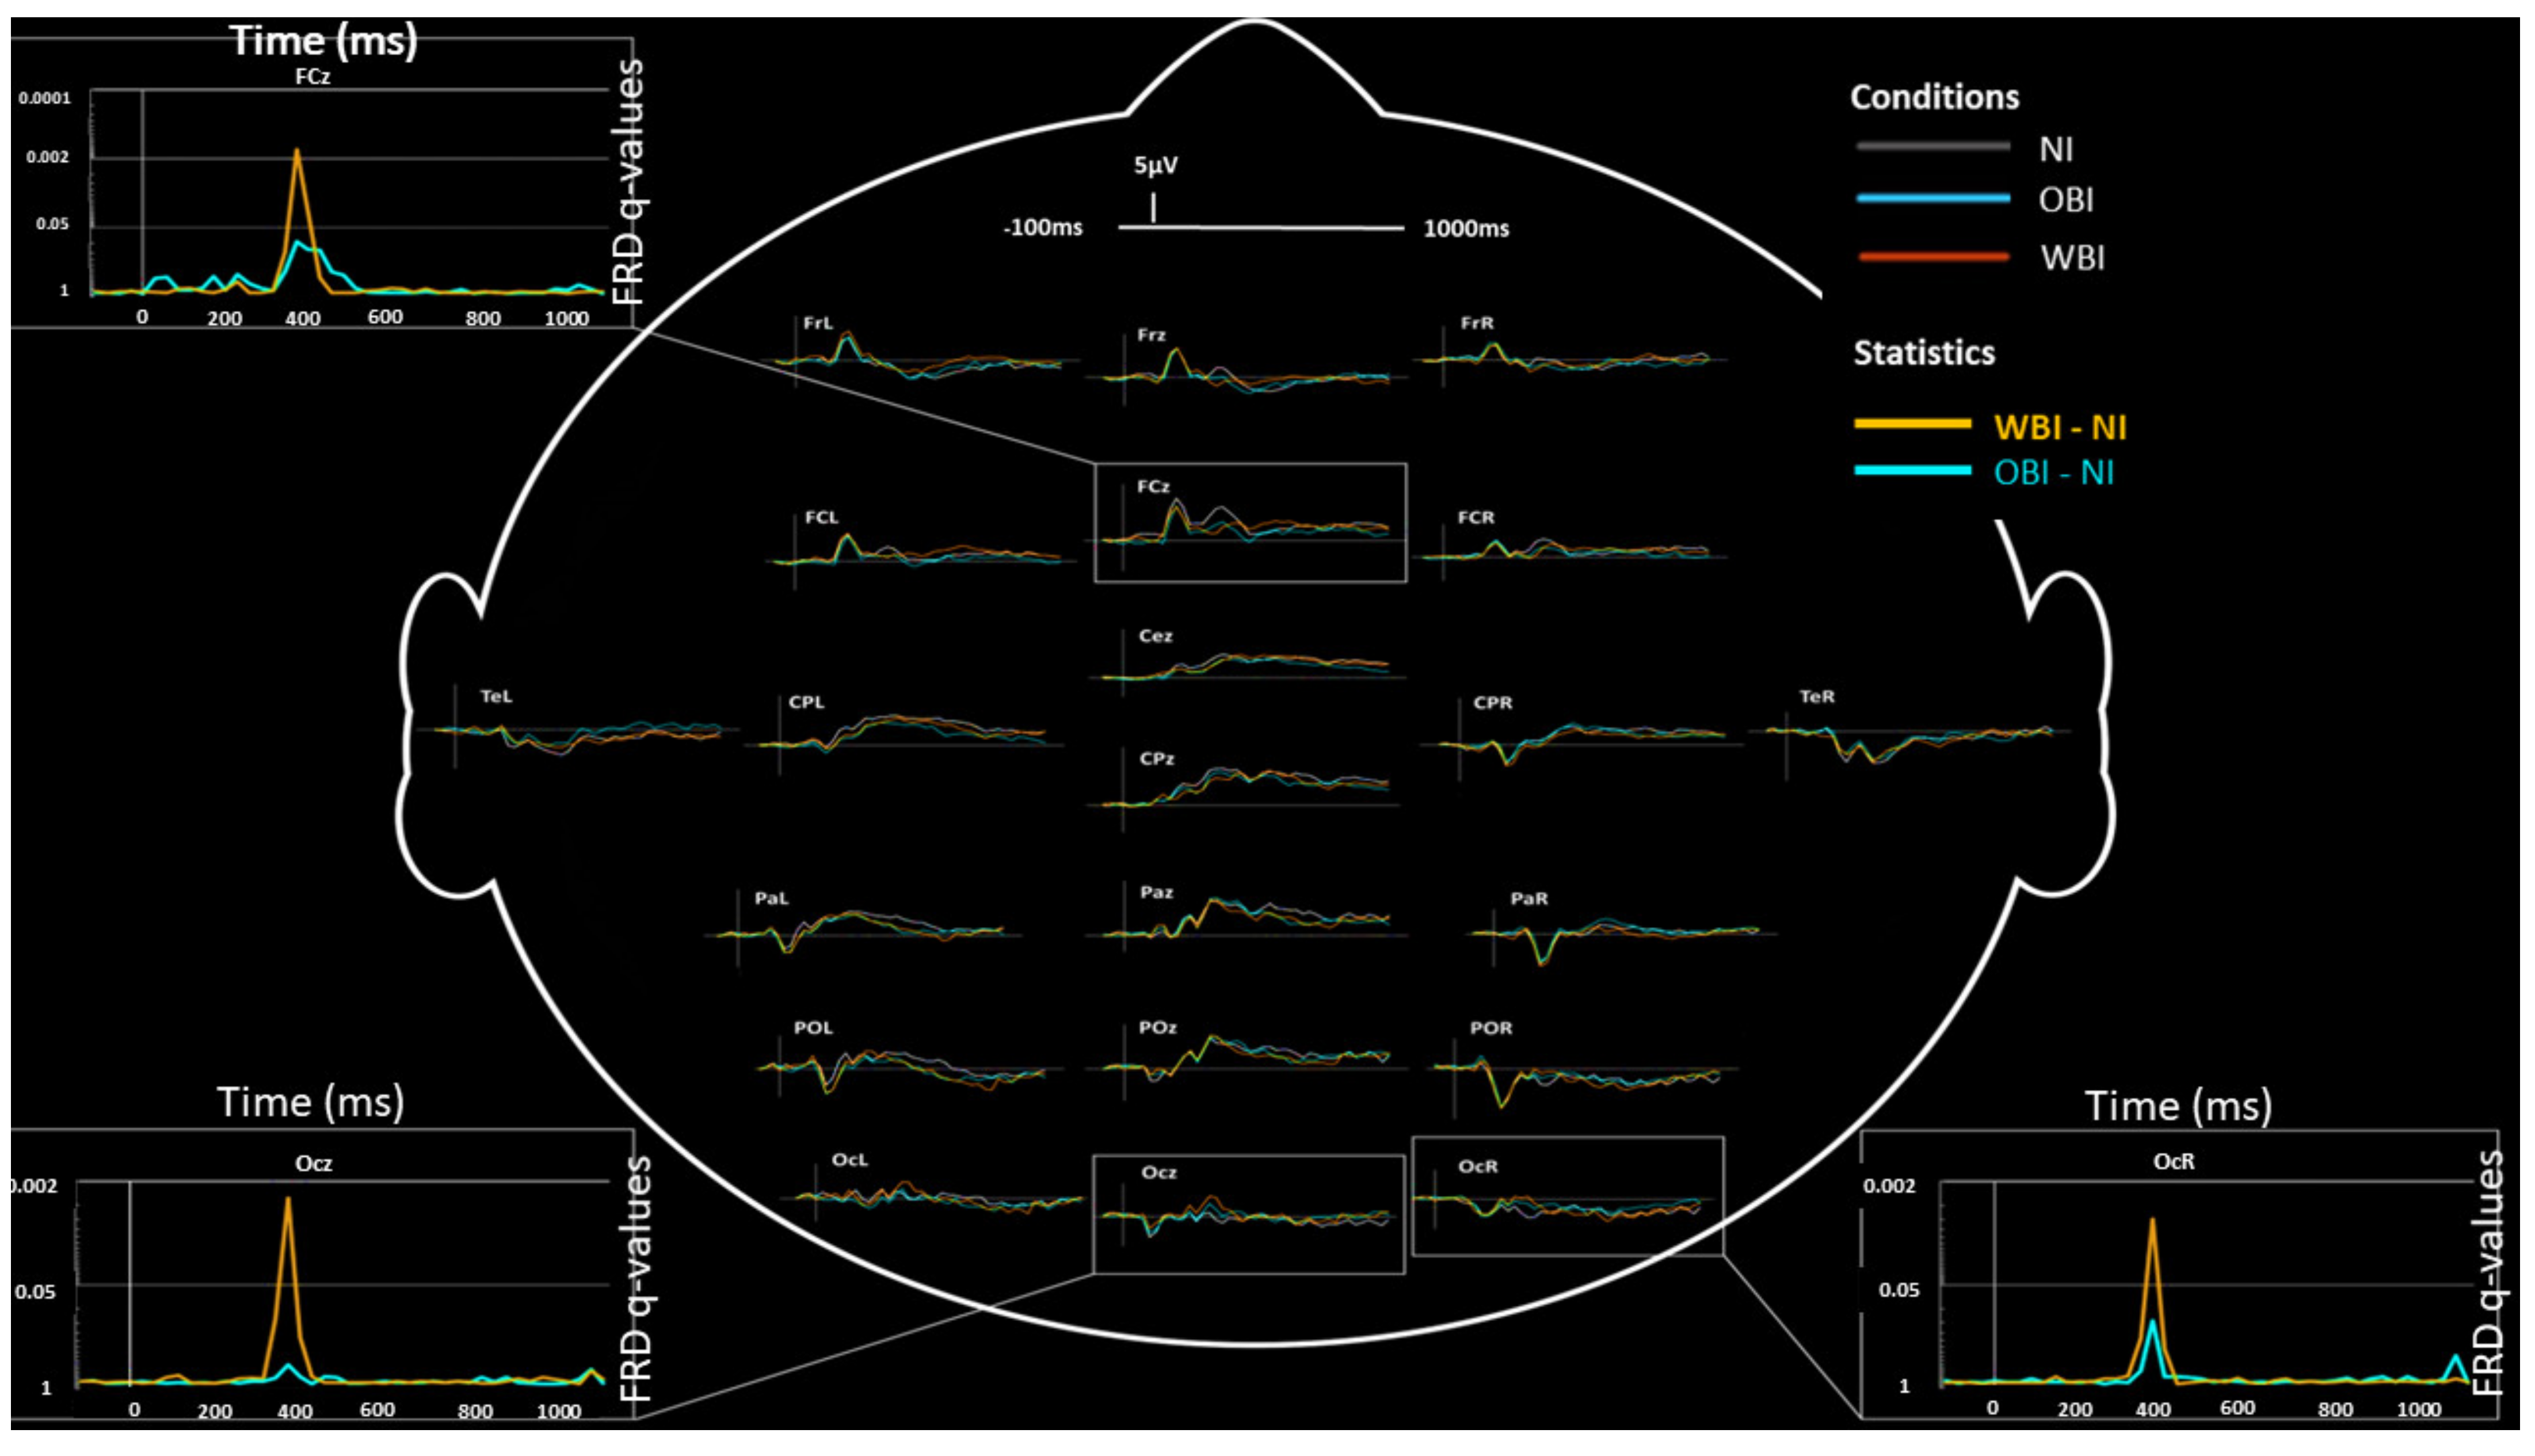
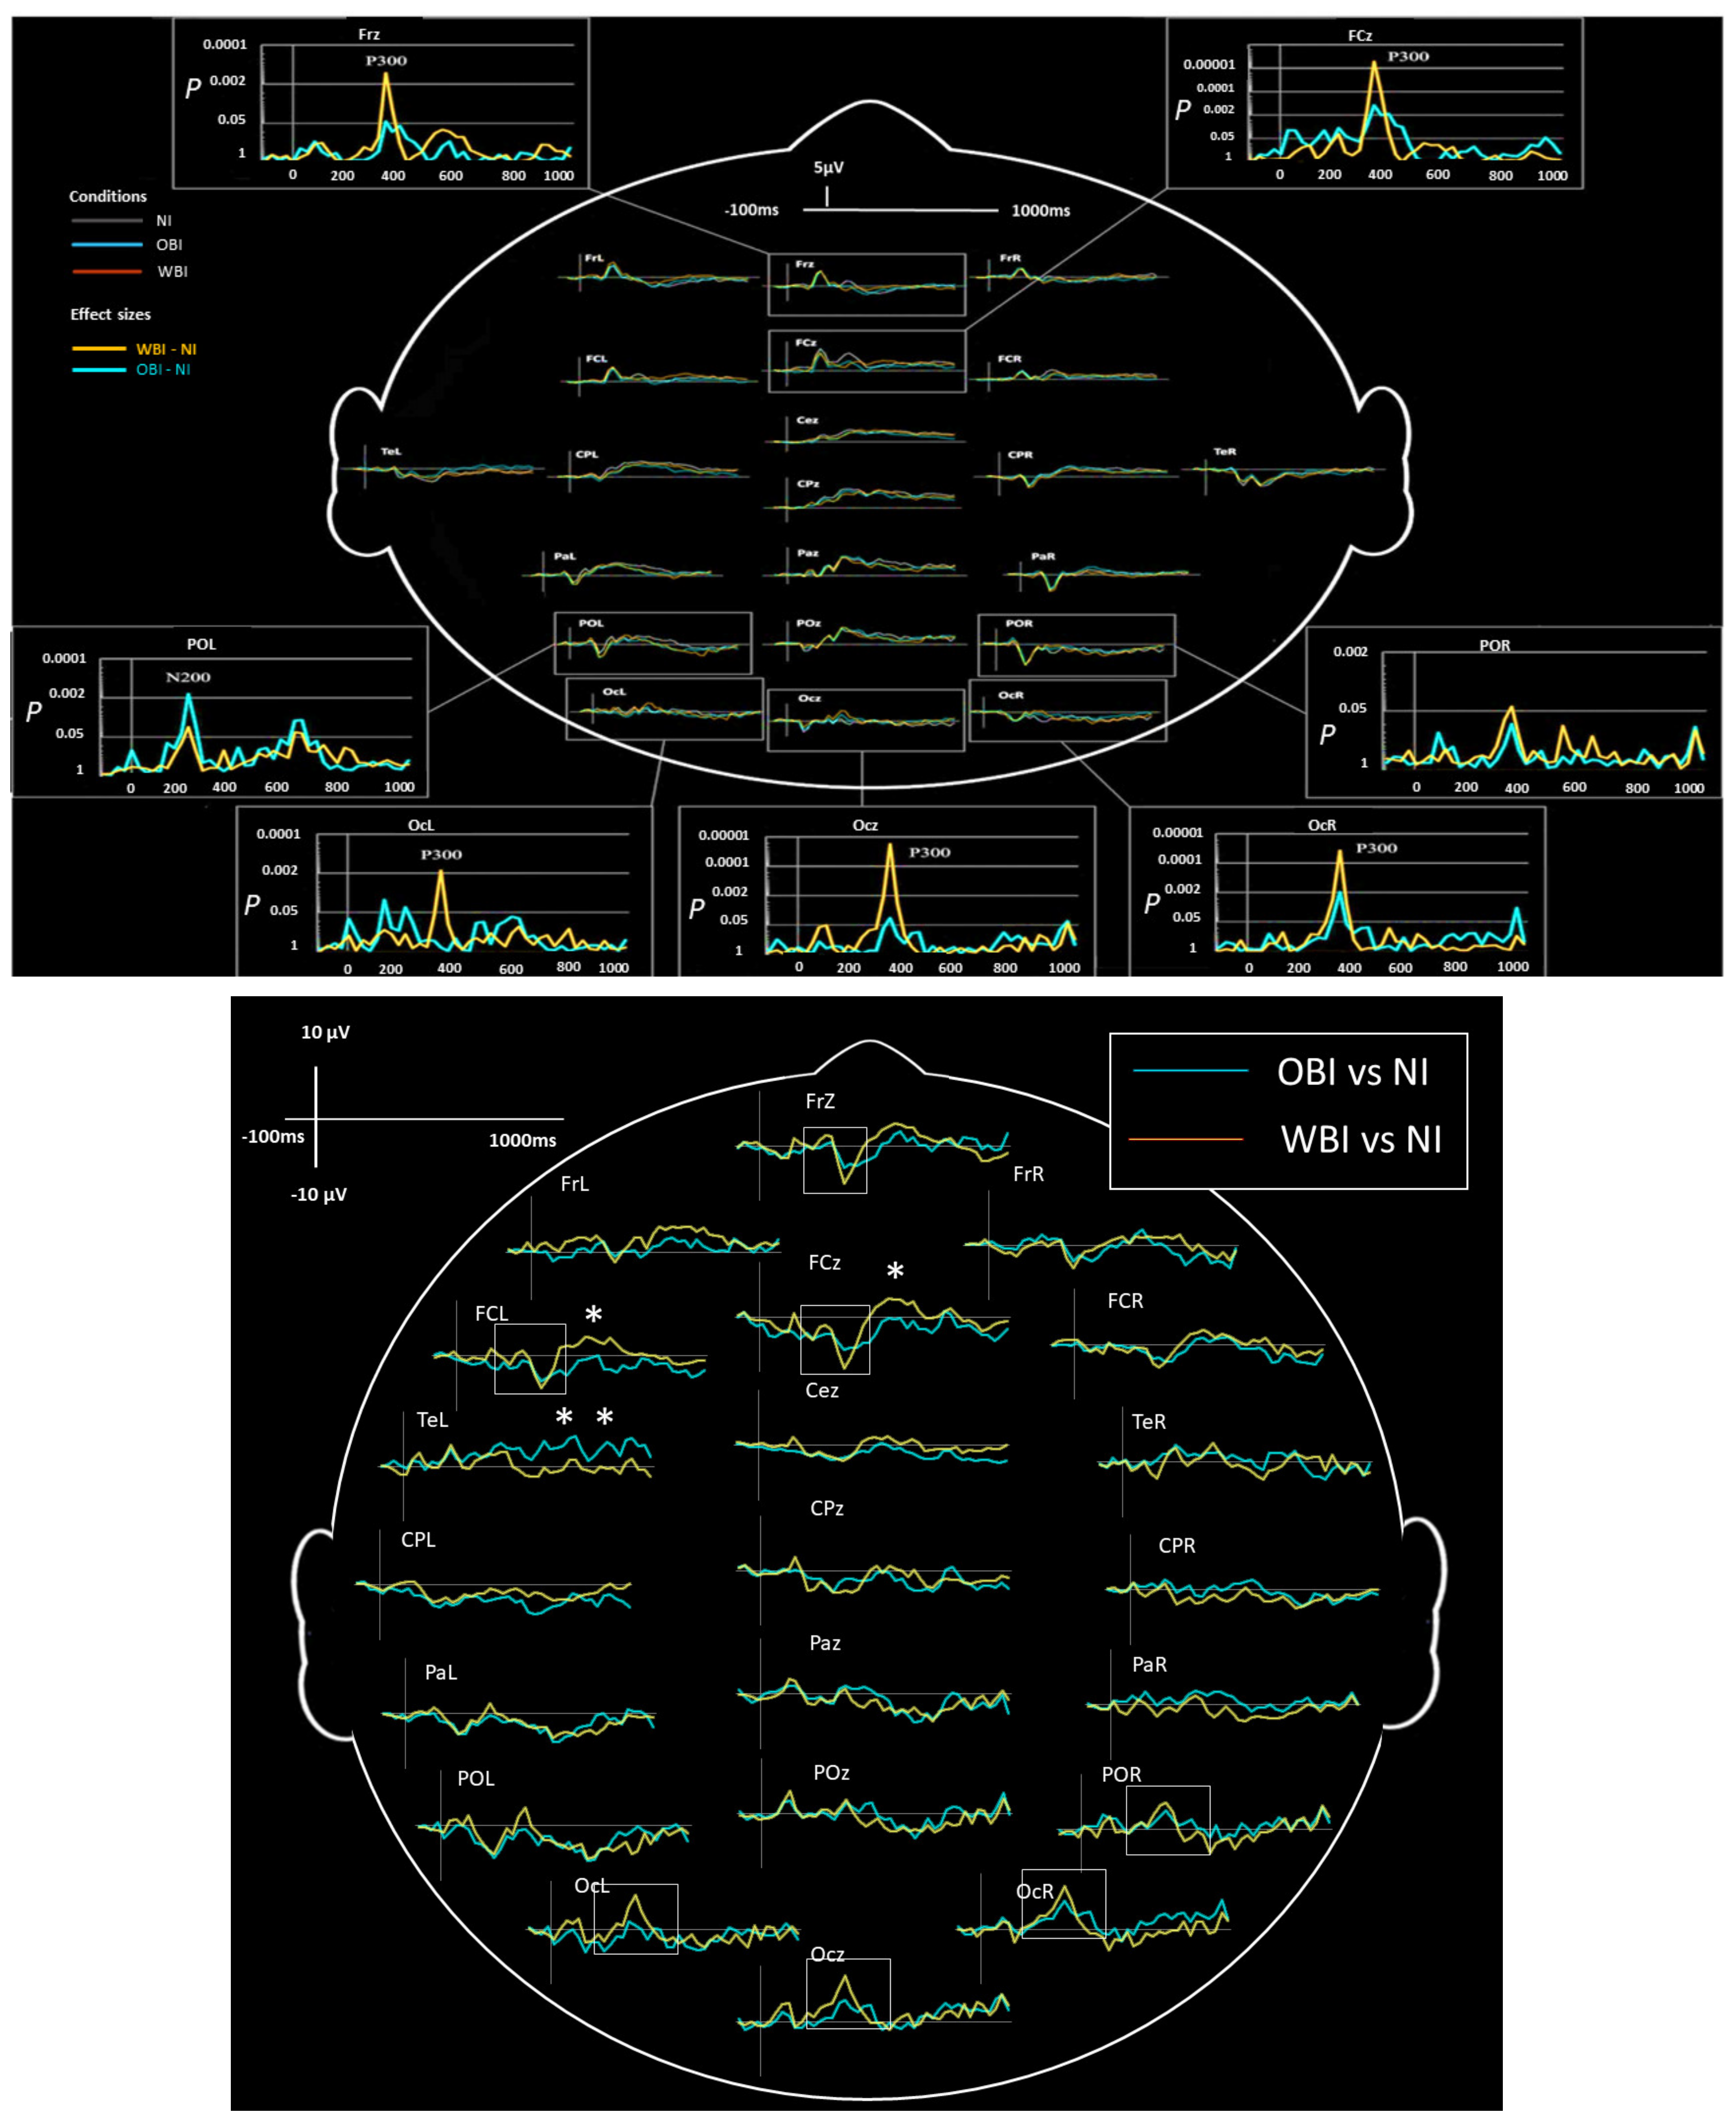
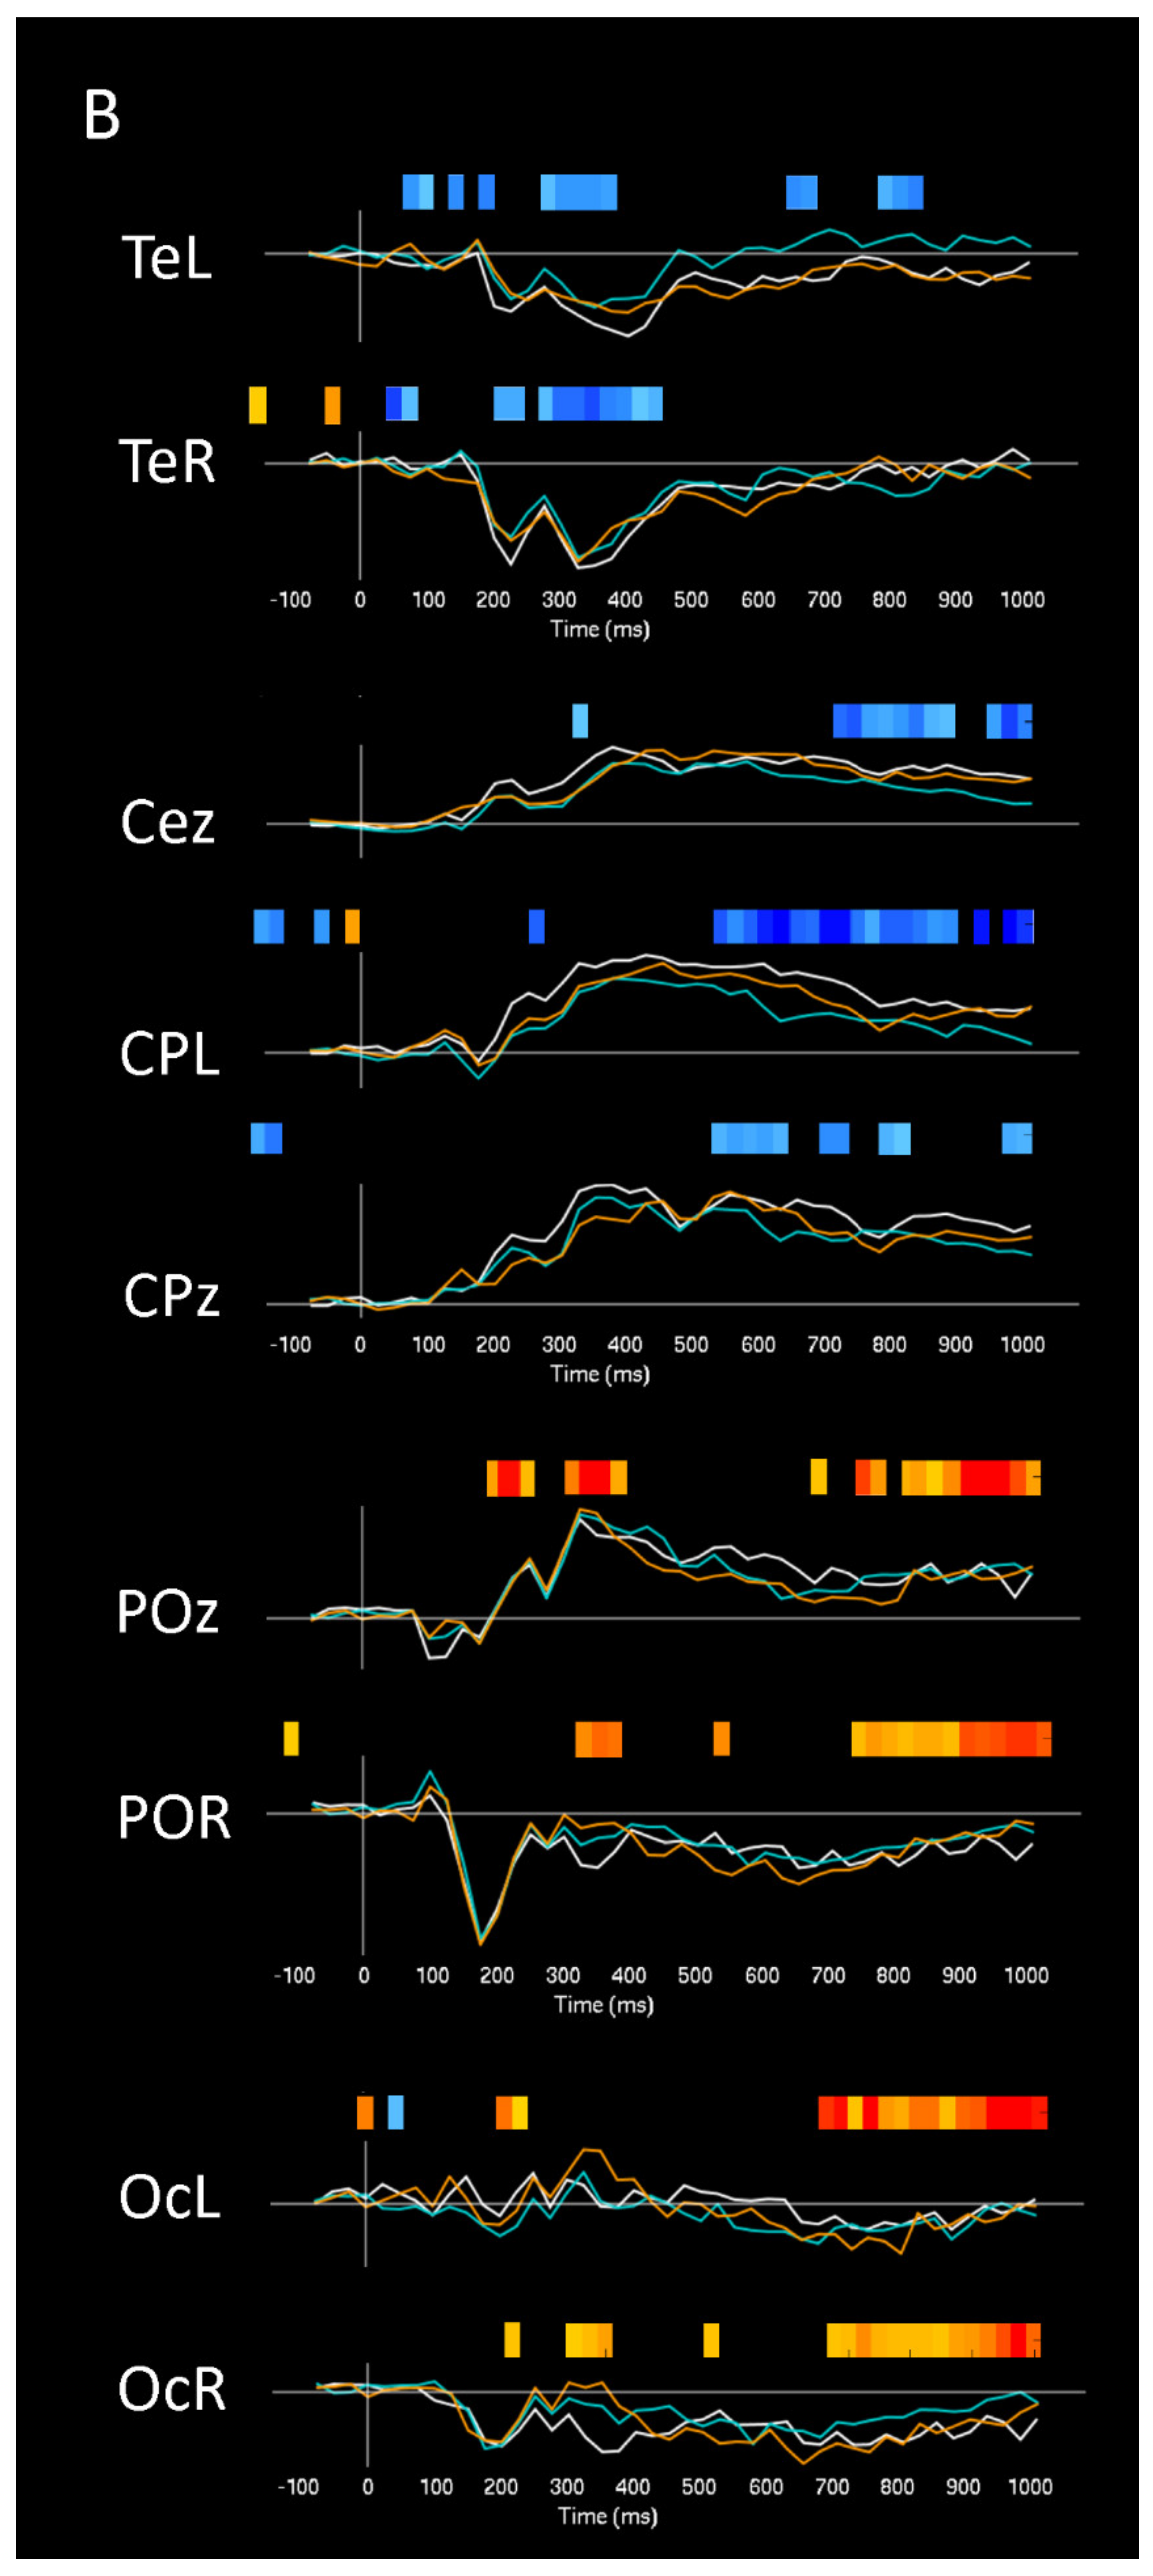
| ERPs (Visuospatial detection) | 350 to 450 | WBI vs. OBI vs. NI | Right and Midline | Occipital, Parietal-Occipital | Increased P300 | Figure 3 and Figure 4 |
| ERPs (Visuospatial detection) | 350 to 450 | WBI vs. OBI vs. NI | Left and Midline | Frontal | Decreased P300 | Figure 3 and Figure 4 |
| ERPs (Visuospatial detection) | 450 to 600 | (WBI vs. NI) vs. (OBI vs. NI) | Left and Midline | Frontal | Increased P600 (WBI) | Figure 4 |
| ERPs (Visuospatial detection) | 300 to 1000 | (WBI vs. NI) vs. (OBI vs. NI) | Left | Temporal | Increased Late Positivity (OBI) | Figure 4 |
| ERPs (Visuospatial detection) | Larger Effect sizes for WBI amplitudes | Right and Midline | Occipital | N200, P300 | Figure 4 | |
| ERPs (Visuospatial detection) | Larger Effect sizes for OBI amplitudes | Midline | Frontal | P50, P100, N400, P800 | Figure 4 | |
| PLS ERP-Task contrast (Image hold) | 50 to 200 | Same pattern for OBI and WBI | Right and Midline | Frontal | Increased positivity | Figure 5A |
| Right and Midline | Parietal-Occipital | Increased negativity | ||||
| Bilateral and Midline | Occipital | Increased negativity | ||||
| PLS ERP-Task phase (Visuospatial detection) | 300–400 | Same pattern for OBI and WBI | Right and Midline Right and Midline | Frontal Parietal-Occipital | Decreased positivity Increased positivity | Figure 5B |
| 600–800 | Left | Occipital Parietal | Decreased positivity | |||
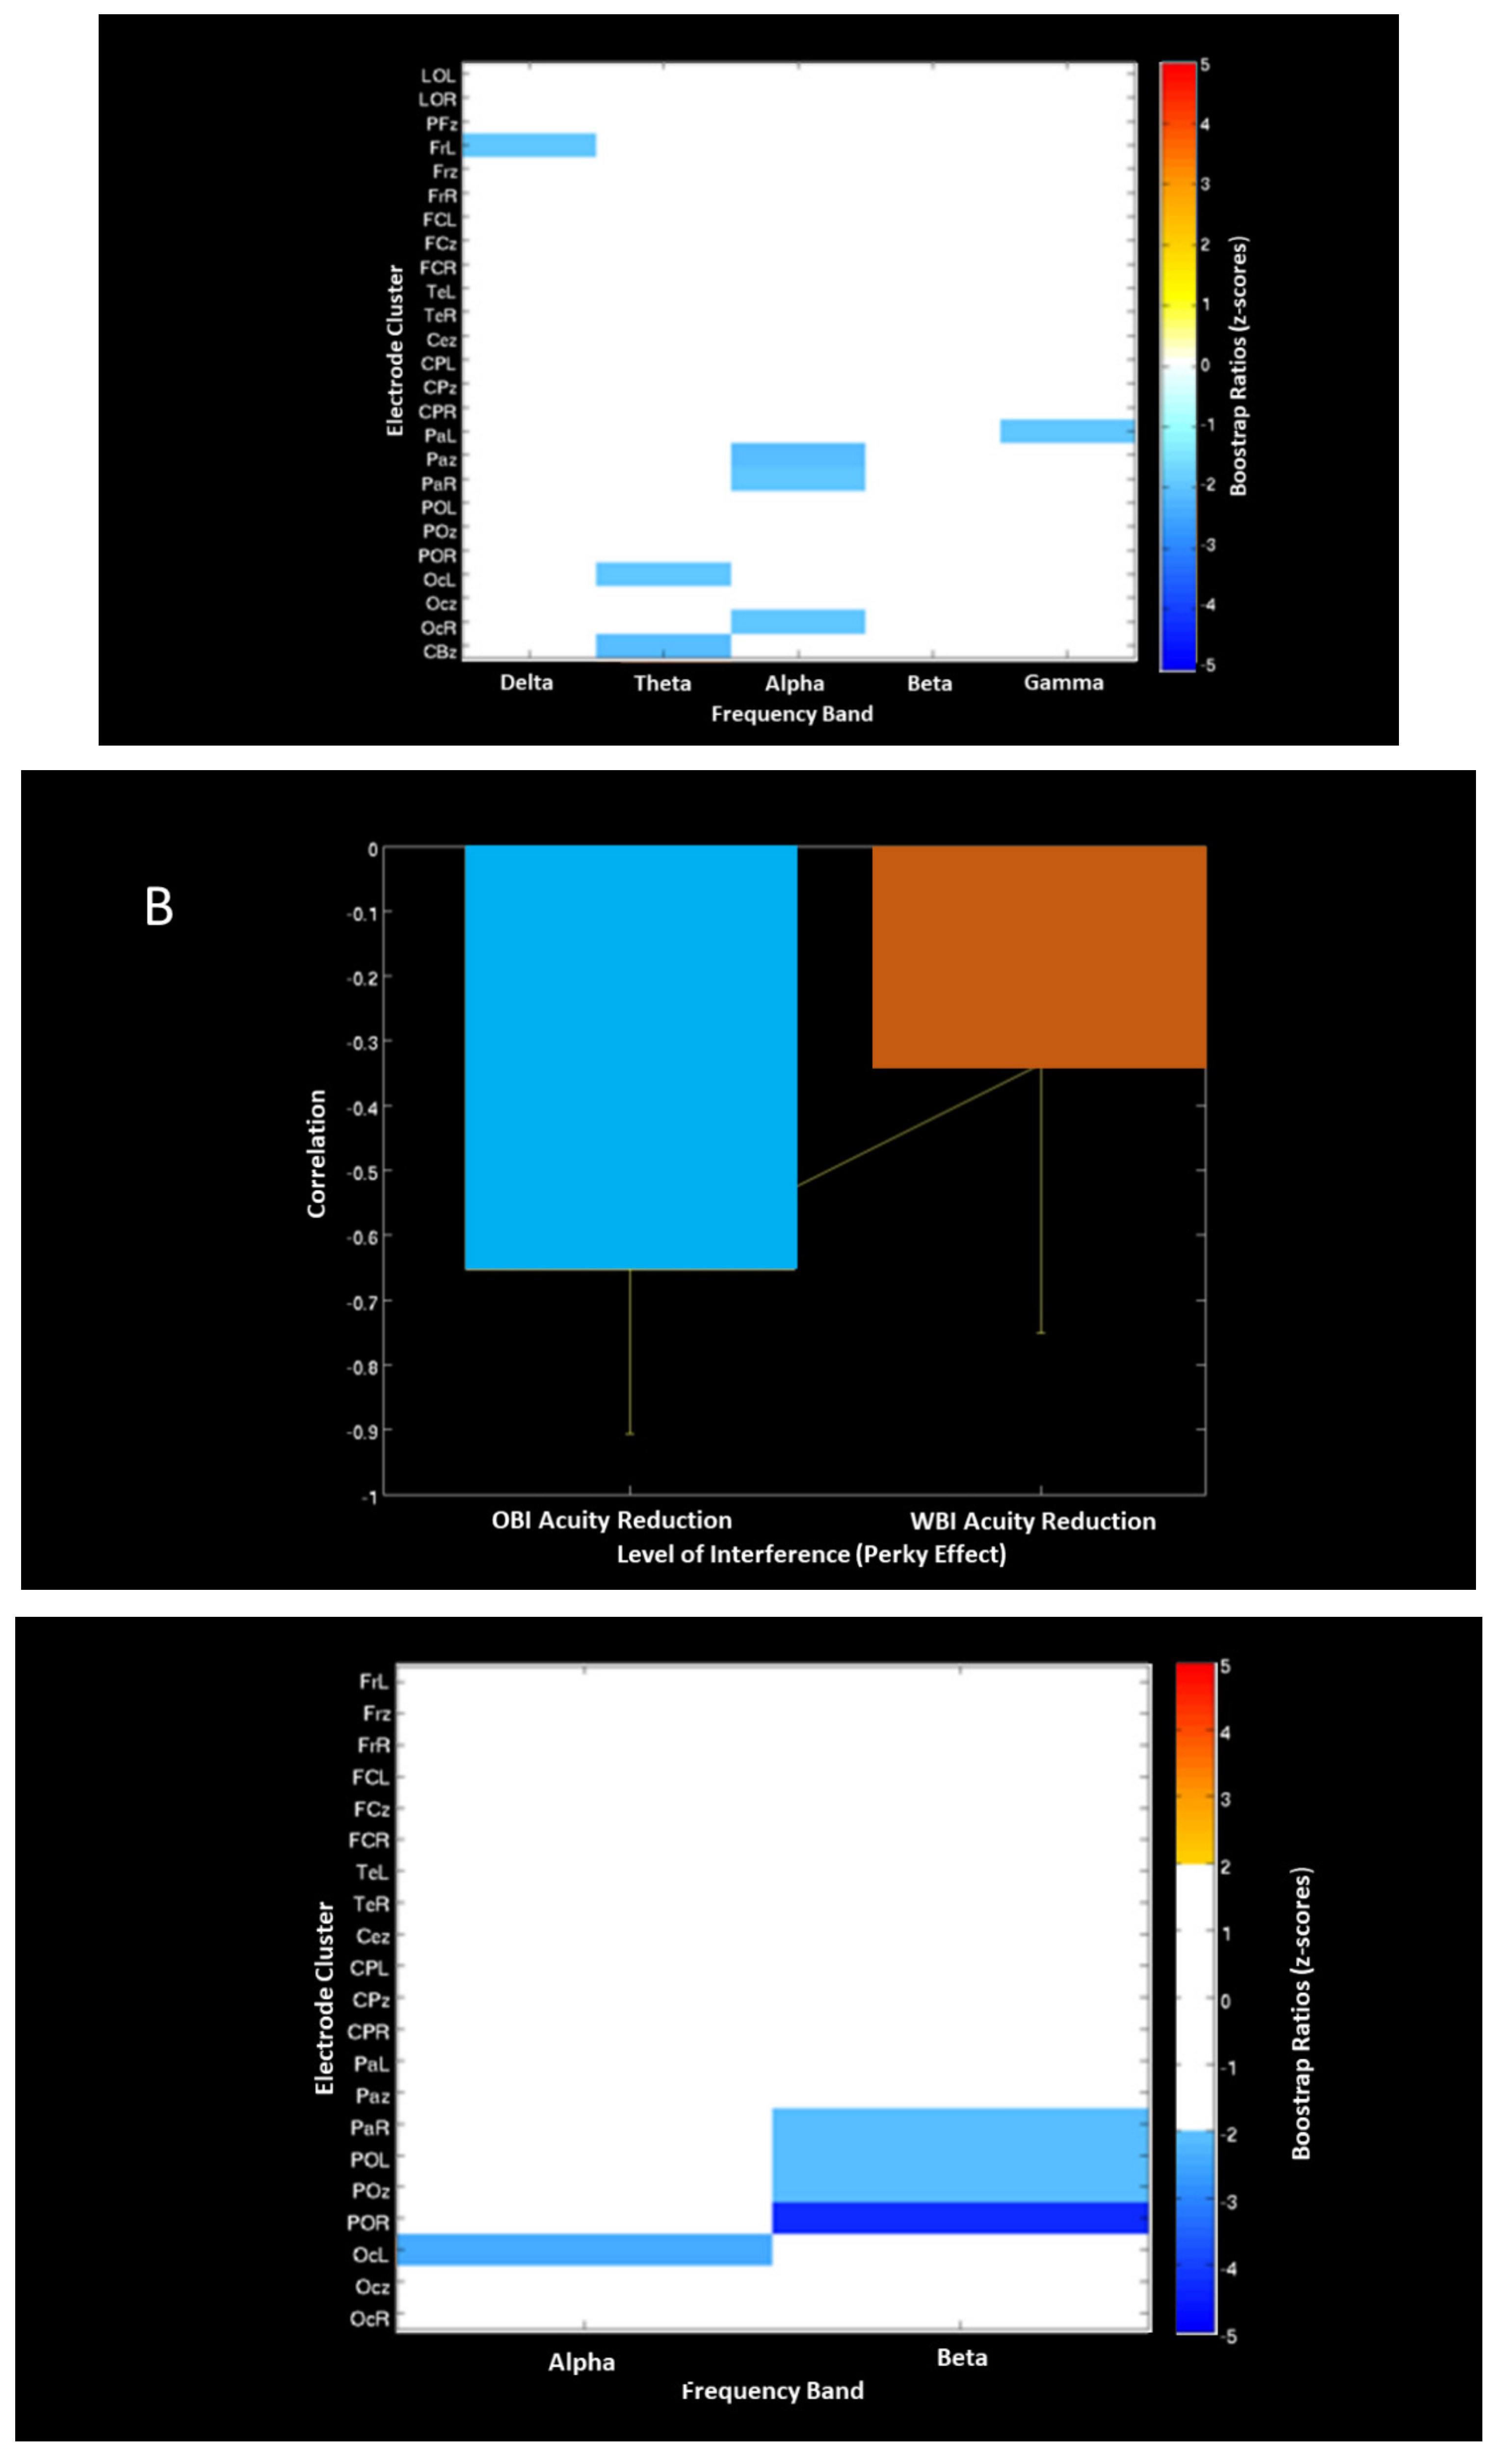
| PLS ERP-Acuity Correlation | 500 to 1000 700 to 1000 500 to 1000 | WBI shows larger correlation than OBI | Bilateral and Midline | Frontal Parietal and Occipital Temporal | Negativity Positivity Negativity | Figure 6 |
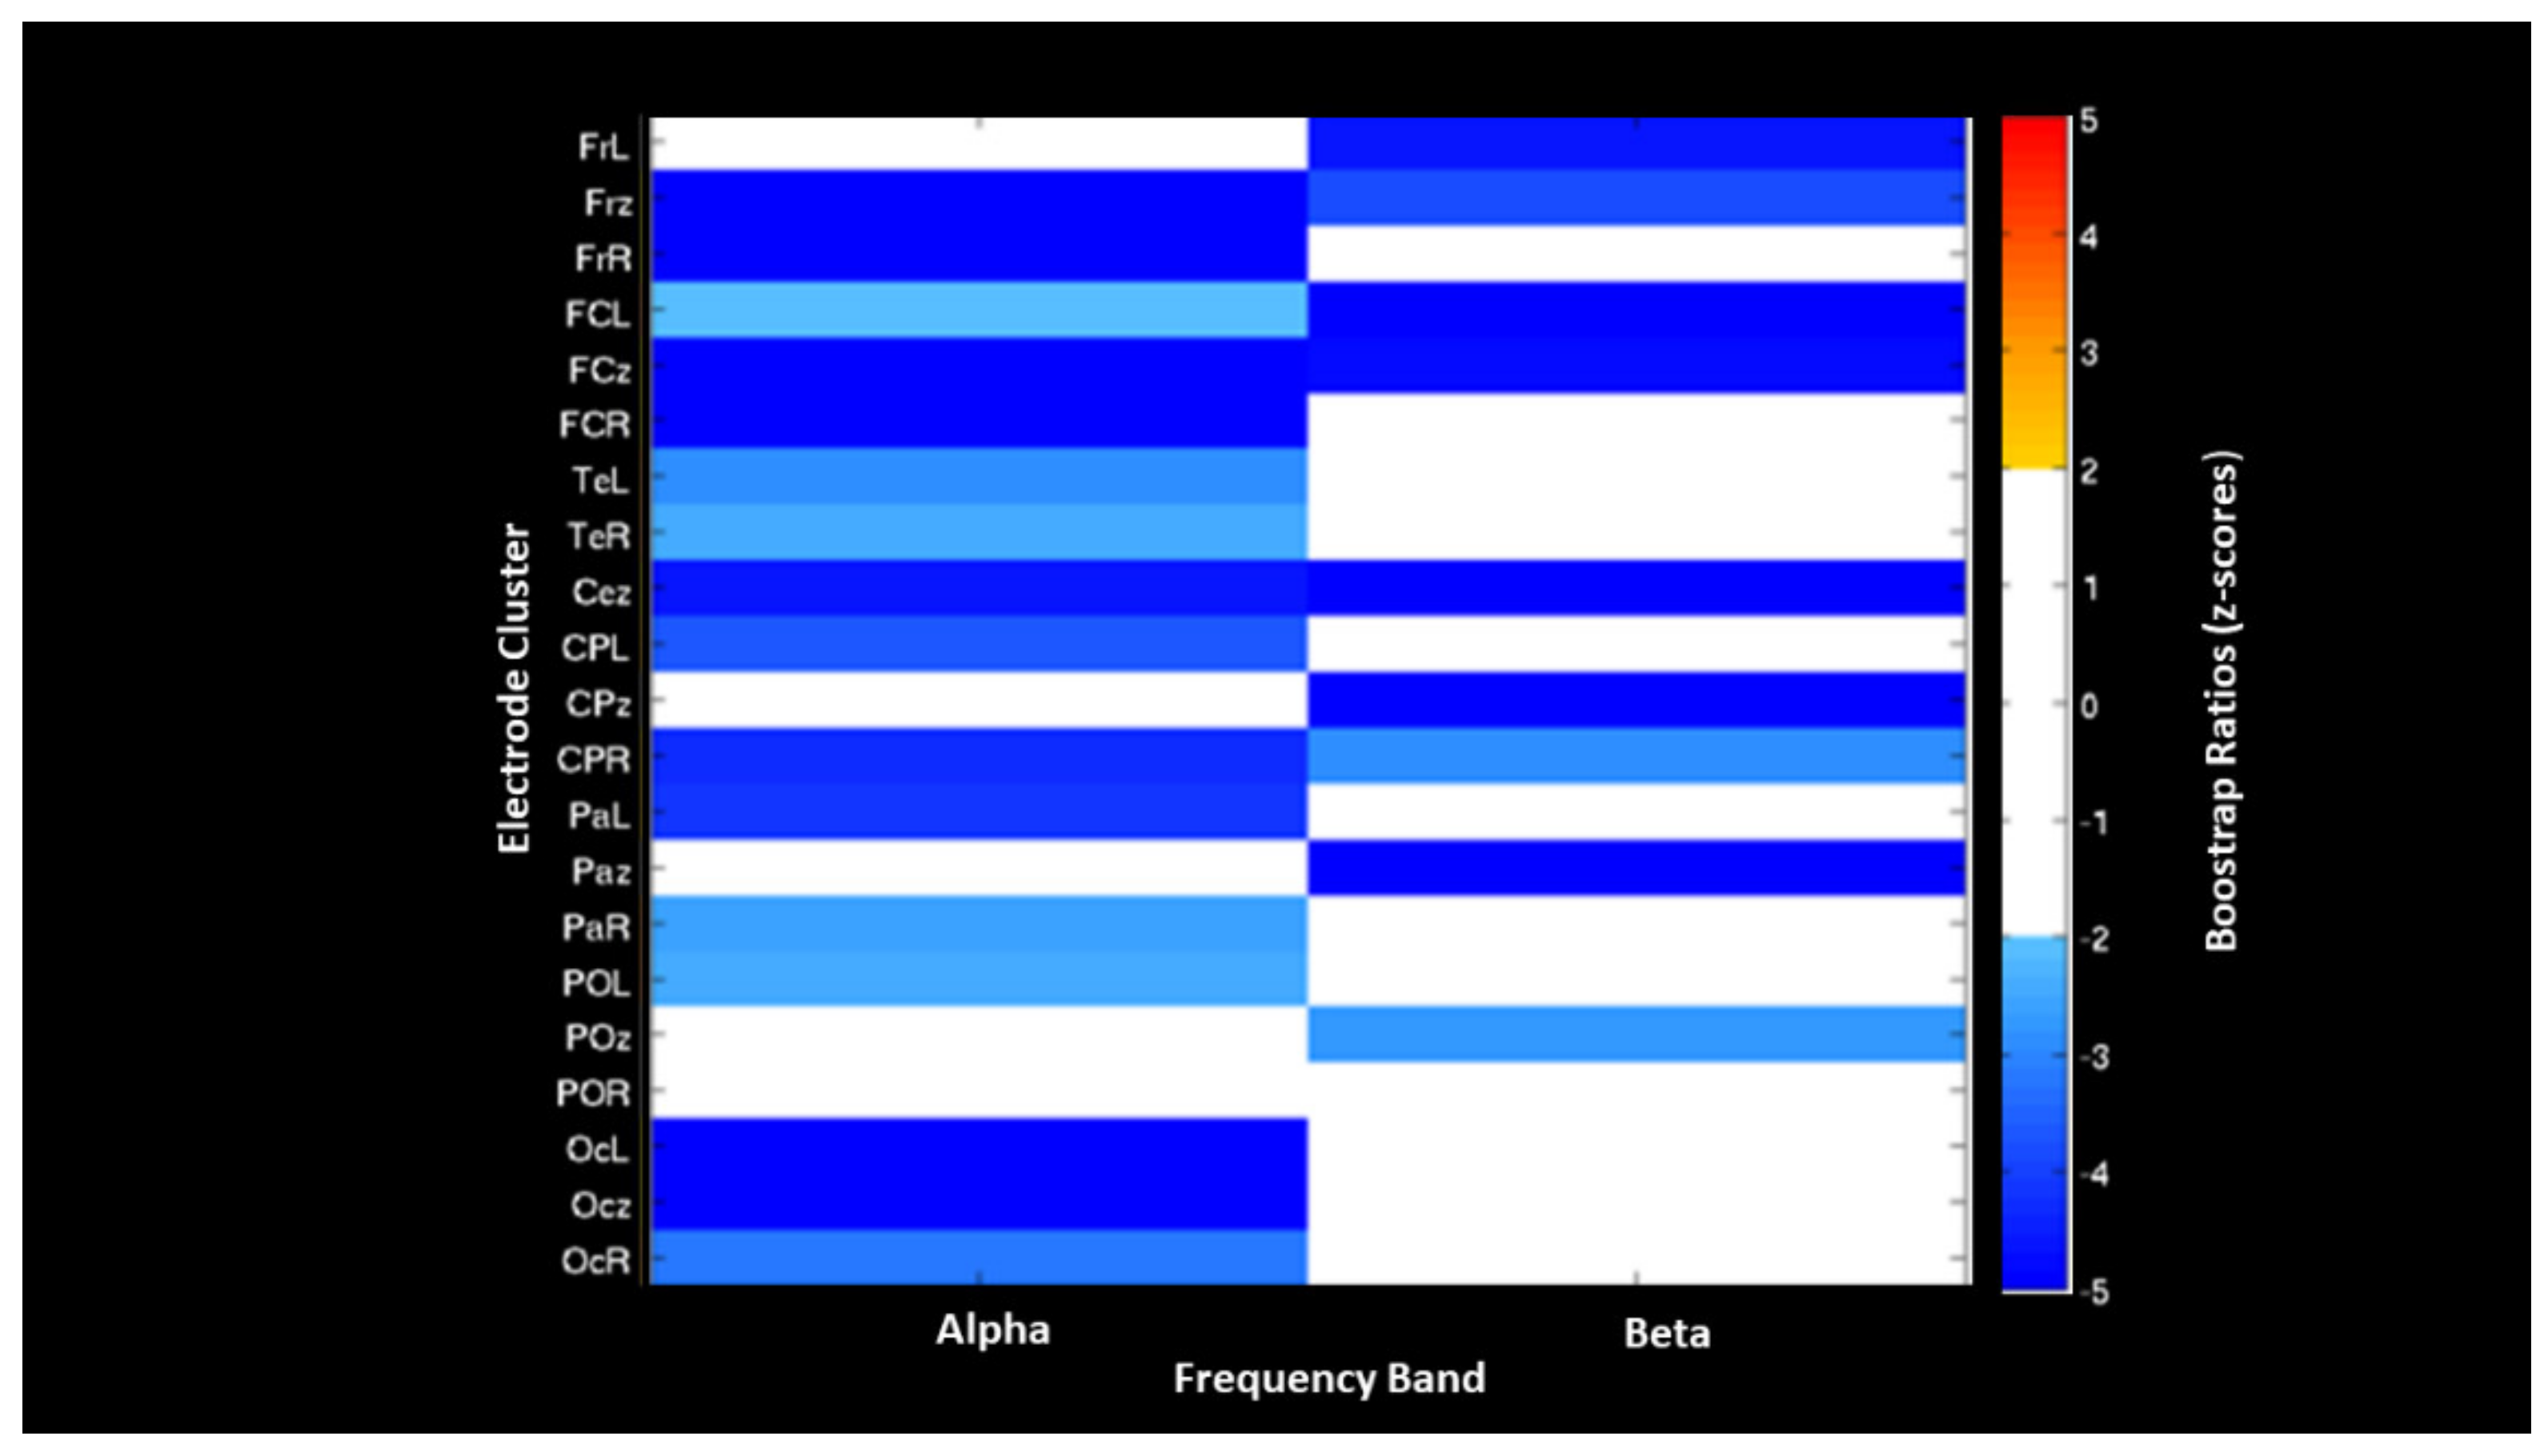
| PLS EEG-Acuity Correlation (Image recall) | OBI associated with more Desynch. than WBI | Left and Midline Bilateral and Midline | Frontal Parietal Parietal-Occipital Global | Beta Desynch. Alpha Desynch. | Figure 7 | |
| PLS EEG Task contrast (Visuospatial detection) | Anticorrelation between WBI (Synchronization) And OBI (Desynchronization) | Left Left Right and Midline Right Left | Frontal Occipital Parietal Occipital Parietal | Delta Theta Alpha Alpha Gamma | Figure 8A | |
| PLS EEG-Acuity Correlation (Visuospatial detection) | Inverse correlation between ERD and acuity Larger for OBI than WBI | Left Bilateral and Midline | Occipital Parietal | Alpha Beta | Figure 8B | |
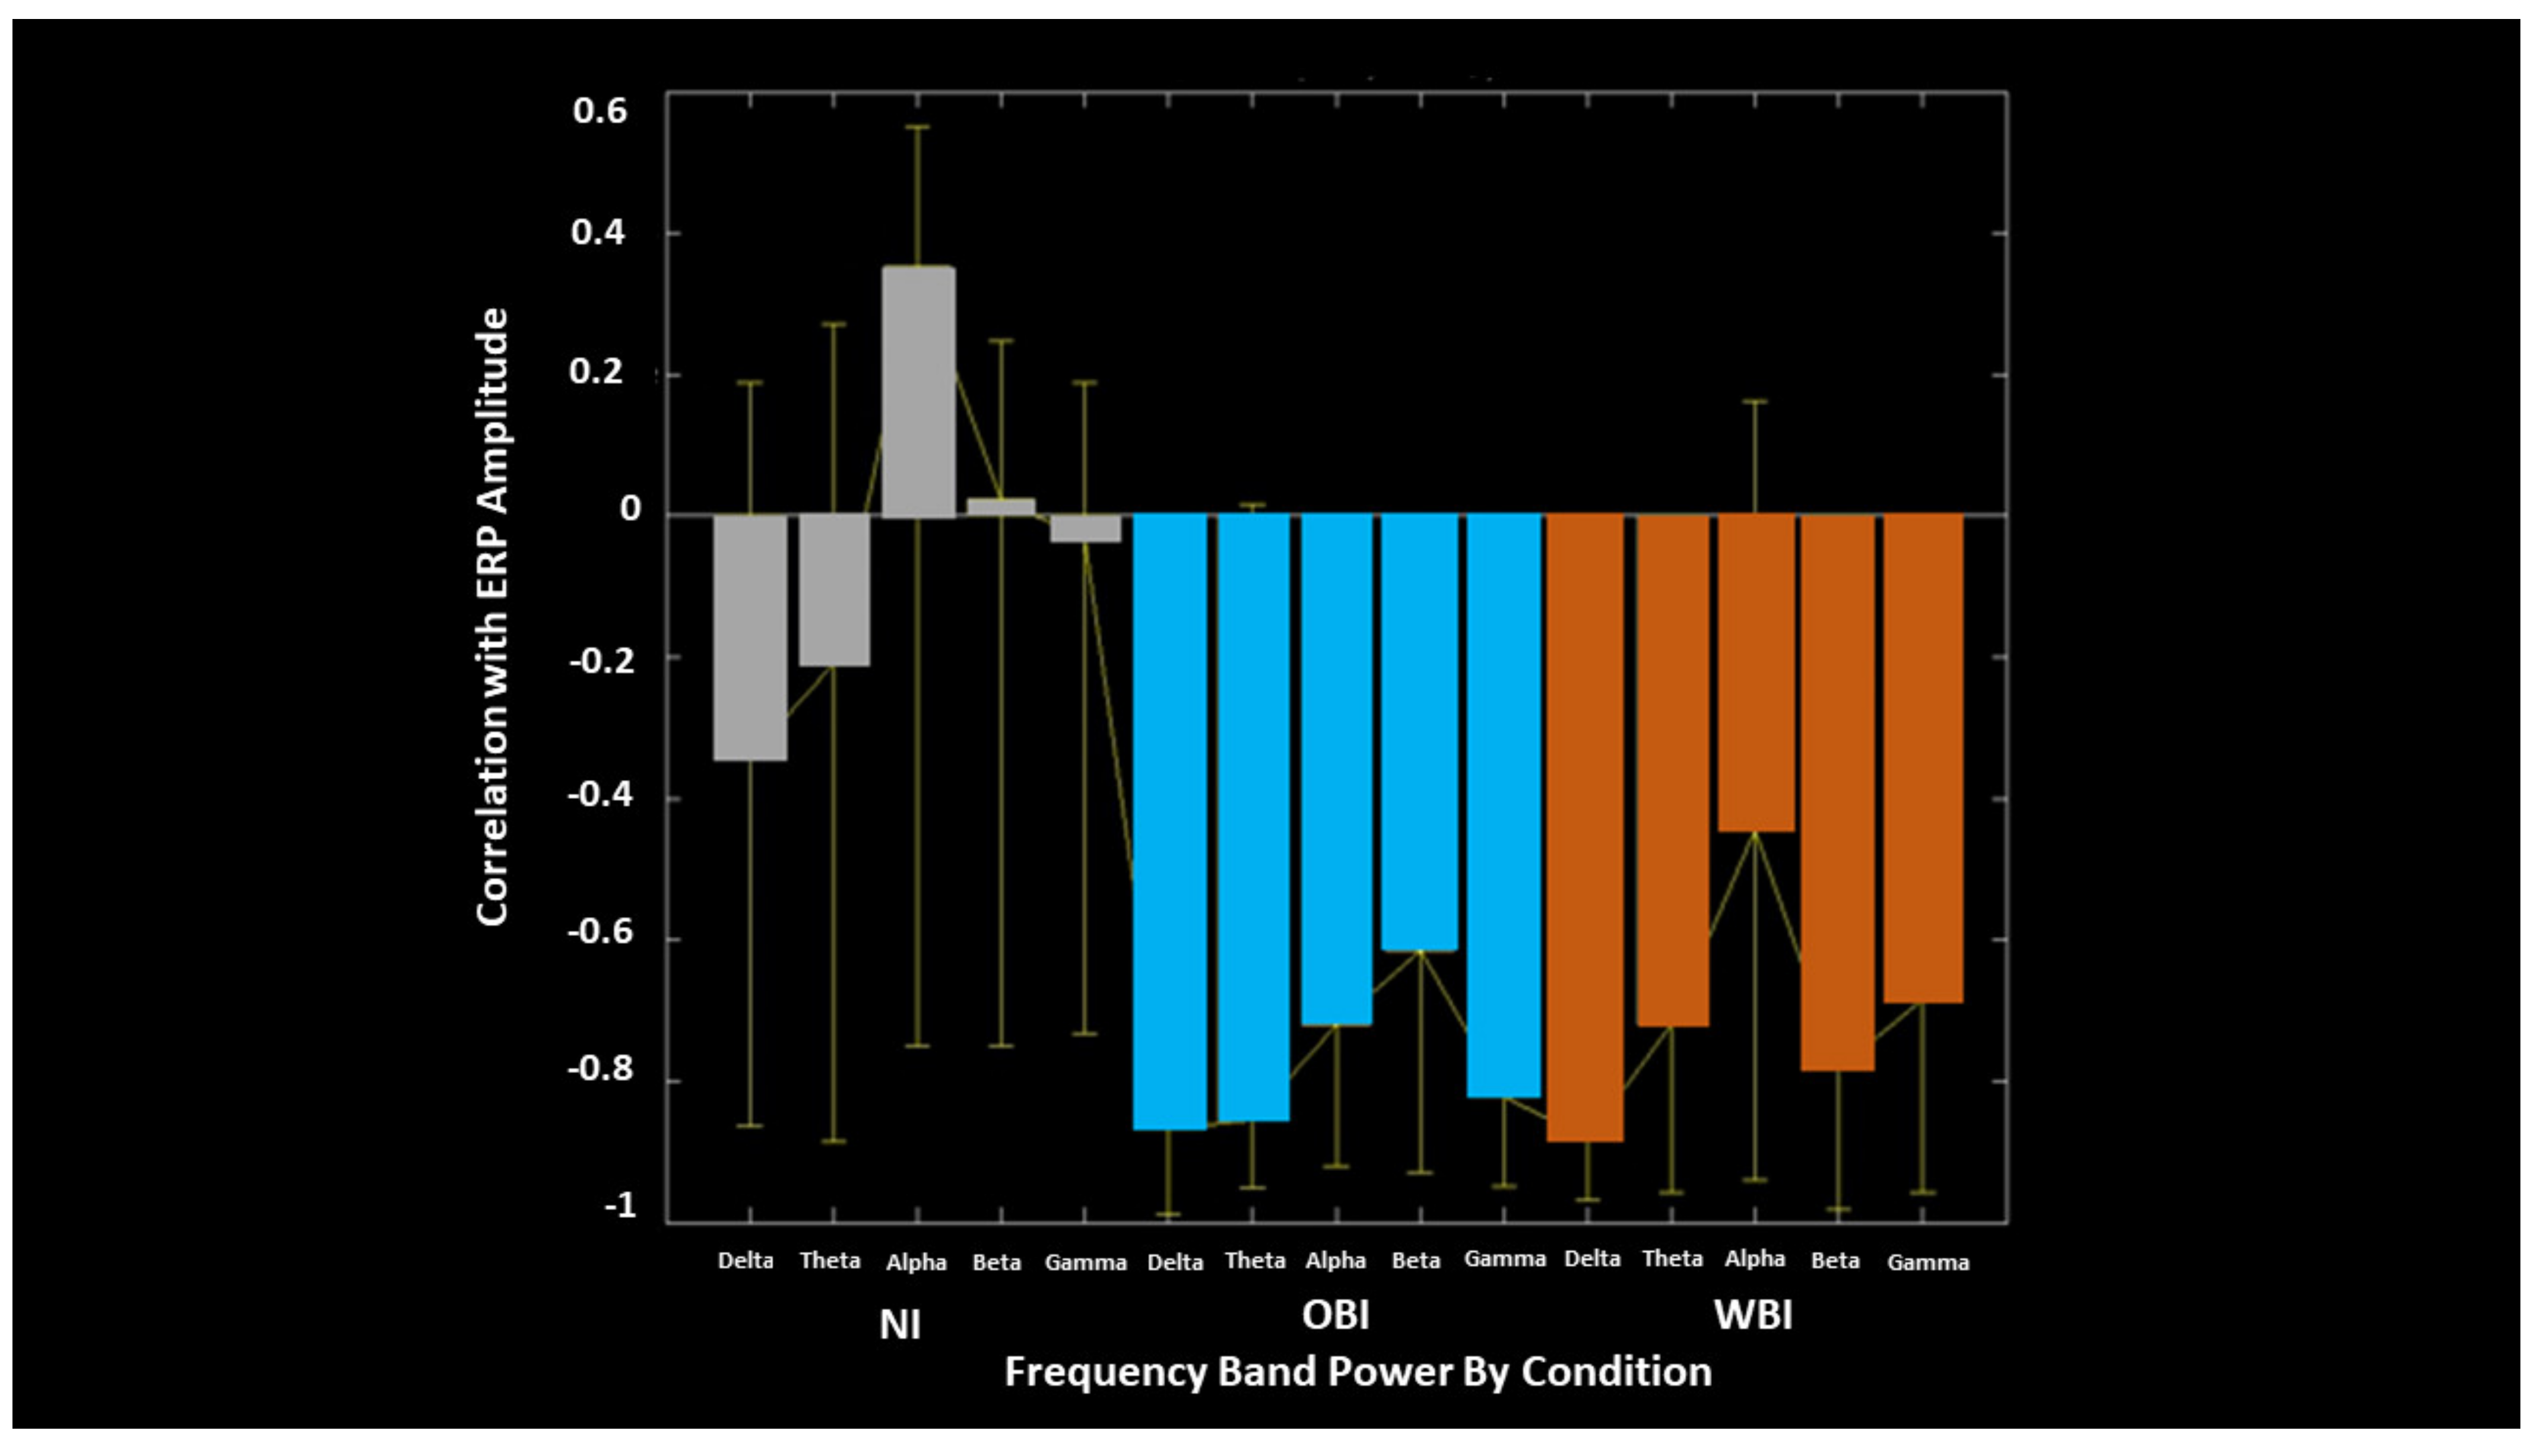
| PLS ERP-EEG Correlation | Inverse correlation between ERP and EEG Desynch.: OBI > WBI WBI > OBI | Alpha Beta | Figure 9 | |||
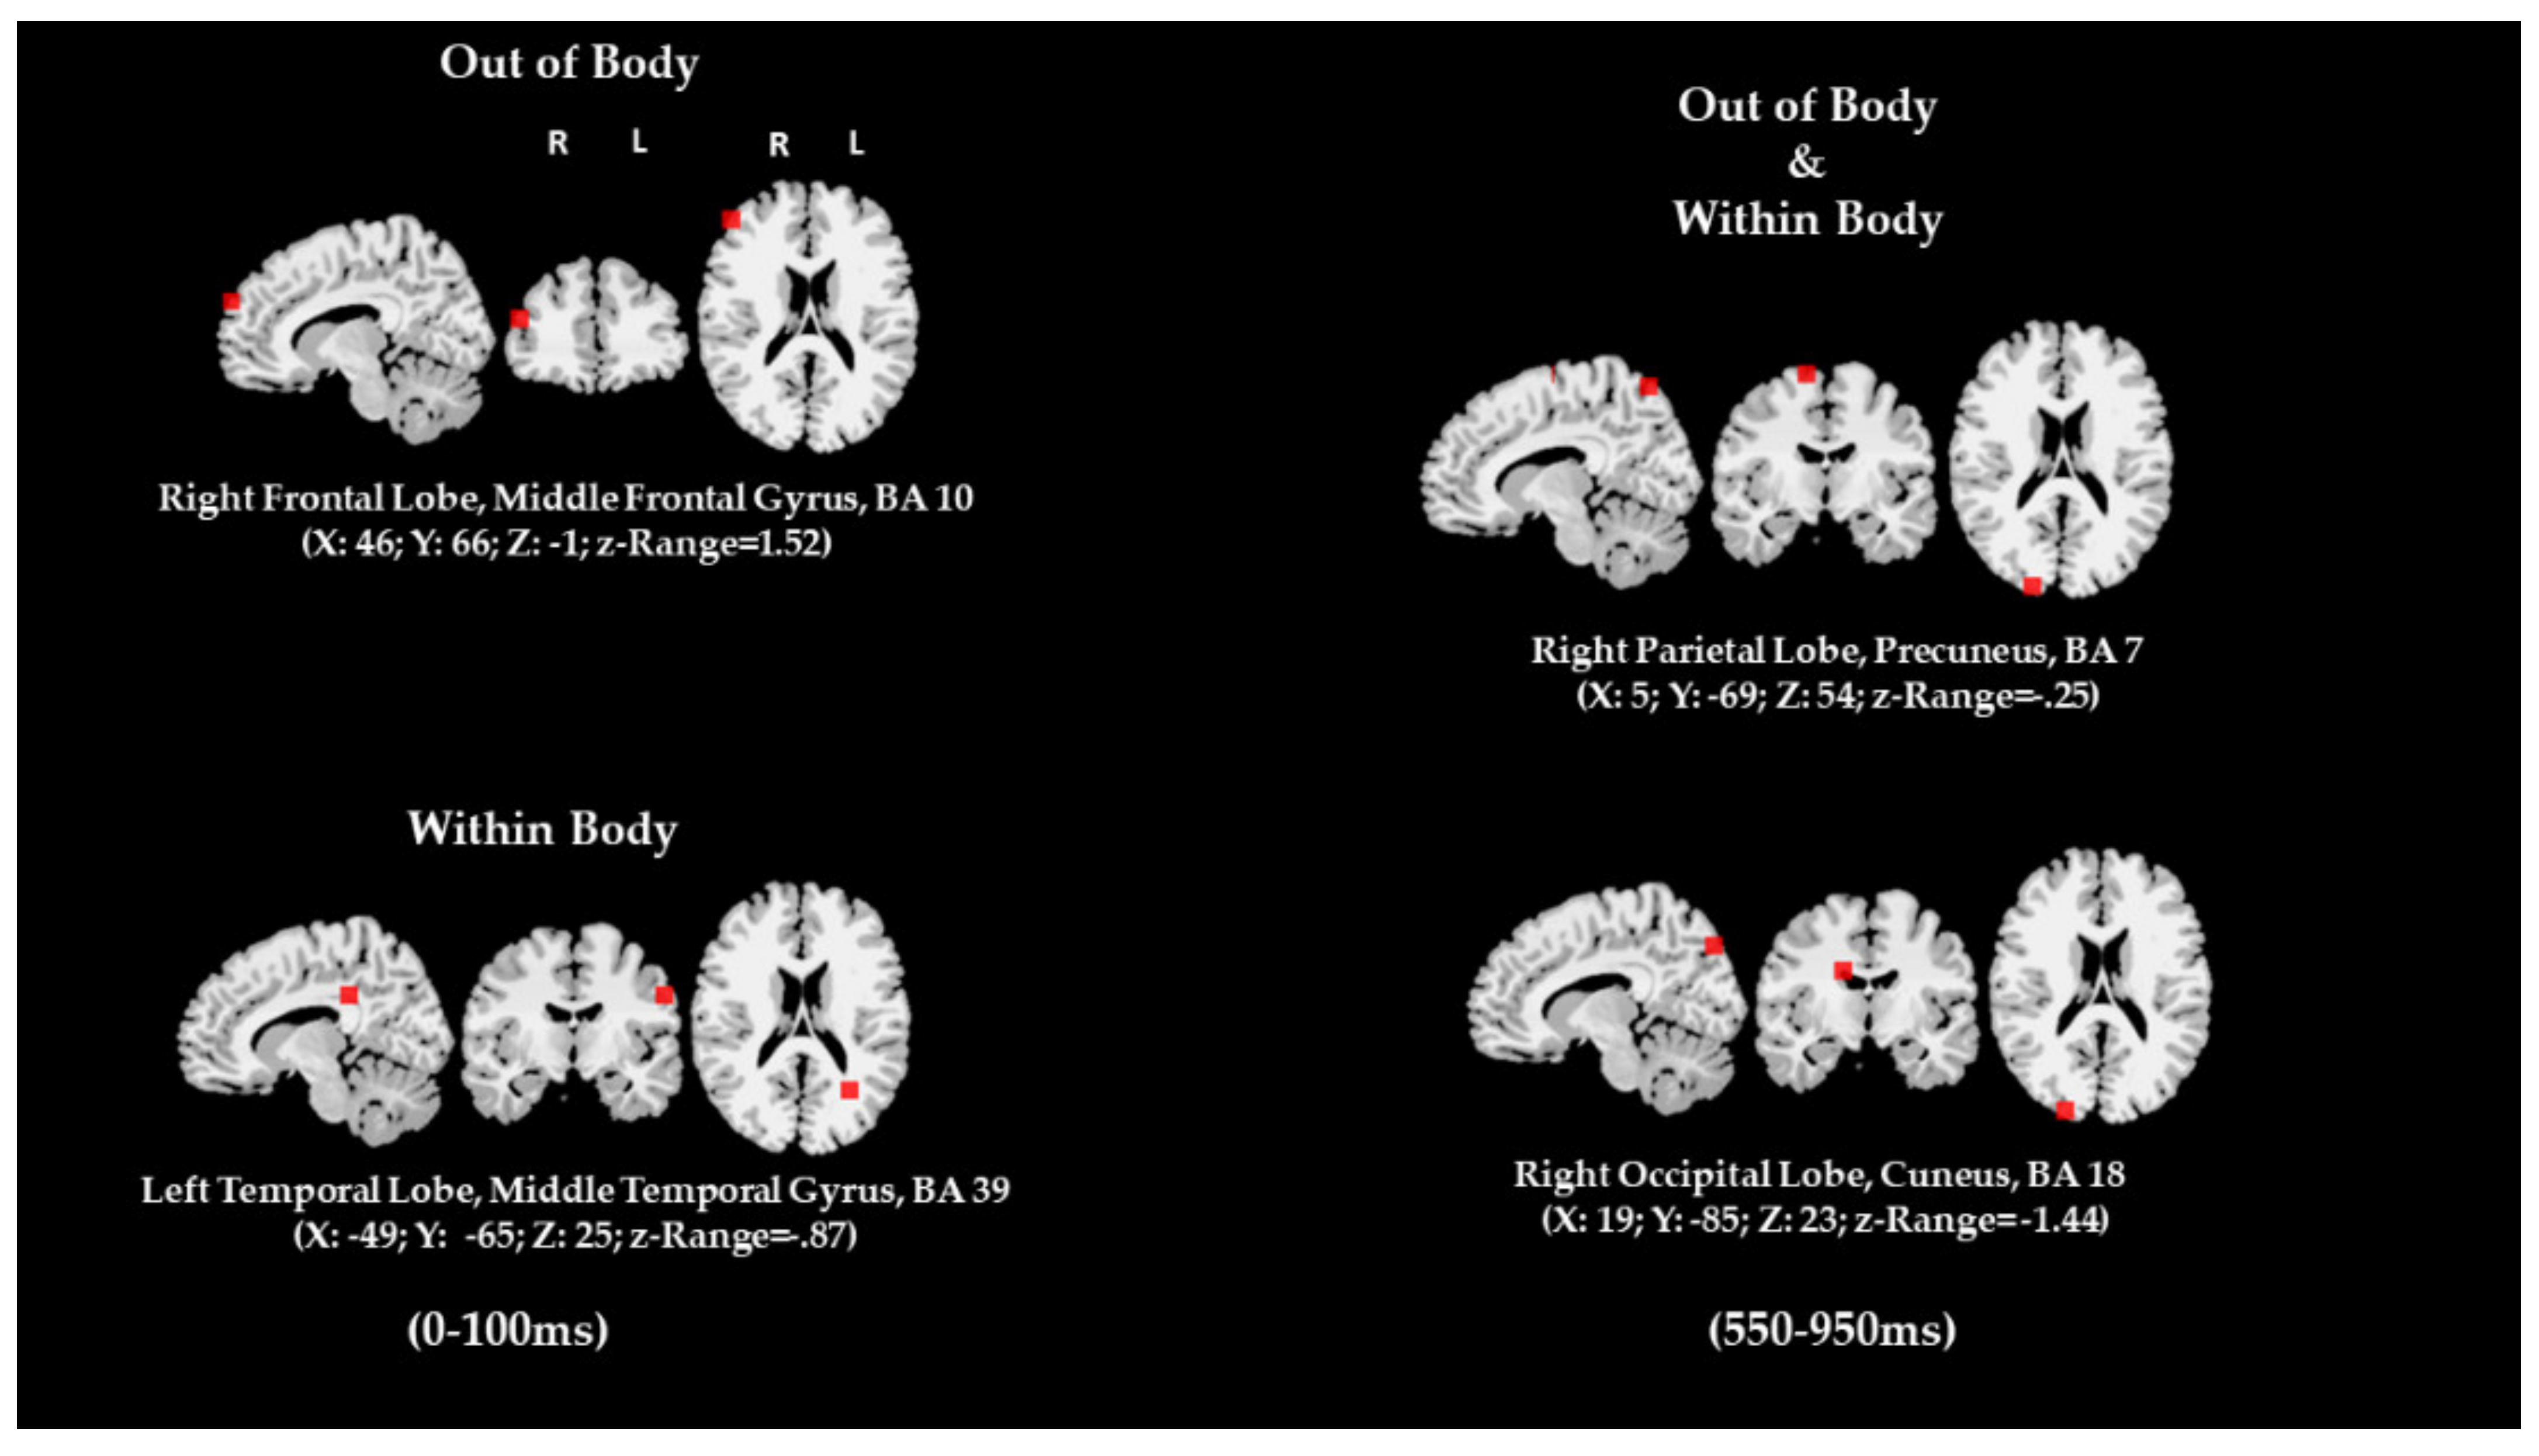
| Dipole Source Analysis (Image recall) | WBI and OBI WBI OBI | Right Left Right | Parietal Occipital Temporal Frontal | Figure 10 |
Publisher’s Note: MDPI stays neutral with regard to jurisdictional claims in published maps and institutional affiliations. |
© 2021 by the authors. Licensee MDPI, Basel, Switzerland. This article is an open access article distributed under the terms and conditions of the Creative Commons Attribution (CC BY) license (https://creativecommons.org/licenses/by/4.0/).
Share and Cite
D’Angiulli, A.; Kenney, D.; Pham, D.A.T.; Lefebvre, E.; Bellavance, J.; Buchanan, D.M. Neurofunctional Symmetries and Asymmetries during Voluntary out-of- and within-Body Vivid Imagery Concurrent with Orienting Attention and Visuospatial Detection. Symmetry 2021, 13, 1549. https://doi.org/10.3390/sym13081549
D’Angiulli A, Kenney D, Pham DAT, Lefebvre E, Bellavance J, Buchanan DM. Neurofunctional Symmetries and Asymmetries during Voluntary out-of- and within-Body Vivid Imagery Concurrent with Orienting Attention and Visuospatial Detection. Symmetry. 2021; 13(8):1549. https://doi.org/10.3390/sym13081549
Chicago/Turabian StyleD’Angiulli, Amedeo, Darren Kenney, Dao Anh Thu Pham, Etienne Lefebvre, Justin Bellavance, and Derrick Matthew Buchanan. 2021. "Neurofunctional Symmetries and Asymmetries during Voluntary out-of- and within-Body Vivid Imagery Concurrent with Orienting Attention and Visuospatial Detection" Symmetry 13, no. 8: 1549. https://doi.org/10.3390/sym13081549
APA StyleD’Angiulli, A., Kenney, D., Pham, D. A. T., Lefebvre, E., Bellavance, J., & Buchanan, D. M. (2021). Neurofunctional Symmetries and Asymmetries during Voluntary out-of- and within-Body Vivid Imagery Concurrent with Orienting Attention and Visuospatial Detection. Symmetry, 13(8), 1549. https://doi.org/10.3390/sym13081549