
The Kinetic Model of Diffusion and Reactions in Powder Catalysts during Temperature Programmed Oxygen Isotopic Exchange Process


Abstract
1. Introduction
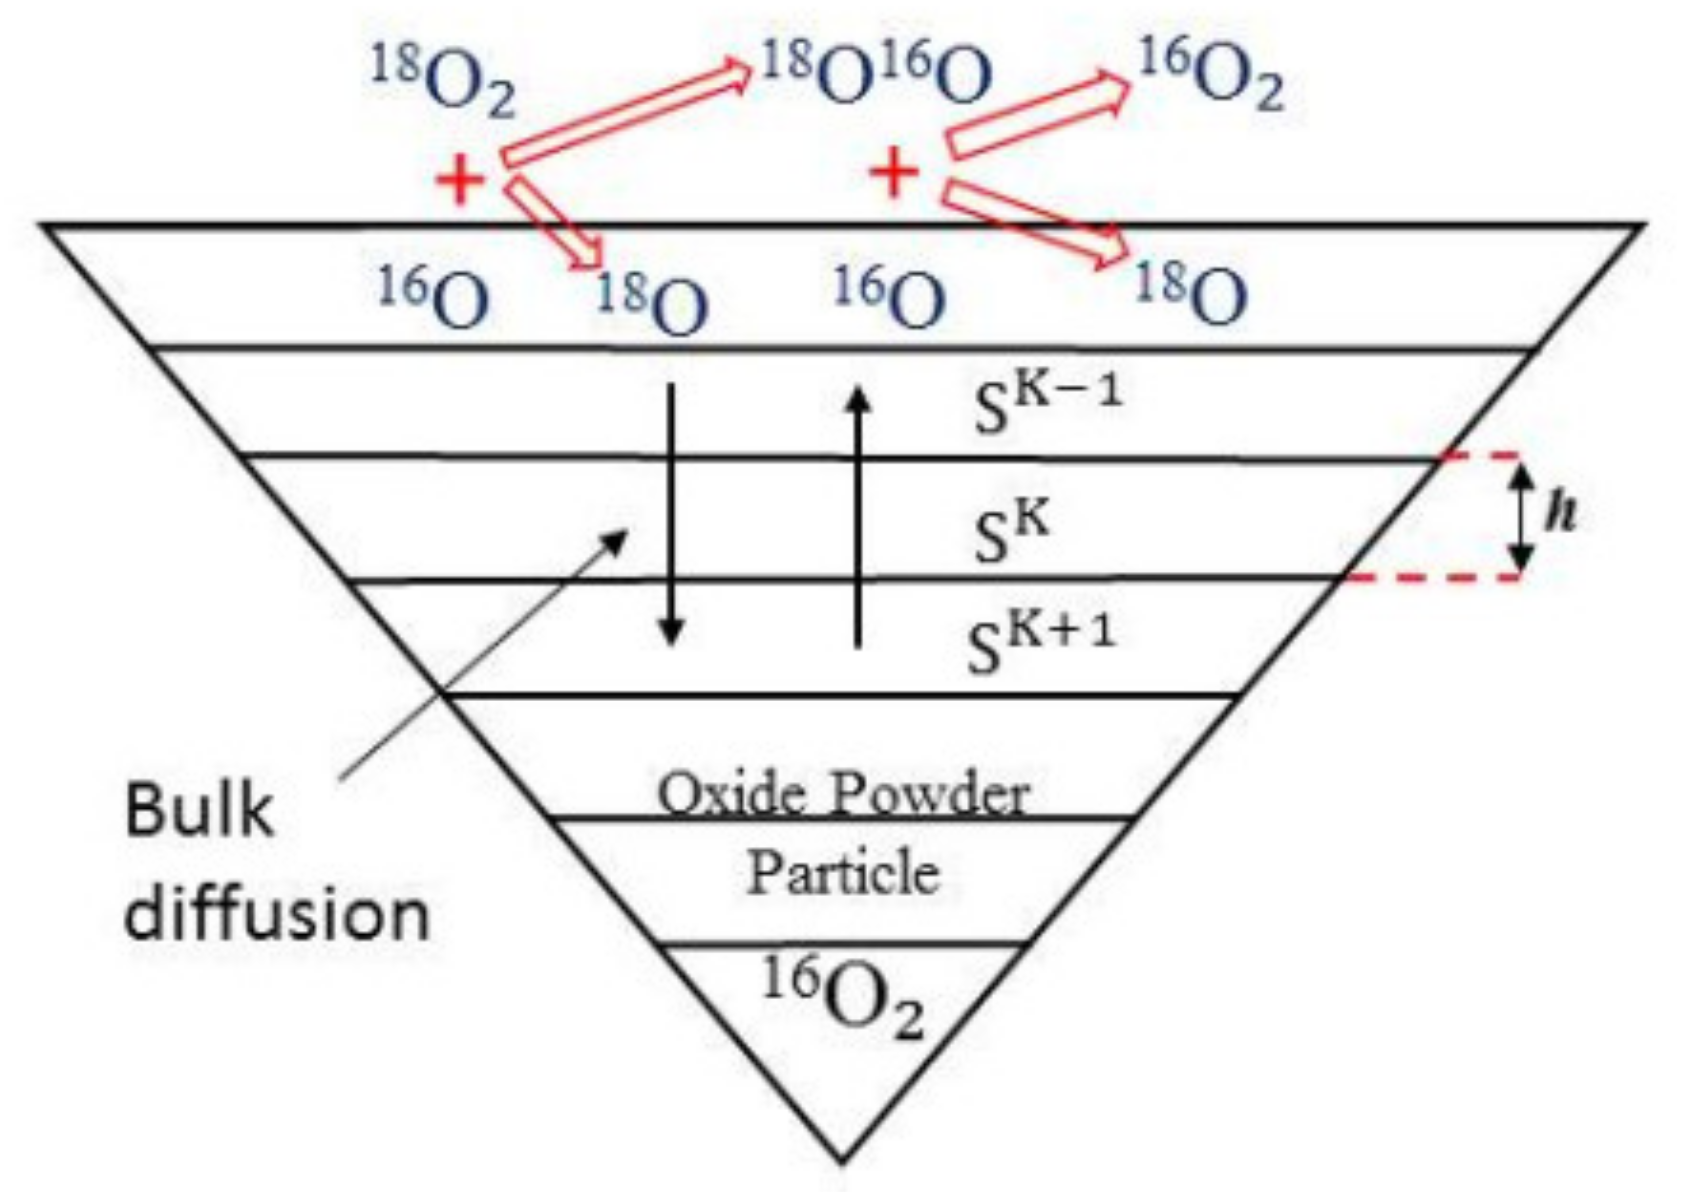
2. The Model
18O16Og+16O (K = 2) → 16O16Os+18O (K = 2)
16O16Os+16O (K = 2) → 18O16Os+16O (K = 2)
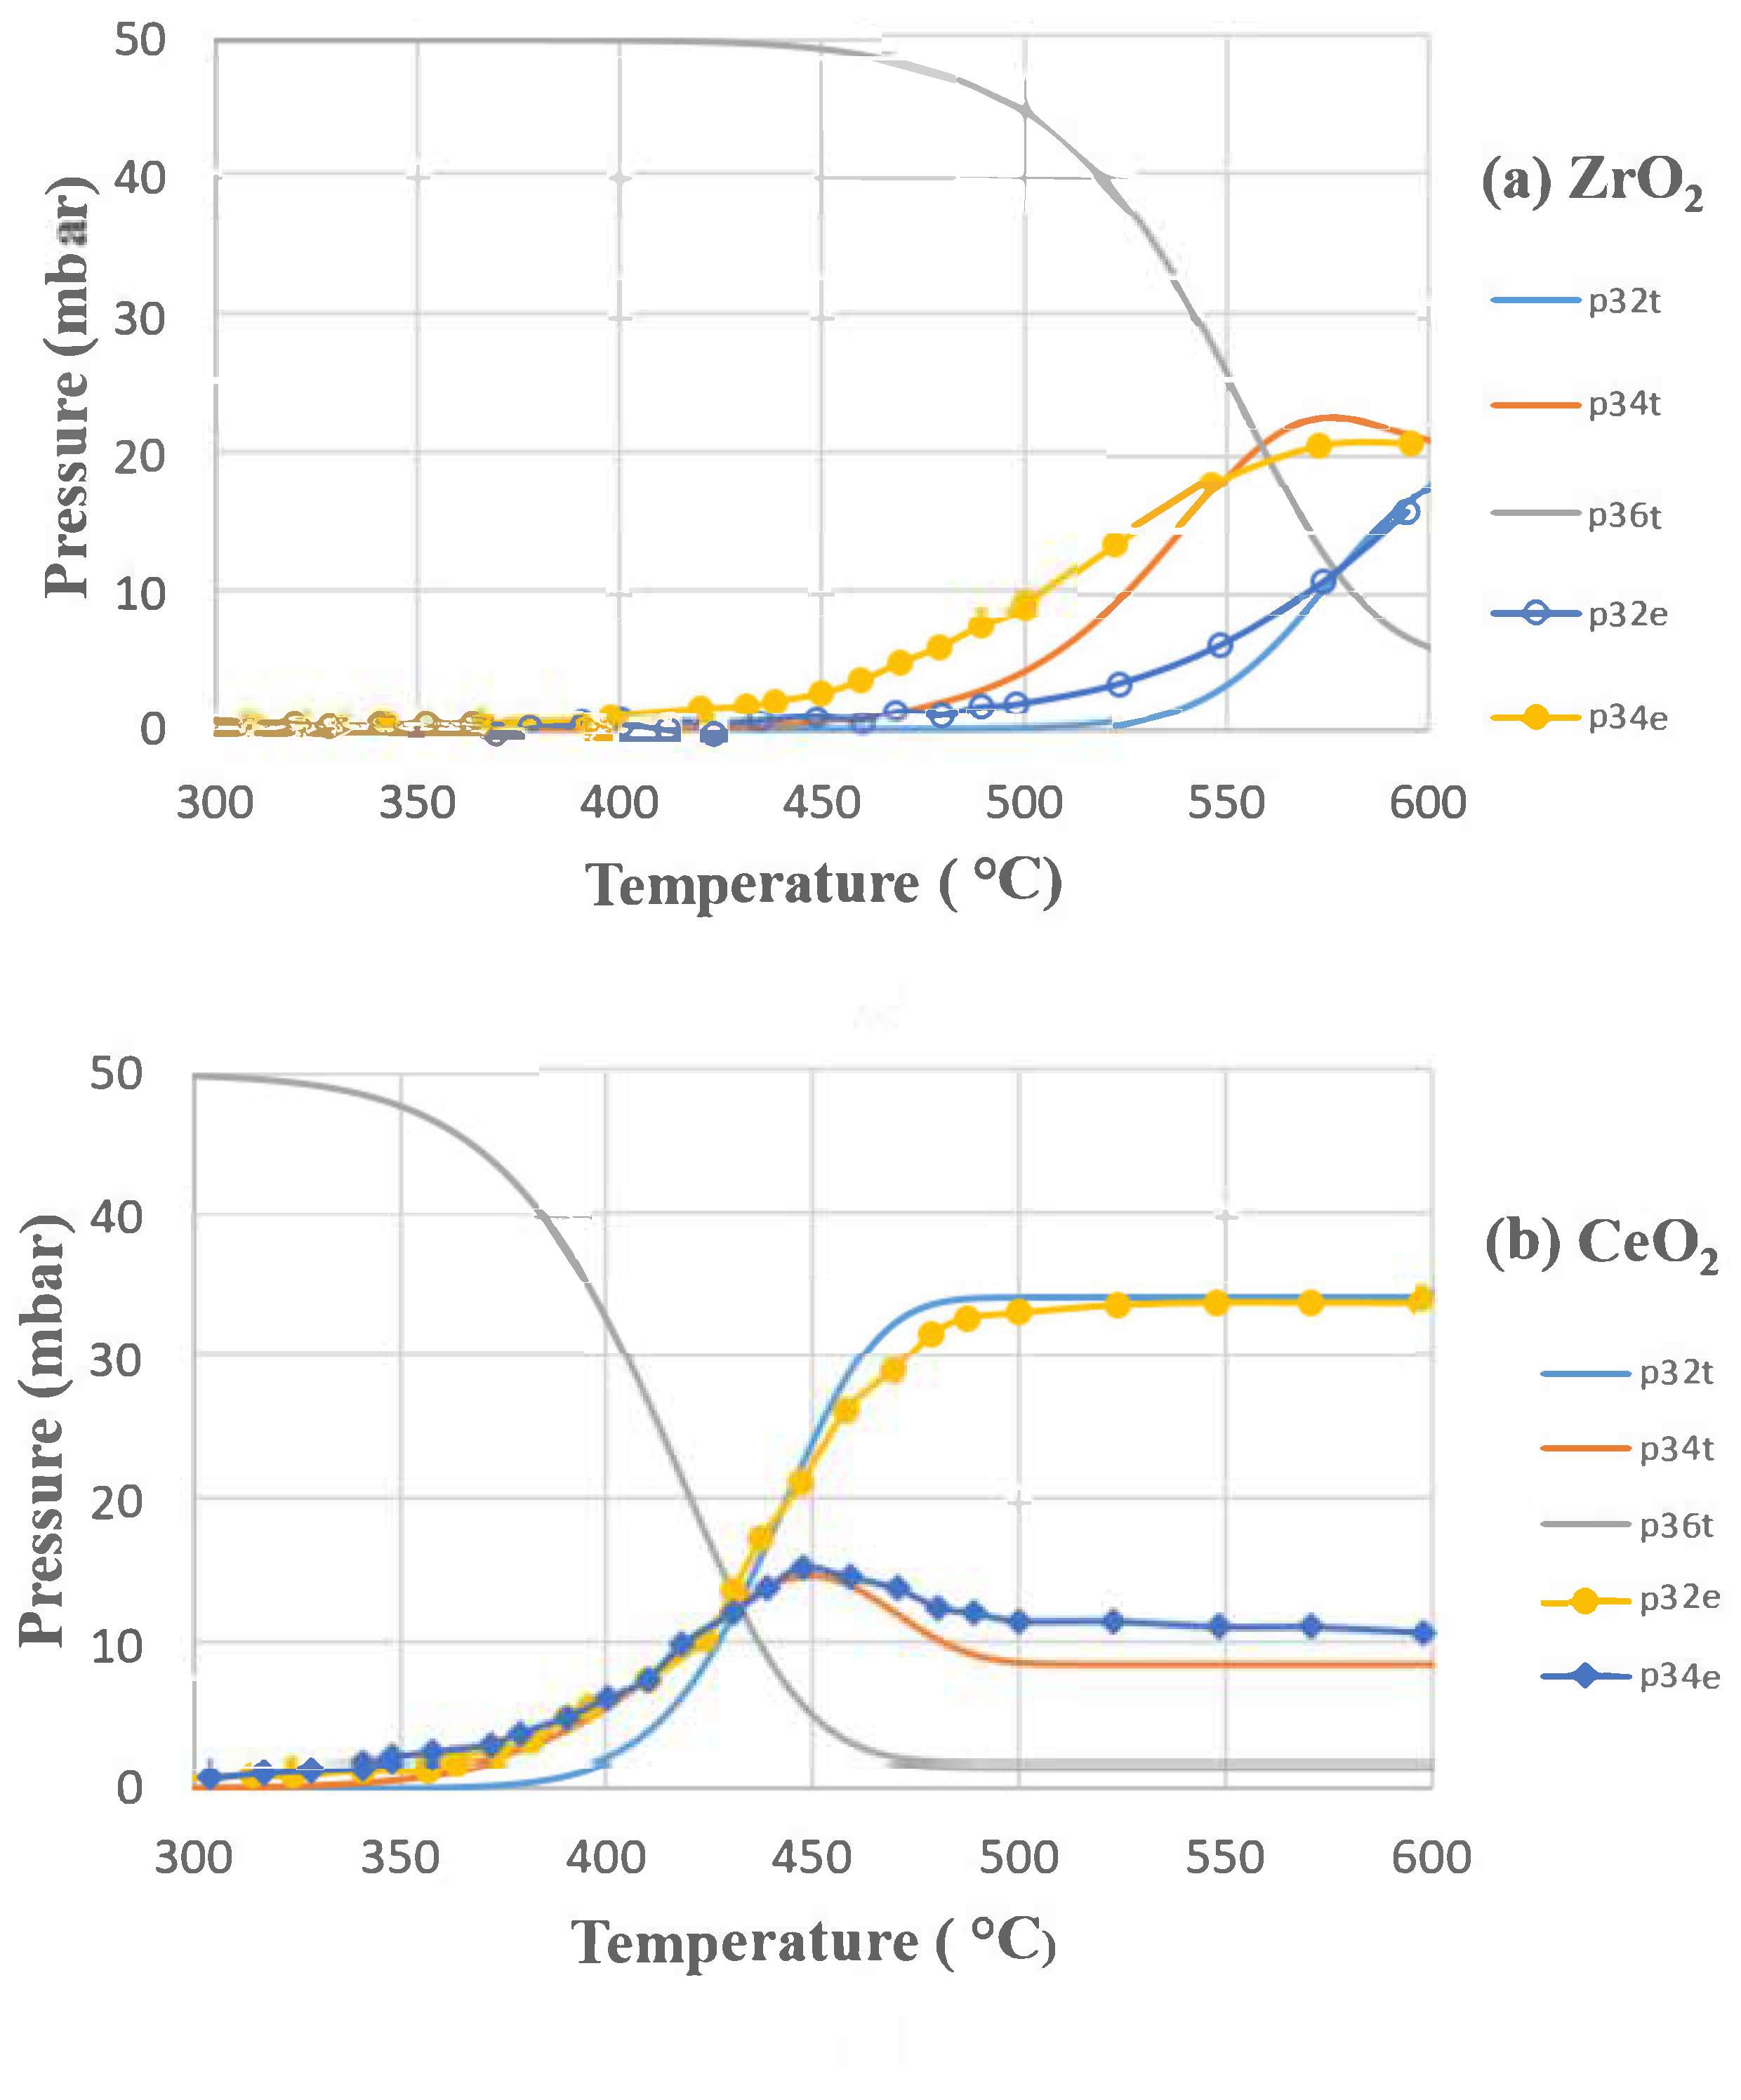
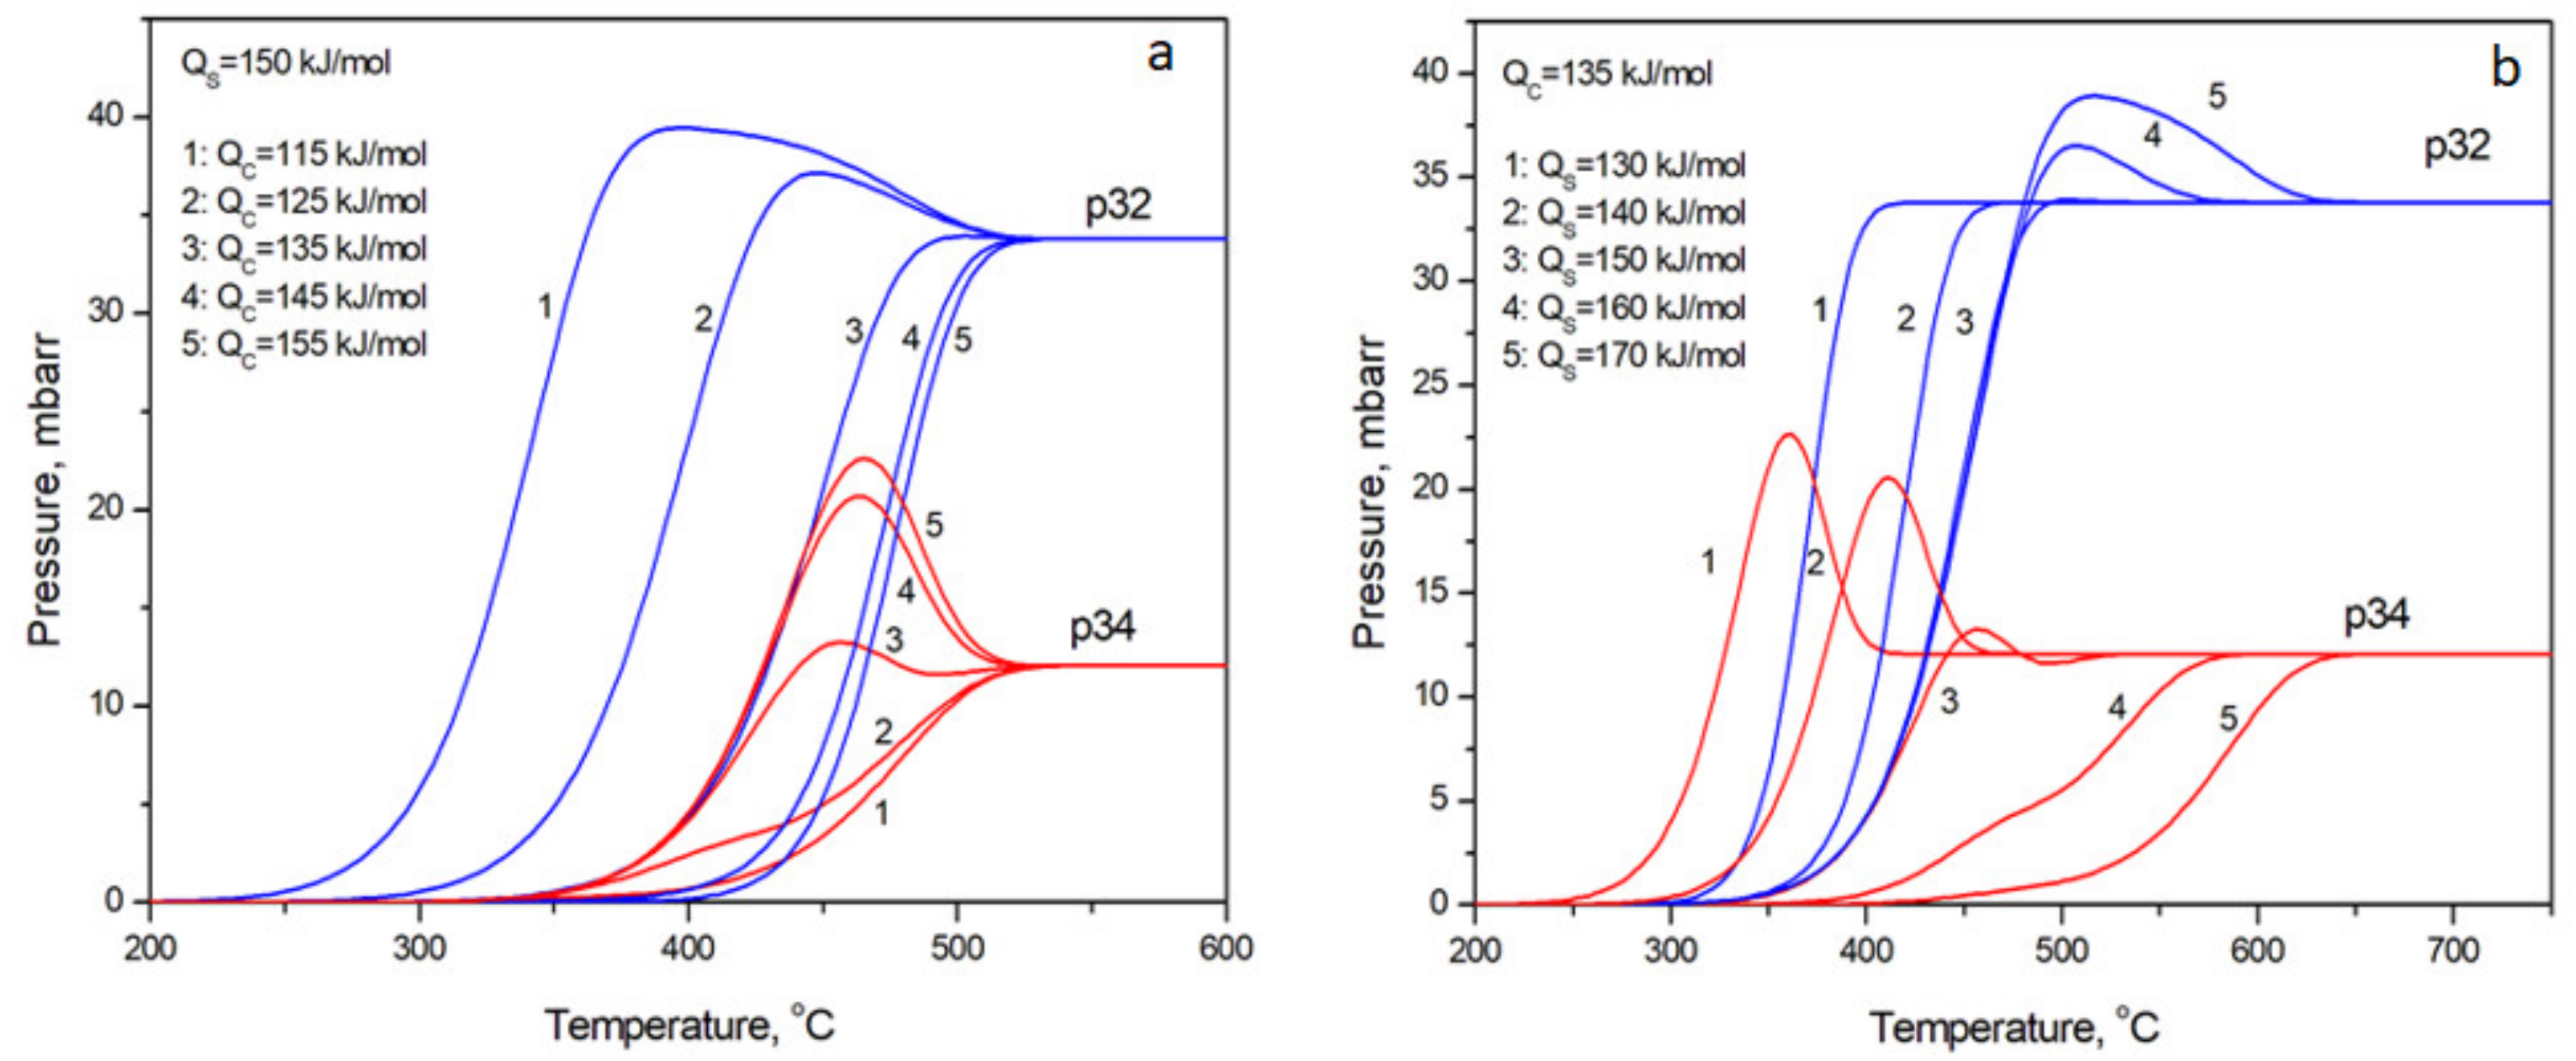
3. Results and Discussion
4. Conclusions
- The matrix forms of equations of simple and complex isotopic heteroexchange have symmetry in various cross sections and show interesting mathematical regularities.
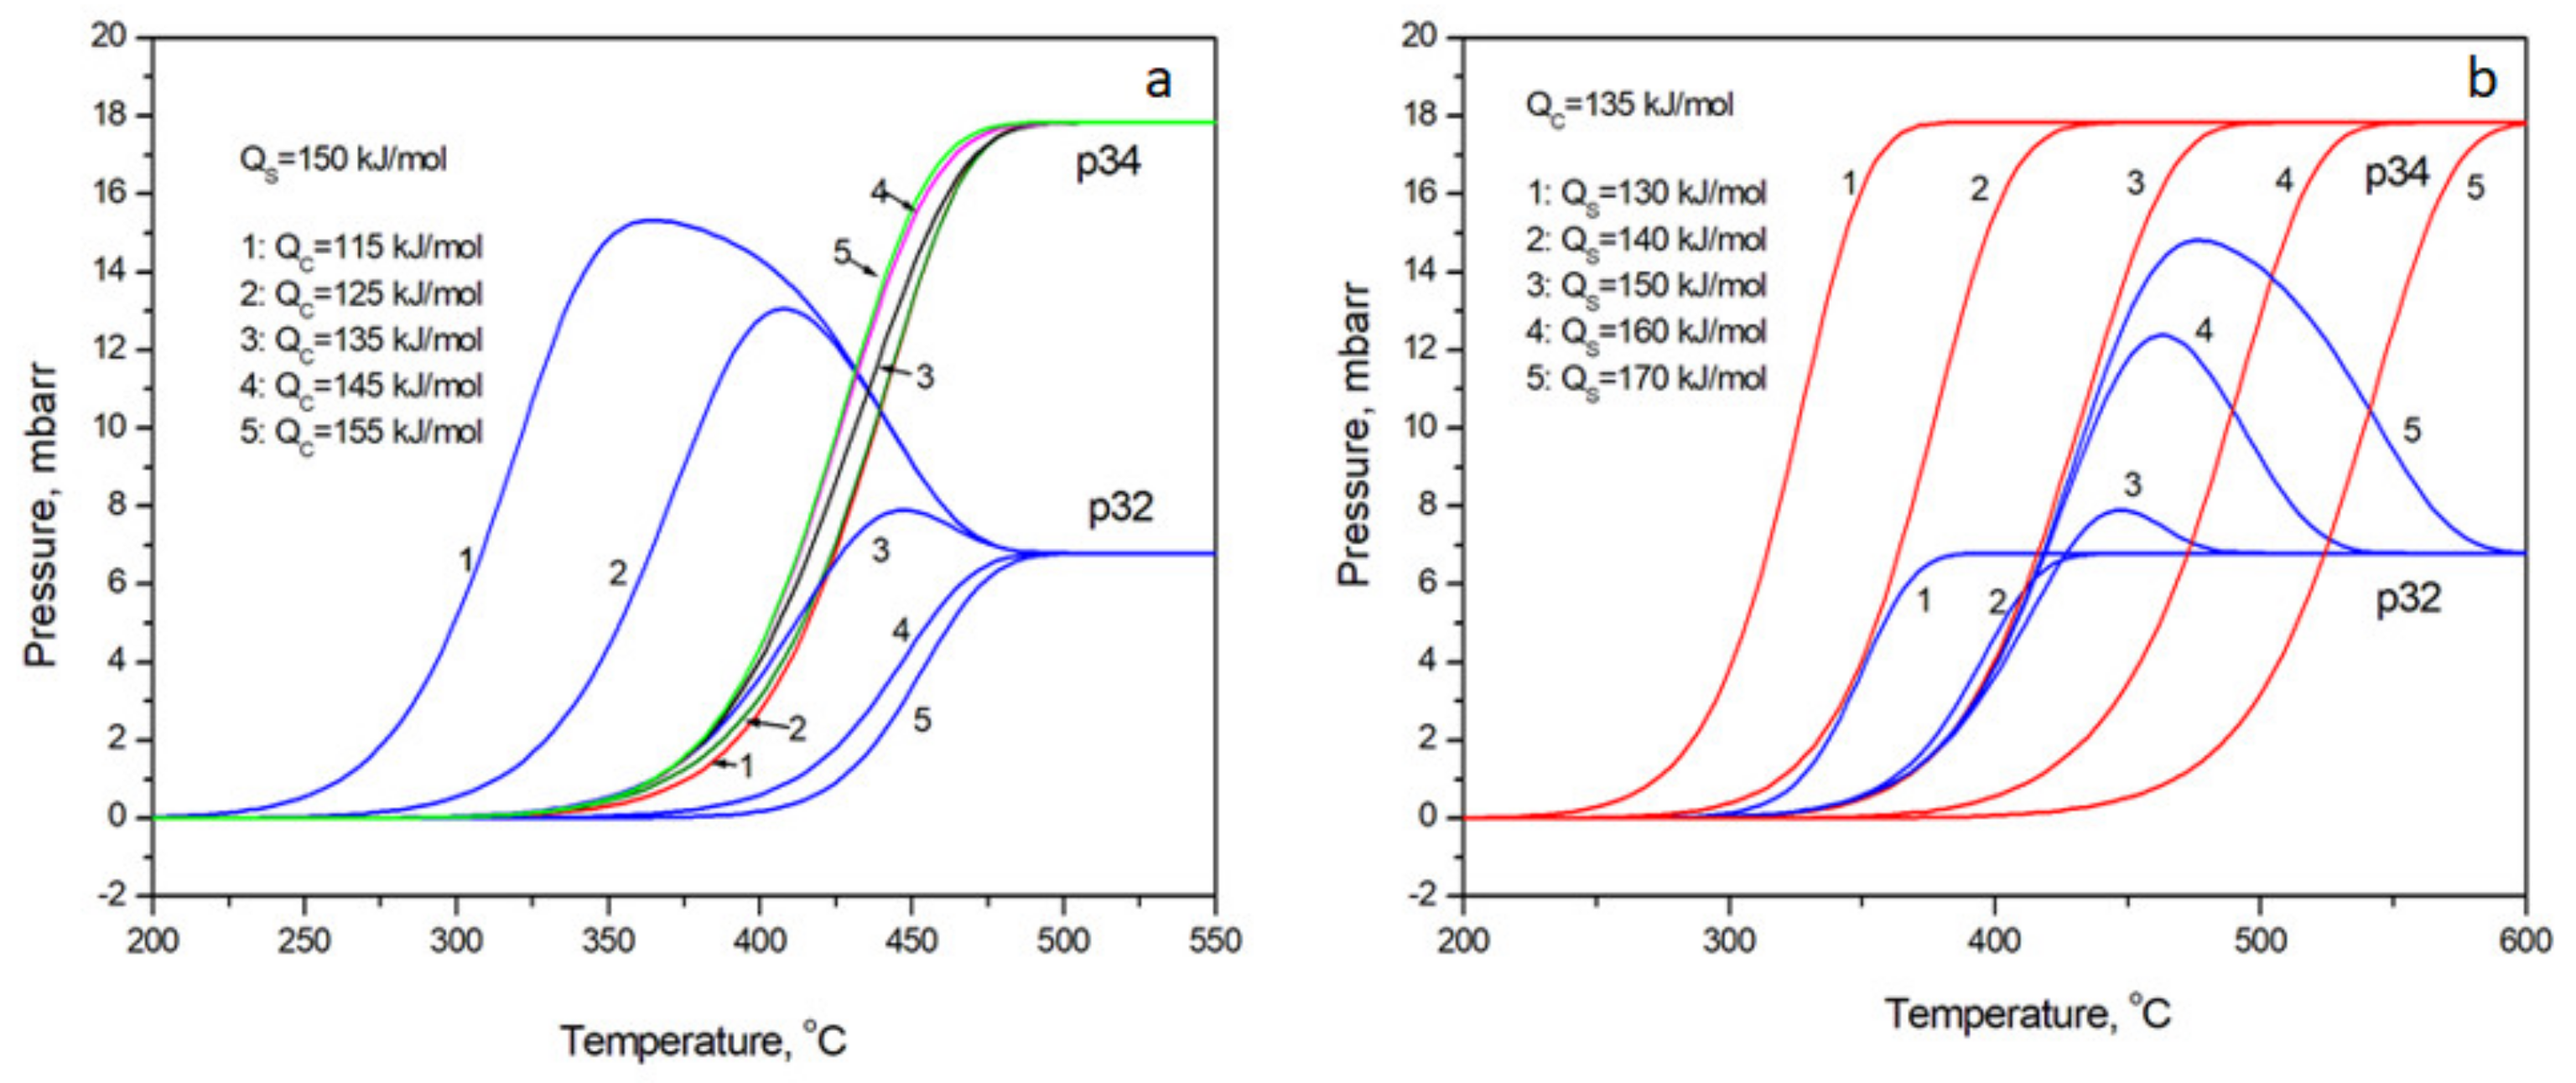
- Despite the variety of different shapes of partial pressure kinetic curves registered during TPIE there are strict regularities: (a) in the case of p34 < p32 at steady state, the p34 curves have well expressed maximums or may be without extremums at higher values of activation energies or together with maximum can exist minimum; the p32 curves approaches steady state passing broad maximums or without them but never through the minimums. (b) in the case p34 > p32 at steady state, the p32 curve approaches steady state passing broad maximums or without them at higher activation energies, p34 curve approaches steady state without extremums.
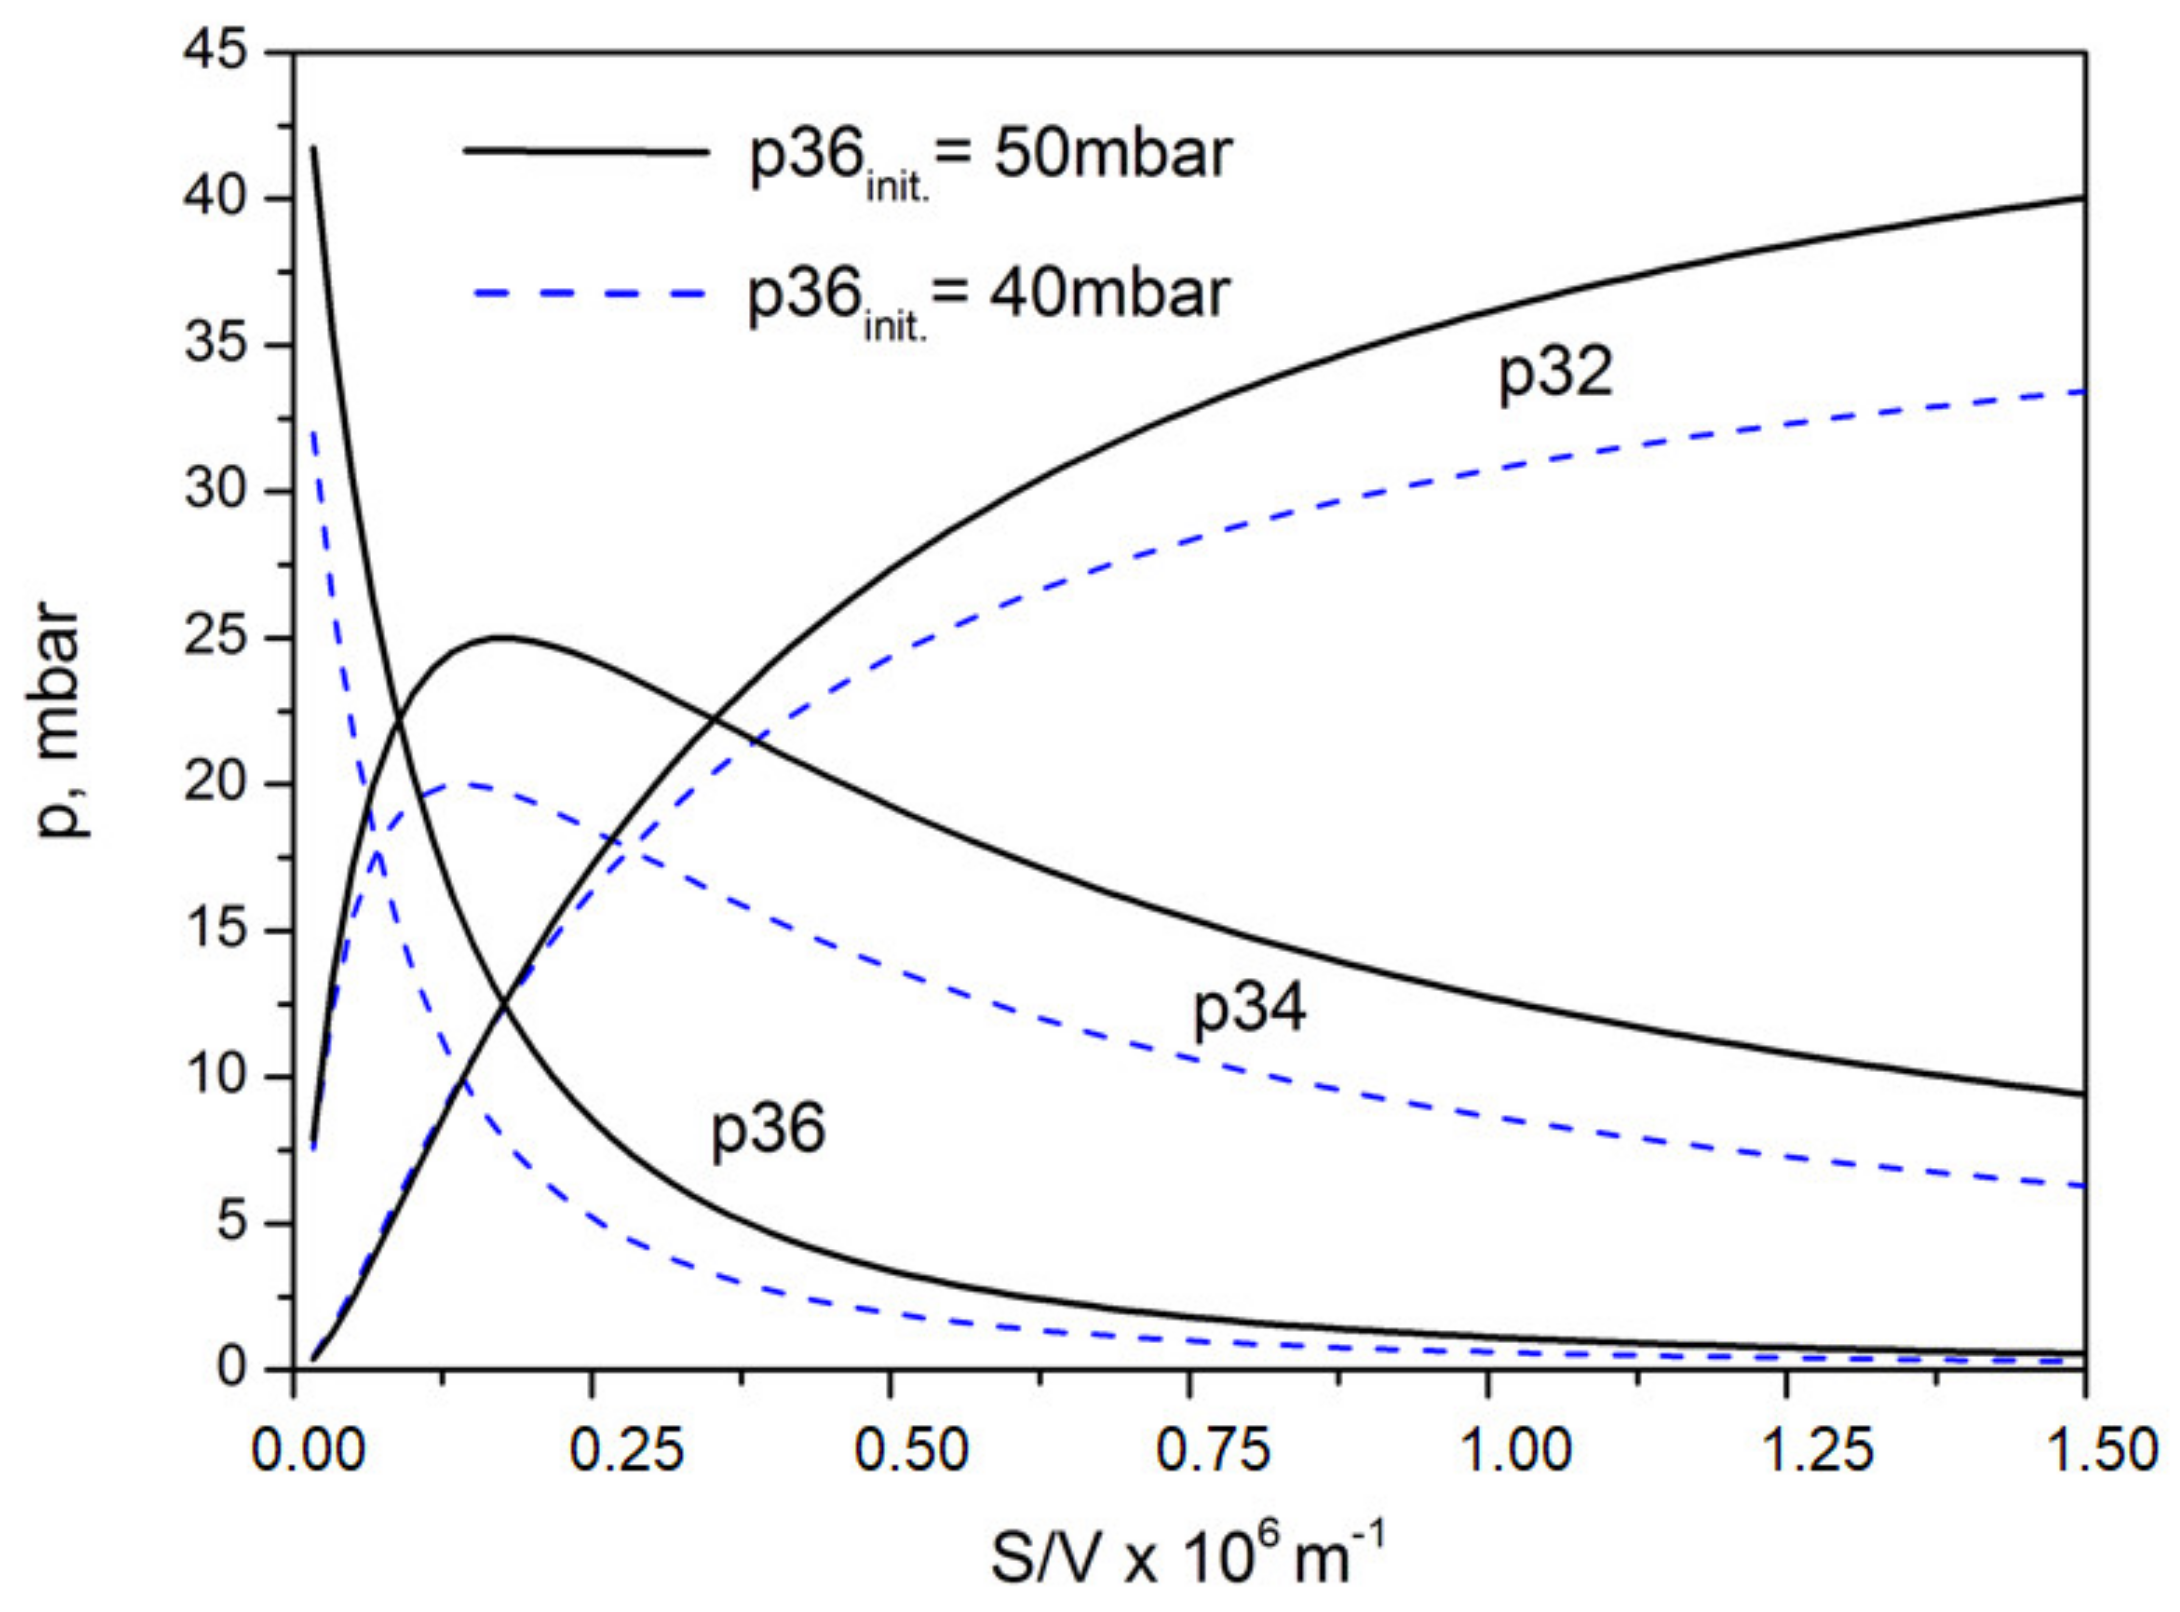
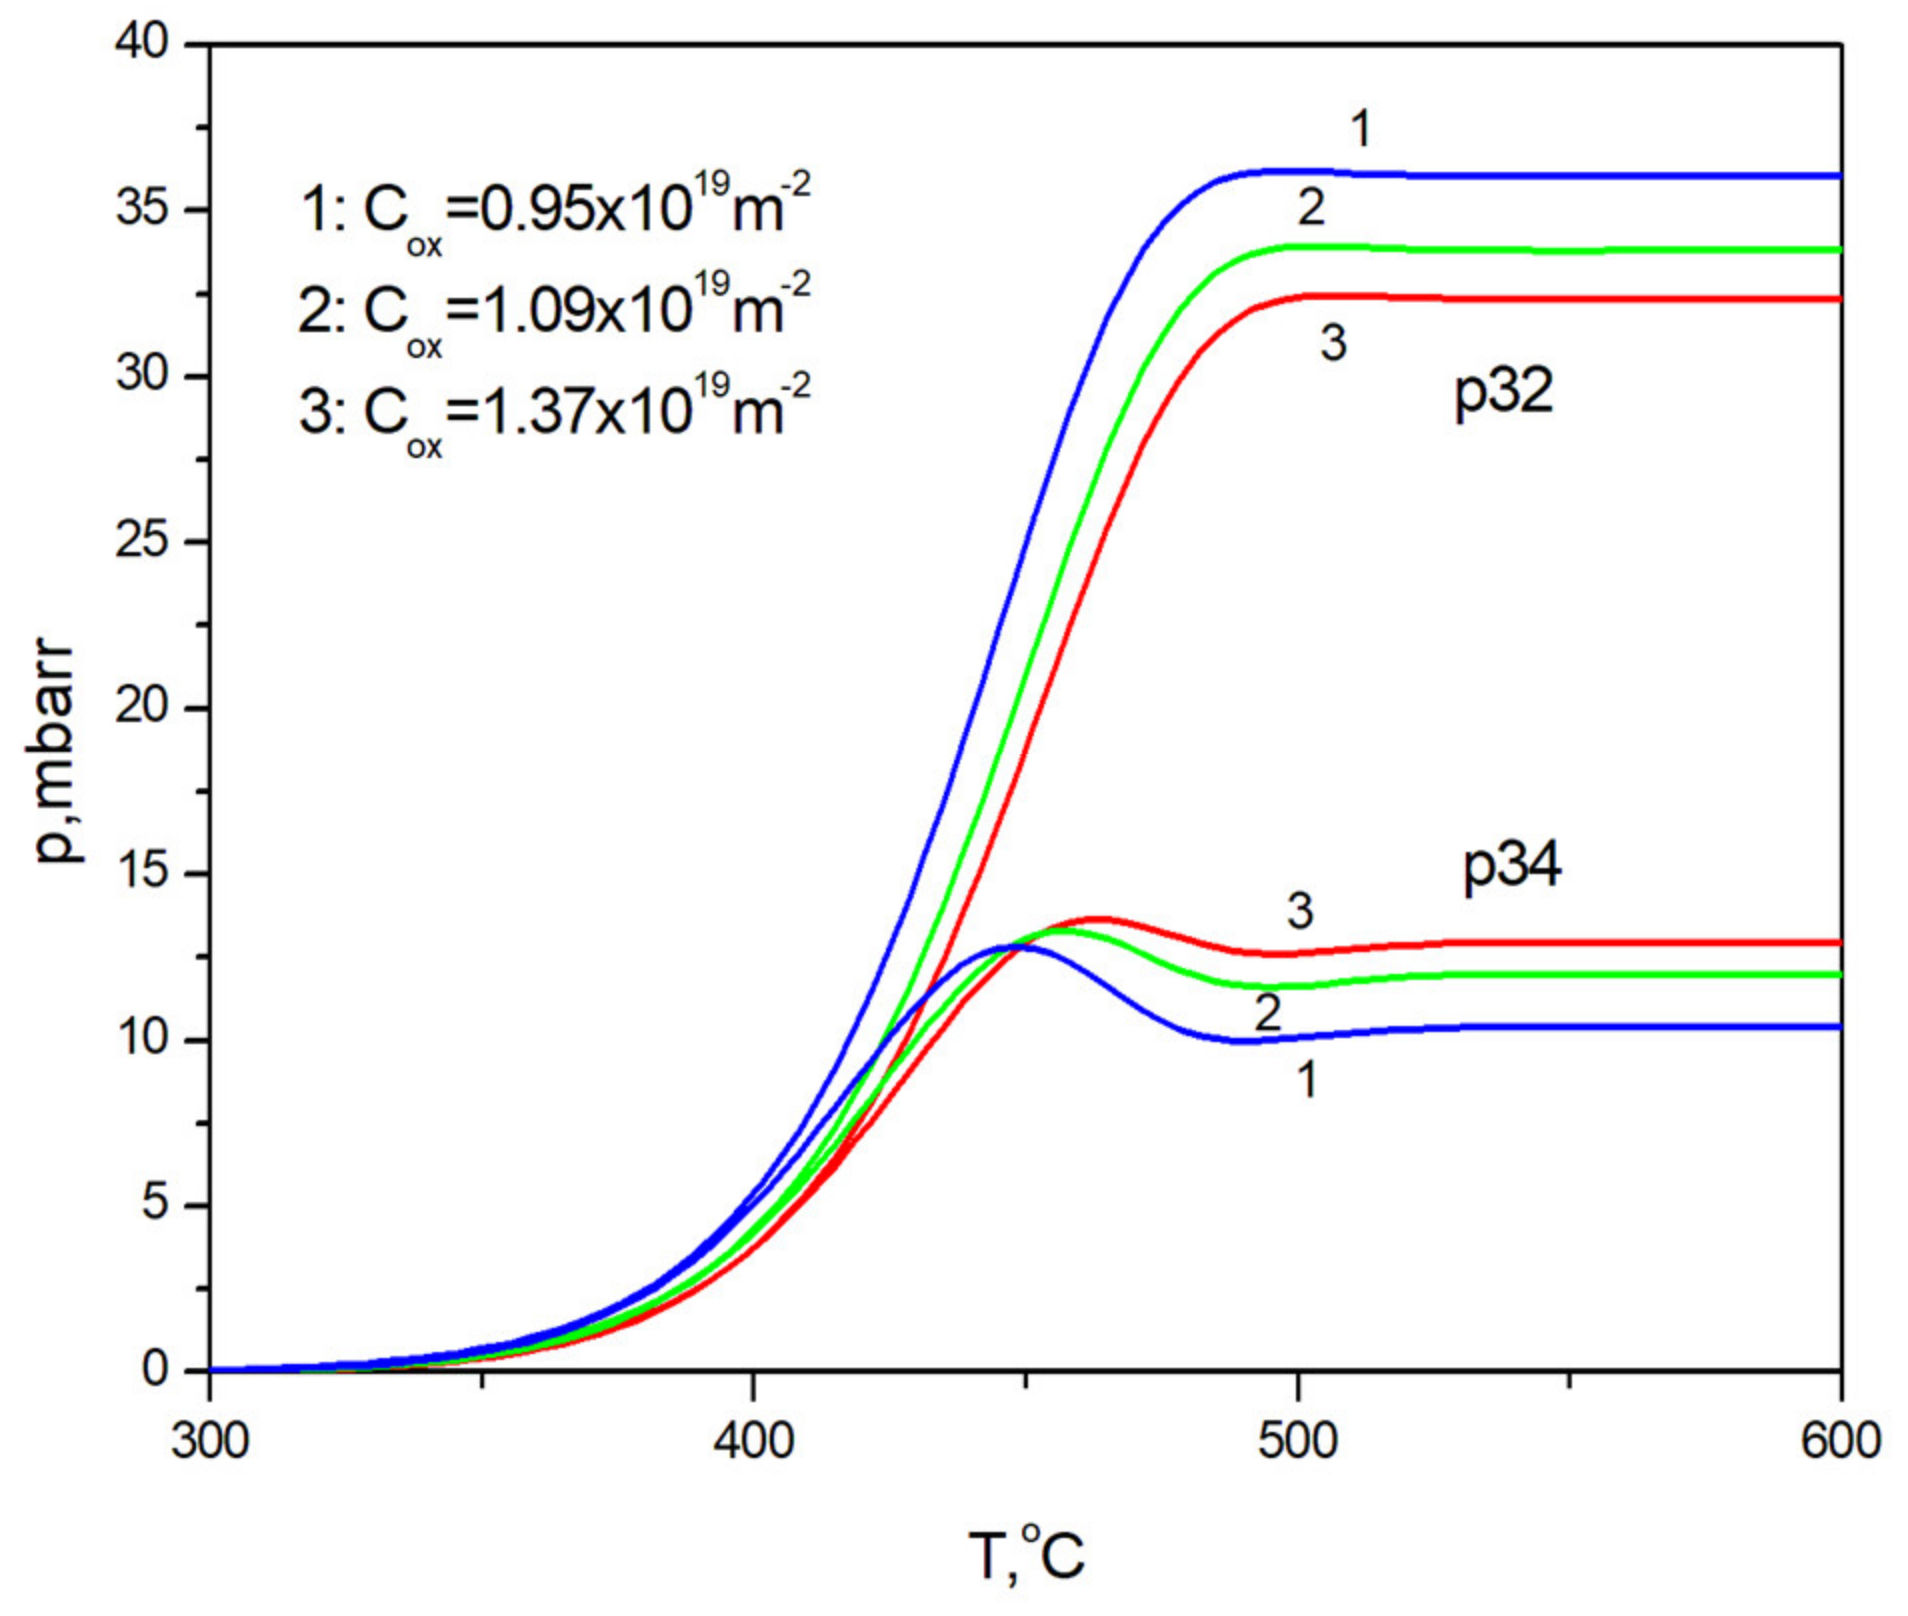
- The main parameter determining the steady state partial pressures of oxygen species is the ratio of catalyst specific surface area to volume of reactor. Surface atomic concentration bulk diffusion also influences state partial pressures. Steady state partial pressures are not influenced by reaction rates of heteroexchange.
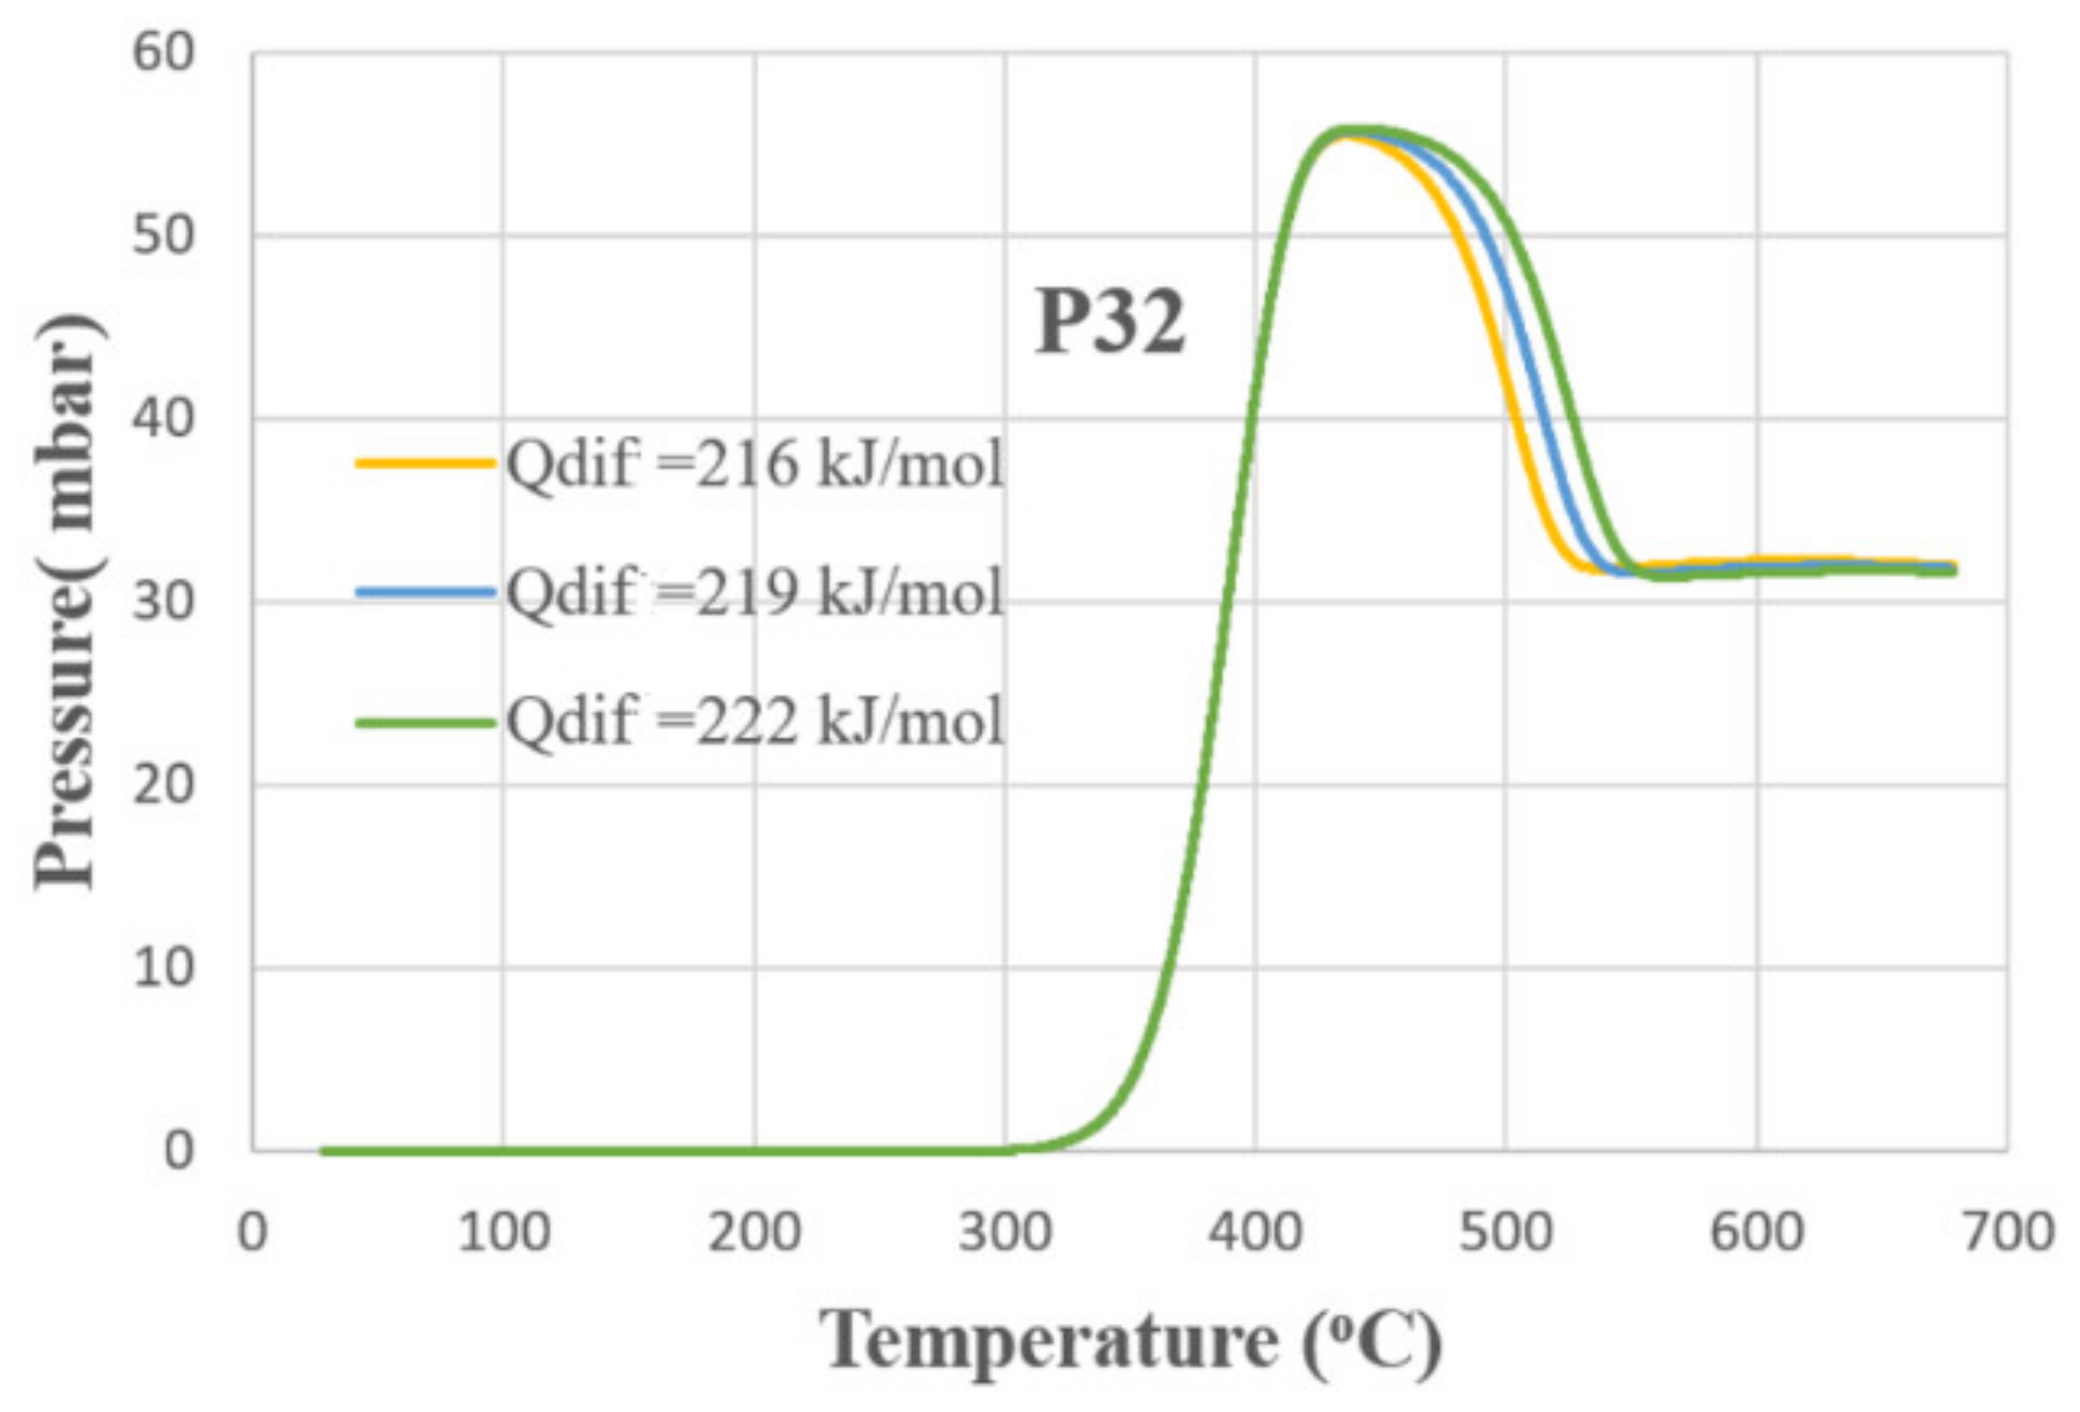
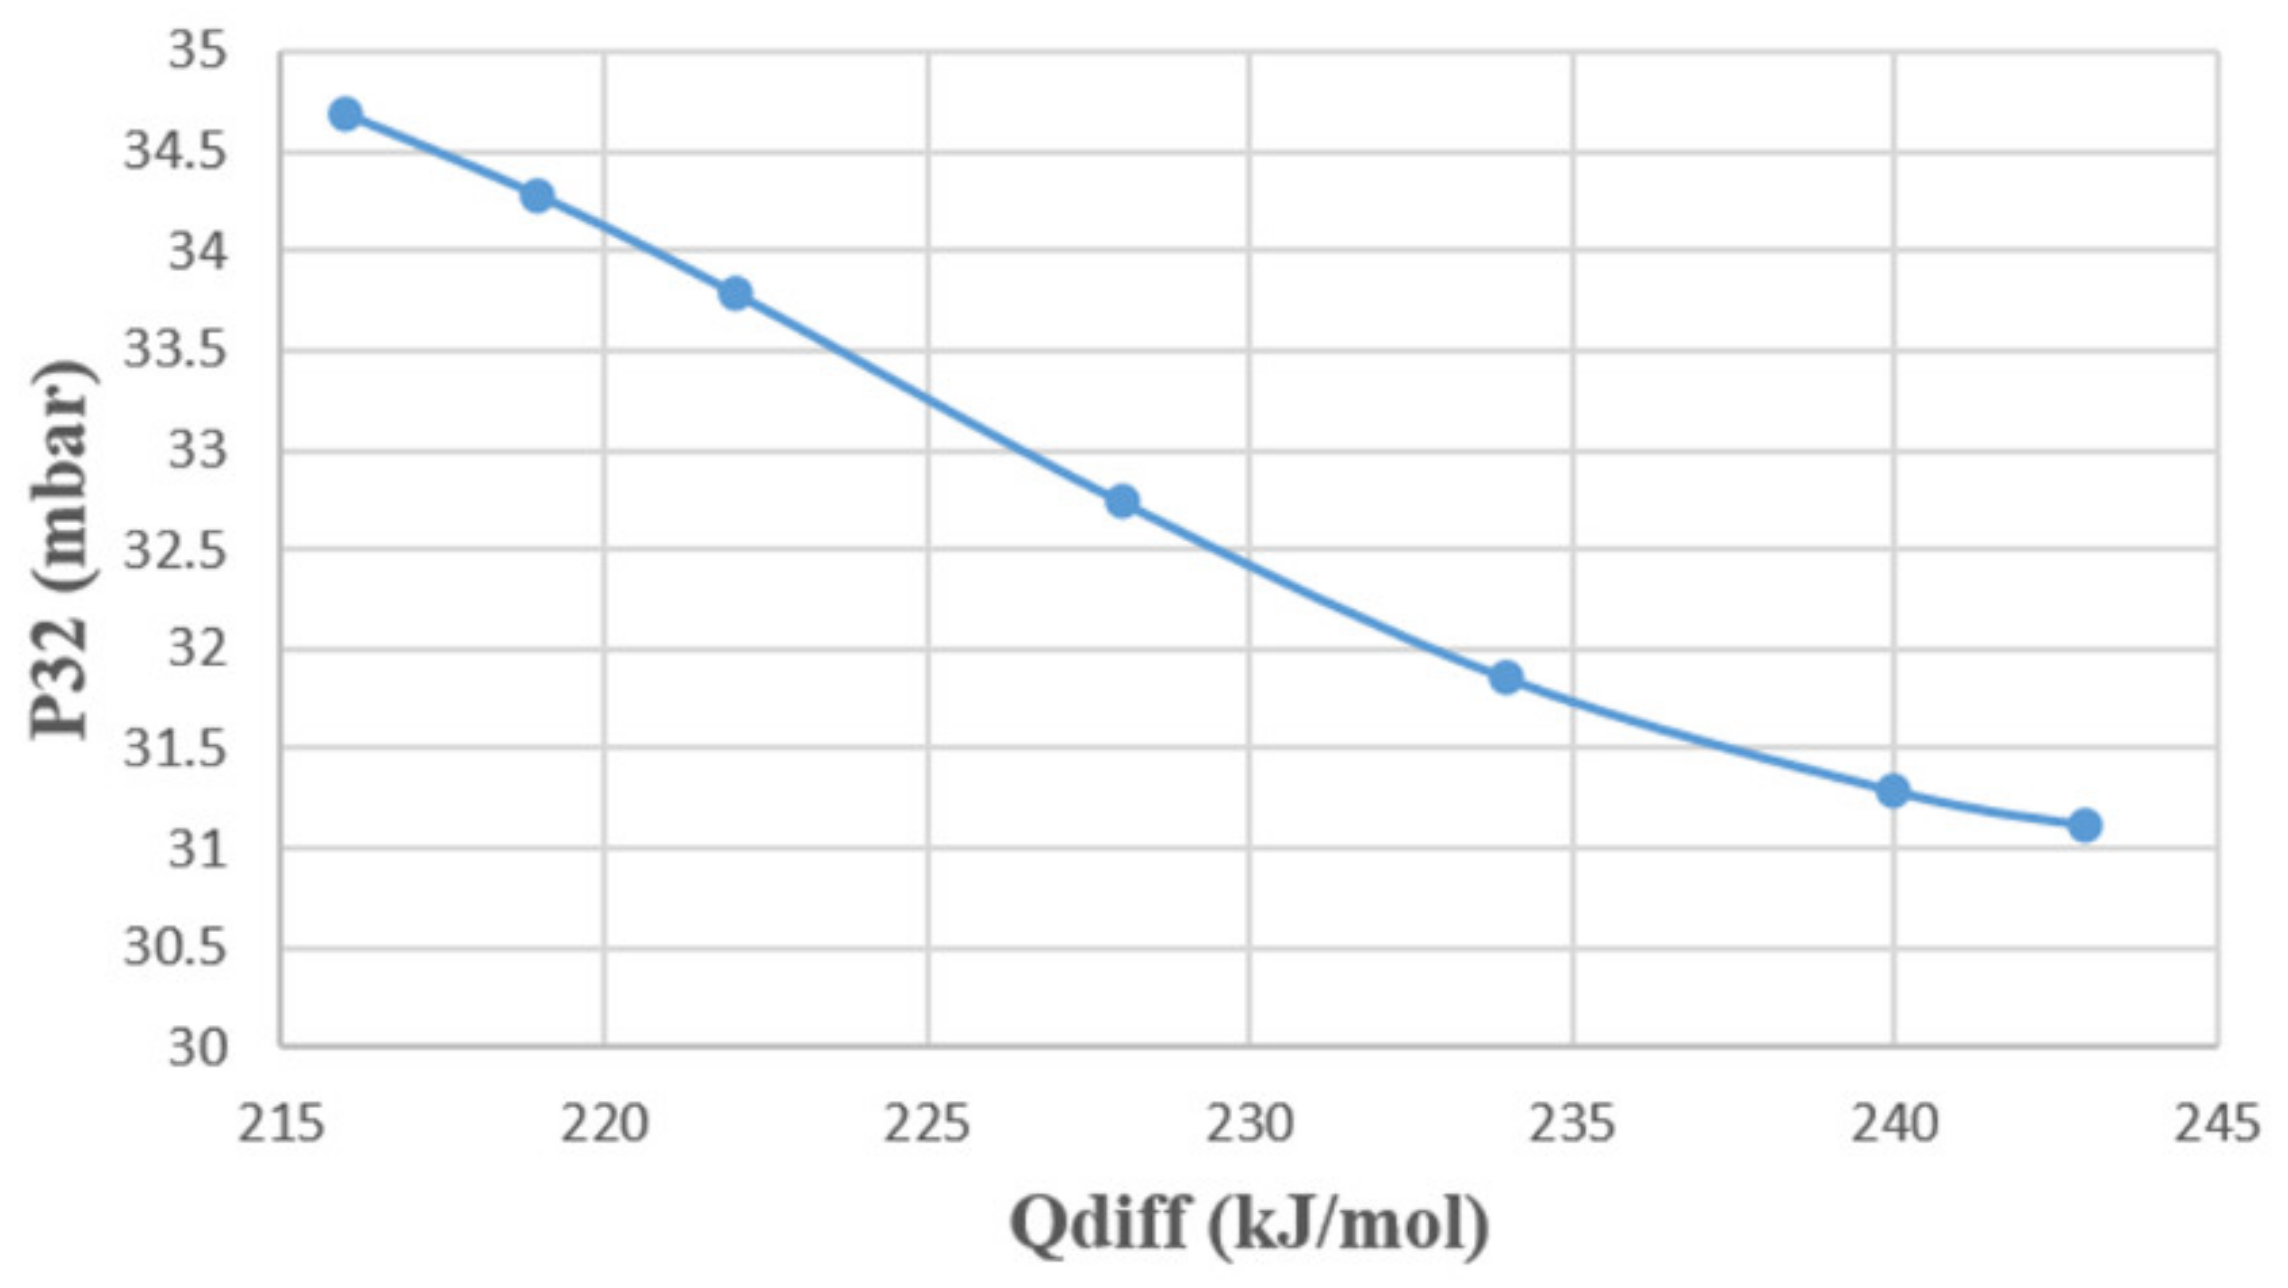
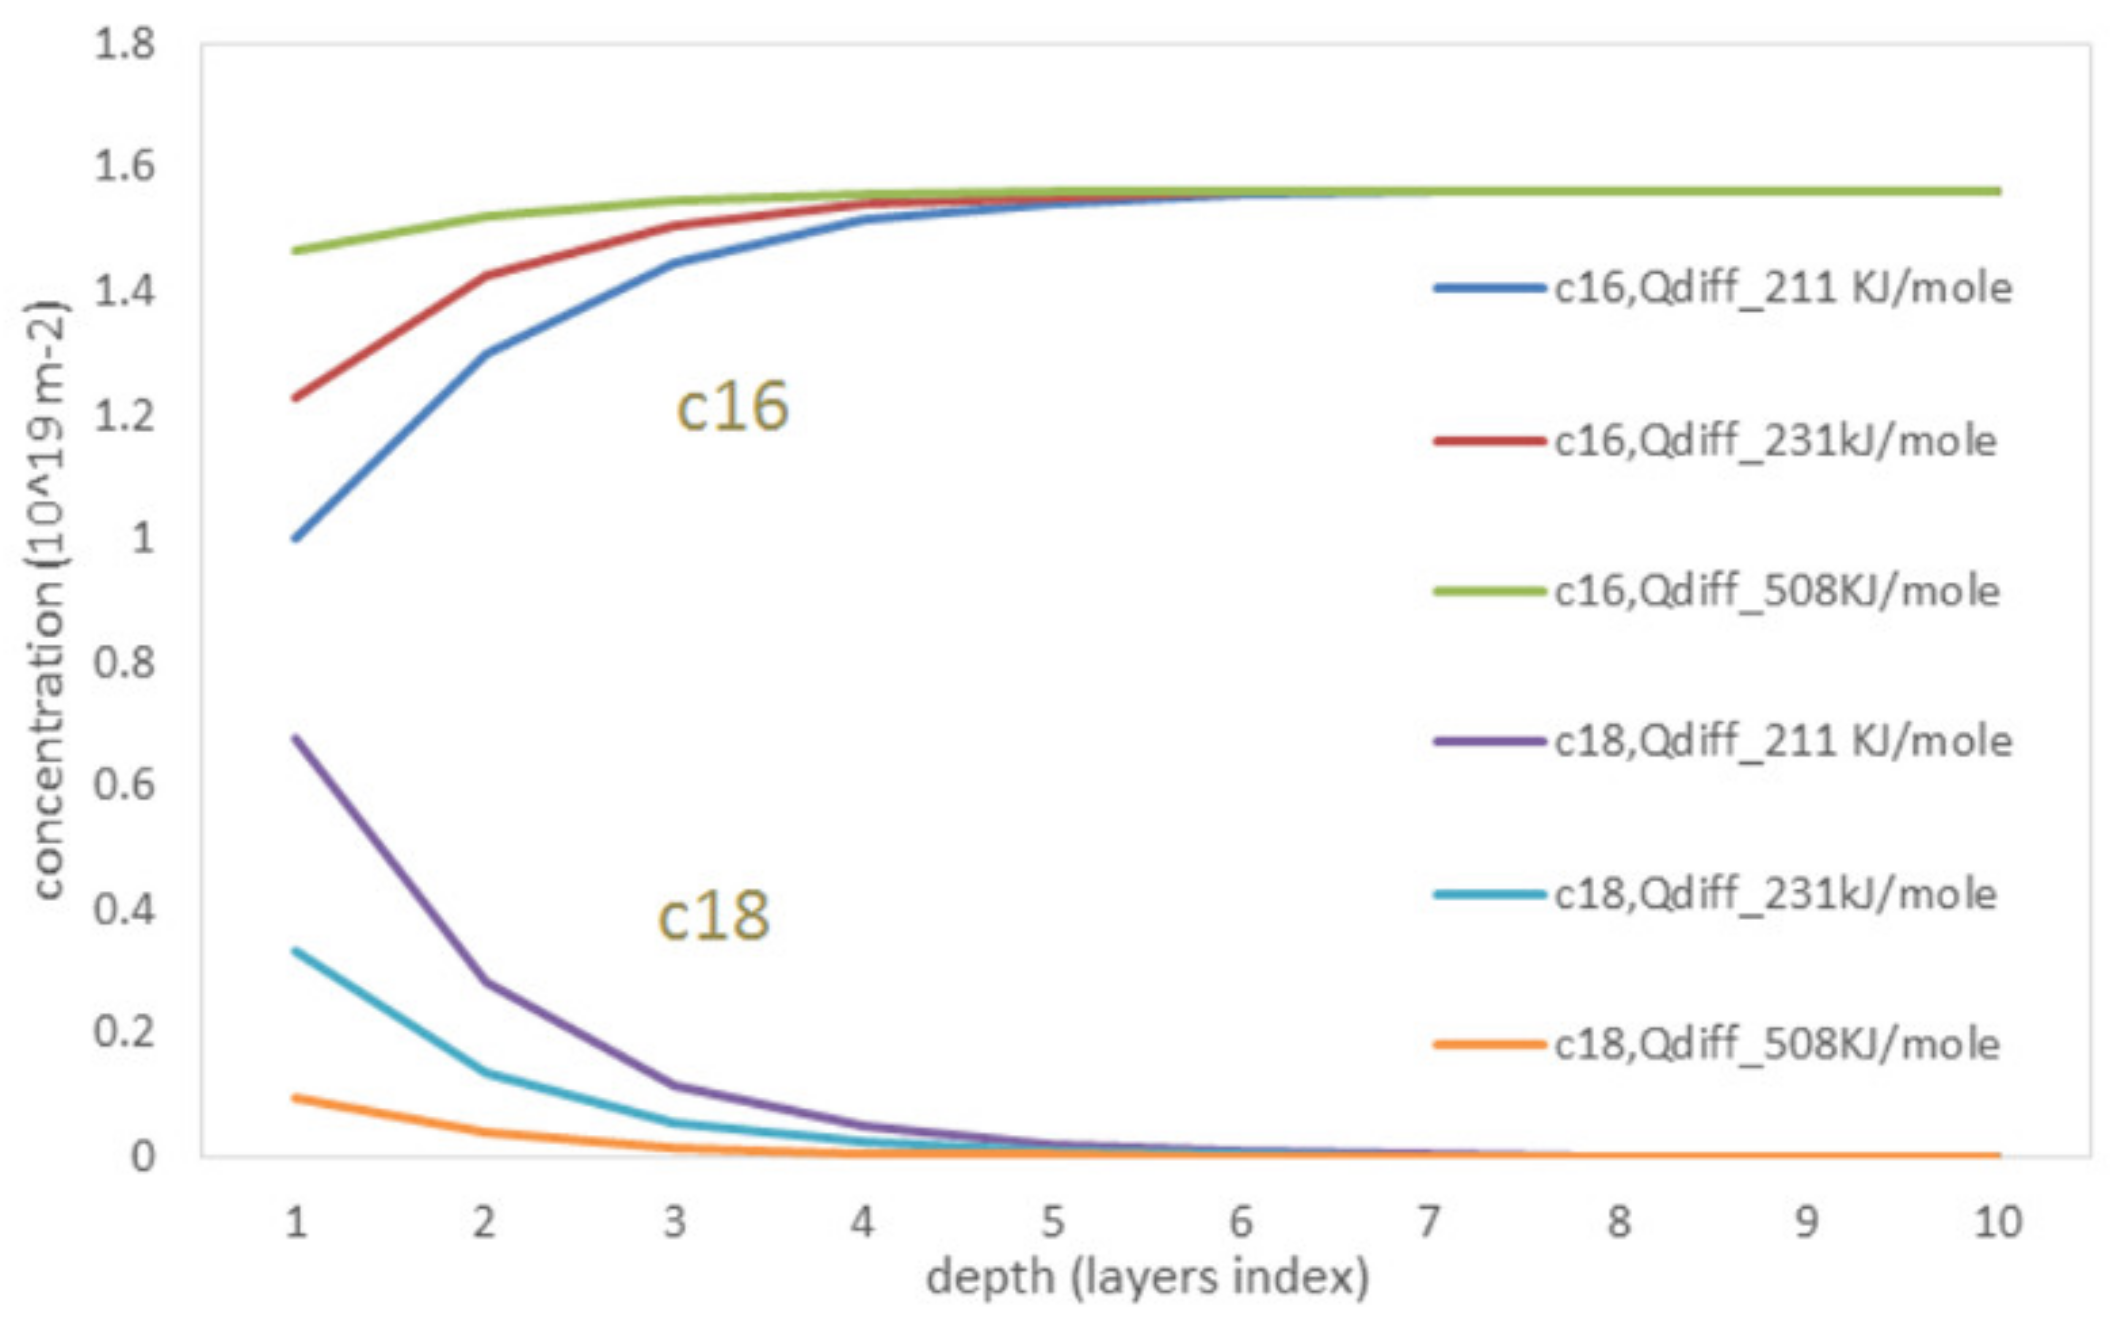
- The bulk diffusion process significantly influences the shapes of kinetic curves and partial pressures of species at steady state regime.
Author Contributions
Funding
Institutional Review Board Statement
Informed Consent Statement
Data Availability Statement
Acknowledgments
Conflicts of Interest
References
- Teschner, D.; Wootsch, A.; Röder, T.; Matusek, K.; Paál, Z. Ceria as a new support of noble metal catalysts for hydrocarbon reactions: Chemisorption and catalytic studies. Solid State Ion. 2001, 141, 709–713. [Google Scholar] [CrossRef]
- Moschovi, A.; Giuliano, M.; Kourtelesis, M.; Nicol, G.; Polyzou, E.; Parussa, F.; Yakoumis, I.; Sgroi, M. First of its kind automotive catalyst prepared by recycled PGMs-catalytic performance. Catalysts 2021, 11, 942. [Google Scholar] [CrossRef]
- Nelson, A.E.; Schulz, K.H. Surface chemistry and microstructural analysis of CexZr1−xO2−y model catalyst surfaces. Appl. Surf. Sci. 2003, 210, 206–221. [Google Scholar] [CrossRef]
- Machida, M.; Fujiwara, A.; Yoshida, H.; Ohyama, J.; Asakura, H.; Hosokawa, S.; Tanaka, T.; Haneda, M.; Tomita, A.; Miki, T.; et al. Deactivation mechanism of Pd/CeO2–ZrO2 three-way catalysts analyzed by chassis-dynamometer tests and in situ diffuse reflectance spectroscopy. ACS Catal. 2019, 9, 6415–6424. [Google Scholar] [CrossRef]
- Jen, H.W.; Graham, G.W.; Chun, W.; McCabe, R.W.; Cuif, J.P.; Deutsch, S.E.; Touret, O. Characterization of model automotive exhaust catalysts: Pd on ceria and ceria–zirconia supports. Catal. Today 1999, 50, 309–328. [Google Scholar] [CrossRef]
- Gong, J.; Wang, D.; Li, J.; Kamasamudram, K.; Currier, N.; Yezerets, A. An experimental and kinetic modeling study of aging impact on surface and subsurface oxygen storage in three-way catalysts. Catal. Today 2019, 320, 51–60. [Google Scholar] [CrossRef]
- Suhonen, S.; Valden, M.; Hietikko, M.; Laitinen, R.; Savimäki, A.; Härkönen, M. Effect of Ce–Zr mixed oxides on the chemical state of Rh in alumina supported automotive exhaust catalysts studied by XPS and XRD. Appl. Catal. A-Gen. 2001, 218, 151–160. [Google Scholar] [CrossRef]
- Rafaj, Z.; Krutel, J.; Nehasil, V. Oxygen exchange between catalyst and active support during CO oxidation on Rh/CeO2(111) and Rh/CeO2(110): Isotope labeled 18O study. J. Phys. Chem. C 2021, 125, 15959–15966. [Google Scholar] [CrossRef]
- Kašpar, J.; Fornasiero, P.; Graziani, M. Use of CeO2-based oxides in the three-way catalysis. Catal. Today 1999, 50, 285–298. [Google Scholar] [CrossRef]
- Nakanishi, Y.; Suehiro, Y.; Hashimoto, M.; Narishige, T. Development of Low Temperature Active Three Way Catalyst. SAE Technical Paper 2019-01-1293. 2019. Available online: https://doi.org/10.4271/2019-01-1293 (accessed on 10 May 2021).
- Ojala, S.; Bion, N.; Gomes, S.R.; Keiski, R.L.; Duprez, D. Isotopic oxygen exchange over Pd/Al2O3 catalyst: Study on C18O2 and 18O2 exchange. ChemCatChem 2010, 2, 527–533. [Google Scholar] [CrossRef]
- Rajbala; Bhatia, D. Crystallite-scale approach to predict the oxygen storage capacity of a three-way catalyst for natural gas applications. Ind. Eng. Chem. Res. 2019, 58, 10271–10284. [Google Scholar] [CrossRef]
- Rood, S.; Eslava, S.; Manigrasso, A.; Bannister, C. Recent advances in gasoline three-way catalyst formulation: A review. Proc. Inst. Mech. Eng. Part J. Automob. Eng. 2020, 234, 936–949. [Google Scholar] [CrossRef]
- Hajar, Y.M.; Boreave, A.; Caravaca, A.; Vernoux, P.; Baranova, E.A. Isotopic oxygen exchange study to unravel noble metal oxide/support interactions: The case of RuO2 and IrO2 nanoparticles supported on CeO2, TiO2 and YSZ. ChemCatChem 2020, 12, 2548–2555. [Google Scholar] [CrossRef]
- Bouwmeester, H.J.M.; Song, C.; Zhu, J.; Yi, J.; Annaland, M.V.S.; Boukamp, B.A. A novel pulse isotopic exchange technique for rapid determination of the oxygen surface exchange rate of oxide ion conductors. Phys. Chem. Chem. Phys. 2009, 11, 9640–9643. [Google Scholar] [CrossRef] [PubMed]
- MacQueen, B.; Ruiz-Yi, B.; Royko, M.; Heyden, A.; Pagan-Torres, Y.; Williams, C.T.; Lauterbach, J.A. In-situ oxygen isotopic exchange vibrational spectroscopy of rhenium oxide surface structures on cerium oxide. J. Phys. Chem. C 2020, 124, 7174–7181. [Google Scholar] [CrossRef]
- Winter, L.R.; Chen, R.; Chen, X. Elucidating the roles of metallic Ni and oxygen vacancies in CO2 hydrogenation over Ni/CeO2 using isotope exchange and in situ measurements. Appl. Catal. B Environ. 2019, 245, 360–366. [Google Scholar] [CrossRef]
- Doornkamp, C.; Clement, M.; Ponec, V. The isotopic exchange reaction of oxygen on metal oxides. J. Catal. 1999, 182, 390–399. [Google Scholar] [CrossRef]
- Dong, F.; Tanabe, T.; Takahashi, N.; Shinjoh, H. Investigation of the effective oxygen storage and release performances on the Pt/CeO2-ZrO2 catalysts by breakthrough method. Catal. Today 2019, 332, 259–266. [Google Scholar] [CrossRef]
- Klier, K.; Nováková, J.; Jíru, P. Exchange reactions of oxygen between oxygen molecules and solid oxides. J. Catal. 1963, 2, 479–484. [Google Scholar] [CrossRef]
- Novakova, J. Isotopic exchange of oxygen 18O between the gaseous phase and oxide catalysts. Catal. Rev. 1971, 4, 77–113. [Google Scholar] [CrossRef]
- Descorme, C.; Madier, Y.; Duprez, D. Infrared study of oxygen adsorption and activation on cerium–zirconium mixed oxides. J. Catal. 2000, 196, 167–173. [Google Scholar] [CrossRef]
- Sadykov, V.; Eremeev, N.; Sadovskaya, E.; Bobin, A.; Ishchenko, A.; Pelipenko, V.; Muzykantov, V.; Krieger, T.; Amanbaeva, D. Oxygen mobility and surface reactivity of PrNi1−xCoxO3−δperovskites and their nanocomposites with Ce0.9Y0.1O2−δ by temperature-programmed isotope exchange experiments. Solid State Ion. 2015, 273, 35–40. [Google Scholar] [CrossRef]
- Penkala, B.; Aubert, D.; Kaper, H.; Tardivat, C.; Conder, K.; Paulus, W. The role of lattice oxygen in CO oxidation over Ce18O2-based catalysts revealed under operando conditions. Catal. Sci. Technol. 2015, 5, 4839–4848. [Google Scholar] [CrossRef]
- Boaro, M.; Vicario, M.; de Leitenburg, C.; Dolcetti, G.; Trovarelli, A. The use of temperature-programmed and dynamic/transient methods in catalysis: Characterization of ceria-based, model three-way catalysts. Catal. Today 2003, 77, 407–417. [Google Scholar] [CrossRef]
- Marinho, A.L.A.; Rabelo-Neto, R.C.; Epron, F.; Bion, N.; Toniolo, F.S.; Noronha, F.B. Embedded Ni nanoparticles in CeZrO2 as stable catalyst for dry reforming of methane. Appl. Catal. B Environ. 2020, 268, 118387. [Google Scholar] [CrossRef]
- Liang, Q.; Wu, X.; Wu, X.; Weng, D. Role of surface area in oxygen storage capacity of ceria-zirconia as soot combustion catalyst. Catal. Lett. 2007, 119, 265–270. [Google Scholar] [CrossRef]
- Duprez, D. Study of surface reaction mechanisms by 16O/18O and H/D isotopic exchange. Catal. Today 2006, 112, 17–22. [Google Scholar] [CrossRef]
- Galdikas, A.; Bion, N.; Duprez, D.; Virbickas, V.; Mazelis, D. Modeling of diffusion process in the isotopic oxygen exchange experiments of CexZr(1−x)O2 catalysts. Mater. Sci. 2013, 19, 83–88. [Google Scholar] [CrossRef][Green Version]
- Den Otter, M.W.; Boukamp, B.A.; Bouwmeester, H.J.M. Theory of oxygen isotope exchange. Solid State Ion. 2001, 139, 89–94. [Google Scholar] [CrossRef]
- Farlenkov, A.S.; Khodimchuk, A.V.; Eremin, V.A.; Tropin, E.S.; Fetisov, A.V.; Shevyrev, N.A.; Leonidov, I.I.; Ananyev, M.V. Oxygen isotope exchange in doped lanthanum zirconates. J. Solid State Chem. 2018, 268, 45–54. [Google Scholar] [CrossRef]
- Sadovskaya, E.M.; Ivanova, Y.A.; Pinaeva, L.G.; Grasso, G.; Kuznetsova, T.G.; van Veen, A.; Sadykov, V.A.; Mirodatos, C. Kinetics of oxygen exchange over CeO2−ZrO2 fluorite-based catalysts. J. Phys. Chem. A 2007, 111, 4498–4505. [Google Scholar] [CrossRef] [PubMed]
- Galdikas, A.; Descorme, C.; Duprez, D. Surface diffusion upon oxygen isotopic exchange on oxide-supported metal nanoclusters. Solid State Ion. 2004, 166, 147–155. [Google Scholar] [CrossRef]
- Galdikas, A.; Descorme, C.; Duprez, D.; Dong, F.; Shinjoh, H. Study of the oxygen diffusion on three-way catalysts: A kinetic model. Top. Catal. 2004, 30, 405–409. [Google Scholar] [CrossRef]
- Madier, Y.; Descorme, C.; Le Govic, A.M.; Duprez, D. Oxygen mobility in CeO2 and CexZr(1−x)O2 compounds: Study by CO transient oxidation and 18O/16O isotopic exchange. J. Phys. Chem. B 1999, 103, 10999–11006. [Google Scholar] [CrossRef]
- Madier, Y. Etude de la Mobilité et du Stockage de l’Oxygène par Echange Isotopique 18O/16O sur des Catalyseurs de Postcombustion à Base d’Oxydes de Terres Rares. Ph.D. Thesis, Poitiers University, Poitiers, Fance, 1999. [Google Scholar]
- Henry, C.R. Catalytic activity of supported nanometer-sized metal clusters. Appl. Surf. Sci. 2000, 164, 252–259. [Google Scholar] [CrossRef]
- Ananyev, M.V.; Porotnikova, N.M.; Eremin, V.A.; Kurumchin, E.K. Interaction of O2 with LSM–YSZ composite materials and oxygen spillover effect. ACS Catal. 2021, 11, 4247–4262. [Google Scholar] [CrossRef]
- Bedrane, S.; Descorme, C.; Duprez, D. Investigation of the oxygen storage process on ceria- and ceria-zirconia-supported catalysts. Catal. Today 2002, 75, 401–405. [Google Scholar] [CrossRef]


| Simple Heteroexchange Reactions | Complex Heteroexchange Reactions | |
|---|---|---|
| 18O18Og + 16O16Os → 16O18Og + 18O16Os | (p = 1) | |
| 16O16Og + 18O18Os → 18O16Og + 16O18Os | (p = 1) | 18O18Og + 16O16Os → 16O16Og + 18O18Os |
| 16O18Og + 16O16Os → 16O16Og + 16O18Os | (p = 1/2) | 16O16Og + 18O18Os → 18O18Og + 16O16Os |
| 16O18Og + 18O18Os → 18O18Og + 16O18Os | (p = 1/2) | 18O18Og + 18O16Os → 18O16Og + 18O18Os |
| 18O18Og + 18O16Os → 16O18Og + 18O18Os | (p = 1/2) | 18O16Og + 18O18Os → 18O18Og + 18O16Os |
| 16O16Og + 18O16Os → 18O16Og + 16O16Os | (p = 1/2) | 18O16Og + 16O16Os → 16O16Og + 18O16Os |
| 18O16Og + 16O18Os → 16O16Og + 18O18Os | (p = 1/4) | 16O16Og + 18O16Os → 18O16Og + 16O16Os |
| 16O18Og + 18O16Os → 18O18Og + 16O16Os | (p = 1/4) | |
| Parameters | Ceria | Zirconia |
|---|---|---|
| AC | 3.6 × 10⁻⁸ m2 s−1 | 4.0 × 10⁻⁸ m2 s−1 |
| AS | 0.96 × 10⁻¹¹ m2 s−1 | 1.0 × 10⁻¹¹ m2 s−1 |
| Adif | 1.58 × 10⁻²⁴ m2 s−1 | 1.90 × 10⁻²⁴ m2 s−1 |
| QC | 176 kJ·mol−1 | 180 kJ·mol−1 |
| QS | 118 kJ·mol−1 | 120 kJ·mol−1 |
| Qdif | 135 kJ·mol−1 | 154 kJ·mol−1 |
Publisher’s Note: MDPI stays neutral with regard to jurisdictional claims in published maps and institutional affiliations. |
© 2021 by the authors. Licensee MDPI, Basel, Switzerland. This article is an open access article distributed under the terms and conditions of the Creative Commons Attribution (CC BY) license (https://creativecommons.org/licenses/by/4.0/).
Share and Cite
Galdikas, A.; Usman, M.; Galdikas, M. The Kinetic Model of Diffusion and Reactions in Powder Catalysts during Temperature Programmed Oxygen Isotopic Exchange Process. Symmetry 2021, 13, 1526. https://doi.org/10.3390/sym13081526
Galdikas A, Usman M, Galdikas M. The Kinetic Model of Diffusion and Reactions in Powder Catalysts during Temperature Programmed Oxygen Isotopic Exchange Process. Symmetry. 2021; 13(8):1526. https://doi.org/10.3390/sym13081526
Chicago/Turabian StyleGaldikas, Arvaidas, Muhammad Usman, and Matas Galdikas. 2021. "The Kinetic Model of Diffusion and Reactions in Powder Catalysts during Temperature Programmed Oxygen Isotopic Exchange Process" Symmetry 13, no. 8: 1526. https://doi.org/10.3390/sym13081526
APA StyleGaldikas, A., Usman, M., & Galdikas, M. (2021). The Kinetic Model of Diffusion and Reactions in Powder Catalysts during Temperature Programmed Oxygen Isotopic Exchange Process. Symmetry, 13(8), 1526. https://doi.org/10.3390/sym13081526