Abstract
The Tolman length and interfacial tension of partially miscible symmetric binary Lennard–Jones (LJ) fluids (A, B) was revealed by performing a large-scale molecular dynamics (MD) simulation with a sufficient interfacial area and cutting distance. A unique phenomenon was observed in symmetric binary LJ fluids, where two surfaces of tension existed on both sides of an equimolar dividing surface. The range of interaction εAB between the different liquids and the temperature in which the two LJ fluids partially mixed was clarified, and the Tolman length exceeded 3 σ when εAB was strong at higher temperatures. The results show that as the temperature or εAB increases, the Tolman length increases and the interfacial tension decreases. This very long Tolman length indicates that one should be very careful when applying the concept of the liquid–liquid interface in the usual continuum approximation to nanoscale droplets and capillary phase separation in nanopores.
1. Introduction
The surface tension of liquid has been examined widely and is well known. In a gas–liquid interface, two surfaces exist: the surface of tension and equimolar dividing surface. Tolman expressed the decrease in surface tension of a nano-scale droplet by the existence of the two surfaces [1,2,3]. This theory has been improved by many thermodynamic studies [4,5,6,7,8]. The distance between the surface of tension and the equimolar dividing surface is called the Tolman length. Even now, the Tolman length itself and the relationship between the Tolman length and droplet size, evaporation velocity, and other parameters are the focus of many theoretical studies [9,10,11,12,13,14,15,16,17,18,19,20,21,22,23]. In addition, in studies of flat surfaces of liquids, the surface tension of Lennard–Jones (LJ) liquids has been simulated by several researchers including the author. The relationship between the particle position and local surface tension was derived by Nijmeijer et al. [24]. The minimum system size, liquid thickness, and equilibration time necessary for describing the surface tension were determined by Holcomb et al. [25]. A Tolman length with a cutoff distance of 2.5 σ for various temperatures was simulated by Haye and Bruin [26]. Chen discussed the dependence of surface tension on the surface area. These studies indicated that a surface area of 10 σ × 10 σ is sufficient to provide the correct surface tension [27]. Trokhymchuk and Alejandre discussed the dependence of surface tension on the cutoff distance. They indicated that a cutoff distance of 4.5 σ is insufficient to mimic the full potential, but a length of approximately 5 σ is sufficient [28]. In a previous study, following previous research and by using a cutoff distance of 5 σ, the surface tension and Tolman’s length for a LJ liquid were obtained for various temperatures by the author [29]. Recently, Baidakov and Khotienkova have attempted to describe the surface tension of methane–nitrogen mixtures using van der Waals gradient theory and compared this with experimental results [30]. However, there are no examples of research on the Tolman length and interfacial tension for liquid–liquid interfacial tension.
Recently, much attention has been focused on liquid–liquid phase separation in porous media. Some studies have used a symmetric binary LJ fluid mixture to simulate liquid–liquid phase separation in nanopores [31,32,33,34,35,36,37,38,39,40,41,42,43]. For phase separation in nanopores, Patrick and Miyahara proposed a thermodynamic model to explore the contribution of spherically curved interface tension to phase separation [44,45,46,47].
The behavior of capillary phase separation in pores should be compared with the behavior of phase separation in bulk, but surprisingly, there are few examples of studies on the phase separation behavior of LJ liquids in bulk. Only Díaz-Herrera et al. examined the bulk phase diagram and temperature dependence of interfacial tension for various interaction strengths with a cutoff of 3 σ [48,49]. However, they did not examine the surface of tension and equimolar dividing surface in the interfacial region of a binary LJ fluid mixture. In this problem, two surfaces of tension on both sides of an equimolar dividing surface were found by the authors [50]. However, in the simulation, only one condition was considered; i.e., the LJ parameter εAB = 0.8 εAA = 0.8 εBB for symmetric binary LJ liquids “A” and “B”, and the reduced temperature T* was 0.8. Moreover, the cutoff distance was 3.5 σ, which was too short to describe the full LJ potential. Therefore, the results of the authors’ previous study could not provide useful information on the interfacial physical properties of symmetric binary LJ liquids. In 2020, researchers have focused on the importance of the cutting distance, and gas–liquid equilibrium and critical points and gas–liquid surface tensions have been studied for LJ mixtures of low and high-boiling components with long cutting distances. However, they do not deal with the interfacial tension and Tolman length of the liquid–liquid interface in the partially mixed state [51,52].
Despite recent improvements in computational power and the ability to use more complex simulations than before, there has been no study of the Lennard–Jones fluid interface in two-component systems. Even now, specific values for interfacial tension and the Tolman length are not given for a sufficient interfacial area or sufficient cutting distance.
In this study, molecular dynamics simulations of symmetric binary LJ liquids with a sufficient interfacial area and cutting distance have been performed to provide fundamental insights into their interfacial tension and Tolman length. The purpose of molecular dynamics simulation is not to reproduce reality but to provide the interfacial properties between the LJ liquid and the liquid treated by molecular dynamics simulation as an ideal material, which is required by the thermodynamic equation to explain the various complex phenomena in the nanopores simulated by the molecular dynamics simulation.
2. Molecular Dynamics Simulation
2.1. Setting
An NVE molecular dynamics simulation of symmetric binary Lennard–Jones LJ fluids was used in this study. We used a self-developed molecular dynamics simulation code. A sandwich-structured liquid film consisting of three layers of LJ (12, 6) fluids in a rectangular cell was simulated as shown in Figure 1. A membrane of LJ liquid was placed in the center of the y-direction and sandwiched by membranes of the other LJ liquid from both ends. Truncated and shifted LJ argon was used for the particles. A system was set up comprising 3200 LJ argon “A” particles and 6400 LJ argon “B” particles. The intermolecular interaction parameter for homologous LJ argon “A” and “B” were set as εAA/kB = εBB/kB = 120.0 K, σAA = σBB = σAB = 0.34 nm, where kB is Boltmann’s constant. The cutoff distance was 5.0 σAA, which was sufficiently large to represent particles using the full LJ potential [27]. The masses of LJ argon “A” and “B” were 6.636 × 10⁻²⁶ kg [50]. The MD simulations were conducted in a box with dimensions of Lx × Ly × Lz = 14.0 σAA × 120.0 σAA × 15.2 σAA, which was sufficiently large to give a correct value for the surface tension [25,27].
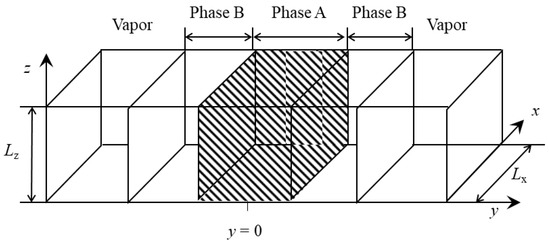
Figure 1.
Schematic figure of the unit cell.
The intermolecular interaction parameter εAB between the heterogeneous LJ argon was set as εAB = α × εAA, where α was between 0.50 and 0.85. The intermolecular interaction parameter σAB between the heterogeneous LJ argon was set as σAB = σAA = σBB. The leapfrog Verlet method was used to integrate the equations of motion numerically. Each run comprised integration steps with a time increment Δt of 5 fs. The total time required for each simulation was 1 μs, which was confirmed as a sufficiently long time in a previous study [29]. The reduced temperature T* = kBT/εAA was set as between 0.7 and 1.0. The lowest temperature T* = 0.7 was set considering that the triple point of pure LJ liquid is T* = 0.685–0.687 [53]. The temperature of the system was controlled by velocity scaling in the usual manner once every 100 steps. Thermal control was applied up to 0.9 μs, after which there was almost no fluctuation in temperature, which was almost equal to the temperature set in the simulation. We did not observe any anomalous increase in the velocity of some particles associated with the adoption of the temperature change algorithm instead of Nosé-Hoover for the NVT ensemble. In addition, we did not adopt the data from the period of the temperature change algorithm (0–0.9 μs) but only analyzed the data from the subsequent period of the NVE ensemble (0.9–1.0 μs). The number of particles, the cutting distance, the interface area, and the total simulation time were very large and long compared to previous studies.
2.2. Analysis
The reduced local density and the reduced local interfacial tension on sliced spaces of dimensions Lx × 0.1 σAA × Lz were determined by calculating the running average of 0.95–1.00 μs once every 10 steps [25]. In all steps in the calculation of and , the center of gravity in the y direction of the entire system was calculated and the instantaneous distribution of and was shifted so that the center of gravity was y = 0, meaning that the oscillations of the liquid film in the y direction did not affect and .
The value of was calculated for the sliced spaces as follows:
where <Ny> is the average number of argon particles “A” or “B” in the sliced space of volume Vy. The equimolar dividing surface was determined as the position in the y direction where the of argon “A” was equal to the of argon “B”. Furthermore, the bulk densities of each component and were determined from the of argon “A” and “B” in the ranges of 0 < |y| < 2.5 σAA, where y = 0 is the center of the three-phase LJ liquid film and was sufficiently distant to be unaffected by the anisotropic structure of the interface. The density ratio of argon “A” and “B” represented the saturation solubility.
The reduced local interfacial tension was calculated using the following statistical mechanical equation [24]:
where rij is the distance between particles “i” and “j”, and yij is the distance in the y-direction. uij is the LJ interaction potential between particles “i” and “j”. This equation shows the anisotropy of the stresses, and if the same stresses are applied in all three directions, the local interfacial tension is zero. This equation is an approximation and is known to generate artifacts in the local normal pressure in the y-direction and the profiles of the local surface tension, such as local negative tension at the gas–liquid interface, at a position closer to the gas than the equimolar dividing surface. However, by integrating these local artifacts in the thickness direction, the correct overall interfacial tension can be obtained [54]. In addition, this effect is very weak for the liquid–liquid interface, and the effect on the position of the tension surface seems to be limited. The two peaks of local tension were integrated in the y-direction to account for the thickness of the sliced space (0.1 σAA), and then the interfacial tension γ* of the liquid–liquid interface was obtained. In the symmetric binary LJ system, two surfaces of tension exist for an equimolar dividing surface, and the sum of the two surfaces of tension should be recognized macroscopically as the interfacial tension for each equimolar plane, meaning that the range of integration includes the two tension surfaces [29].
The Tolman length δ* = δ/σAA is the distance between the equimolar dividing surface and the surface of tension, which is the peak position of the local interfacial tension in the y-direction. In this study, two equimolar dividing surfaces and four surfaces of tension occurred, so the Tolman length was the average of four distances between the two equimolar dividing surfaces and the four surfaces of tension.
3. Results
MD simulations were conducted for several combinations of α and T* to obtain the LJ liquid–liquid phase equilibrium. Typical distributions of local density and local surface tension are shown in Figure 2. The solid line shows the local density distribution of argon “A”, the dotted line is argon “B”, and the dashed line is the total density of the two argons “A” and “B”. In the bulk region of the argon “A” phase, the background is filled in with gray. The position where the local densities of argon “A” and “B” coincide is the equimolar dividing surface (blue lines). As shown in Figure 2, the local surface tension was almost zero at the equimolar dividing surfaces and, in the bulk phase of LJ argon “A” and “B”, was sufficiently far from the equimolar dividing surfaces. Two tension surfaces were present on both sides of each equimolar dividing surface (red lines). Incidentally, the large local interfacial tensions that occurred at the gas–liquid interface, as shown in Figure 2, were not considered in this study because they corresponded to the surface tensions of the gas–liquid interface. The four peaks integrated in the y-direction for the calculation of the interfacial tension γ* of two interfaces are filled in with shaded lines.
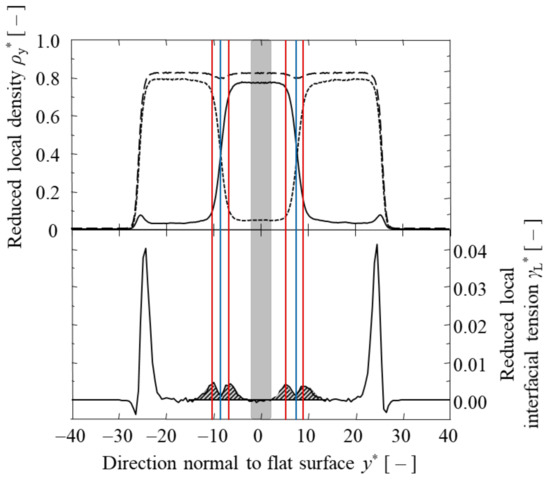
Figure 2.
Local density and local interfacial tension for α = 0.7 and T* = 0.80. The upper solid curve is , the dotted curve is , and the dashed curve is + . The gray background is the range used to calculate and . The shaded background in the lower figure is the range used to calculate γ*. The positions of the equimolar dividing surfaces are marked with blue lines, and the positions of the surface of tensions are marked with a red line.
The obtained and are listed in Table 1 and shown in Figure 3 and Figure 4. At α = 0.50, each of the three argon LJ liquid films was isolated and did not contact with each other at all (“complete separation” is indicated in Table 1). When α was greater than 0.85, LJ argon “A and “B” were completely mixed without creating interfaces, even at T* = 0.70 (“complete mixture” is indicated in Table 1). Between α = 0.55 and 0.80, the partial mixing of LJ argon “A” and “B” was observed. Between α = 0.55 and 0.80, the greater the value of α, the lower the temperature required for partial mixing. For all α, when T* was higher than 1.05, no interface was observed at all due to the perfect mixing of heterogeneous LJ argons. For a smaller value of α, the weak interactions between the LJ heterogeneous argons prevented them from mixing at lower temperatures. In the high temperature region, the increase in entropy caused some mixing. The greater the value of α, the greater the depression in temperature for complete mixing. Therefore, when dealing with symmetric binary LJ liquids and conducting capillary phase separation in pores, it is necessary to use settings within this limited range of α and T*.

Table 1.
, , γ* and δ* at various α and T*.
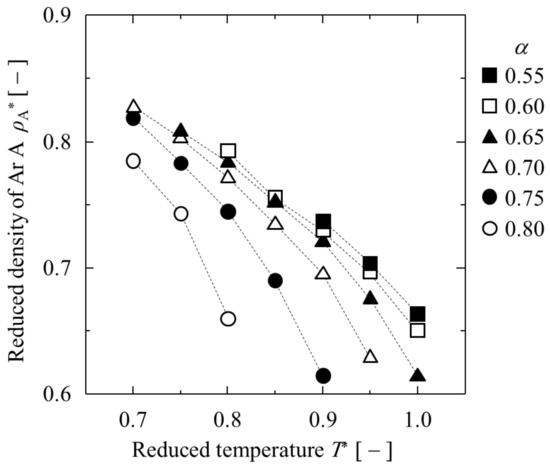
Figure 3.
Dependence of on T* at various α.
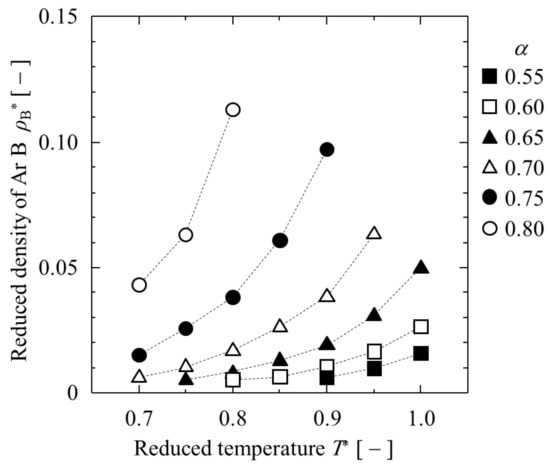
Figure 4.
Dependence of on T* at various α.
Next, the obtained γ* and δ* are listed in Table 1 and shown in Figure 5 and Figure 6. A higher T* or bigger εAB resulted in a lower interfacial tension γ* and longer Tolman length δ*. In particular, δ* was greater than 3 in the longest case. In other words, the liquid–liquid equilibrium changed to complete mixing when the δ* was slightly larger than 3. In contrast, the δ* of the single component LJ liquid–gas interface was about 1 at the triple point and slightly more than 2 at T* = 1 [29]. The δ* of the binary LJ liquid–liquid interface was obviously larger than that of the single LJ liquid–gas interface.
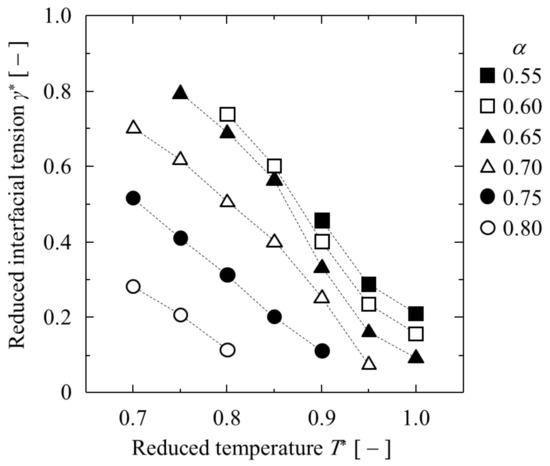
Figure 5.
Dependence of interfacial tension on temperature at various α.
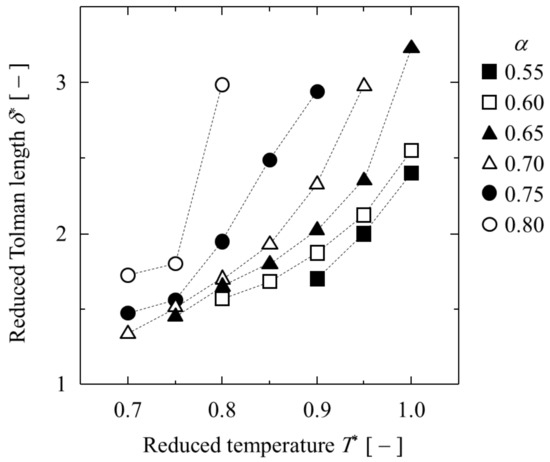
Figure 6.
Dependence of Tolman length on temperature at various α.
Figure 5 shows that γ* changed strongly under the influence of T*, but at the same time, also changed strongly under the influence of T*, as shown in Figure 4. In other words, since γ* may also be strongly affected by , the effects of and T* on γ* are shown in Figure 7. Comparing γ* between similar , γ* tends to be slightly larger with a higher T*, but the effect of T* on γ* is small. In contrast, the effect of the difference in on γ* is very large, and the larger is, the smaller γ* becomes.
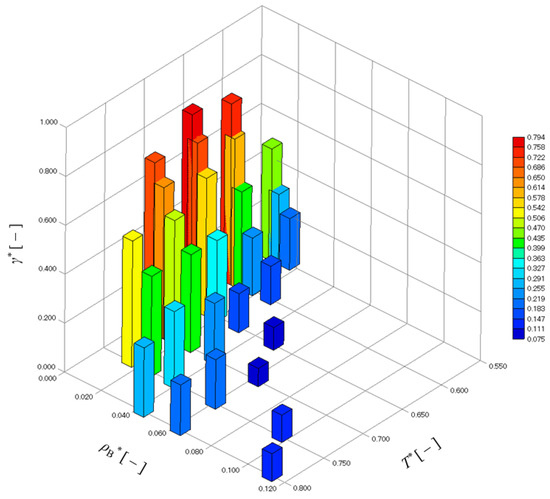
Figure 7.
Dependence of interfacial tension on and T*.
4. Discussion
The γL* was nearly plane-symmetric against the position of the peak of the surface of tension, as shown in Figure 2. In other words, even at a distance of δ to 2 δ from the equimolar dividing surface, local interfacial tension occurred; that is, the thickness of the transition region of the LJ liquid–liquid interface was 4 δ, which implies a thickness of roughly 5 σ to 13 σ, based on the values of δ* shown in Table 1.
It is well known that the Tolman length at the vapor–liquid interface of Lennard–Jones fluid is generally between 1 σ and 2 σ [29], depending on the temperature, while the Tolman length at the liquid–liquid interface is much longer than that at the vapor–liquid interface. It is also a peculiar characteristic of the symmetric binary Lennard–Jones system that tension surfaces occur on both sides of the equimolar dividing surface. Since local tension reflects the local stress anisotropy, the tension surfaces should shift to either side of the phase between materials with significantly different densities. In other words, this phenomenon is unique to the symmetric binary system as the bulk density of the two phases is the same, and great care must be taken when using this as a model system for molecular simulations.
This implies that the usual concept of the interfacial tension of the binary LJ liquid–liquid at flat interfaces cannot be applied when nano-scale LJ droplets are surrounded by other LJ liquids. For example, as shown in Figure 8, when the diameter of the Ar “A” droplet is 6 σAA and δ is slightly smaller than 3 σAA, the internal surface of tension of the Ar “A” phase shrinks to about 1 σAA or less. Furthermore, inside the surface of tension with a diameter of σ, there is still a weak local interfacial tension, and the local interfacial tensions overlap in the face-to-face direction inside the surface of tension.
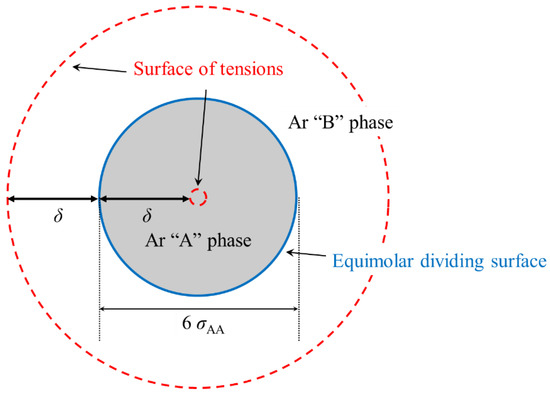
Figure 8.
Schematic diagram of the application of the concept of surface tension to a droplet with a 6 σAA diameter surrounded by dissimilar liquid.
The interfacial tension results also indicate that it is difficult to bring the usual concept of interfacial tension to bear on capillary phase separation inside nanopores. A schematic diagram of the application of the usual concept of interfacial tension to capillary phase separation, also in nanopores, is shown in Figure 9. Nanopores are pores with a size at the lower mesopore limit, at 2 to 4 nm [29]. This means that the reduced pore size is approximately 5 σ to 10 σ. Inside the nanopore, the liquid with a strong interaction with the pore wall is capillary condensed as phase B, and the liquid with a weak interaction with the pore wall exists outside of it as phase A. There is also a phase B covering the surface of the pore wall [50]. As shown in Figure 9, one tension surface will be embedded inside the pore wall, and the other tension surface will be located close to another pore wall. Since the liquid–liquid interface forms a meniscus in capillary phase separation, the position of the tension surfaces inside phase A becomes strange. This means that the concept of the Tolman length at a flat interface may not be applicable to the capillary phase separation of symmetric binary liquids.
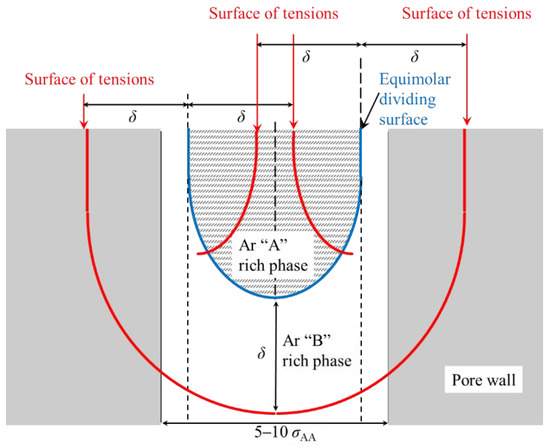
Figure 9.
Schematic diagram of the application of the concept of surface tension to capillary phase separation inside a nanopore.
In the liquid phase consisting of a single component, the surface tension–temperature relationship is well known, and the Guggenheim–Katayama equation accurately shows the experimental results for neon, argon, oxygen, and nitrogen over a wide range of temperatures [55]:
where V is the molar volume and the subscript C indicates a critical point. Since molecular dynamics simulations of liquid–liquid interfacial tensions, such as the present study, are unprecedented, we investigated whether the Guggenheim–Katayama could can be directly applied to symmetric binary Lennard–Jones liquid–liquid interfacial tensions as a practical approximation.
Here, we defined Tc for a symmetric binary Lennard–Jones liquid–liquid system as the temperature at which the two liquid phases mix completely with each other. Equation (4) can be used to determine the critical temperature in the single-component system [56]:
where ρ is density, and the subscripts L and V indicate liquid and vapor phases, respectively. C is the adjustable parameter used to determine the critical point. Thus, for the binary Lennard–Jones system, we assume the following similar equation:
According to equation 5, using C determined from ρ1 and ρ2 by the least-squares method, ρC values were obtained as 0.374–0.387, 0.344–0.359, 0.337–0.351, and 0.322–0.337 for values of α of 0.80, 0.75, 0.70, and 0.65, respectively.
In Figure 10, the γ* and (1 − T/TC)11/9 relationship is shown in order to examine the applicability of the Guggenheim–Katayama equation for the interfacial tension of a binary LJ liquid system. In cases in which T is close to Tc and α = 0.65 or 0.70, the decay pattern becomes nonlinear and does not follow the Guggenheim–Katayama equation. Surprisingly, the proportionality of the Guggenheim–Katayama equation was almost valid for the MD simulation results for α = 0.75 or 0.80, even though it is a rather rough approximation.
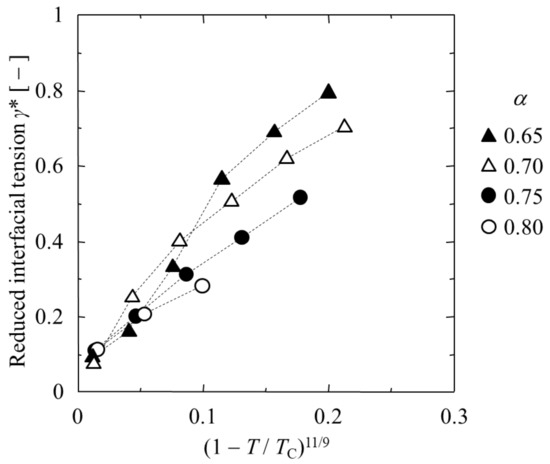
Figure 10.
γ* and (1 − T/TC)11/9 relationship.
As is well known, the phase diagram and physical properties of a one-component LJ fluid are non-dimensionalized by the LJ parameters ε and σ, such as T* and γ* [54]. Even for LJ materials with different ε and σ, the phase diagram and physical properties will be the same due to non-dimensionalization. On the other hand, TC indicates the temperature at which perfect mixing occurs and depends on α, the interaction strength between different LJ Ar. α is not involved in the non-dimensionalization of T* and γ*, and so such non-dimensionalization is not suitable for T/TC; thus, non-dimensionalization by ε and σ is not used here.
5. Conclusions
The interfacial tension and Tolman length of the liquid–liquid interface in symmetric binary LJ fluid systems, which have not been studied before, are revealed in this work with a sufficient cutting distance and sufficient interfacial area. Two surfaces of tension were observed on both sides of the equimolar dividing surface of a partially miscible LJ mixture. The higher the mutual solubility, the longer the Tolman length becomes, exceeding 3 σ. Therefore, it is necessary to recognize that applying the concept of the liquid–liquid interface by continuum approximation or the concept of the Tolman length to the curved liquid–liquid interface at the nanoscale may require unreasonable assumptions to be made.
Author Contributions
Conceptualization, H.K.; methodology, H.K.; software, H.K.; validation, H.K.; formal analysis, H.K.; investigation, H.K.; resources, H.K.; data curation, H.K.; writing—original draft preparation, H.K.; writing—review and editing, H.K.; visualization, H.K.; supervision, W. and M.G.; project administration, H.K.; funding acquisition, H.K. All authors have read and agreed to the published version of the manuscript.
Funding
The Science and Technology Research Partnership for Sustainable Development Program of Japan Science and Technology Agency (grant number JPMJSA1505 to H.K.) and JSPS KAKENHI (grant number 21760615 to H.K.) supported part of this work.
Institutional Review Board Statement
Not applicable.
Informed Consent Statement
Not applicable.
Data Availability Statement
Not applicable.
Conflicts of Interest
The authors declare no conflict of interest.
References
- Tolman, R.C. Consideration of the Gibbs theory of surface tension. J. Chem. Phys. 1948, 16, 758–773. [Google Scholar] [CrossRef]
- Tolman, R.C. The superficial density of matter at a liquid-vapor boundary. J. Chem. Phys. 1949, 17, 118–127. [Google Scholar] [CrossRef]
- Tolman, R.C. The effect of droplet size on surface tension. J. Chem. Phys. 1949, 17, 333–337. [Google Scholar] [CrossRef]
- Kirkwood, J.G.; Buff, F.P. The statistical mechanical theory of surface tension. J. Chem. Phys. 1949, 17, 338–343. [Google Scholar] [CrossRef]
- Buff, F.P.; Kirkwood, J.G. Remarks on the surface tension of small droplets. J. Chem. Phys. 1950, 18, 991–992. [Google Scholar] [CrossRef]
- Koenig, F.O. On the thermodynamic relation between surface tension and curvature. J. Chem. Phys. 1950, 18, 449–459. [Google Scholar] [CrossRef]
- Melrose, J.C. Thermodynamic aspects of capillarity. J. Ind. Eng. Chem. 1968, 60, 53–70. [Google Scholar] [CrossRef]
- Blokhuis, E.M.; Kuipers, J. Thermodynamic expressions for the Tolman length. J. Chem. Phys. 2006, 124, 074701. [Google Scholar] [CrossRef]
- Thompson, S.M.; Gubbins, K.E.; Walton, J.P.R.B.; Chantry, R.A.R.; Rowlinson, J.S. A molecular dynamics study of liquid drops. J. Chem. Phys. 1984, 81, 530–542. [Google Scholar] [CrossRef]
- Shreve, A.P.; Walton, J.P.R.B.; Gubbins, K.E. Liquid drops of polar molecules. J. Chem. Phys. 1986, 85, 2178–2186. [Google Scholar] [CrossRef]
- Kuz, V.A. Evaporation of small drops. J. Appl. Phys. 1991, 69, 7034–7036. [Google Scholar] [CrossRef]
- Blokhuis, E.M.; Bedeaux, D. Pressure tensor of a spherical interface. J. Chem. Phys. 1992, 97, 3576–3586. [Google Scholar] [CrossRef]
- Iwamatsu, M. The surface tension and Tolman’s length of a drop. J. Phys. Condense. Matter 1994, 6, L173–L177. [Google Scholar] [CrossRef]
- Koga, K.; Zeng, X.C.; Shchekin, A.K. Validity of Tolman’s equation: How large should a droplet be? J. Chem. Phys. 1998, 109, 4063–4070. [Google Scholar] [CrossRef]
- Gránásy, L. Semiempirical Van der Waals/Cahn-Hilliard theory: Size dependence of the Tolman length. J. Chem. Phys. 1998, 109, 9660–9663. [Google Scholar] [CrossRef]
- Moody, M.P.; Attard, P. Curvature-dependent surface tension of a growing droplet. Phys. Rev. Lett. 2003, 91, 056104. [Google Scholar] [CrossRef] [PubMed]
- Lu, H.M.; Jiang, Q. Size-dependent surface tension and Tolman’s length of droplets. Langmuir 2005, 21, 779–781. [Google Scholar] [CrossRef] [PubMed]
- Anisimov, M.A. Divergence of Tolman’s length for a droplet near the critical point. Phys. Rev. Lett. 2007, 98, 035702. [Google Scholar] [CrossRef] [PubMed]
- Ashbaugh, H.S. Blowing bubbles in Lennard–Jonesium along the saturation curve. J. Chem. Phys. 2009, 130, 204517. [Google Scholar] [CrossRef]
- Baranov, S.A.; Rekhviashvili, S.S.; Sokurovc, A.A. Some problems in simulation of the thermodynamic properties of droplets. Surf. Eng. Appl. Electrochem. 2019, 55, 286–293. [Google Scholar] [CrossRef]
- Schmelzer, J.W.P.; Abyzov, A.S.; Baidakov, V.G. Entropy and the Tolman parameter in nucleation theory. Entropy 2019, 21, 670. [Google Scholar] [CrossRef]
- Schmelzer, J.W.P.; Abyzov, A.S.; Ferreira, E.B.; Fokin, V.M. Curvature dependence of the surface tension and crystal nucleation in liquids. Int. J. Appl. Glass Sci. 2019, 10, 57–68. [Google Scholar] [CrossRef]
- Kashchiev, D. Nucleation work, surface tension, and Gibbs–Tolman length for nucleus of any size. J. Chem. Phys. 2020, 153, 124509. [Google Scholar] [CrossRef] [PubMed]
- Nijmeijer, M.J.P.; Bakker, A.F.; Bruin, C.; Sikkenk, J.H. A molecular dynamics simulation of the Lennard–Jones liquid-vapor interface. J. Chem. Phys. 1988, 89, 3789–3792. [Google Scholar] [CrossRef]
- Holcomb, C.D.; Clancy, P.; Zollweg, J.A. A critical study of the simulation of the liquid-vapour interface of a Lennard–Jones fluid. Am. J. Physiol. Lung Cell. Mol. Physiol. 1993, 78, 437–459. [Google Scholar] [CrossRef]
- Haye, M.J.; Bruin, C. Molecular dynamics study of the curvature correction to the surface tension. J. Chem. Phys. 1994, 100, 556–558. [Google Scholar] [CrossRef]
- Chen, L.-J. Area dependence of the surface tension of a Lennard–Jones fluid from molecular dynamics simulations. J. Chem. Phys. 1995, 103, 10214–10216. [Google Scholar] [CrossRef]
- Trokhymchuk, A.; Alejandre, J. Computer simulations of liquid/vapor interface in Lennard–Jones fluids: Some questions and answers. J. Chem. Phys. 1999, 111, 8510–8523. [Google Scholar] [CrossRef]
- Kanda, H.; Miyahara, M.; Higashitani, K. Triple point of Lennard–Jones fluid in slit nanopore: Solidification of critical condensate. J. Chem. Phys. 2004, 120, 6173–6179. [Google Scholar] [CrossRef] [PubMed]
- Baidakov, V.G.; Khotienkova, M.N. Surface tension of methane–nitrogen solutions: 2. Description in the framework of the van der Waals gradient theory. Fluid Phase Equilib. 2016, 425, 402–410. [Google Scholar] [CrossRef]
- Brochard, F.; de Gennes, P.G. Phase transitions of binary mixtures in random media. J. Phys. Lett. 1983, 44, L785. [Google Scholar] [CrossRef]
- Nakanishi, H.; Fisher, M.E. Critical point shifts in films. J. Chem. Phys. 1983, 78, 3279–3293. [Google Scholar] [CrossRef]
- De-Gennes, P.G. Liquid-liquid demixing inside a rigid network. Qualitative features. J. Phys. Chem. 1984, 88, 6469–6472. [Google Scholar] [CrossRef]
- Ma, W.-J.; Maritan, A.; Banavar, J.R.; Koplik, J. Dynamics of phase separation of binary fluids. Phys. Rev. A 1992, 45, R5347–R5350. [Google Scholar] [CrossRef] [PubMed]
- Keblinski, P.; Ma, W.-J.; Maritan, A.; Koplik, J.; Banavar, J.R. Molecular dynamics of phase separation in narrow channels. Phys. Rev. E 1993, 47, R2265–R2268. [Google Scholar] [CrossRef] [PubMed]
- Zhang, Z.; Chakrabarti, A. Phase separation of binary fluids confined in a cylindrical pore: A molecular dynamics study. Phys. Rev. E 1994, 50, R4290–R4294. [Google Scholar] [CrossRef] [PubMed]
- Zhang, Z.; Chakrabarti, A. Phase separation of binary fluids in porous media: Asymmetries in pore geometry and fluid composition. Phys. Rev. E 1995, 52, 2736–2741. [Google Scholar] [CrossRef]
- Laradji, M.; Toxvaerd, S.; Mouritsen, O.G. Molecular dynamics simulation of spinodal decomposition in three-dimensional binary fluids. Phys. Rev. Lett. 1996, 77, 2253–2256. [Google Scholar] [CrossRef]
- Velasco, E.; Toxvaerd, S. Phase separation in two-dimensional binary fluids: A molecular dynamics study. Phys. Rev. E 1996, 54, R605–R610. [Google Scholar] [CrossRef]
- Sliwinska-Bartkowiak, M.; Sowers, S.L.; Gubbins, K.E. Liquid−liquid phase equilibria in porous materials. Langmuir 1997, 13, 1182–1188. [Google Scholar] [CrossRef]
- Gelb, L.D.; Gubbins, K.E.; Radhakrishnan, R.; Sliwinska-Bartkowiak, M. Phase separation in confined systems. Rep. Prog. Phys. Phys. Soc. 1999, 62, 1573–1659. [Google Scholar] [CrossRef]
- Das, S.K.; Puri, S.; Horbach, J.; Binder, K. Molecular dynamics study of phase separation kinetics in thin films. Phys. Rev. Lett. 2006, 96, 016107. [Google Scholar] [CrossRef]
- Bucior, K.; Yelash, L.; Binder, K. Phase separation of an asymmetric binary-fluid mixture confined in a nanoscopic slit pore: Molecular-dynamics simulations. Phys. Rev. E 2008, 77, 051602. [Google Scholar] [CrossRef]
- Patrick, W.A.; Jones, D.C. Studies in the adsorption from solution from the standpoint of capillarity. I. J. Phys. Chem. 1925, 29, 1–10. [Google Scholar] [CrossRef]
- Patrick, W.A.; Eberman, N.F. Studies in the adsorption from solution from the standpoint of capillarity. II. J. Phys. Chem. 1925, 29, 220–228. [Google Scholar] [CrossRef]
- Miyahara, M.; Kato, M.; Okazaki, M. Liquid-phase capillary condensation and adsorption isotherm. AIChE J. 1994, 40, 1549–1557. [Google Scholar] [CrossRef]
- Miyahara, M.; Suzuki, K.; Okazaki, M. Capillary phase separation in solvent dehydration by hygroscopic porous adsorbents. J. Chem. Eng. Jpn. 1997, 30, 683–690. [Google Scholar] [CrossRef][Green Version]
- Díaz-Herrera, E.; Moreno-Razo, J.A.; Ramírez-Santiago, G. Wetting phenomenon in the liquid-vapor phase coexistence of a partially miscible Lennard–Jones binary mixture. Phys. Rev. E 2004, 70, 051601. [Google Scholar] [CrossRef]
- Diaz-Herrera, E.; Ramirez-Santiago, G.; Moreno-Razo, J.A. Phase and interfacial behavior of partially miscible symmetric Lennard–Jones binary mixtures. J. Chem. Phys. 2005, 123, 184507. [Google Scholar] [CrossRef]
- Kanda, H.; Makino, H. Liquid-liquid phase separation of binary Lennard–Jones fluid in slit nanopores. Adsorption 2008, 14, 485–491. [Google Scholar] [CrossRef][Green Version]
- Stephan, S.; Hasse, H. Influence of dispersive long-range interactions on properties of vapour–liquid equilibria and interfaces of binary Lennard–Jones mixtures. Mol. Phys. 2020, 118, e1699185. [Google Scholar] [CrossRef]
- van der Meer, B.; Prymidis, V.; Dijkstra, M.; Filion, L. Predicting the phase behavior of mixtures of active spherical particles. J. Chem. Phys. 2020, 152, 144901. [Google Scholar] [CrossRef]
- Kofke, D.A. Direct evaluation of phase coexistence by molecular simulation via integration along the saturation line. J. Chem. Phys. 1993, 98, 4149–4162. [Google Scholar] [CrossRef]
- del Río, E.M.; de Miguel, E. Computer simulation study of the free surfaces of a liquid crystal model. Phys. Rev. E 1997, 55, 2916–2924. [Google Scholar] [CrossRef]
- Guggenheim, E.A. The principle of corresponding states. J. Chem. Phys. 1945, 13, 253. [Google Scholar] [CrossRef]
- Smit, B. Phase diagrams of Lennard–Jones fluids. J. Chem. Phys. 1992, 96, 8639–8640. [Google Scholar] [CrossRef]
Publisher’s Note: MDPI stays neutral with regard to jurisdictional claims in published maps and institutional affiliations. |
© 2021 by the authors. Licensee MDPI, Basel, Switzerland. This article is an open access article distributed under the terms and conditions of the Creative Commons Attribution (CC BY) license (https://creativecommons.org/licenses/by/4.0/).