Article

Bayesian Testing Procedure on the Lifetime Performance Index of Products Following Chen Lifetime Distribution Based on the Progressive Type-II Censored Sample

1
Department of Statistics, Tamkang University, Tamsui, Taipei 251301, Taiwan
2
Department of Computer Science, University of Taipei, Taipei 100234, Taiwan
*
Author to whom correspondence should be addressed.
Symmetry 2021, 13(8), 1322; https://doi.org/10.3390/sym13081322
Submission received: 11 June 2021 / Revised: 16 July 2021 / Accepted: 21 July 2021 / Published: 22 July 2021

Abstract

:
With the high demands on the quality of high-tech products for consumers, assuring the lifetime performance is a very important task for competitive manufacturing industries. The lifetime performance index CL is frequently used to monitor the larger-the-better lifetime performance of products. This research is related to the topic of asymmetrical probability distributions and applications across disciplines. Chen lifetime distribution with a bathtub shape or increasing failure rate function has many applications in the lifetime data analysis. We derived the uniformly minimum variance unbiased estimator (UMVUE) for CL, and we used this estimator to develop a hypothesis testing procedure of CL under a lower specification limit based on the progressive type-II censored sample. The Bayesian estimator for CL is also derived, and it is used to develop another hypothesis testing procedure. A simulation study is conducted to compare the average confidence levels for two procedures. Finally, one practical example is given to illustrate the implementation of our proposed non-Bayesian and Bayesian testing procedure.

1. Introduction

In the competitive industry of manufacturing, evaluating whether the performance of products meets the desired quality level is crucial in order to get a larger market share. Process capability indices have been widely utilized as the measurement of the larger-the-better type quality characteristics (See Montgomery [1] for more examples and details). Montgomery [1] proposed a lifetime performance index denoted by C L = μ L σ , where μ represents the process mean, σ denotes the process standard deviation, and L is the known pre-specified lower specification limit. This lifetime performance index is usually used to evaluate the lifetime performance of products. Tong et al. [2] constructed the UMVUE for C L and built a hypothesis testing procedure for the complete sample for an exponential distribution of lifetimes. In practical applications, the lifetimes of all products cannot be observed in the life test due to the limited material resources or experimental time. There are two types of censoring, including type I censoring and type II censoring. Progressive censoring allows the removal of units (accidental breakage of units) at points other than the final termination point for some quality engineers. The application of progressive censored data is referring to Balakrishnan and Cramer [3], Aggarwala [4], Wu [5], and Wu et al. [6]. For the progressive type-I interval censored sample, Wu [7] proposed the testing assessment on the lifetime performance index of products following a Chen lifetime distribution. Wu and Chang [8] evaluated the lifetime performance index of products following the exponentiated Frech’et distribution. Wu and Hsieh [9] assessed the lifetime performance index of products following the Gompertz distribution. For the progressive type-II censored data, Laumen and Cramer [10] proposed the inferences for the lifetime performance index from gamma distributions. Lee et al. [11] evaluated the lifetime performance index for products with an exponential distribution, and Wu et al. [12] considered the Bayesian test for the lifetime performance index. Lee et al. [13] and Wu et al. [14] evaluated the lifetime performance index for products with the Burr XII distribution. Lee [15] assessed the lifetime performance index of Rayleigh products based on the Bayesian estimation. This paper is focused on a two-parameter lifetime distribution with a bathtub shape or increasing failure rate function proposed by Chen [16] (so-called Chen lifetime distribution). The Chen lifetime distribution is an asymmetrical probability distribution. This distribution is a case of a new class of distribution functions for lifetime data with ϕ t ; β = ( β 1 ) t 1 + β t β 1 in Domma and Condino [17]. They have shown that the failure rate function has a bathtub shape with the minimum point at t * = 1 β β 1 β when 0 < β < 1. The failure rate function is increasing when β 1. There is no research related to the evaluation of the lifetime performance index for products from the Chen distribution based on the progressive type-II censored sample in the literature. Our research objective is to extend the testing procedures for the lifetime performance index from an exponential distribution, gamma distribution, Burr XII distribution, and Rayleigh distribution to include the Chen distribution. We propose two hypothesis testing procedures to assess the lifetime performance for products based on two estimators. We also conduct the simulation study to verify our proposed procedures and compare the performance of the two procedures.
The rest of this paper is organized as follows: In Section 2, the lifetime performance index for products with Chen lifetime distribution is introduced, and the increasing mathematical relationship between the lifetime performance index and the conforming rate is discussed. In Section 3, the UMVUE and the Bayesian estimator for the lifetime performance index C L are derived, and two hypothesis testing procedures based on these two estimators are developed. The Monte Carlo simulation is done to compare the average confidence levels for two procedures. One practical example is given to illustrate the two proposed testing procedures. The discussion is given in the Discussions Section. Lastly, the summary, limitations, and future research directions are proposed in the Conclusions Section.

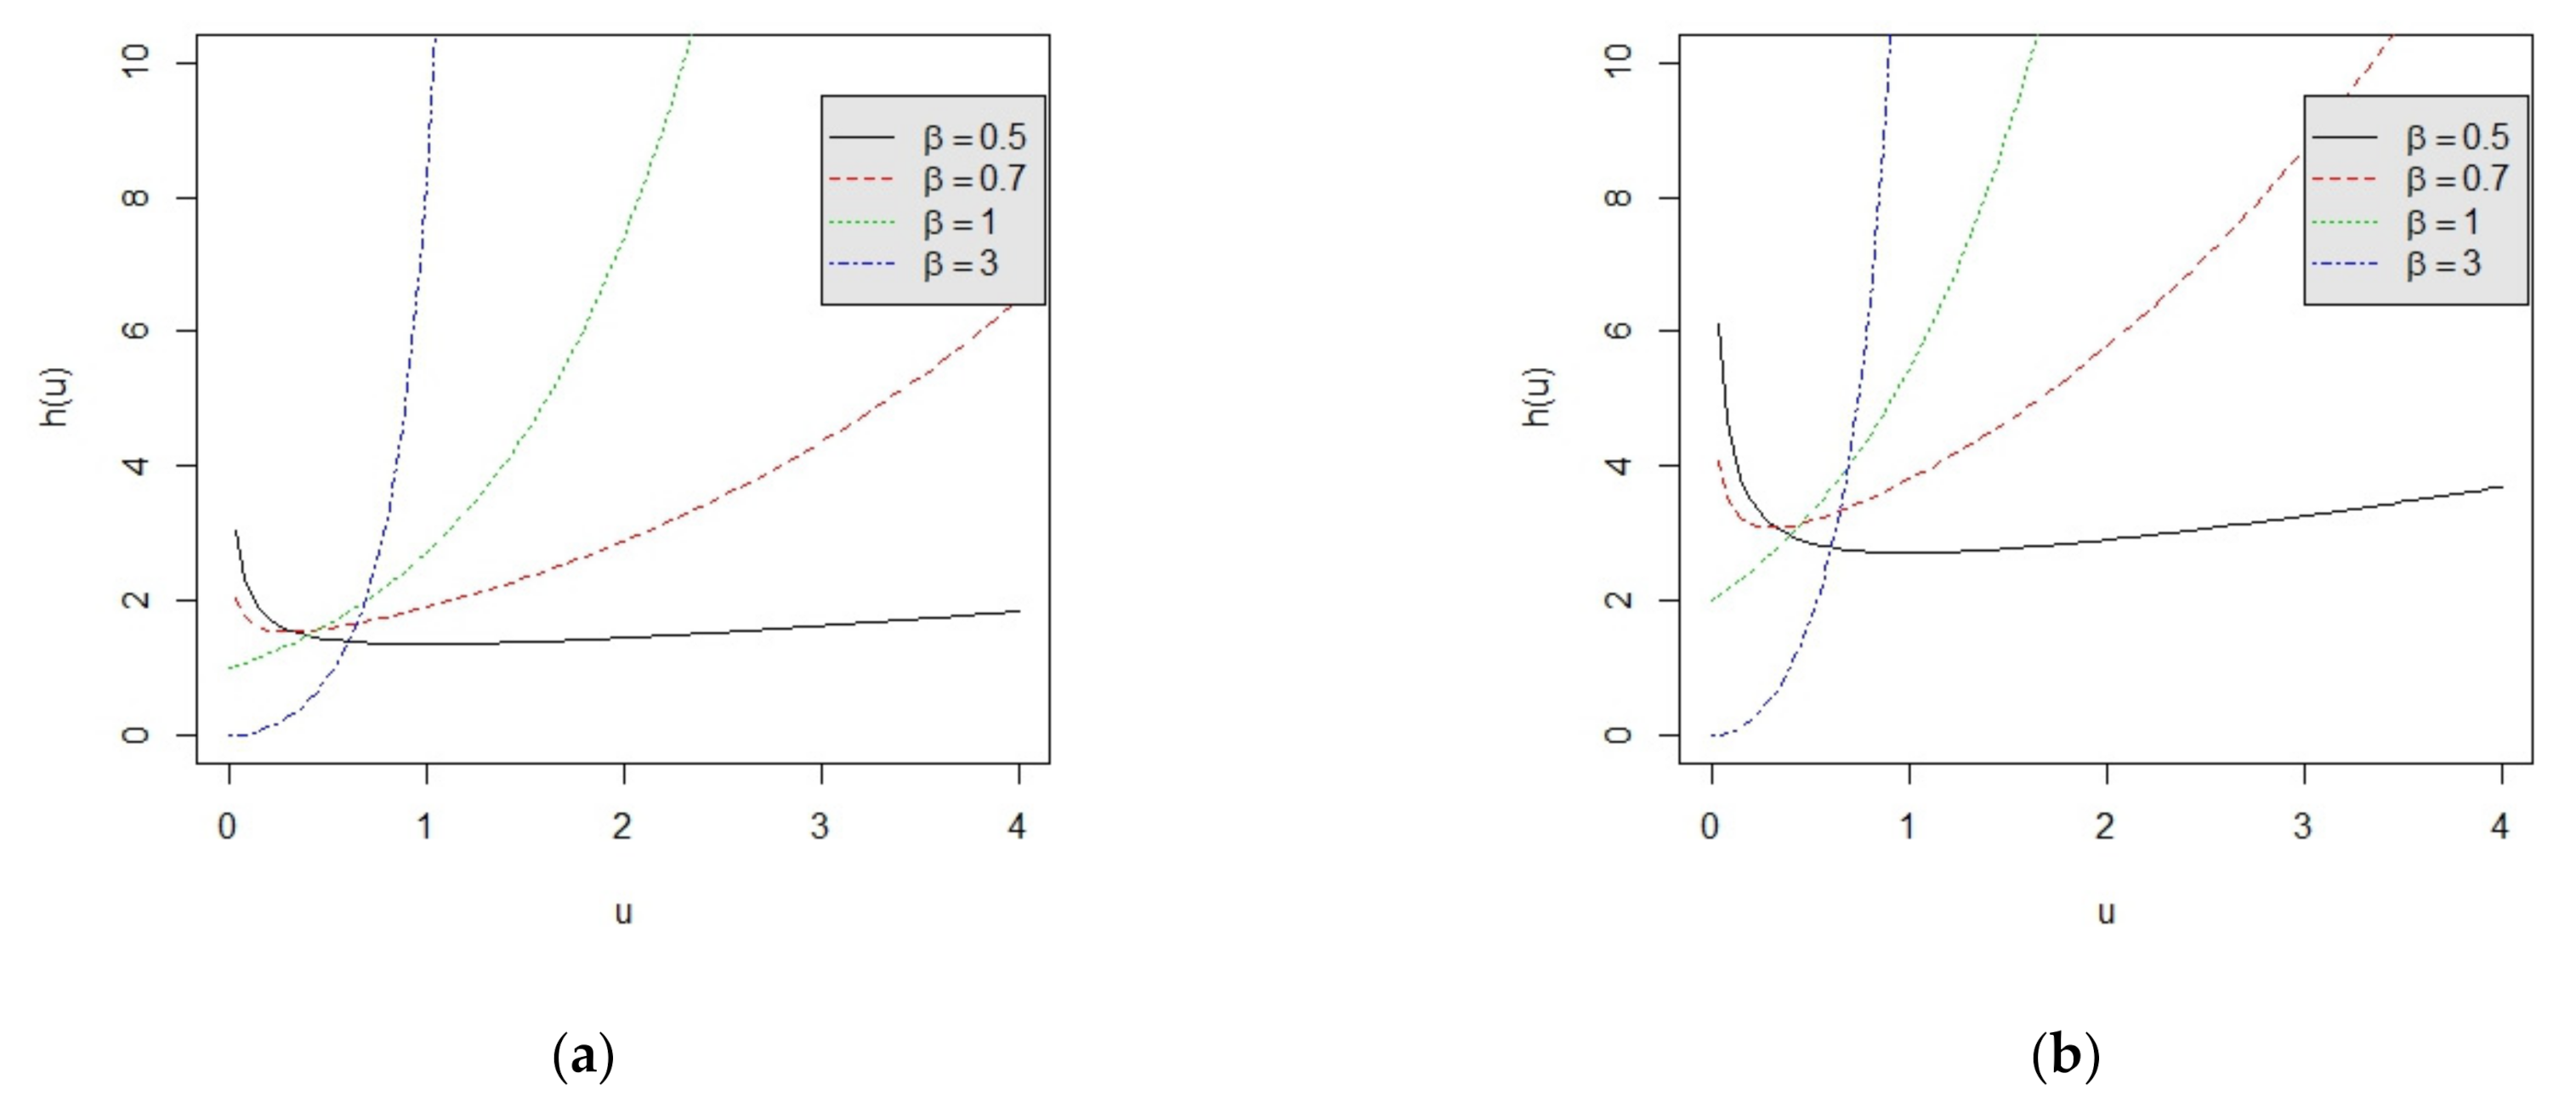
2. The Monotonic Relationship between the Lifetime Performance Index and the Conforming Rate

Suppose that the lifetime U of products has a Chen lifetime distribution (Chen [14]) with the probability density function (pdf) and the cumulative distribution function (cdf) as follows:
f U ( u ) = k β u β 1 e u β exp { k ( 1 e u β ) } , 0 u , k > 0 , β > 0
and
F U u = 1 exp { k ( 1 e u β ) } , 0 u , k > 0 , β > 0
The failure rate function is defined as
h U u = f U u 1 F U u = k β u β 1 e u β .
The failure rate function for β = 0.5, 0.7, 1, and 3 under k = 1 and 2 is displayed in Figure 1a,b. It is shown that this distribution has an increasing failure rate function when β 1 and a bathtub shape failure rate function when β < 1.
Consider the variable transformation from U to Y as Y = e U β 1 ,   β > 0 . The pdf of this new random variable Y is obtained as f Y ( y ) = k exp { k y } , y > 0 , k > 0 , which is the pdf of an exponential distribution with scale parameter 1/k and failure rate k.
The lifetime of products is a larger-the-better type quality characteristic since products with a longer lifetime tend to be more competitive in these emerging markets. The lifetime performance index C L is used to evaluate the lifetime performance of products.
The mean and the standard deviation of the new random variable Y are given by μ = 1 k and σ = 1 k . Then the lifetime performance index is reduced to C L = 1 k L .
It is observed that C L is a decreasing function of the failure rate k. It implies that the smaller failure rate, the larger the value of C L . Assume that L U is the pre-specified lower specification limit for products. An item of product is regarded to be conforming if its lifetime U exceeds L U . That is the conforming rate, calculated as P r = P U L U . Since the new lifetime Y = e U β 1 is an increasing function of U, then L = e L U β 1 can be regarded as the lower specification limit for Y. Then, the conforming rate is calculated as
P r = P U L U = P Y L = exp k L = exp C L 1 , < C L < 1 .
It is observed that the conforming rate P r is an increasing function of the lifetime performance index C L . The conforming rate P r and the related values of C L are listed in Table A1. From Table A1, it is shown that if a quality manager desires P r to exceed 0.860708, then C L is determined to exceed 0.85.

3. Results

3.1. UMVUE for the Lifetime Performance Index and the Testing Procedure

The censoring scheme is described as follows (from Balakrishnan and Aggarwala [18]): In the beginning, the first failure time U1 is observed, then R 1 surviving units are randomly removed under the removal percentage p 1 . When the ith failure time Ui is observed, R i surviving units are randomly removed under the removal percentage p i , i = 1,…, m − 1. When the mth failure time Um is observed, this experiment is terminated, and the remaining R m = n R 1 R m 1 m surviving units are all removed under the removal percentage p m = 1. Supposing that the failure times are following the Chen distribution, then U 1 , , U m is the progressive type-II censored sample under the censoring scheme R 1 , , R m with the removal percentages p 1 , , p m . From Balakrishnan and Aggarwala [18], the likelihood function based on the progressive type-II censored sample U 1 , , U m is
L k , β i = 1 m f U u i 1 F U u i R i k m β m i = 1 m u i β 1 e u i β e k i = 1 m R i + 1 ( 1 e u i β ) , u i > 0 , k > 0 , β > 0 .
After the transformation of Y i = e U i β 1 ,   β > 0 , we obtain the likelihood function based on Y 1 , , Y m as
L ( k ) i = 1 m f Y ( y i ) ( 1 F Y ( y i ) ) R i k m exp k i = 1 m ( 1 + R i ) y i
where y i = e u i β 1 . This likelihood function implies that Y 1 , , Y m is the progressive type-II censored sample from an exponential distribution with scale parameter 1/k under the censoring scheme R 1 , , R m with the removal percentages p 1 , , p m .
To solve the log-likelihood equation, the maximum likelihood estimator (MLE) of k is given by k ^ = m i = 1 m ( 1 + R i ) y i .
Let Z 1 = n k Y 1 , Z 2 = k ( n R 1 1 ) ( Y 2 Y 1 ) , …, Z m = k ( n R 1 R m 1 m + 1 )   ( Y m Y m 1 ) . We obtain the joint pdf of Z 1 , Z 2 , , Z m as f Z 1 , , Z m ( z 1 , , z m ) = exp ( i = 1 m z i ) , 0 < z i < . This joint pdf implies that Z 1 , Z 2 , , Z m are independently and identically distributed (i.i.d.) random variables from a standard exponential distribution, and 2 Z 1 , 2 Z 2 , , 2 Z m are i.i.d. random variables from a chi-squared distribution with 2 degrees of freedom (d.f.). Let V = 2 i = 1 m Z i = 2 k i = 1 m ( 1 + R i ) y i = 2 m k k ^ . Then we have
V ~ χ 2 2 m
The first and the second moments of 1/ V are
E ( 1 V ) = E ( k ^ 2 m k ) = 1 2 m - 2
E ( 1 V 2 ) = E ( k ^ 2 4 m 2 k 2 ) = 1 4 ( m 1 ) ( m - 2 )
From Equation (3), we can obtain the expected value of m 1 m k ^ as k. Thus, m 1 m k ^ is the unbiased estimator for k and C ˜ L = 1 m 1 m k ^ L is the unbiased estimator for C L . Furthermore, we can claim that C ˜ L is the UMVUE (uniformly minimum variance unbiased estimator) for C L . The proof is given in the Appendix A.
From Equations (3) and (4), the variance of m 1 m k ^ is k 2 ( m - 2 ) . Thus, the variance of C ˜ L is obtained as V a r ( C ˜ L ) = L 2 V a r ( m 1 m k ^ ) = L 2 k 2 m 2 .
We develop a statistical testing procedure based on the UMVUE of C L given by C ˜ L = 1 m 1 m k ^ L to assess whether the lifetime performance index exceeds the pre-specified desired level c 0 . The null hypothesis and alternative hypothesis of the statistical hypothesis procedure are set up as follows:
H 0 : C L c 0 (the process is not capable) vs. H a : C L > c 0 (the process is capable).
Since the pivotal quantity V = 2 ( m 1 ) k L ( 1 C ˜ L ) ~ χ 2 2 m , then we have
P 2 ( m 1 ) k L ( 1 C ˜ L ) < C h i i n v ( 1 α , 2 m ) | Y 1 , , Y m = 1 α
where C h i i n v ( 1 α , 2 m ) represents the lower 1—α percentile of χ 2 2 m .
Then we obtain the 100 ( 1 α )% one-sided credible interval for C L as
( 1 C h i i n v ( 1 α , 2 m ) ( 1 C ˜ L ) 2 ( m 1 ) , )
and the lower confidence bound for C L is
LB UMVUE = 1 C h i i n v ( 1 α , 2 m ) ( 1 C ˜ L ) 2 ( m 1 )
where C ˜ L = 1 m 1 m k ^ L is the UMVUE of C L . Based on the lower confidence bound for C L , the quality manager can use it to conduct a testing procedure about C L as follows:
The decision rule: Reject the null hypothesis if c 0 ( LB UMVUE , ) to conclude that the lifetime performance index of the product meets the target level.

3.2. Bayesian Estimator for the Lifetime Performance Index and the Testing Procedure

The Bayesian approach provides the methodology for the incorporation of previous information with the current data, and k is considered a random variable having a specified distribution. Let random variable k have a gamma distribution that is a conjugate prior denoted as Γ ( a , b ) and the conjugacy is with respect to Equation (1). Then the pdf of k is given by g ( k ) = 1 Γ ( a ) b a k a 1 e k b .
Then the posterior pdf of k is
π k | y 1 , y m = 1 Γ a b a k m + a 1 exp - k i = 1 m 1 + R i y i + 1 b
Waller et al. [19] presented a method by which engineering experiences, judgments, and beliefs can be used to assign values to the parameters of gamma prior distribution.
Let W = i = 1 m 1 + R i y i + 1 b . Then the posterior distribution of k is Γ m + a , W 1 and the posterior mean of k is k ¨ = m + a W 1 = m + a i = 1 m 1 + R i y i + 1 b . From Casella and Berger [20], k ¨ is the Bayesian estimator for k. Furthermore, C ¨ L = 1 k ¨ L is the Bayesian estimator for C L .
Let T = 2 k W = 2 k m + a k ¨ . Then the pdf of T is
f t = π t 2 w | y 1 , y 2 , , y m J t 2 w m + a 1 e t 2 1 2 w ,
where J = 1 2 w is the Jacobian.
Therefore, T has a gamma distribution with parameters m + a and 2. Thus,
T = 2 k W = 2 k m + a k ¨ ~ χ 2 2 m + a
Using this pivotal quantity T = 2 k m + a k ¨ ~ χ 2 2 m + a , we have
P 2 k m + a k ¨ < C h i i n v ( 1 α , 2 m + a ) | Y 1 , , Y m = 1 α
Then we obtain the 100( 1 α )% one-sided credible interval for C L as
( 1 C h i i n v ( 1 α , 2 m + a ) ( 1 C ¨ L ) 2 ( m + a ) , ) , and the Bayesian lower confidence bound for C L is LB Bayes = C h i i n v ( 1 α , 2 m + a ) ( 1 C ¨ L ) 2 ( m + a ) . Based on the Bayesian lower confidence bound for C L , the quality manager can use it to conduct a testing procedure about C L as follows: Reject the null hypothesis if c 0 ( LB Bayes , ) to conclude that lifetime performance index of the product meets the target level.

3.3. Simulation Study on Two Procedures

Using the Monte Carlo method, we conduct a simulation comparison on the average confidence level for the credible interval based on UMVUE and the other credible interval based on the Bayesian estimator. Consider α = 0.05. The Monte Carlo simulation algorithm of confidence level (1 − α) = 0.95 is given in the following steps:
Step 1: Given n,m,a,b, LU and then L = e L U β 1 , α, where n m , a,b > 0
Step 2: Generate parameter k from the prior distribution of Γ ( a , b ) .
Step 3: Generate Z 1 , Z 2 , , Z m from an exponential distribution of parameter k.
Step 4: Generate Y 1 , Y 2 , , Y m by Y 1 = Z 1 / n , Y 2 = Z 1 / n + Z 2 / ( n R 1 1 ) , …, Y i = ( Z 1 n + Z 2 n R 1 1 + Z i n R 1 R i 1 i + 1 ) , i = 3,…, m.
Step 5: Compute C L = 1 k L , LB UMVUE = 1 C h i i n v ( 1 α , 2 m ) ( 1 C ˜ L ) 2 ( m 1 ) for the first credible interval and LB Bayes = C h i i n v ( 1 α , 2 m + a ) ( 1 C ¨ L ) 2 ( m + a ) for the Bayesian credible interval.
Step 6: If C L = 1 k L ( LB UMVUE , ) , then count1 = 1, else count1 = 0:
If C L = 1 k L ( LB Bayes , ) , then count2 = 1, else count2 = 0.
Step 7: Repeat Steps 2–6 N1 times. Then we have the estimated confidence level 1 α ^ 1 = t o t a l c o u n t 1 N 1 and 1 α ^ 2 = t o t a l c o u n t 2 N 1 for the first and the Bayesian credible intervals, respectively. Furthermore, we can obtain N1 risk ( C L C ˜ L ) 2 and ( C L C ¨ L ) 2 for the UMVUE and Bayesian estimators.
Step 8: Repeat Steps 2–6 N2 times, we get N2 estimated confidence levels ( 1 α ^ j ) 1 , , ( 1 α ^ j ) N 2 , j = 1 and 2 for the first and the Bayesian credible intervals, respectively. Furthermore, we can obtain the N2 risks.
Step 9: Take the average of N2 estimated confidence levels 1 α ˜ j = i = 1 1000 ( 1 α ^ j ) i / N 2 , j = 1,2 as the average confidence level for two credible intervals. Take the average of N2 risks to yield the estimated risks for the UMVUE estimator and Bayesian estimator.
Step 10: Compute the sample mean square errors (SMSE) as i = 1 1000 ( 1 α ^ j ) i 1 + α ˜ j 2 / N 2 , j = 1,2 for two credible intervals.
R software is utilized to calculate the average confidence level for two intervals. We used N1 = 100 and N2 = 1000. The simulation results are reported in Table A2.
From Table A2, we have the following findings:
  • Both credible intervals have average confidence levels very close to the nominal ones. Thus, the performance of both credible intervals is very satisfactory even for a small sample size n = 20 or larger sample size n = 30,100.
  • The SMSEs for both credible intervals are about the same and very small in the scope of 0.000433 to 0.000523.
  • The SMSEs for both credible intervals are decreasing when m is increasing for fixed n.
  • The risk for the Bayesian estimator is smaller than the one for UMVUE. The discrepancy between the two estimators is decreasing when m is increasing for fixed n. The parameter (a,b) = (2,2) always has the smallest risk for both estimators. Generally speaking, the Bayesian estimator outperforms the UMVUE in terms of risk.
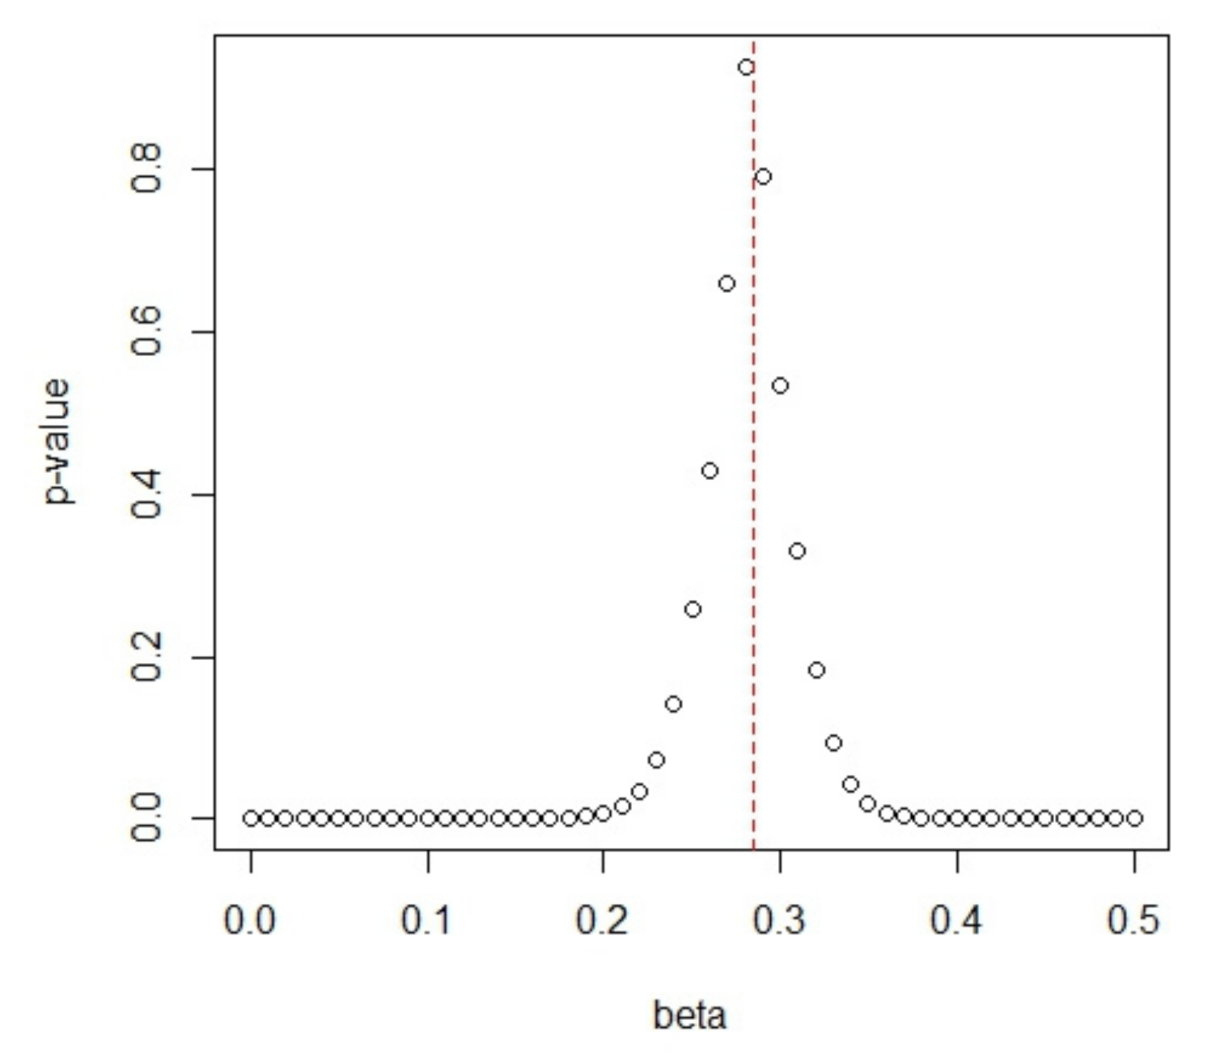
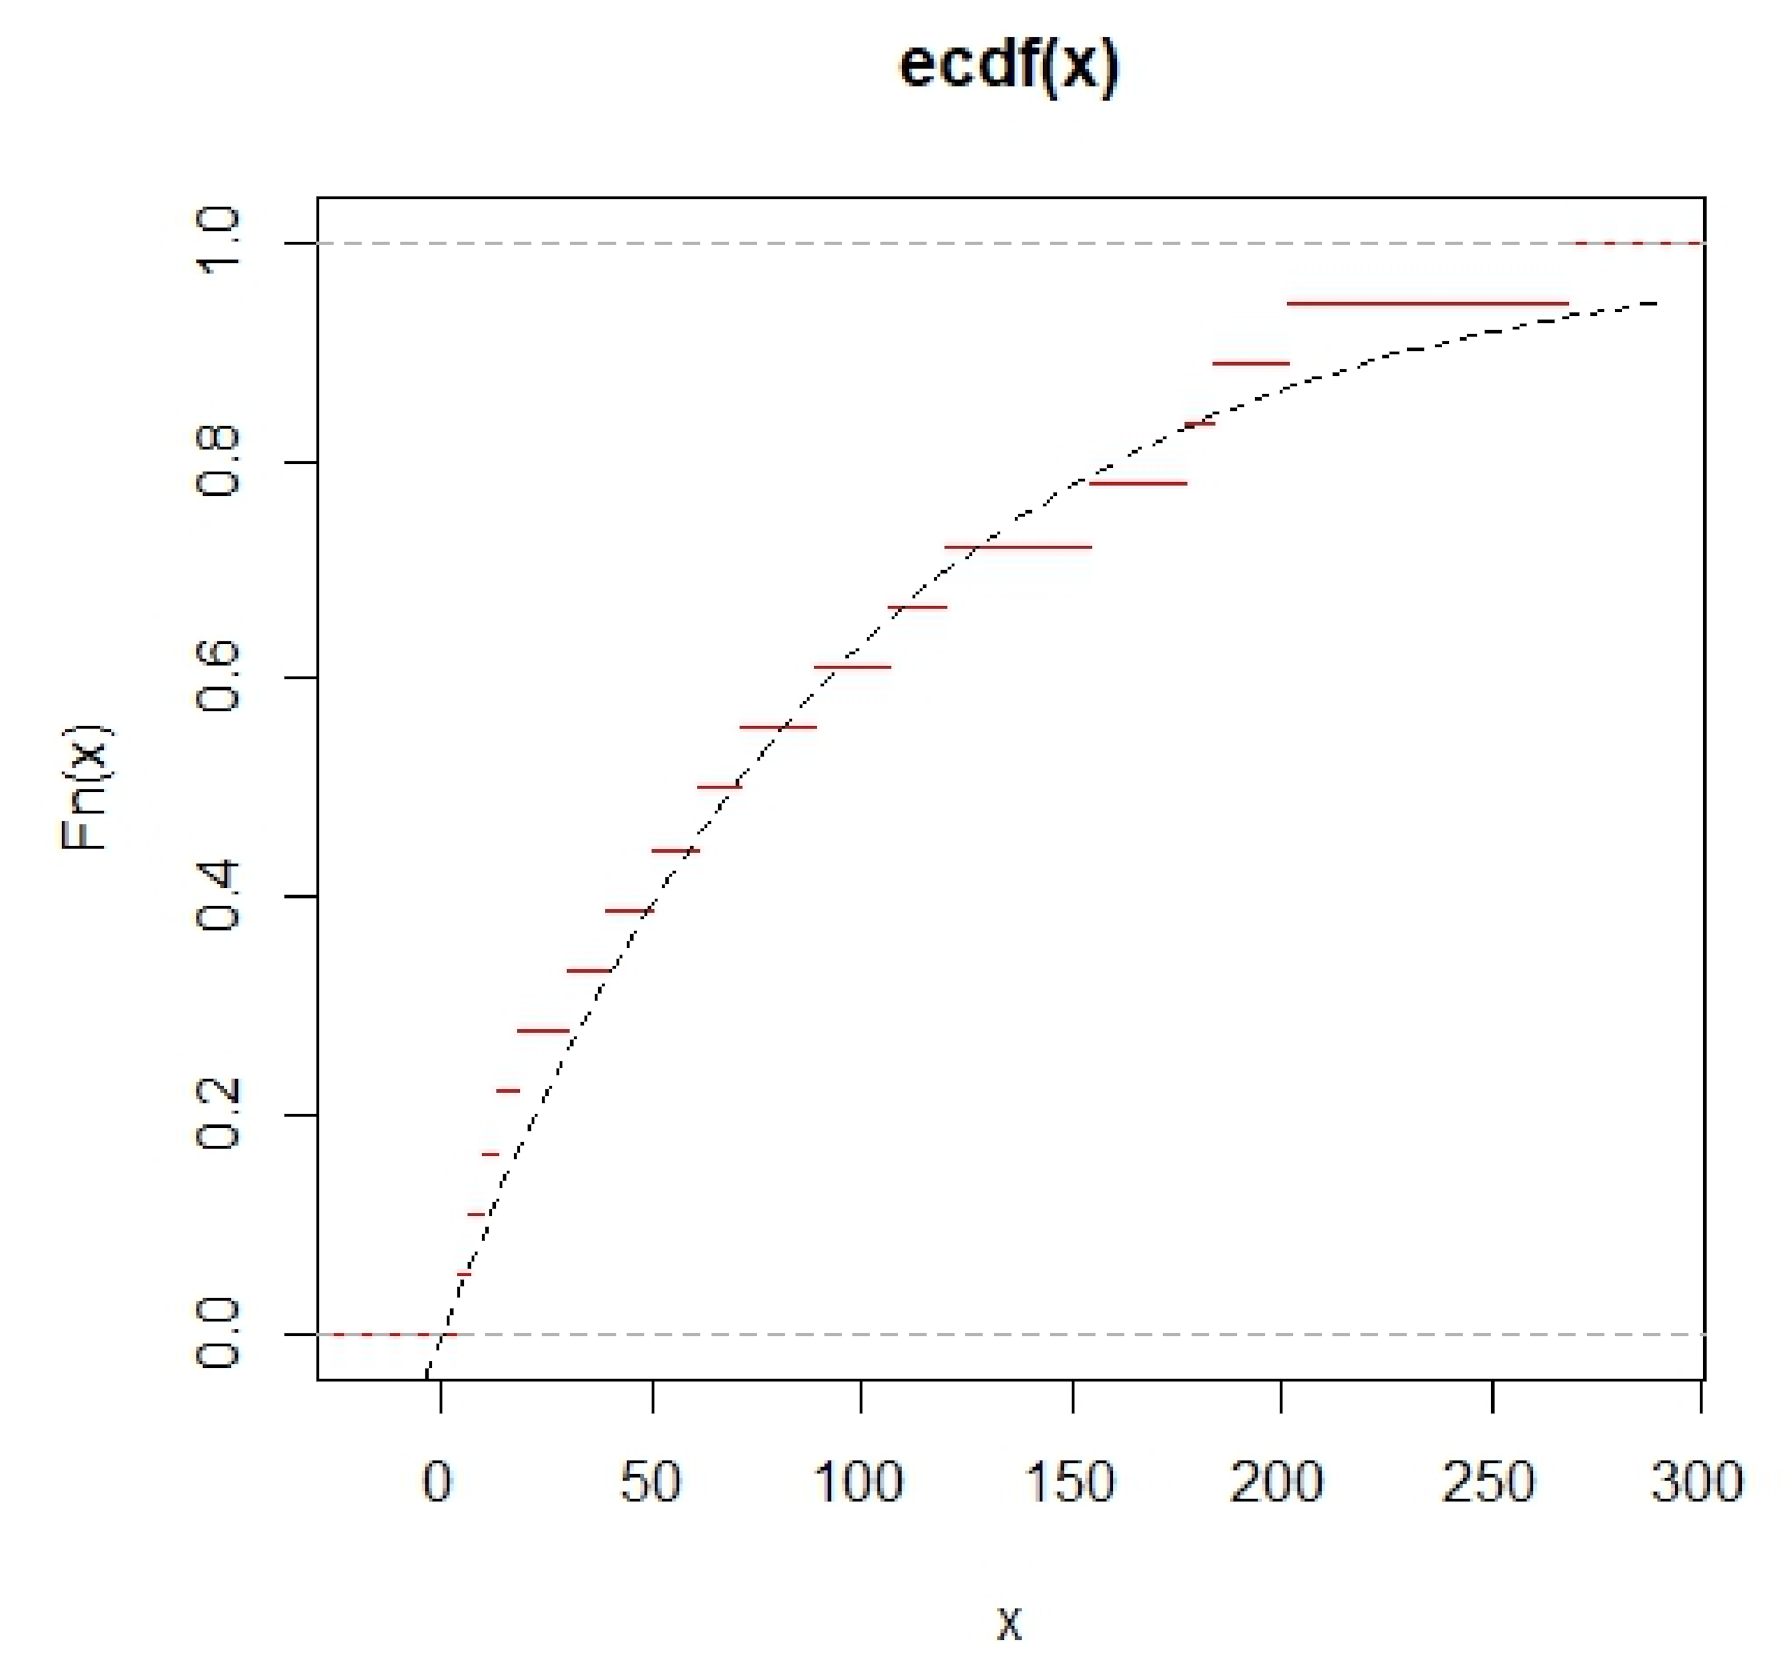
3.4. Example

One practical example of n = 18 failure times (days) of electronic devices (see Xie and Lai [21]) is given to illustrate our proposed testing procedure. The data is as follows: 5, 11, 21, 31, 46, 75, 98, 122, 145, 165, 195, 224, 245, 293, 321, 330, 350, 420.
The plot of the Gini test’s (see Gill and Gastwirth [22]) p-value against various values of β , from 0 to 0.50, is given in Figure 2, and the value of β = 0.285 yields the largest p-values of 0.931 to support a good fit for the Chen distribution. Thus, the value of β can be determined as 0.285. We also give an ecdf-plot for the data after the transformation of e U 0 . 285 1 at Figure 3 in Appendix A, where U is the data for this example.
Let m = 10 with progressive type-II censoring scheme given by R 1 , R 2 , , R 10 = (3, 3, 1, 0 × 7). Under this setup, the progressive type-II censored sample is obtained as (5, 11, 46, 75, 122, 145, 165, 293, 330, 350). The new progressive type-II censored lifetime sample is obtained as Y i = e U i 0 . 285 1 = (3.865, 6.247, 18.643, 29.658, 50.00, 61.201, 71.626, 154.598, 184.170, 201.263). Now we can start to do the proposed testing procedure for C L as follows:
Step 1: Set a = 2, b = 2, and α = 0.05 and the lower lifetime limit for relief time is L U = 0.1 days. Then the lower lifetime limit L = e L U 0 . 285 1 = 0.68.
Step 2: If the conforming rate P r of products is desired to exceed 0.905, then the lifetime performance index target value c 0 should be taken as 0.9 from Table A1. Thus, the testing null hypothesis H 0 : C L 0.9 and the alternative hypothesis H a : C L > 0.9 are constructed.
Step 3: Obtain the UMVUE of k as k ˜ = 0.01198864 and the Bayesian estimator as k ¨ = 0.014, and then calculate the corresponding estimates for C L as C ˜ L = 1 m 1 m k ^ L = 0.993 and C ¨ L = 1 k ¨ L = 0.990. Then calculate the credible lower bounds LB UMVUE = 1 C h i i n v ( 1 α , 2 m ) ( 1 C ˜ L ) 2 ( m 1 ) = 0.987 and LB Bayes = C h i i n v ( 1 α , 2 m + a ) ( 1 C ¨ L ) 2 ( m + a ) = 0.985.
Step 4: Since c 0 = 0 9 . ( LB UMVUE , ) and c 0 = 0 . 9 ( LB Bayes , ) , we conclude to reject the null hypothesis H 0 : C L 0.9 . Therefore we can conclude that the lifetime performance index of the product does meet the desired level 0.9.

4. Discussion

The assessment of the lifetime performance index of products proposed by Montgomery [1] in manufacturing industries has become an important issue in modern enterprises. The statistical inference of the lifetime performance index for products whose lifetime distributed different distributions have been widely studied in recent years. For a complete sample, Tong et al. [2] used the UMVUE for CL to develop a hypothesis testing procedure for the lifetime performance index based on the complete sample for an exponential distribution lifetime. In practice, we cannot observe all lifetimes of products due to the restrictive resources or some experimental factors. In this case, we can only observe type I or type II censored data. Integrating the progressive censoring, which allows the removal of units progressively (accidental breakage of units) at some time points, including the final termination point, the progressive censored data is collected. Wu [7] derived the maximum likelihood estimator (MLE) for the lifetime performance index based on the progressive type-I interval censored sample and built a testing procedure about CL when the lifetime of products follows a Chen lifetime distribution. Wu and Chang [8] derived the MLE for the lifetime performance index based on the progressive type-I interval censored sample and built a testing procedure about CL with the lifetime of products following an exponentiated Frech’et distribution. Wu and Hsieh [9] found the MLE for the lifetime performance index based on the progressive type-I interval censored sample and built a testing procedure about CL when the lifetime of products follows the Gompertz distribution. Progressive type-I interval censoring has the advantage of the convenience of collecting data for experimenters. However, experimenters can only observe the number of failure units at each inspection time, not the failure time for each experimental unit. Under the progressive type-II censoring, the experiment terminates when the mth failure time is observed and the failure times for the first m units, excluding the progressive censored units, are collected. Laumen and Cramer [10] derived the MLE for the lifetime performance index from gamma distributions and built a testing procedure under the same censoring. For the exponential lifetime model, Lee et al. [11] derived the UMVUE for the lifetime performance index and utilized it to build a hypothesis testing procedure for CL. Wu et al. [12] considered two Bayesian tests based on two Bayesian estimators and made simulation comparisons on the test power for two procedures. For the Burr XII model, Lee et al. [13] constructed the UMVUE for the lifetime performance index and utilized it to build a hypothesis testing procedure for CL. Wu et al. [14] consider another lifetime performance index and utilize its MLE to develop the testing procedure about CL. Lee [15] assessed the lifetime performance index of Rayleigh products based on the Bayesian estimation and used it to build a testing procedure for CL. Our theoretical contribution for this paper is to find the UMVUE for the lifetime performance index based on the MLE for Chen lifetime products and prove this result. We also find the Bayesian estimator for the lifetime performance index. We develop two testing procedures about CL based on the UMVUE and Bayesian estimators. We also make the simulation comparison for these two tests and these two estimators. The Chen distribution is a two-parameter lifetime distribution with a bathtub shape or increasing failure rate function (see Chen [16]). The property of the failure rate function is illustrated in Figure 1. The practical implications of our research are to provide two assessment testing procedures for products following lifetime distributions with a bathtub shape or increasing failure rate function. The practical application of our research is illustrated by the example of 18 failure times (days) of electronic devices (see Xie and Lai [21]) given in Section 3.4. There is not any research on the evaluation of lifetime performance index for products from a Chen distribution based on progressive type-II censored sample in the literature. Our research goal is to expand the field of the assessment on the lifetime performance index from an exponential distribution, gamma distribution, Rayleigh distribution, and Burr XII distribution to include Chen distribution based on the progressive type-II censored sample. Our research is needed to help engineers to manage the reliability of their high-quality products.

5. Conclusions

5.1. Summary

Referring to products with a Chen lifetime distribution, we derived the UMVUE and the Bayesian estimator for the lifetime performance index based on a progressive type-II censored sample. Based on these two estimators, we propose two testing procedures for the lifetime performance index. In the simulation studies, the results show that the performance of both approaches is satisfactory in terms of confidence level under various structures of censoring schemes. The SMSEs for both approaches are very small and about the same, and it implies that the estimation of the confidence level is very consistent. In terms of the risk, the Bayesian estimation always has a smaller risk than the UMVUE. This implies that the Bayesian estimation outperforms the UMVUE in the view of point estimation for the lifetime performance index. Lastly, one practical example is given to illustrate the decision testing procedure to assess whether the lifetime performance index meets the desired target level based on the progressive type-II censored sample.

5.2. Limitations and Future Research Directions

The two testing procedures proposed in this research are basically developed for the lifetime of products following a Chen distribution with an increasing failure rate function or bathtub shape failure rate function based on the progressive type-II censored sample. This research completes the field of assessment of the lifetime performance index for various lifetime distributions. The limitation of this research is that the assumption of the lifetime of products is following the Chen distribution. We only focus on the sample collected for the experiment of progressive type-II censoring. When R1 = … = Rm = 0, the censored sample is reduced to the complete sample. When R1 = … = Rm−1 = 0 and Rm  0, the censored sample is reduced to the right type II censored sample. When R1 0 and R2… = Rm = 0, the censored sample is reduced to the left type II censored sample. Therefore, the progressive type-II censored sample covers the cases of right type II censored sample, left type II censored sample, and complete sample. In the future, we can extend the research to other censoring schemes, for example, progressive type-I interval censoring, hybrid type II censoring. We can also extend the lifetime distribution to other kinds, for example, exponentiated Frech’et, exponentiated Weibull, exponentiated extreme value.

Author Contributions

Conceptualization, S.-F.W.; methodology, S.-F.W.; software, S.-F.W. and W.-T.C.; validation, S.-F.W. and W.-T.C.; formal analysis, S.-F.W.; investigation, S.-F.W. and W.-T.C.; resources, S.-F.W.; data curation, W.-T.C.; writing—original draft preparation, S.-F.W. and W.-T.C.; writing—review and editing, S.-F.W.; visualization, W.-T.C.; supervision, S.-F.W.; project administration, S.-F.W.; funding acquisition, S.-F.W. All authors have read and agreed to the published version of the manuscript.

Funding

This research was funded by (Ministry of Science and Technology, Taiwan) MOST 108-2118-M-032-001 and MOST 109-2118-M-032-001-MY2 and the APC was funded by MOST 109-2118-M-032-001-MY2.

Institutional Review Board Statement

Not applicable.

Informed Consent Statement

Not applicable.

Data Availability Statement

Data available in a publicly accessible repository. The data presented in this study are openly available in Xia and Lai [21].

Conflicts of Interest

The authors declare no conflict of interest.

Appendix A

Proof to show that C ˜ L is the UMVUE for C L :
From Equation (2), we have V = 2 k i = 1 m ( 1 + R i ) Y i ~ χ 2 2 m . Let W = i = 1 m ( 1 + R i ) Y i . The pdf of W is given by f W ( w ) = k m w m 1 e k w Γ ( m ) , w > 0 . By the factorization theorem, we write f W ( w ) = g ( w , k ) h ( w ) , where g ( w , k ) = e k w and h ( w ) = k m w m 1 Γ ( m ) . Then the statistic W is the sufficient statistic for k. The pdf of W implies that the statistic W has a gamma distribution with parameters m and 1/k. Since the gamma distribution is an exponential family, this statistic is a complete statistic from Theorem 6.2.25 of Casella and Berger [20]. From Equation (3), m 1 m k ^ is the unbiased estimator for k and then C ˜ L = 1 m 1 m k ^ L is the unbiased estimator for C L , where k ^ = m W . Using the theorem of Lehmann–Scheffe’ (Lehmann and Scheffe’ [23]), since C ˜ L is a function of the complete and sufficient statistic W, we can claim that C ˜ L is the UMVUE (uniformly minimum variance unbiased estimator) for C L .
Table A1. The lifetime performance index C L and its corresponding conforming rates P r .
C L P r C L P r C L P r
0.000000−0.1250.3246520.5500.637628
−3.0000.0183160.0000.3678790.5750.653770
−2.7500.0235180.1250.4168620.6000.670320
−2.5000.0301970.1500.4274150.6250.687289
−2.2500.0387740.1750.4382350.6500.704688
−2.1250.0439370.2000.4493290.6750.722527
−2.0000.0497870.2250.4607040.7000.740818
−1.7500.0639280.2500.4723670.7250.759572
−1.5000.0820850.2750.4843250.7500.778801
−1.2500.1053990.3000.4965850.7750.798516
−1.1250.1194330.3250.5091560.8000.818731
−1.0000.1353350.3500.5220460.8250.839457
−0.7500.1737740.3750.5352610.8500.860708
−0.5000.2231300.4000.5488120.8750.882497
−0.2500.2865050.4250.5627050.9000.904837
−0.2250.2937580.4500.5769500.9250.927743
−0.2000.3011940.4750.5915550.9500.951229
−0.1750.3088190.5000.6065310.9750.975310
−0.150.3166370.5250.6218851.0001.000000
Table A2. Average confidence level for C L , SMSE (in the first parentheses) and risk (in the second parentheses) under LU = 0.1 and 1 α = 0.95.
(a,b) = (2,2)(a,b) = (2,5)(a,b) = (5,2)
nm ( R 1 , , R m ) UMVUEBayesUMVUEBayesUMVUEBayes
2010 ( 5 , 4 , 1 , 0 × 7 ) 0.950460.950490.950620.950390.950250.95018
(0.000459)(0.000454)(0.000485)(0.000466)(0.000439)(0.00046)
(0.032338)(0.020448)(0.206719)(0.129118)(0.166737)(0.082863)
( 0 × 3 , 2 , 3 , 3 , 2 , 0 × 3 ) 0.949540.949650.949270.949900.948710.94895
(0.000458)(0.000475)(0.000478)(0.000491)(0.000493)(0.000496)
(0.033270)(0.020028)(0.202740)(0.126668)(0.172086)(0.083376)
( 0 × 7 , 1 , 4 , 5 ) 0.949970.949440.949620.948820.950020.94905
(0.000479)(0.000513)(0.000476)(0.000490)(0.000458)(0.000464)
(0.033348)(0.020464)(0.210638)(0.129526)(0.167786)(0.083427)
15 ( 4 , 1 , 0 × 13 ) 0.949890.950600.950110.949880.949560.94983
(0.000435)(0.000442)(0.000435)(0.000452)(0.000471)(0.000501)
(0.019462)(0.014550)(0.128238)(0.092888)(0.101481)(0.063165)
( 0 × 6 , 1 , 3 , 1 , 0 × 6 ) 0.950470.950790.950050.950180.948500.94915
(0.000481)(0.000465)(0.000473)(0.000457)(0.000510)(0.000511)
(0.020197)(0.014692)(0.127588)(0.091372)(0.103466)(0.063199)
( 0 × 13 , 1 , 4 ) 0.949740.950310.950070.949710.949260.94936
(0.000439)(0.000463)(0.000509)(0.000516)(0.000488)(0.000507)
(0.020154)(0.014541)(0.130222)(0.093632)(0.100478)(0.062896)
3015 ( 7 , 5 , 3 , 0 × 12 ) 0.950630.950280.950070.950100.951380.94991
(0.000501)(0.000488)(0.000488)(0.000531)(0.000468)(0.000457)
(0.020698)(0.014852)(0.125239)(0.092391)(0.103473)(0.063256)
( 0 × 6 , 4 , 7 , 4 , 0 × 6 ) 0.949240.949980.951290.950870.949430.94928
(0.000467)(0.000472)(0.000447)(0.000459)(0.000475)(0.000488)
(0.020231)(0.014722)(0.128099)(0.092867)(0.102906)(0.063306)
( 0 × 12 , 3 , 5 , 7 ) 0.949850.950030.950740.949970.950840.95019
(0.000464)(0.000454)(0.000475)(0.000464)(0.000483)(0.000480)
(0.020609)(0.014676)(0.126370)(0.093766)(0.103612)(0.063977)
20 ( 5 , 4 , 1 , 0 × 17 ) 0.949530.949690.950320.950630.949560.95000
(0.000484)(0.000483)(0.000474)(0.000454)(0.000472)(0.000475)
(0.014779)(0.011676)(0.089691)(0.071110)(0.074365)(0.051170)
( 0 × 8 , 2 , 3 , 3 , 2 , 0 × 8 ) 0.950190.949910.950130.949410.949260.94932
(0.000491)(0.000517)(0.000050)(0.000502)(0.000434)(0.000481)
(0.014722)(0.011651)(0.093602)(0.072828)(0.074644)(0.051560)
( 0 × 17 , 1 , 4 , 5 ) 0.948850.949270.950230.950080.950310.95006
(0.000503)(0.000523)(0.000484)(0.000491)(0.000457)(0.000451)
(0.014757)(0.011515)(0.090619)(0.072060)(0.073405)(0.051221)
10020 ( 60 , 20 , 0 × 18 ) 0.949840.949660.949890.949500.950150.95040
(0.000491)(0.000487)(0.000508)(0.000506)(0.000492)(0.000499)
(0.014944)(0.011491)(0.093359)(0.072604)(0.073616)(0.051114)
( 0 × 8 , 20 , 20 , 20 , 20 , 0 × 8 ) 0.948950.948830.949850.950420.949940.94926
(0.000449)(0.000475)(0.000466)(0.000489)(0.000465)(0.000471)
(0.014812)(0.011674)(0.08942)(0.071394)(0.074201)(0.051082)
( 0 × 18 , 20 , 60 ) 0.950570.950050.950100.949350.950480.94950
(0.000458)(0.000463)(0.000439)(0.000444)(0.000446)(0.000485)
(0.014641)(0.011405)(0.093107)(0.071695)(0.073540)(0.051245)
Note: The censoring scheme ( R 1 , , R m ) = ( 5 , 4 , 1 , 0 × 7 ) represents ( R 1 , , R m ) = ( 5 , 4 , 1 , 0 , 0 , 0 , 0 , 0 , 0 , 0 ) .

References

  1. Montgomery, D.C. Introduction to Statistical Quality Control; John Wiley and Sons: New York, NY, USA, 1985. [Google Scholar]
  2. Tong, L.I.; Chen, K.S.; Chen, H.T. Statistical testing for assessing the performance of lifetime index of electronic components with exponential distribution. Int. J. Qual. Reliab. Manag. 2002, 19, 812–824. [Google Scholar] [CrossRef]
  3. Balakrishnan, N.; Cramer, E. The Art of Progressive Censoring. Applications to Reliability and Quality; Birkhäuser: Basel, Switzerland, 2014. [Google Scholar]
  4. Aggarwala, R. Progressive interval censoring: Some mathematical results with applications to inference. Commun. Stat. Theory Methods 2001, 30, 1921–1935. [Google Scholar] [CrossRef]
  5. Wu, S.F. Interval estimation for the two-parameter exponential distribution under progressive censoring. Qual. Quant. 2010, 44, 181–189. [Google Scholar] [CrossRef]
  6. Wu, S.F.; Wu, C.C.; Lin, H.M. The Exact Hypothesis Test for the Shape Parameter of a New Two-Parameter Distribution with the Bathtub Shape or Increasing Failure Rate function under Progressive Censoring with Random Removals. J. Stat. Comput. Simul. 2009, 79, 1015–1042. [Google Scholar] [CrossRef]
  7. Wu, S.F. The performance assessment on the lifetime performance index of products following Chen lifetime distribution based on the progressive type I interval censored sample. J. Comput. Appl. Math. 2018, 334, 27–38. [Google Scholar] [CrossRef]
  8. Wu, S.F.; Chang, W.T. The evaluation on the process capability index CL for exponentiated Frech’et lifetime product under progressive type I interval censoring. Symmetry 2021, 13, 1032. [Google Scholar] [CrossRef]
  9. Wu, S.F.; Hsieh, Y.T. The assessment on the lifetime performance index of products with Gompertz distribution based on the progressive type I interval censored sample. J. Comput. Appl. Math. 2019, 351, 66–76. [Google Scholar] [CrossRef]
  10. Laumen, B.; Cramer, E. Inference for the lifetime performance index with progressively Type-II censored samples from gamma distributions. Econ. Qual. Control 2015, 30, 59–73. [Google Scholar] [CrossRef]
  11. Lee, W.C.; Wu, J.W.; Hong, C.W. Assessing the lifetime performance index of products with the exponential distribution under progressively type II right censored samples. J. Comput. Appl. Math. 2009, 231, 648–656. [Google Scholar] [CrossRef] [Green Version]
  12. Wu, J.W.; Lee, W.C.; Lin, L.S.; Hong, M.L. Bayesian test of lifetime performance index for exponential products based on the progressively type II right censored sample. J. Quant. Manag. 2011, 8, 57–77. [Google Scholar]
  13. Lee, W.C.; Wu, J.W.; Hong, C.W. Assessing the lifetime performance index of products from progressively type II right censored data using Burr XII model. Math. Comput. Simul. 2009, 79, 2167–2179. [Google Scholar] [CrossRef]
  14. Wu, J.W.; Lee, W.C.; Hong, C.W.; Yeh, S.Y. Implementing Lifetime Performance Index of Burr XII Products with Progressively Type II Right Censored Sample. Int. J. Innov. Comput. Inf. Control 2014, 10, 671–693. [Google Scholar]
  15. Lee, W.C. Assessing the lifetime performance index of Rayleigh products based on the bayesian estimation under progressive type II right censored samples. J. Comput. Appl. Math. 2011, 235, 1676–1688. [Google Scholar] [CrossRef]
  16. Chen, Z. A new two-parameter lifetime distribution with bathtub shape or increasing failure rate function. Stat. Probab. Lett. 2000, 49, 155–161. [Google Scholar] [CrossRef]
  17. Domma, F.; Condino, F. A new class of distribution functions for lifetime data. Reliab. Eng. Syst. Saf. 2014, 129, 36–45. [Google Scholar] [CrossRef]
  18. Balakrishnan, N.; Aggarwala, R. Progressive Censoring: Theory, Methods and Applications; Birkhauser: Boston, MA, USA, 2000. [Google Scholar]
  19. Waller, R.A.; Johnson, M.M.; Waterman, M.S.; Martz, H.F. Gamma prior distribution selection for Bayesian analysis of failure rate and reliability. In Nuclear Systems Reliability Engineering and Risk Assessment; Fussell, J.B., Burdick, G.R., Eds.; SIAM: Philadelphia, PA, USA, 1977; pp. 584–606. [Google Scholar]
  20. Casella, G.; Berger, R.L. Statistical Inference, 2nd ed.; Duxbury Press: Pacific Grove, CA, USA, 2002. [Google Scholar]
  21. Xie, M.; Lai, C.D. Reliability analysis using an additive Weibull model with bathtub-shaped failure rate function. Reliab. Eng. Syst. Saf. 1995, 52, 87–93. [Google Scholar] [CrossRef]
  22. Gill, M.H.; Gastwirth, J.L. A scale-free goodness-of-fit Test for the Exponential Distribution Based on the Gini Statistic. J. R. Stat. Soc. 1978, 40, 350–357. [Google Scholar] [CrossRef]
  23. Lehmann, E.L.; Scheffe, H. Completeness, Similar Regions and Unbiased Estimates. Sankhya 1950, 10, 305–340. [Google Scholar]
Figure 1. (a) Failure rate function under k = 1, (b) Failure rate function under k = 2.
Symmetry 13 01322 g001
Figure 2. Plot of p-value vs. the value of β .
Symmetry 13 01322 g002
Figure 3. Ecdf-plot with the transformed data in the example and the black dotted line is the cdf from the exponential distribution.
Symmetry 13 01322 g003
Publisher’s Note: MDPI stays neutral with regard to jurisdictional claims in published maps and institutional affiliations.

