Article

Self-Similarity of Continuous-Spectrum Radiative Transfer in Plasmas with Highly Reflecting Walls

by
Alexander B. Kukushkin
1,2,3,* and
Pavel V. Minashin
1
1
National Research Center “Kurchatov Institute”, 123182 Moscow, Russia
2
National Research Nuclear University MEPhI (Moscow Engineering Physics Institute), 115409 Moscow, Russia
3
Moscow Institute of Physics and Technology, National Research University, 141700 Dolgoprudny, Russia
*
Author to whom correspondence should be addressed.
Symmetry 2021, 13(7), 1303; https://doi.org/10.3390/sym13071303
Submission received: 20 May 2021 / Revised: 3 July 2021 / Accepted: 7 July 2021 / Published: 20 July 2021
(This article belongs to the Special Issue New Trends in Plasma Physics)

Abstract

:
Radiative Transfer (RT) in a continuous spectrum in plasmas is caused by the emission and absorption of electromagnetic waves (EM) by free electrons. For a wide class of problems, the deviation of the velocity distribution function (VDF) of free electrons from the thermodynamic equilibrium, the Maxwellian VDF, can be neglected. In this case, RT in the geometric optics approximation is reduced to a single transport equation for the intensity of EM waves with source and sink functions dependent on the macroscopic parameters of the plasma (temperature and density of electrons). Integration of this equation for RT of radio-frequency EM waves in laboratory plasmas with highly reflecting metallic walls is substantially complicated by the multiple reflections which make the waves with the long free path the dominant contributors to the power balance profile. This in turn makes the RT substantially nonlocal with the spatial–spectral profile of the power balance determined by the spatial integrals of the plasma parameters. The geometric symmetry of the bounding walls, especially when enhanced by the diffuse reflectivity, provides a semi-analytic description of the RT problem. Analysis of the accuracy of such an approach reveals an approximate self-similarity of the power balance profile and the radiation intensity spectrum in both approximate and ab initio modeling. This phenomenon is shown here for a wide range of plasma parameters and wall reflectivity, including data from various numeric codes. The relationship between the revealed self-similarity and the accuracy of numeric codes is discussed.

1. Introduction

Self-similarity phenomena in the theory of the radiative transfer in plasmas play an important role in identifying the main scalings and elaborating on the approaches to solving the problems of time-consuming numerical modeling. An example of such self-similarity is presented in [1], where it is shown that the Green’s function of the non-stationary radiative transfer (RT) in the spectral lines of atoms and ions in plasma and gases has an approximate self-similarity in a wide range of RT problems. In the case of electromagnetic radiation in spectral lines, the radiation is emitted and absorbed by bound electrons in atoms and ions. Another type of RT is associated with radiation emission and absorption by free electrons in plasmas. In this case, RT takes place in the continuous spectrum of electromagnetic waves. The difference in the kinetics of free and bound electrons leads to a very different description of RT.
Here we consider the self-similarity of the power balance profile and the intensity of escaping radiation for continuous-spectrum radiative transfer in plasmas with highly reflecting walls. The motivation of this research is based on the need for massive predictive modeling of the electron cyclotron radiation (ECR) transport in experimental facilities for magnetic confinement of hot plasmas in a wide range of plasma temperatures, including temperatures in a future thermonuclear fusion reactor such as the ITER tokamak [2] (under construction) and various next-step projects called DEMO (see, e.g., [3]).
The crucial importance of the ECR power loss in magnetic thermonuclear fusion was realized at an early stage of research. The first estimates of the power loss in two alternative limits, namely volumetric losses (which corresponds to neglecting the absorption of emitted radiation) and surface losses (thermodynamic-equilibrium, black-body intensity of the outgoing radiation due to imprisonment of radiation at high values of the optical thickness of the plasma), showed the impossibility of fulfilling the criteria for thermonuclear ignition in a hot homogeneous plasma in a laboratory. However, the actual ECR power loss appeared to be much less than the above limits. An accurate analysis of the problem required the development of a complex theory of ECR transport [4,5,6,7,8,9] (due to the strong angular and frequency dependence of the emission and absorption functions on the plasma temperature [4,9]). In particular, it was shown that for the expected parameters of a magnetic thermonuclear fusion reactor (e.g., torus major radius R0 = 6 m, minor radius a = 2 m, elongation kelong = 1.0, magnetic field on torus axis B0 = 5 T, volume-average electron temperature <Te>V = 20 keV and density <ne>V = 1020 m−3, see Figure 1), only a small fraction (~ 0.01   1 R w , Rw is the wall reflection coefficient) of the emitted ECR power escapes from the plasma volume [5,8] (see, e.g., Figure 6 in [5] and Figures 4 and 5 in [8] for the “transparency factor” that quantifies the aforementioned fraction). In present-day magnetic confinement facilities, the internal ECR (i.e., not an external one, which is injected into the plasma for its auxiliary EC resonance heating (ECRH) and/or EC current drive (ECCD)) plays an important role only for diagnostics of the electron temperature, and not for spatially local and total power balance.
For the next generation of tokamaks like ITER and DEMO, because of expected high temperatures in the central plasma and strong magnetic field, the ECR power loss will play an important role in the balance of electron energy (see [10,11,12] for ITER and [3] for DEMO), and will also be a source of thermal and electromagnetic loads on in-chamber components and diagnostic tools [13]. Modelling of quasi-steady state regimes of operation predicts a significant contribution of ECR power loss to the local balance of electron power in ITER [11,12,14] and DEMO [3]. The ECR power loss can also limit the temperature excursions of the thermonuclear fusion power in ITER and DEMO for a central electron temperature Te(0) > 30 keV [15]. The foregoing required the development of numerical codes for more accurate calculations of the ECR transport (especially in the central plasma).
The geometric symmetry of the bounding walls, namely the toroidal symmetry of the vacuum chamber, with a sufficiently high reflectivity, made it possible to create a simple fast-routine method [16], which provides the calculation of the spatial profile of the ECR power balance with a sufficiently high accuracy. The idea of this approach, implemented in the CYTRAN code [16], is based on the analysis of the results of three-dimensional (3D) Monte Carlo modeling of ECR transport using the SNECTR code [17]. Further modification of the method [16] in [18,19,20,21], the benchmarking [22] of all existing codes for ECR transport in tokamak-reactors (including SNECTR, CYTRAN, CYNEQ [10,18], and EXACTEC [23] codes) and additional comparison of codes in [12,24] (including comparison with the latest code, RAYTEC [25]) clarified the status of fast-routine approaches for use in mass predictive modeling of tokamak-reactor operation. The problem of self-similarity of the spatial profile of the ECR power balance, which we analyze, is the next step in benchmarking of codes.

2. Materials and Methods

2.1. Basic Equations

Electromagnetic (EM) waves in plasmas are described by a system of self-consistent equations, which includes Maxwell’s equations for the classical (non-quantized) electromagnetic field in plasmas and kinetic equations (i.e., statistical equations of motion) for various types of plasma particles.
From Maxwell’s equations, one can obtain the radiation transfer equation in the approximation of the ray trajectory description of wave propagation (the so-called geometric optics approximation) [26,27,28]:
( 1 v g t + n r ) J ( ϕ , r , t ) N r 2 = q ( ϕ , r , t ) N r 2 κ ( ϕ , r , t ) J ( ϕ , r , t ) N r 2 ,
where ϕ = { ω , n , ξ } are the parameters of the EM wave: ω —frequency, n = k / k —unit vector of propagation direction, k —wave vector, ξ —the type of the wave (i.e., polarization of the wave); J ( ϕ , r , t ) —radiation intensity (i.e., energy flux density, differential with respect to all parameters of the EM wave); q ( ϕ , r , t ) —the power density of the spontaneously emitted EM waves (usually called the source function or emissivity); κ ( ϕ , r , t ) is the coefficient of absorption of the wave by the medium (the reciprocal of the free path for the given wave parameters), in the calculation of which the stimulated emission is also taken into account; N r —ray refractive index, and v g —group velocity of EM waves. The absorption coefficient, κ , and emissivity, q , contain averaging over the electron velocity distribution function; therefore, in cases where radiation can distort the electron distribution function, the functions κ and q implicitly depend on the radiation intensity, J .
Here, the stationary case will be considered for the ECR transport equation, since the characteristic time for the establishment of the stationary intensity is much shorter than the time during which the macroscopic parameters of the medium (temperature, electron density, and external magnetic field) change.
If the influence of radiation on the velocity distribution function of emitting electrons can be neglected (i.e., assuming that the velocity distribution function is “frozen”), Equation (1) becomes closed. It can be solved by integrating along the path of the rays of the EC waves in the plasma, taking into account the absorption of ECR by the medium:
J ( ϕ , s ) = J 0 ( ϕ , s ) exp ( s 0 s κ ( ϕ , s ) d s ) + s 0 s q ( ϕ , s ) N r 2 [ exp ( s s κ ( ϕ , s ) d s ) ] d s ,
where the integrals are taken along the ray connecting the points with coordinates s0 and s along this ray.
In a tokamak, which is a toroidal axisymmetric system with nested magnetic flux surfaces, one has to solve (2) with account of multiple reflections of the EC radiation from the metallic wall of the vacuum chamber. The geometry of a plasma in the state of force equilibrium may be described in the 3-moment approximation [29]:
{ R ( ρ , θ ) = R 0 + Δ ( ρ ) + a metr ( ρ )   ( cos θ δ ( ρ ) sin 2 θ ) ,   Z ( ρ , θ ) = a metr ( ρ )   λ ( ρ )   sin ( θ )   .
where R 0 is the major radius of torus, a m e t r is the half width of the magnetic surface in the equatorial plane of the torus, Δ(ρ) is the Shafranov shift, λ ( ρ ) , and δ ( ρ ) are the vertical elongation and triangularity of the magnetic surface (see Figure 1). These momenta and the two-dimensional magnetic field are taken from the plasma equilibrium, calculated self-consistently in the 1.5D transport simulations (2D plasma equilibrium and 1D transport) carried out using the ASTRA suite of codes [30,31] for solving the system of equations for the force equilibrium of the plasma and the heat and particle transport. An example of the topology of magnetic flux surfaces is shown in Figure 1 for the case of a quasi-steady-state ITER-like scenario which is close to the ITER operation scenario considered in [32].
We will analyze the local power loss density, PEC(ρ), calculated from the balance of absorption and emission of ECR, averaged over magnetic surface:
P EC ( ρ ) = ξ     d ω d Ω n     [ q ξ ( ρ ,   θ , ω , n   ) κ ξ ( ρ , θ ,   ω , n )   J ( ω , n , ξ , ρ , θ ) ] ms ,
For the plasma in local thermodynamic equilibrium (Maxwellian velocity distribution of electrons in plasma), according to Kirchhoff’s law for the relationship between the absorption coefficient and emissivity, Equation (4) becomes:
P EC ( ρ ) = ξ     d ω d Ω n   κ ξ ( ρ , θ ,   ω , n )     [ J B B ( ω , n , ξ , ρ )   J ( ω , n , ξ , ρ , θ ) ] ms ,
J B B ( ω , n , ξ , ρ ) = ω 2   T e ( ρ ) 8 π 3 c 2 ,
where JBB is blackbody intensity and c is the speed of light in vacuum.
The averaging over magnetic surface is expressed as follows:
F ( ρ ) < F ( ρ , θ ) > ms = [ 0 2 π F ( ρ , θ )   g ( ρ , θ ) d θ ]   [ 0 2 π g ( ρ , θ ) d θ ] 1
where g(ρ,θ) is the plasma volume inside the surfaces [ρ ÷ ρ + dρ, θ ÷ θ + dθ], so that the volume averaging is determined by the formula:
< F > V = 0 1 0 2 π F ( ρ ,   θ )   g ( ρ , θ ) d ρ d θ   V tot , V tot = 0 1 0 2 π g ( ρ , θ ) d ρ d θ ,
where Vtot is the total volume of toroidal plasma.
Total (i.e., volume-integrated) EC power loss is calculated as follows:
P E C t o t = 0 1 P E C ( ρ )   d V d ρ   d ρ
d V d ρ   = 0 2 π g ( ρ , θ ) d θ
The local magnetic field in the plasma, expressed in terms of toroidal and poloidal components, B2 = Btor2 + Bpol2, can be derived from the plasma equilibrium or taken constant:
  • 2D approximation: magnetic field, B(ρ,θ), is a function of the normalized toroidal magnetic flux within magnetic surface, ρ, and of the poloidal angle, θ:
    B = B ( ρ , θ ) ,
  • 1D approximation: one-dimensional profile, B(ρ), is derived by averaging the field B(ρ,θ) over magnetic surface:
    B = B ( ρ ) ,
  • 0D approximation: homogeneous profile, B = const, may be taken as Btor(R0) ≡ B0, where B0 is the vacuum toroidal magnetic field at R0 = (Rmax + Rmin)/2, or as the volume-averaged total magnetic field, <B>v:
    B = B 0 = const .
The profile of magnetic field distribution over magnetic flux surfaces, which is obtained from the 2D distribution B(ρ,θ) by averaging over each magnetic surface, appears to be rather flat, as it weakly depends on ρ. The latter justifies the use of the 0D approximation for the magnetic field in some cases (see below). For the 1D profiles of electron density and temperature in the case close to the ITER operation scenario [32], the 1D profile of the magnetic field is shown in Figure 2.
Figure 1 shows that the spatial profile of magnetic field is strongly inhomogeneous so that the transport of the ECR, which is characterized by strong spectral and angular dependences of the absorption coefficient κ and the source function q (see, e.g., Equations (3.11), (3.4), and (3.13) in [4] and (3.1.73)–(3.1.78) in [9]), can strongly depend on the 2D distribution of the magnetic field strength B, and only direct 3D modeling of ray trajectories with account of multiple reflections from the wall can adequately describe the problem. It turns out, however, that the symmetry of the highly reflecting wall of the vacuum chamber substantially influences the angular and spatial distribution of the radiation intensity.

2.2. Various Approaches to Solution of ECR Transport Problem in Toroidal Plasmas with Highly Reflecting Walls and Their Comparison

The first numerical simulation of the ECR transport in toroidal plasma, which is confined by a magnetic field in a vacuum chamber with highly reflecting walls, was carried out using the SNECTR code [17], which provides Monte Carlo simulations of EC wave ray trajectories under the following conditions:
  • hot Maxwellian plasma with a volume-averaged electron temperature of 〈TeV ≥ 10 keV;
  • toroidal plasma with a noncircular cross section and moderate aspect ratio (i.e., ratio of tokamak major R0 to minor radius, a, see Figure 1) A ~ 3;
  • multiple reflections of radiation from the wall of vacuum chamber.
Under the conditions indicated above, the contribution of ECR at low-number harmonics of the EC fundamental frequency (n = 1 and n = 2) can be neglected, and the effect of plasma on the EC ray trajectories can also be neglected (i.e., Nr = 1 in (1)). Also, the calculations using the SNECTR code were carried out in the 0D approximation (13) for the magnetic field (cf. Figure 2).
This approach made it possible to extend the previous results [5,6,8,9] for ECR transport in hot homogeneous plasmas to the case of strongly inhomogeneous plasmas in a facility with highly reflective walls. It was found that under these conditions the spatial profile of the power balance, PEC(ρ), defined in (4), changes the sign in the region of the cold peripheral plasma: here, the plasma turns out to be an effective absorber of the radiation emitted in the hot central plasma, so that the net power balance at the periphery is negative. Analysis [16] of the results from SNECTR code has shown that in the range of radiation frequency, which is responsible for the main contribution to PEC(ρ), radiation intensity is almost isotropic in angles of the wave vector and almost homogeneous in ρ.
The assumption of angular isotropy of the radiation intensity and the use of the 0D approximation for the magnetic field greatly simplifies the ECR transport problem: under this assumption the profile of the EC power loss can be described by a 1D function that depends only on the coordinate of the magnetic flux surface in toroidal plasma.
In the CYTRAN code [16], the ECR transport depends only on the angle-averaged values of the absorption coefficient, κ ( r , Φ ) , and the emissivity, q ( r , Φ ) :
κ   ξ ( r ,   ω ) d Ω n 4 π   κ ( r , Φ ) , q ξ ( r ,   ω ) d Ω n 4 π   q ( r , Φ ) ,
CYTRAN uses approximate formulae for functions (14), that have satisfactory accuracy only for high temperatures, Te ≥ 10 keV.
The next simplification of the RT problem in the CYTRAN code is related to the division of the plasma into an optically-thick inner region and an optically-thin outer region. The thick–thin interface is defined in terms of a critical optical thickness, τ, along the radial coordinate. The choice of τ value of the order of unity was justified by the best agreement with the results of the SNECTR code simulations. In the semi-analytic approach of CYTRAN, the density of the ECR power loss, PEC(ρ), is determined by the following power balance. The power escaping from the inner region is equal to the black body losses from the surface of the inner region with the temperature at the interface between the inner and outer regions, divided by the total volume of the inner plasma. The power balance in the outer region is determined by the emissivity and absorption, both integrated over the volume of the outer region, and by the power outgoing into the inner region and exiting through the wall, with account of the reflection from the wall. This model has proven to be very successful in describing the results for PEC(ρ) from 3D modeling using SNECTR. However, in CYTRAN, the PEC(0) value diverges, and it was necessary to correct the formalism in the central plasma.
The modification of the method [16] was made in [18,19,20,21] and implemented in the CYNEQ code. In [18,19], the model of CYTRAN code for the inner region (optically-thick plasma) was corrected with the following simplification: the use of the Escape Probability method developed for the RT in spectral lines of atoms and ions (see References [13,17,18] in [1]) to the case of RT by free electrons suggested an approximation, which gives PEC(ρ,ω) = 0 in the inner optically-thick region. This approach eliminated the divergence of PEC(ρ) at ρ = 0 and gave the results for PEC(ρ) which are in good agreement with the results of the SNECTR code. In addition, absorption coefficient (14) in the CYNEQ code is calculated by numerical averaging the Schott–Trubnikov emissivity of a single electron [4,26] over an arbitrary electron velocity distribution. Comparison of different approaches to calculating (14) is carried out, for example, in the benchmarking [22] of the codes (see Figure 4 and Equation (5) in [22]).
Further progress was made in [20]: the description of magnetic field was extended to the case of 1D and 2D approximations. In the 2D geometry, absorption and emission coefficients can be expressed as functions of normalized radius, ρ, poloidal angle, θ, and normalized frequency, ω ˜ = ω / ω   B 0 ( ω B 0 = e B 0 / m e   c is the fundamental EC frequency, where B0 is the vacuum toroidal magnetic field on tokamak’s toroidal axis, B0 = B(R = R0, Z = 0), cf. Figure 1):
κ ξ ( ρ ,   θ ,   ω ˜ ) = ω pe 2   B 0 c   ω B 0   B ( ρ ,     θ )   χ ξ ( ω ˜   B 0 B ( ρ ,     θ ) , T e ( ρ ) )
q ξ ( ρ ,   θ ,   ω ˜ ) = κ ξ ( ρ ,   θ ,   ω ˜ )   ω ˜ 2   ω   B 0 2   T e ( ρ ) 8   π 3 c 2 .
where ωpe is the plasma frequency and function χξ depends only on the local value of normalized frequency and the local value of the electron temperature. Similar to CYTRAN code, the phase space Γ = { r ,   ω ,   ξ } , where r is the spatial coordinate and ( ω ,   ξ ) are the wave’s parameters, is divided into two parts according to the type of ECR transport: (i) an optically-thin layer of outer plasma (where the transport is nonlocal):
Γ esc = { ( ρ ,   θ ,   ω ,   ξ ) :     ρ 1     d ρ     a   κ ξ ( ρ ,   θ ,   ω ) τ crit 1 }
and (ii) an optically-thick inner part of plasma with dominant diffusive transport. (In general, in a wide range of frequencies, essential for PEC(ρ) formation, the optically-thin zone can cover the entire plasma volume, see Figure 3). Formula (17) defines the boundary between these parts, where the function ρ cut ( ω ,   θ , ξ ) , in contrast with [10,18], depends on the poloidal angle (cf. [33]). The intensity of the EC radiation, escaping from the plasma, is determined by the nonlocal part of the phase space:
J esc ( ω , ξ ) = q ξ ( ρ ,   θ ,   ω ) V e s c d Ω n 4 π ( n , d S w V esc )   ( 1 R w ) + κ ξ ( ρ ,   θ , ω ) V e s c ,
where Vesc is a projection of phase space of Equation (17) to its coordinate part;         V e s c denotes averaging over the volume, defined in (8); Sw is the inner, plasma-facing surface of the vacuum vessel; Rw is the coefficient of reflection of waves from this surface, which generally is a function of the frequency, ω, and the direction of the wave, n. Thus, in Equation (4), intensity can be expressed as follows:
J ( ω , ξ , ρ , θ ) = J esc ( ω , ξ ) η ( ρ ρ cut ( ω ,   θ , ξ ) ) + J BB ( ω , T e ( ρ ) ) η ( ρ cut ( ω ,   θ , ξ ) ρ )
where η is the Heaviside function. To improve the accuracy, the boundary between the intensity (18) and the blackbody intensity can be made smooth using an interpolation (see Equation (10) in [12]). An example of the spectral-spatial distribution of the ECR power loss for the conditions of ITER operation close to [32] is shown in Figure 3.
In the version of the CYTRAN code [21], published in National Transport Code Collaboration (NTCC) project, the algorithm [16] of calculating the power balance in the inner region (optically-thick plasma) is changed by means of normalization which substantially, by an order of magnitude and more, reduces the contribution of the inner region to PEC(ρ). This normalization is consistent with the model [18,19] where, according to the second term in (5) in the case of thermodynamic equilibrium, we have PEC(ρ,ω) = 0 in the region of optically-thick plasma.
The first benchmarking of codes for calculating the PEC(ρ) profile was carried out in [22] with the following codes: CYTRAN [16] with the aforementioned modification [21], CYNEQ [10,18], and EXACTEC [23]. Benchmarking was carried out in a wide range of temperature, Te(ρ), and density, ne(ρ), profiles expected in reactor-grade tokamaks, and for a flat profile of magnetic surface-averaged magnetic field, B(ρ) = const (0D approximation of the magnetic field profile). The results were benchmarked versus predictions of (at that time) the most comprehensive code SNECTR [17,34] (currently not used), based on the Monte Carlo simulations of the EC emission and absorption processes in axisymmetric toroidal plasmas. A comparison of results was made for the cases which differ in the geometry of the plasma and the type of the reflection of the EC waves from the wall of the vacuum vessel. These cases were divided into the following two groups:
(A)
A cylinder with circular cross-section, specular reflection (this case was considered specifically for the EXACTEC code, which is applicable only for this geometry, and SNECTR code, which only applied to plasma with a circular cross-section)
(B)
(i) A circular cylinder with diffuse reflection (this case was covered only by the SNECTR code calculations);
(ii) Any (cylindrical or toroidal) geometry with diffuse reflection or a noncircular toroid with any (specular or diffuse) reflection (all these subcases may only be covered by the CYTRAN and CYNEQ codes).
The above division of cases is determined by the following properties of radiative transfer under conditions of noncircular toroidal geometry or diffuse reflection:
  • approximate spatial homogeneity of the radiation intensity, since the wave trajectories uniformly fill the plasma volume,
  • approximate angular homogeneity of the radiation intensity, it is more isotropic in the angles of the wave vector in comparison with the case of specular reflection in a circular cylinder.
The approximate homogenization and isotropization of the radiation intensity for large enough Rw occurs in a limited range of radiation frequencies (namely, in the range where the wave free path is comparable with, or exceeds, the radius of the plasma column, e.g., minor radius of toroidal plasma), however it is these frequencies that are responsible for dominant contribution to PEC(ρ) (see [10,16,17,18,23]). In case B, which is much closer to experimental conditions, the radiation emitted in the hot plasma core travels longer in a cold periphery, as compared with case A, and therefore it is absorbed there stronger so that the cold periphery appears to be the net absorber of radiation. This picture is very different from case A, where the radiation emitted in the hot plasma core is reflected from the wall back making the absorption in the core higher than in case B.
The benchmarking [22] has shown good agreement of results within tasks A and B.
The further progress in simulations of EC power losses has been achieved in the RAYTEC code [25] via direct integrating along ray paths of EC waves in a toroid, instead of using the analytic solution [8] of radiative transfer problem for a circular cylinder with mirror reflections from the wall, which is used in EXACTEC. The RAYTEC code uses a 2D profile of magnetic field but does not take into account the effects of plasma equilibrium (Shafranov shift). The latter effects may be simulated using the modified CYNEQ code [12,14,20] which uses the 2D geometry of magnetic field B(R, Z), the CYNEQ-B(2D) code. This code can work—with almost the same accuracy as the fast-routine code CYNEQ-B(1D)—as a part of the ASTRA code [31] that can perform self-consistent 1.5D transport simulations (2D force equilibrium and 1D transport).
Benchmarking of ECR transport codes carried out in [22] for the flat profile of the magnetic field averaged over magnetic flux surface, B(ρ) = const, was appended in [12,24] with the results for self-consistent 2D plasma equilibrium and a comparison with the latest code RAYTEC [25]. The conclusion of these benchmarkings was that the modified codes CYNEQ [20] and CYTRAN [21] (in its version participated in the benchmarking [22], see below Section 3.1) are suitable for use in global transport codes (e.g., ASTRA [31]) for self-consistent 1.5D transport simulations of plasma evolution in tokamak-reactors because they provide good approximation and computational efficiency. A comparison of CYNEQ and CYTRAN results with the latest results [35] from RAYTEC simulations of ECR power loss density for DEMO-like high-temperature plasmas in the present paper confirms this conclusion.

2.3. Similarity of Spatial Distributions of Net EC Power Loss and Spectral Distributions of Radiation Intensity

The effect of the universal shape (self-similarity) of the normalized PEC(ρ) profiles for the same shapes of the electron temperature and density profiles and their significantly different volume-averaged values, found in [36] and based on the results of CYNEQ-B(0D) calculations, is formulated as follows:
P E C n o r m ( ρ ) P E C ( ρ ) P E C t o t / V t o t = f ( ρ ,   { T e n o r m ( ρ ) } , { n e n o r m ( ρ ) } , R w ) ,
where P E C t o t is the total (i.e., volume-integrated) EC radiation power loss (9); Vtot is the plasma volume; the brackets {       } stand for a functional dependence; T e n o r m ( ρ ) and n e n o r m ( ρ ) are the normalized profiles of temperature and density:
T e n o r m ( ρ ) = T e ( ρ ) < T e > V ,
n e n o r m ( ρ ) = n e ( ρ ) < n e > V .
The scaling law (20) appears to be valid for the results of calculations of various codes for the EC power loss density [37].
A similar effect has now been found for the spectral distribution of the intensity of the radiation escaping from the plasma (i.e., for the intensity (18)) for a wide class of normalized temperature profiles. To obtain a universal spectral shape of the escaping ECR intensity, we normalize the frequency as follows:
ω ¯ = ω ω m i n ω m a x ( { T e ( ρ ) } , { n e ( ρ ) } , R w ) ,
where ω m i n = 2   ω B 0 , ω m a x is determined by the equation for the total EC power loss, obtained from the intensity spectra: upper limit of integration of the spectral intensity is chosen so that the integral over the frequency range [ ω m i n ,   ω m a x ] coincides up to 1% with the exact integral over frequencies:
ω m i n ω m a x ξ J e s c ( ω , ξ )   d ω = P E C t o t π S wall ( 1 R w )
Using this definition of ω m a x , the formula for the universal shape of the EC intensity will be as follows:
J e s c n o r m ( ω ¯ ) = ξ J e s c ( ω ¯ , ξ ) ξ J e s c ( ω ¯ , ξ )   d ω ¯   = G ( ω ¯ , R w )
Using (24) and (25), we obtain the following relation for the spectral intensity:
J e s c ( ω ¯ ) = ξ J e s c ( ω ¯ , ξ ) = P E C t o t π S wall ( 1 R w )   ω m a x   G ( ω ¯ , R w ) ,
where the function G ( ω ¯ , R w ) does not depend on the normalized temperature and density profiles (cf. (20)) and turns out to be a weak function of Rw.
Here, we illustrate the self-similarity of intensity in the form (25) on the results from the CYNEQ code [20] and extend the analysis of the codes via analyzing the shape of the PEC(ρ) profile for the results mainly from CYNEQ and CYTRAN [21], for temperature and density profiles with the same shape and substantially different volume-averaged values.

3. Results

3.1. Input Parameters for Analysis of Self-Similarity of ECR Transport

We present the results of analyzing the self-similarity in the following range of input parameters:
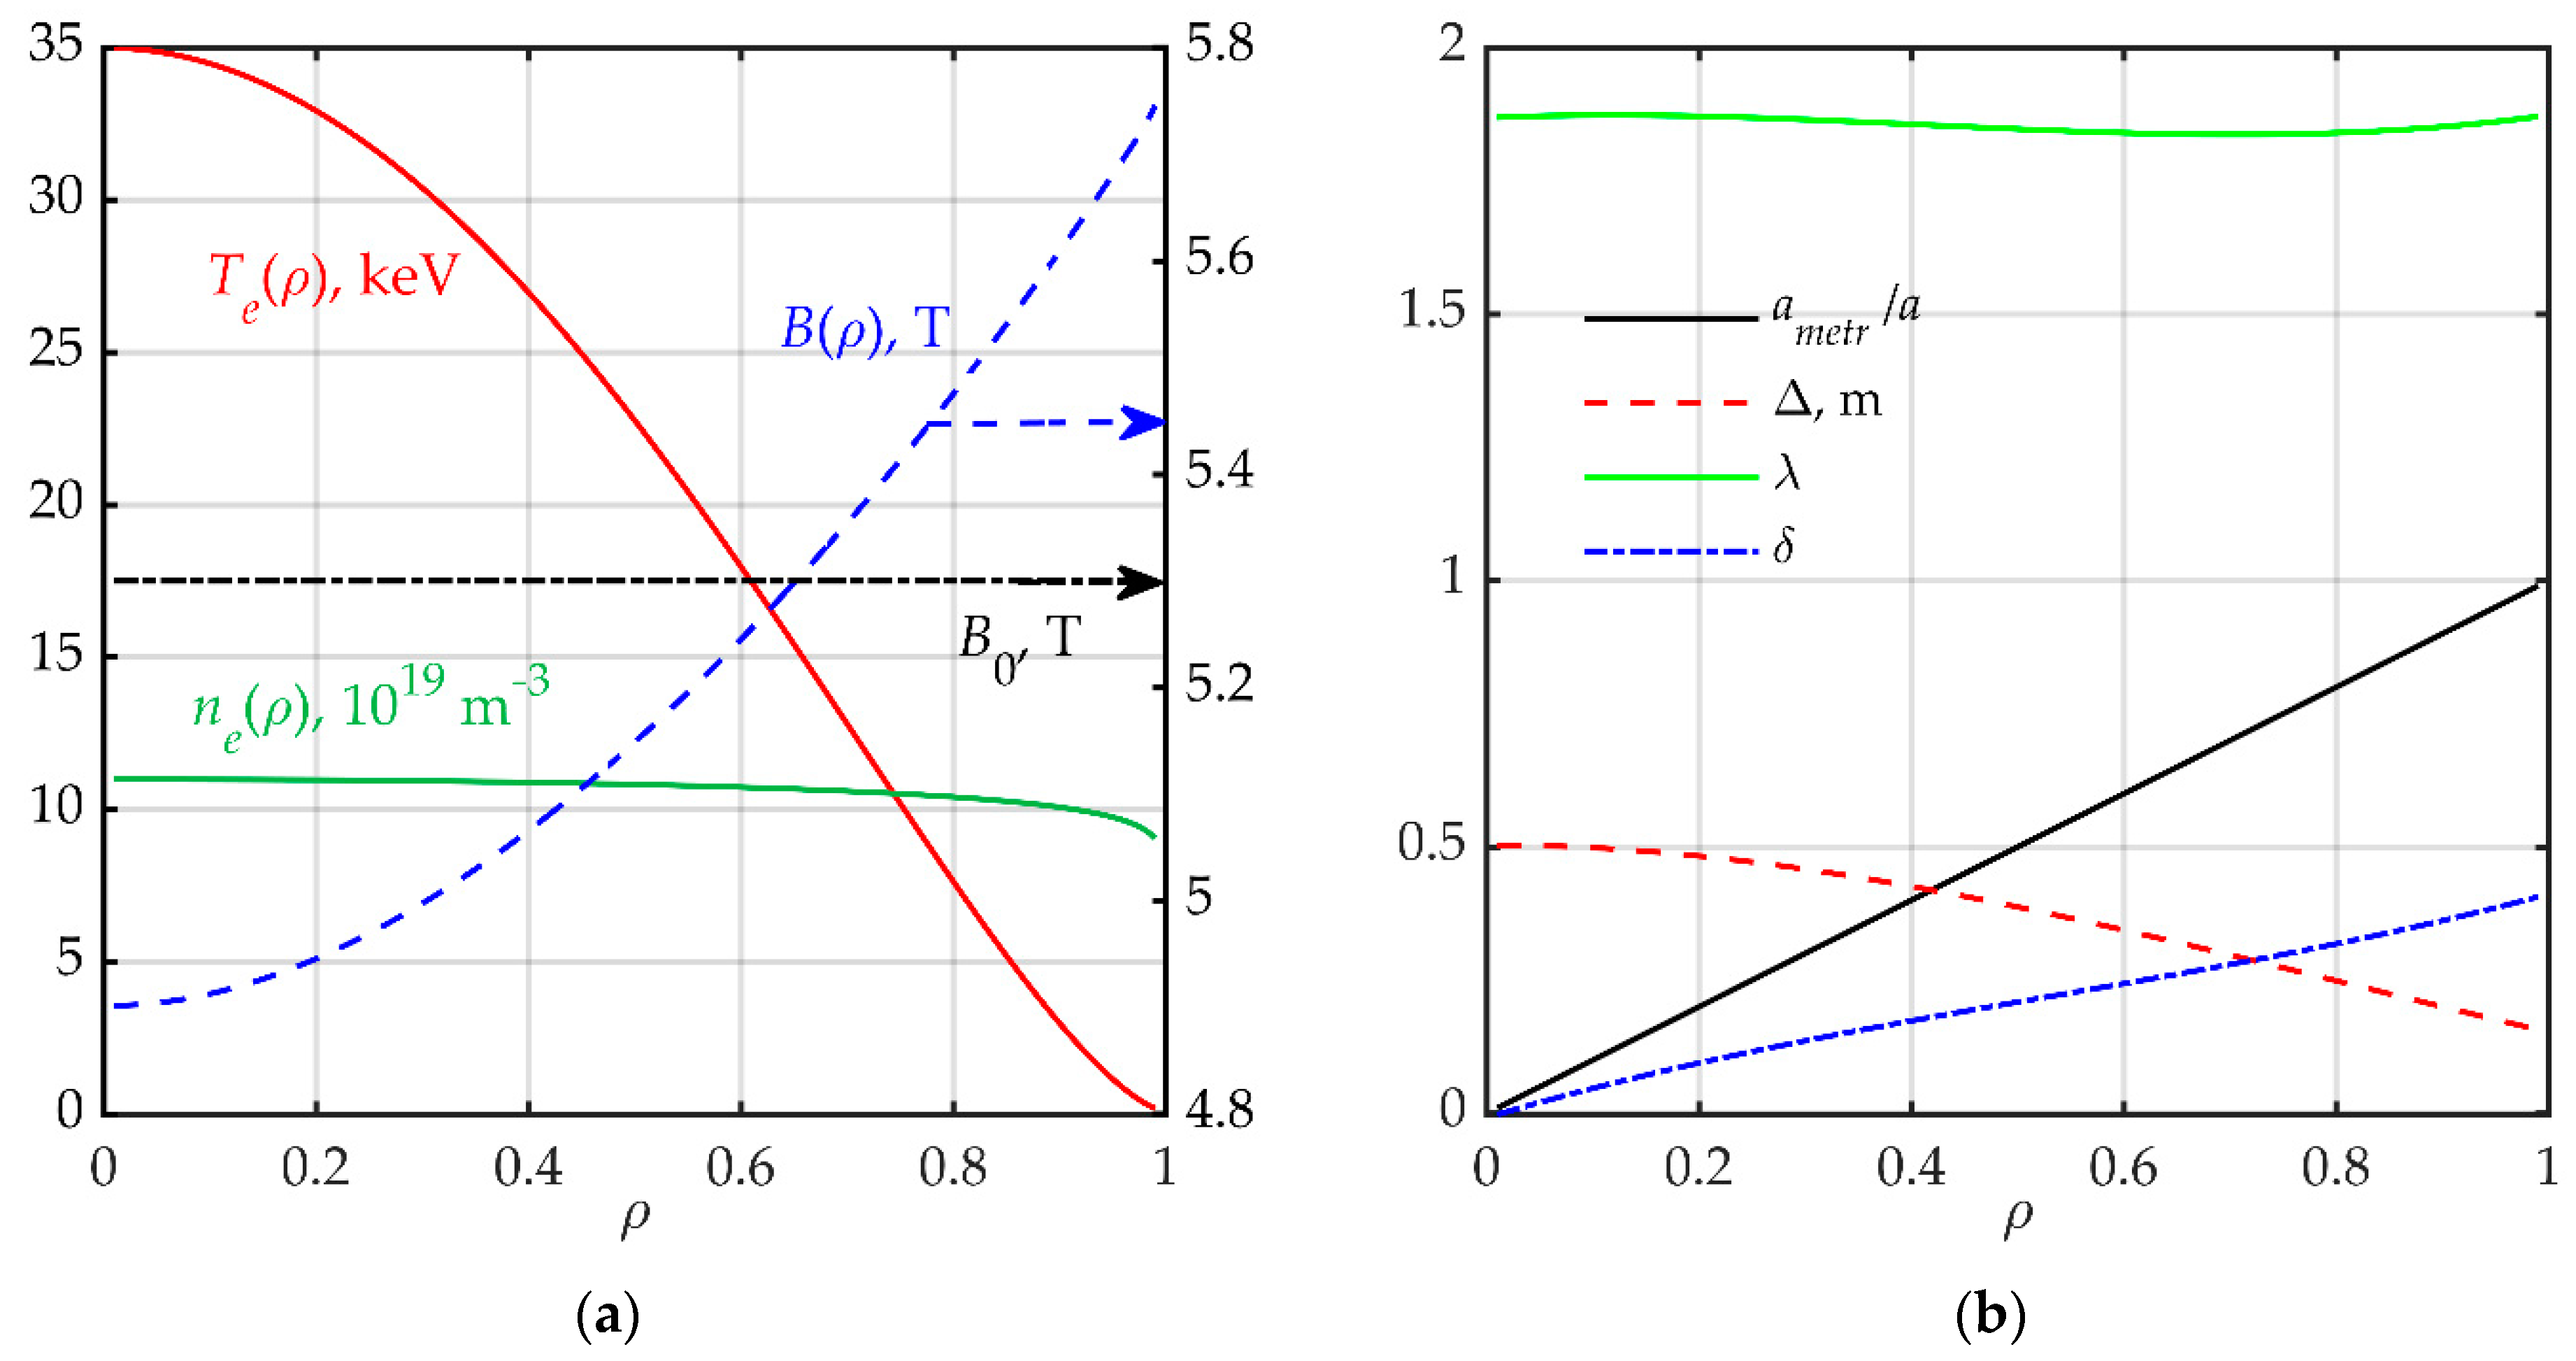
  • ITER-like geometry parameters: torus major radius, R0 = 6.2 m, minor radius, a = 2.0 m, elongation, kelong = 1.9, triangularity, δ = 0.3,
  • three types of the normalized temperature profile and two types of the normalized density profile, defined by the unified formula:
    F ( ρ ) = F 1 + ( F 0 F 1 ) ( 1 ρ β F ) γ F
    where F0 = F(0) and F1 = F(1) are central and edge values, respectively, and coefficients βF and γF determine the type of profile (see Table 1 and Table 2).
  • a wide range of peak values of electron temperature, which includes the following values of the central temperature Te(0) = 20–55 keV (with a step of 5 keV) and fixed value of the edge temperature Te(1) = 100 eV (the respective values of volume-averaged temperature are shown in Figure 4 and Table 1 and Table 2),
  • wide range of reflection coefficient values, from Rw = 0.6 to Rw = 0.9,
  • three types of the profiles of the magnetic field (0D, 1D, and 2D approximations (11)–(13), calculated using the ASTRA code results for plasma equilibrium.
We did not analyze the role of polarization scrambling caused by the depolarization of EC waves in their reflections from the wall. It was shown in [38] that for thermonuclear fusion plasmas, polarization scrambling of internal ECR turns out to only weakly influence the net EC radiative power density and the total EC power loss.
Note that in calculations using the CYTRAN code [21], we used its version participated in the benchmarking [22]: (i) the value of critical optical depth in (17) is taken equal to 1.4, according to its definition in the original version of CYTRAN [16]; (ii) the absorption coefficients are taken in the improved form given in Equation (5) in [22]; (iii) magnetic field is taken in the 0D approximation; and (iv) plasma equilibrium parameters (Shafranov shift, elongation, triangularity, and safety factor on the magnetic axis) are taken from ASTRA simulations.
The self-similarity of the normalized EC power density profiles and of the intensity spectra made it reasonable to introduce the following functions: mean normalized profiles (28) and (29); the relative root-mean-square (rms) deviations (30) and (32) from the profiles (28) and (29), respectively; and the integral characteristics (31) and (33) of the relative rms deviation from the profiles (28) and (29):
P E C m e a n ( ρ ) = 1 k max k = 1 k max P E C n o r m ( ρ , { T e , k ( 0 ) T e n o r m ( ρ ) } ) ,
J e s c m e a n ( ω ¯ ) = 1 k max k = 1 k max J E C n o r m ( ω ¯ , { T e , k ( 0 ) T e n o r m ( ρ ) } ) ,
σ P ( ρ ) = 1 k m a x   k = 1 k m a x ( P E C n o r m ( ρ , { T e , k ( ρ ) } ) P E C m e a n ( ρ ) P E C m e a n ( 0 ) ) 2
σ ¯ P = 1 V t o t 0 1 σ P ( ρ ) d V d ρ d ρ
σ J ( ω ¯ ) = 1 k m a x   k = 1 k m a x ( J e s c n o r m ( ω ¯ , { T e , k ( ρ ) } ) J e s c m e a n ( ω ¯ ) max ( J e s c m e a n ( ω ¯ ) ) ) 2
σ ¯ J = σ J ( ω ¯ ) d ω ¯
where the subscript k denotes the temperature profiles with different central temperatures (see Table 1), which corresponds to kmax = 8.
For the maximum frequency, ω m a x , defined in Equation (24), the following approximate scaling law was found:
ω ˜ m a x = ω m a x ω B 0 = 0.53   T e e f f + 4
T e e f f = 0 1 T e ( ρ ) d ρ
The relation (34) is valid for a wide class of the normalized temperature profiles (Figure 5).

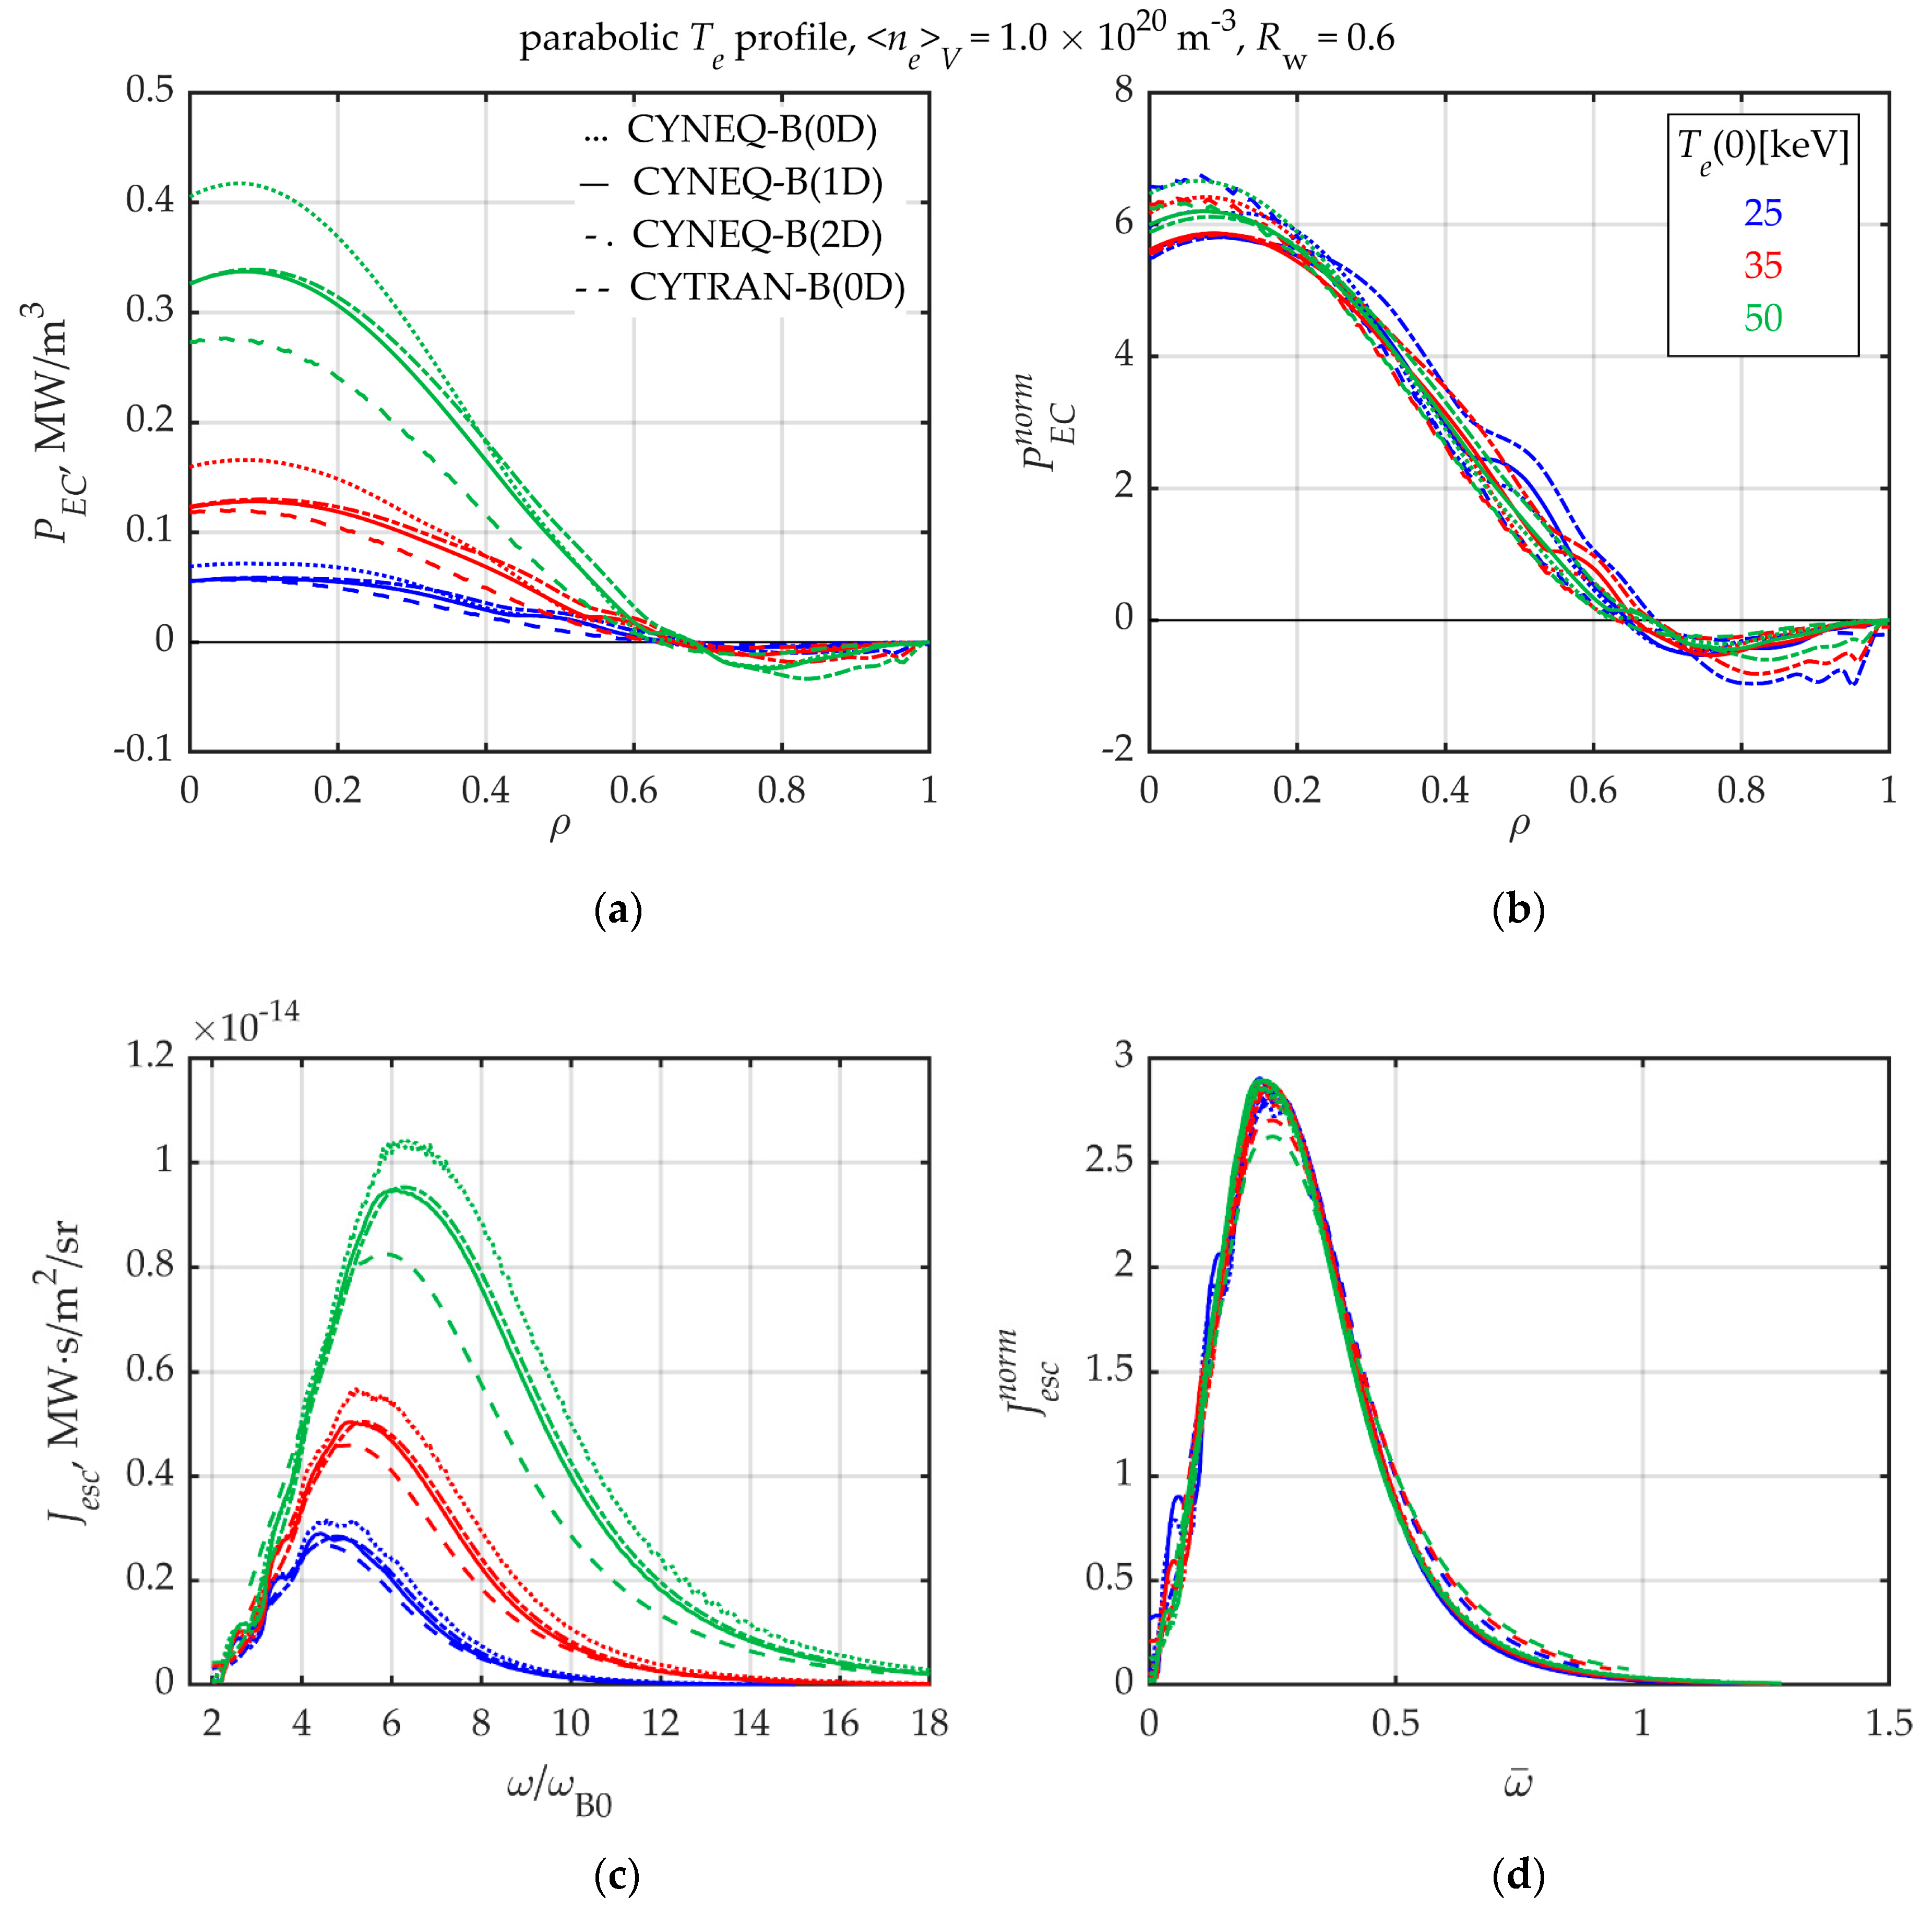
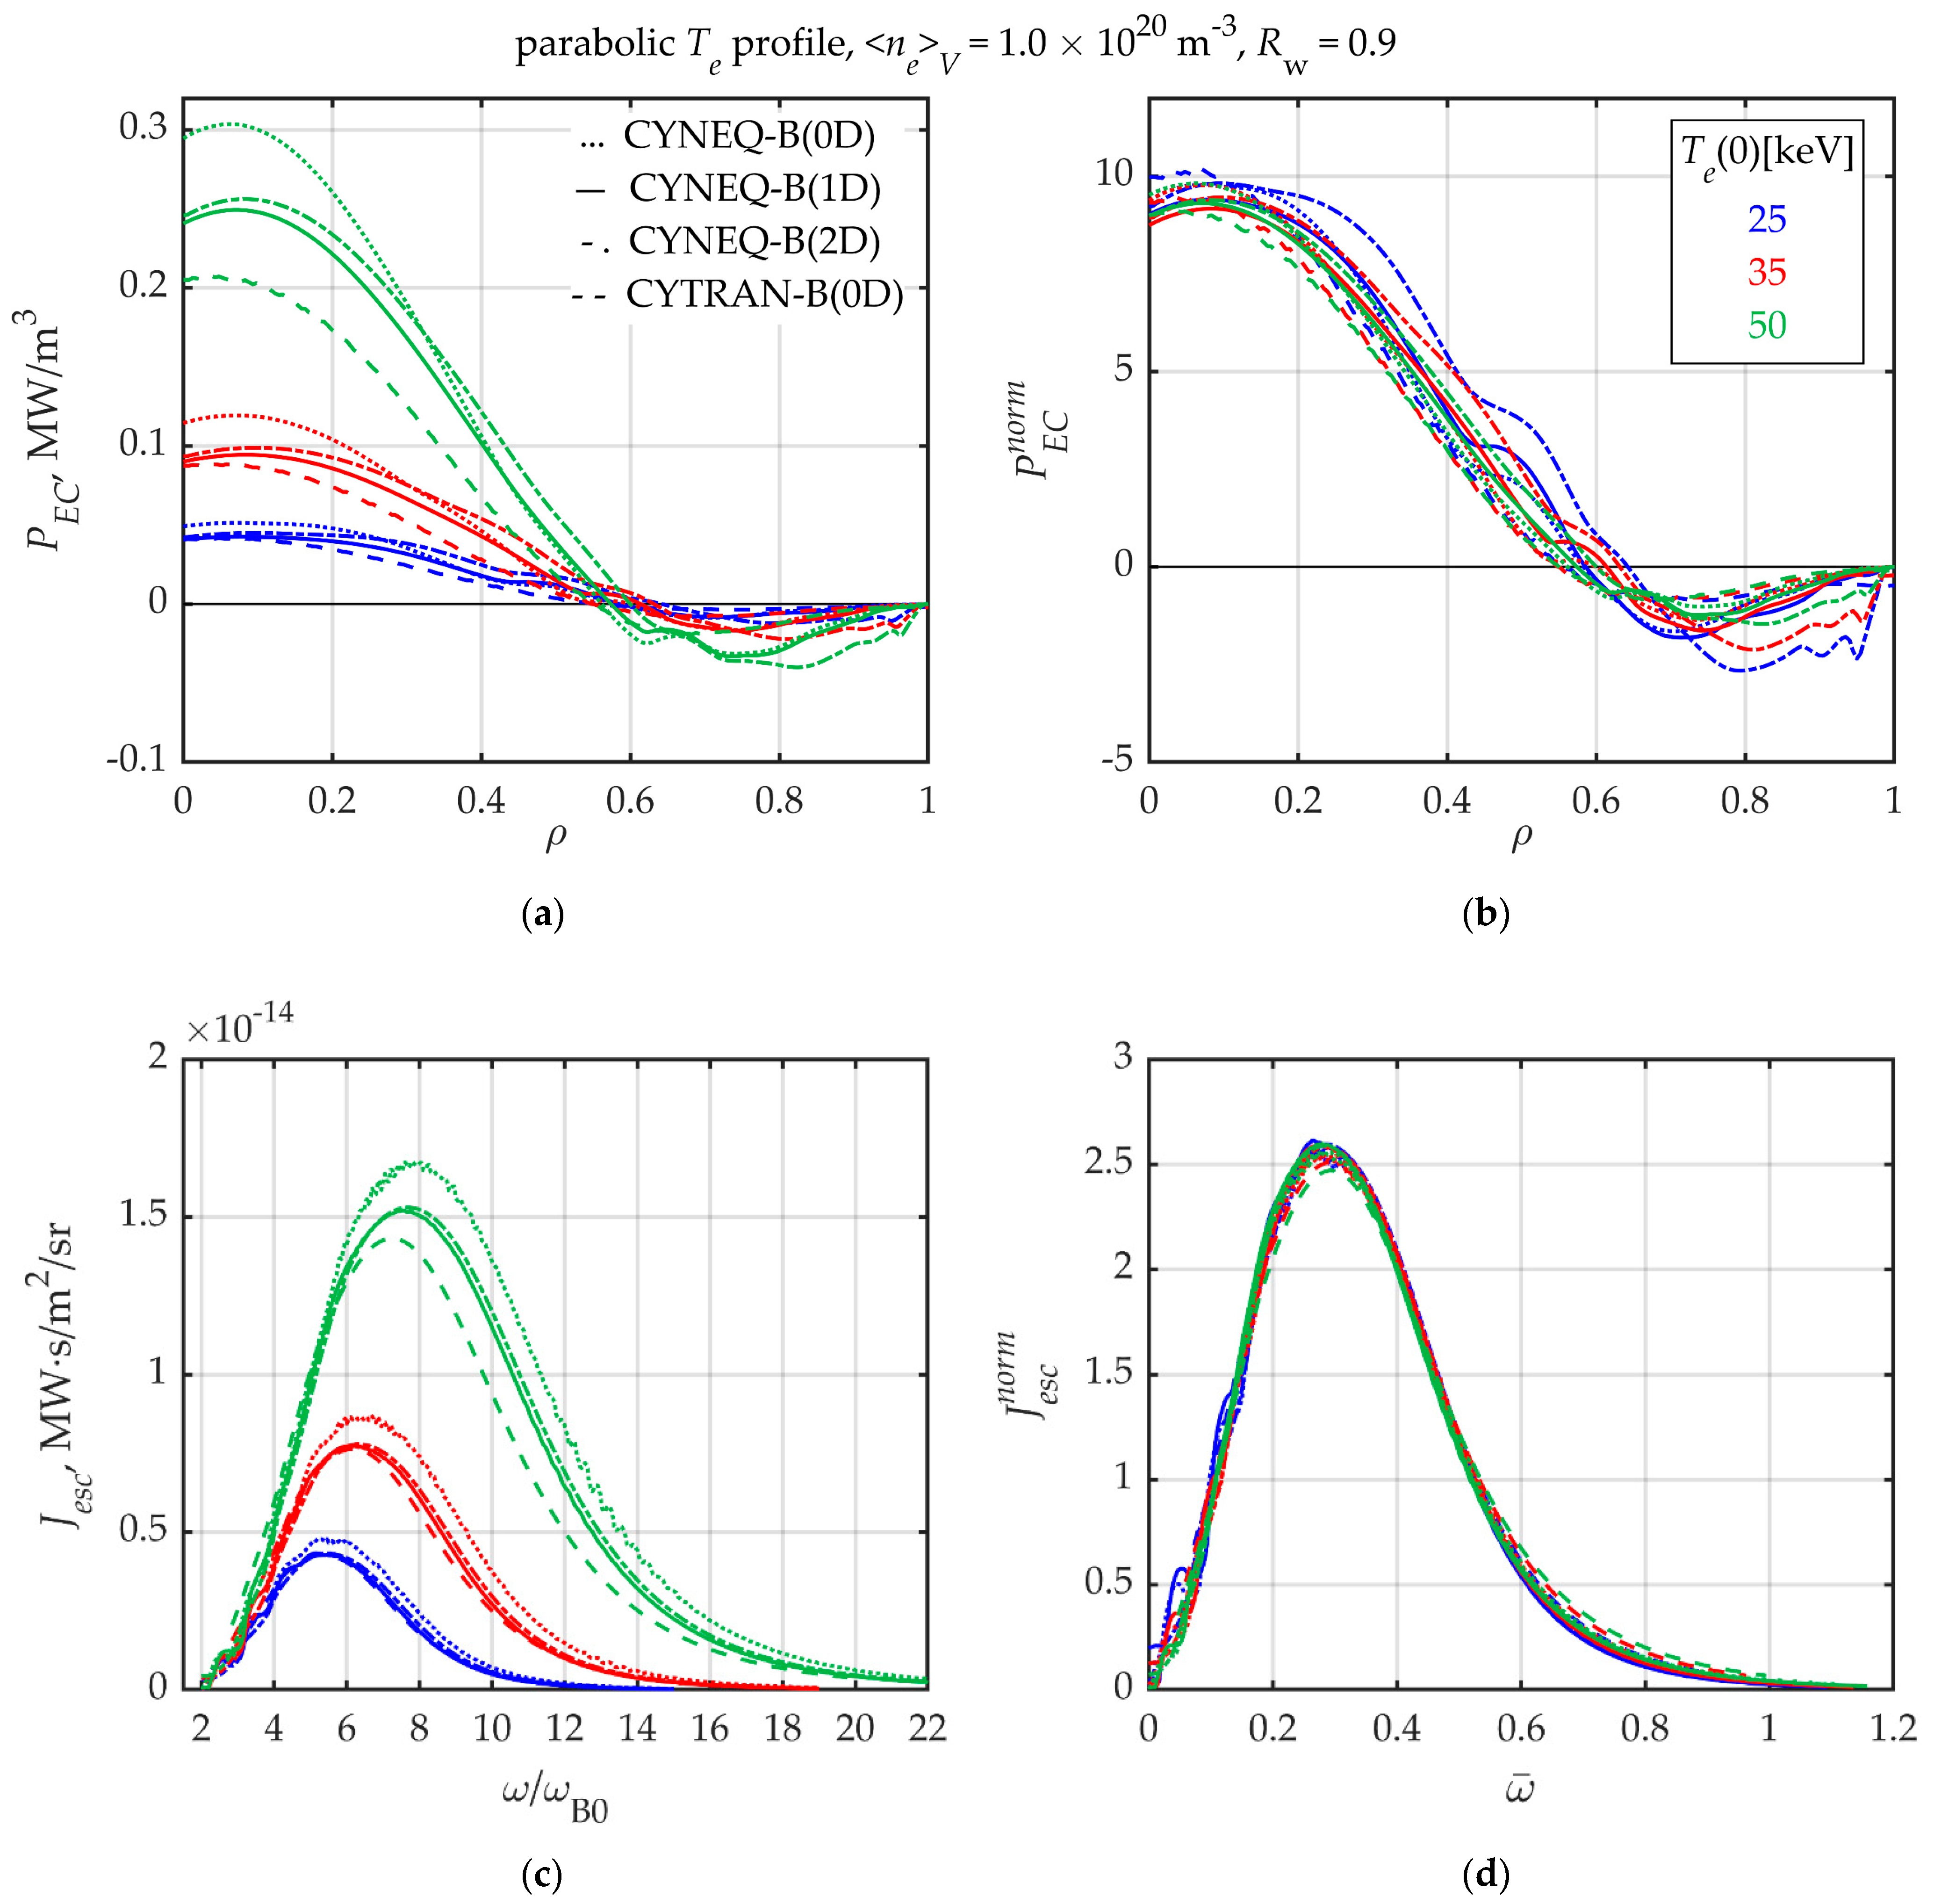
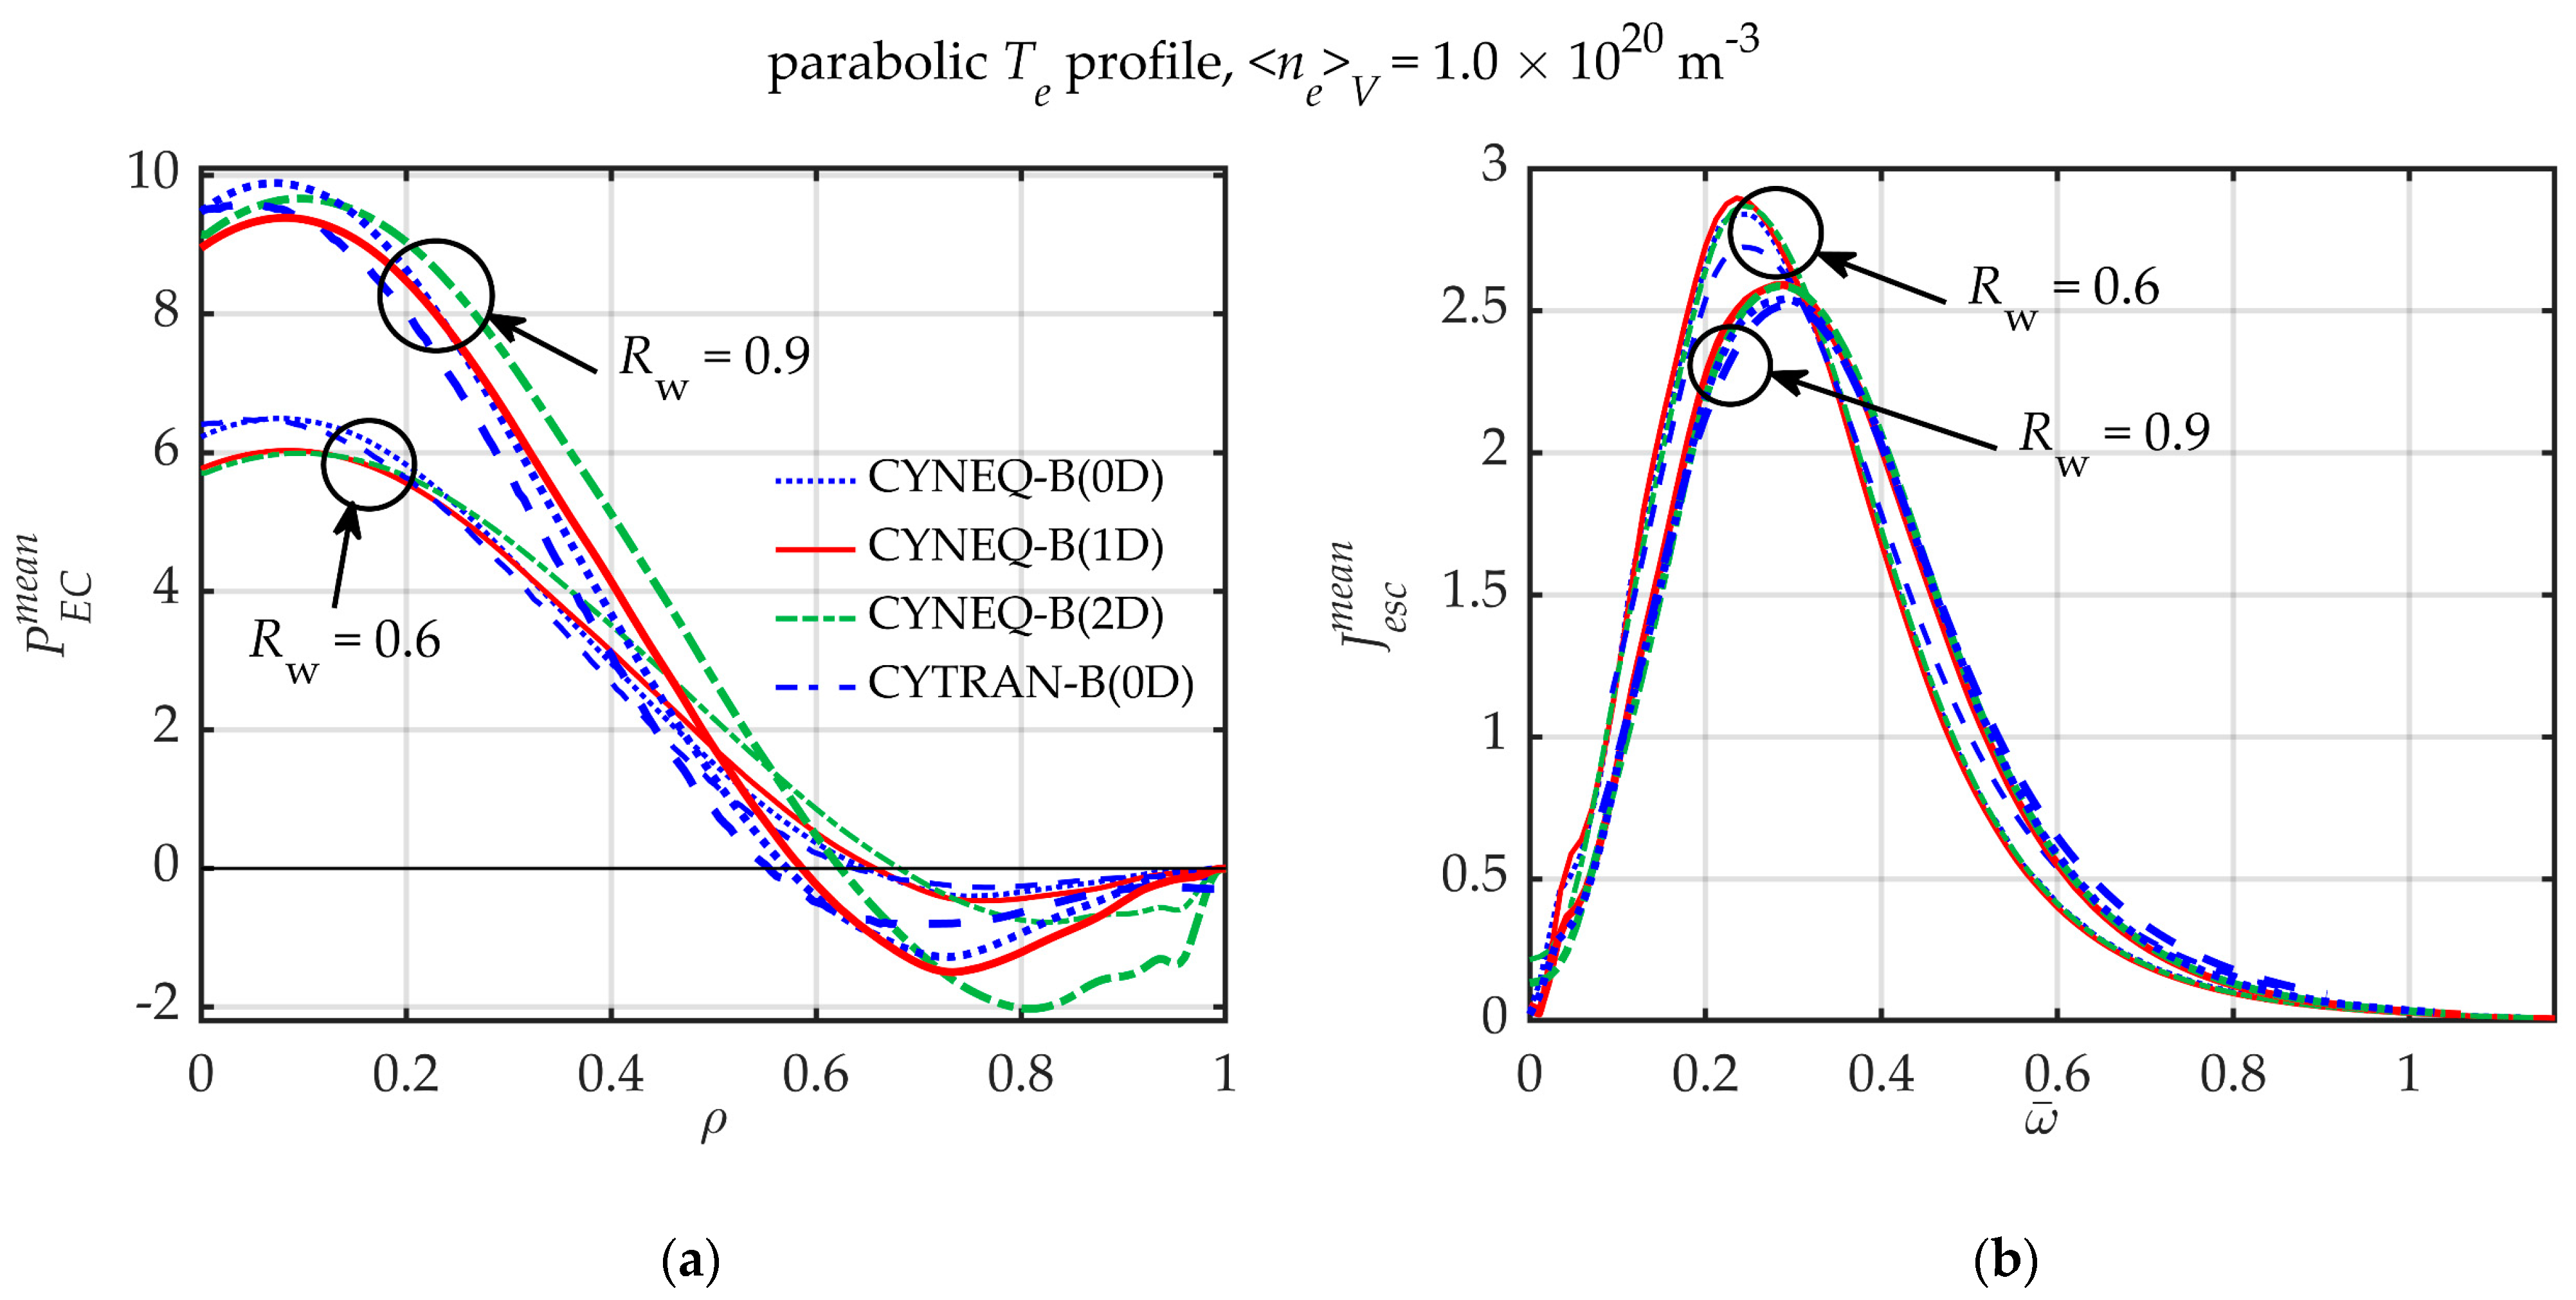
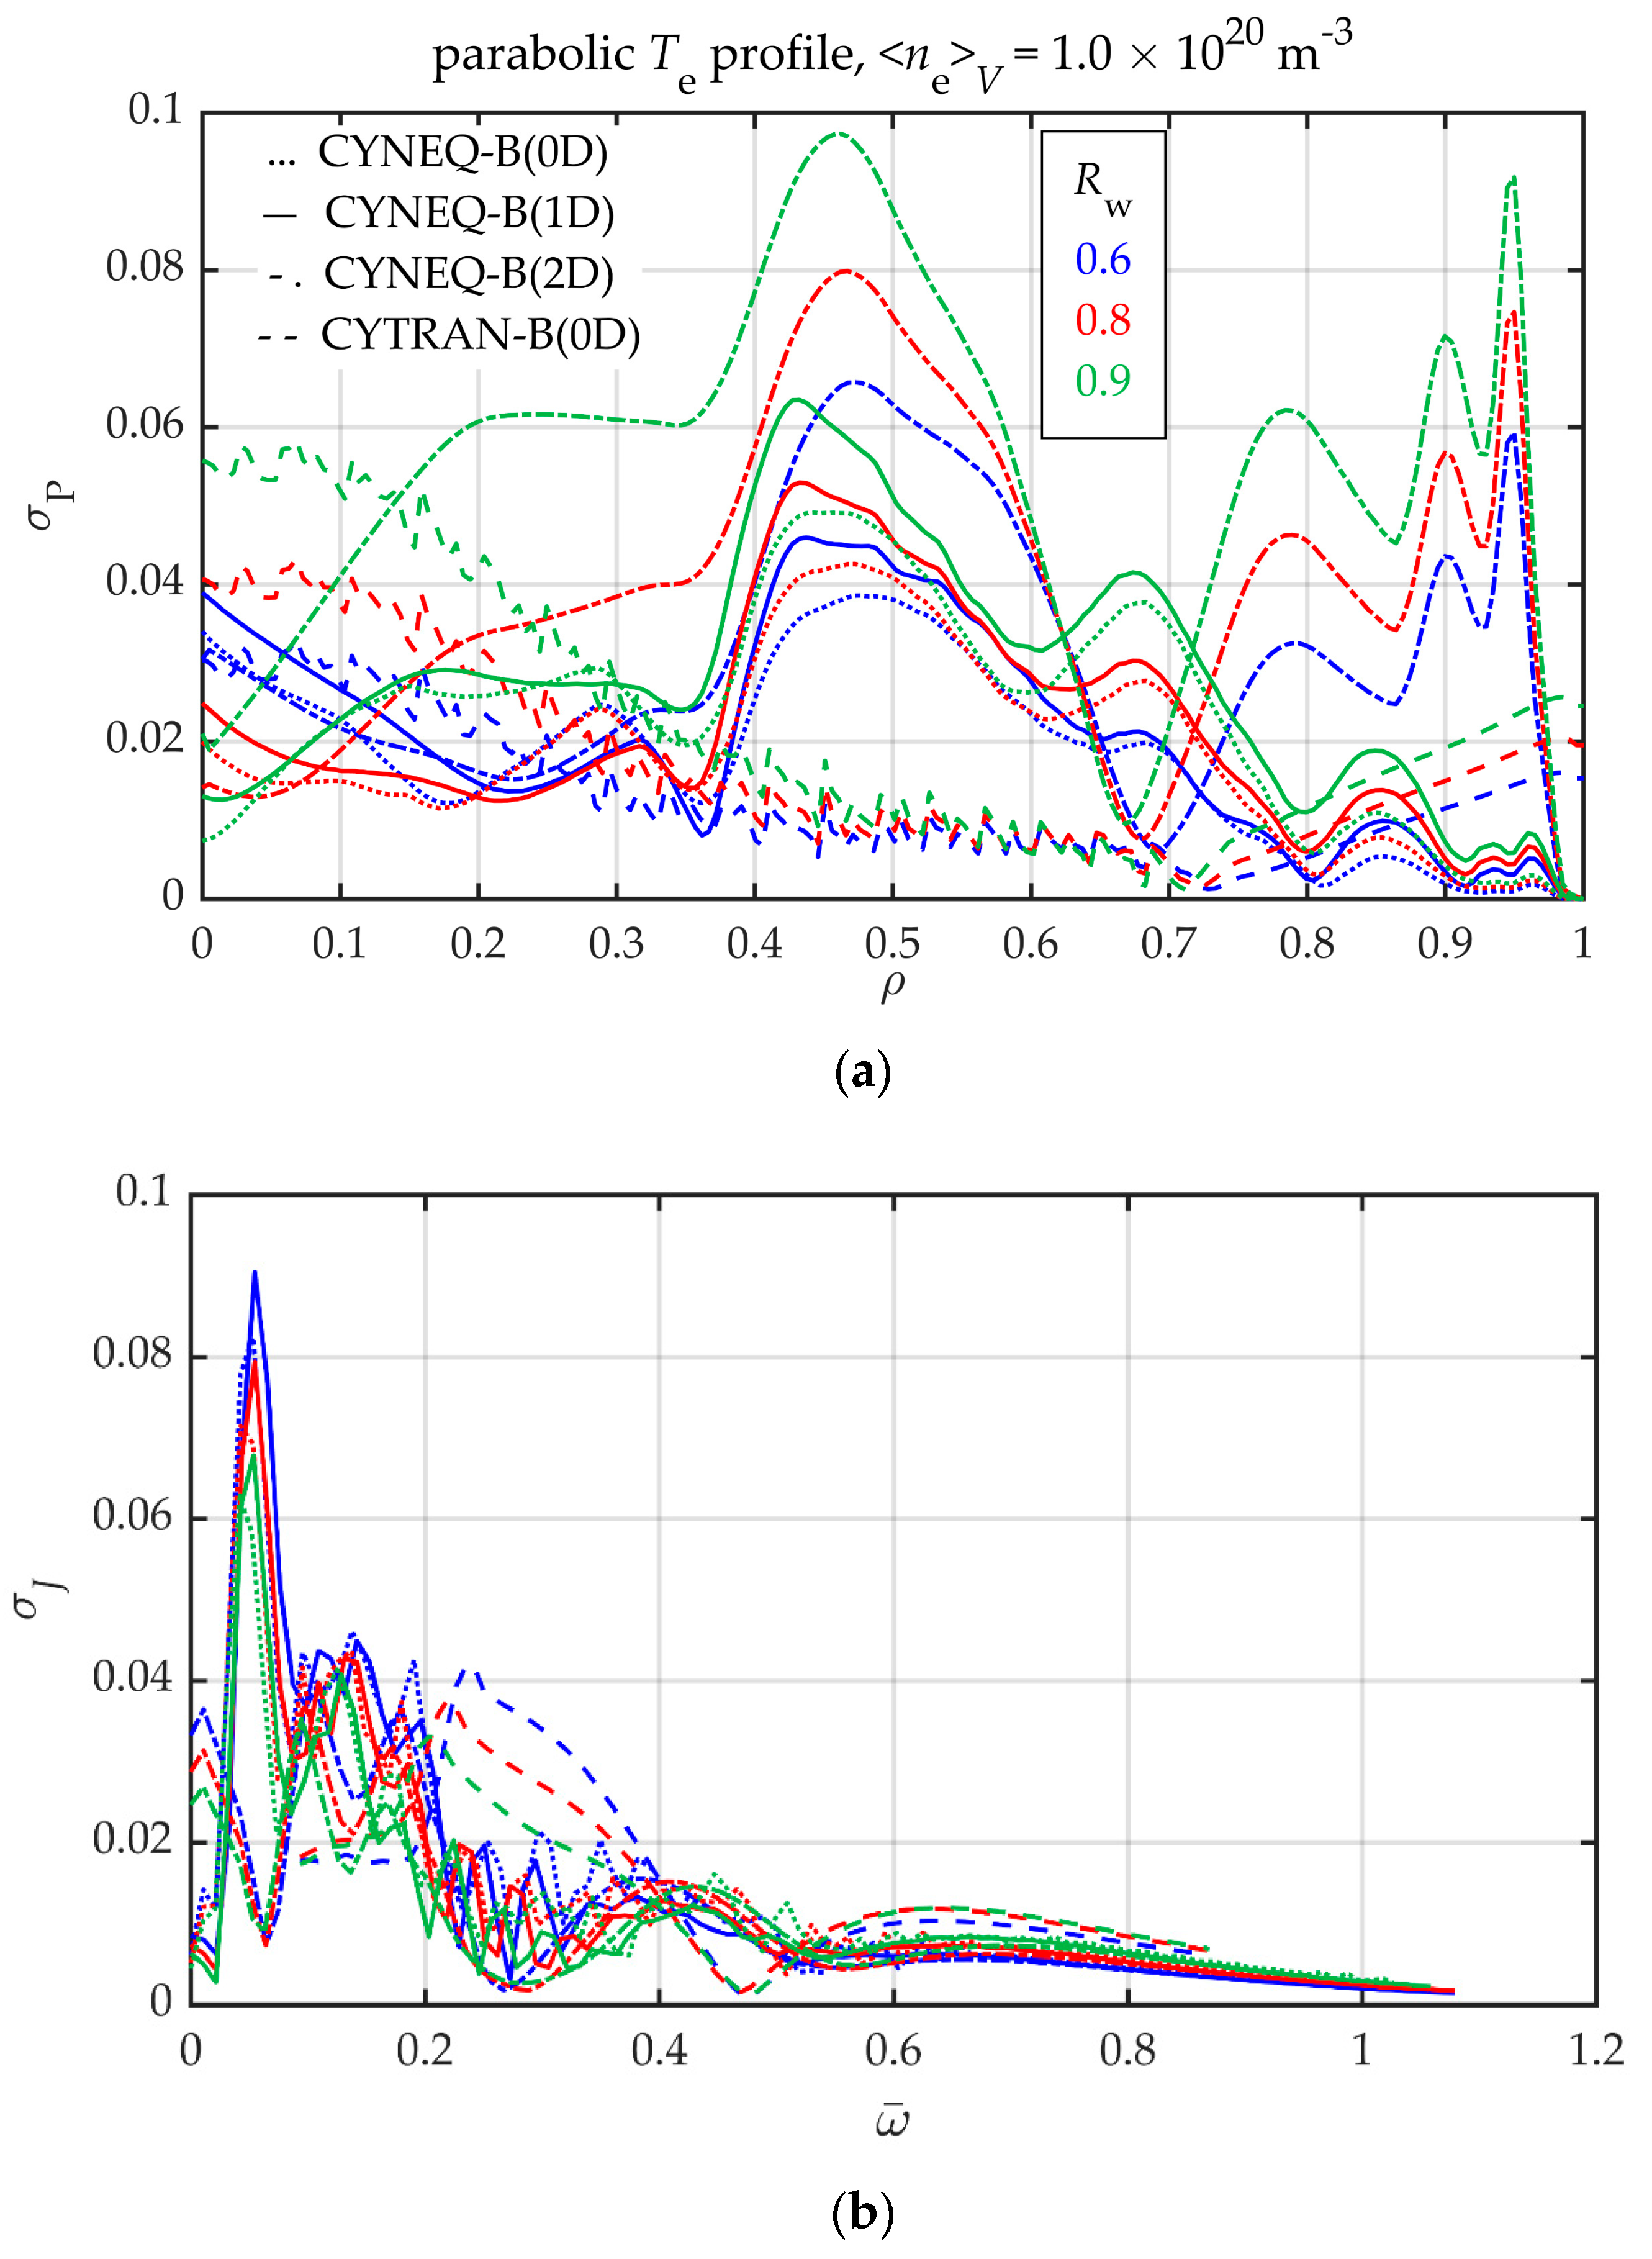
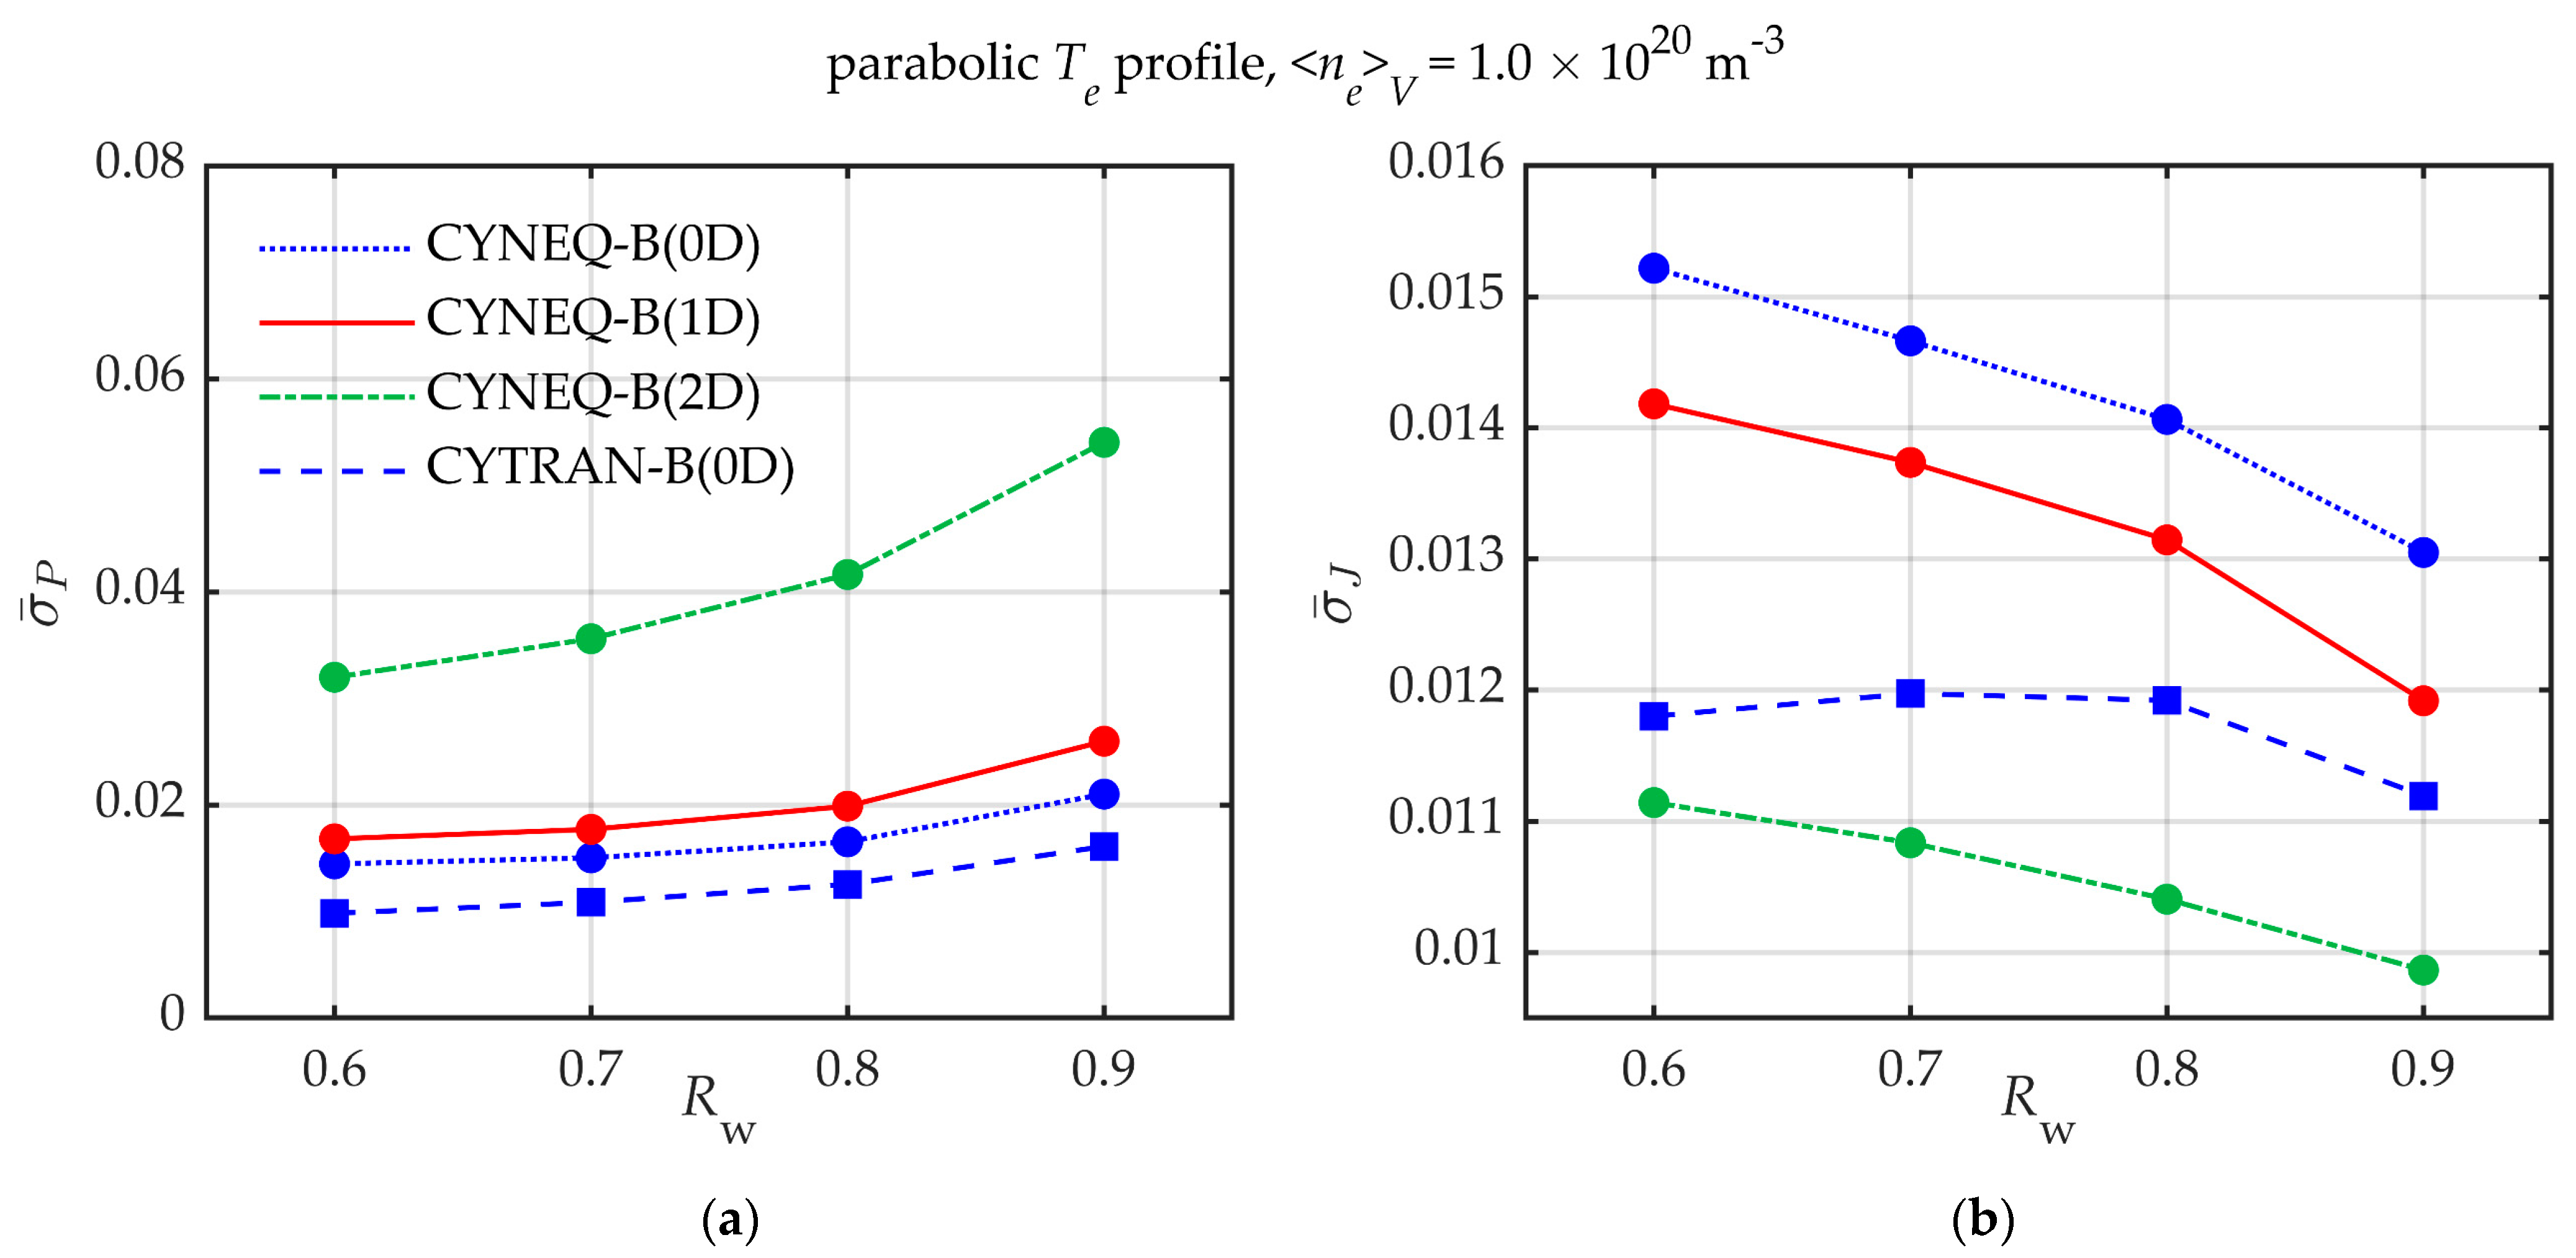
3.2. Self-Similarity of ECR Transport, Calculated Using CYNEQ and CYTRAN Codes

We start the presentation of results with the calculations using the CYNEQ code for three cases of magnetic field profiles (0D, 1D, and 2D models (11)–(13)) and CYTRAN code with 0D approximation of magnetic field profile. We will illustrate the effect of self-similarity by comparing the results for the absolute values of the functions with their normalized values in the adjacent figures (see Figure 6 and Figure 7). The results are presented for parabolic temperature profile and three values of the central temperature, and a flat profile of the electron density (see Table 1 and Table 2 and (27); similar figures for the advanced and ITB temperature profiles can be found in the Supplementary Materials in Figures S2–S5). In the first row, the figures (a) show radial profile of the net EC power loss density (4) and the figures (b) show the corresponding normalized profiles of the net EC power loss density (20). In the second row, the figures (c) present the spectral intensity of the escaping ECR (18) and the figures (d) present the corresponding normalized spectra (25). Figure 6 shows the results for the wall reflection coefficient Rw = 0.6, and Figure 7 for Rw = 0.9.
The next step of our analysis of self-similarity (Figure 8, Figure 9 and Figure 10) for a single profile of electron density (flat profile, see Table 2) is the calculation of the mean profiles (28) of the normalized radial distribution of the net EC power loss density (figures (a)) and the mean spectra (29) of the normalized intensity (figures (b)). Figure 8, Figure 9 and Figure 10 show the results for three types of the temperature profile (see Table 1 and (27)). It is seen that the degree of self-similarity is high and weakly depends on the reflection coefficient from the wall, Rw: the mean profiles for Rw = 0.6 and Rw = 0.9 are close enough.
To roughly estimate the contribution of the ECR loss to the power balance, the total (i.e., volume-integrated) ECR power loss can be used. The results for the total power loss in the cases analyzed in Figure 6 and Figure 7 are shown in Table 3. However, it should be noted that for predictive modeling of the tokamak-reactor operation, the spatial distribution of ECR power loss, especially in the central plasma, is of primary interest because of the leading role of central plasma in achieving the conditions of thermonuclear burning.
The final step of our analysis for a flat profile of electron density is the calculation of the root-mean-square (rms) deviations (30)–(33) for three types of electron temperature profile (see Table 1).
Figure 11 shows spatial profiles of the relative deviation (30) of the normalized profiles of the EC power loss density from the mean normalized profile (28) (figure (a)), and of the spectral profiles of the relative deviation (32) of the normalized spectral intensity of the escaping ECR from the mean normalized profile (29) (figure (b)) for parabolic temperature profile (similar figures for the advanced and ITB temperature profiles can be found in the Supplementary Materials in Figures S6 and S7). The results show, respectively, spatial and spectral functions for different values of the wall reflection coefficient Rw.
Figure 12 shows volume-averaged deviation (31) of the normalized profile of the net EC power loss density from the mean normalized profile (28) (figure (a)), and spectrum-averaged deviation (33) of the normalized spectra of EC radiation intensity from the mean normalized spectrum (29) (figure (b)) as a function of Rw for parabolic temperature profile (similar figures for the advanced and ITB temperature profiles can be found in the Supplementary Materials in Figures S8 and S9).
We now turn to the analysis of the dependence of self-similarity on the electron density profile to complement the previous analysis for a flat profile of the electron density (see Table 2). Figure 13 shows the comparison of the accuracy of the self-similarity for the flat and non-flat profiles of the electron density for parabolic temperature profile and different central temperatures in the range 20–55 keV (see Table 1 and Table 2 and (27); similar figures for the advanced and ITB temperature profiles can be found in the Supplementary Materials in Figures S10 and S11). Figure (a) shows a comparison of the mean profiles (28) of the normalized radial distribution of the net EC power loss density, and figure (b) shows comparison of the mean spectra (29) of the normalized intensity of EC radiation, for the wall reflection coefficient Rw = 0.9. The volume-averaged deviation (30) of the normalized profile of the net EC power loss density from the mean normalized profile are shown as a function of Rw in figures (c), and the same dependence of the spectrum-averaged deviation (32) of the normalized spectra of EC radiation intensity from the mean normalized spectrum is shown in figures (d). It is seen from Figure 13 that the dependence of the accuracy of the self-similarity on the type of the density profile is weak.
The results of analyzing the self-similarity in the case of the non-flat profile of electron density (see Table 2 and (27)) are presented in the Supplementary Materials (Figures S12–S27).

3.3. Self-Similarity of ECR Transport, Calculated Using CYNEQ, RAYTEC, and EXACTEC Codes

The analysis of Section 3.2 based on the results of our calculations using the CYNEQ and CYTRAN codes is extended here to similar calculations in the cases for which we have the results from the RAYTEC and EXACTEC codes. A comparison, similar to that in Figure 6, with the latest results [35] from the RAYTEC code is shown in Figure 14, Figure 15 and Figure 16. Figure 14 and Figure 15 use the results for five cases considered in [35]. Figure 16 analyzes the effect of the plasma equilibrium (Shafranov shift of the plasma column towards a weaker magnetic field due to plasma diamagnetism) on the power loss density profile. Note that the CYNEQ code calculations take into account the plasma equilibrium effects, while the RAYTEC code takes into account the inhomogeneity of the toroidal magnetic field and does not take into account the effects of plasma equilibrium.
A comparison with EXACTEC code, similar to Figure 14, Figure 15 and Figure 16 for RAYTEC code, is shown in Figure 17, Figure 18 and Figure 19. Figure 17 and Figure 18 use the results for two cases of central electron temperature and two types of temperature profile considered in [22]. Figure 19 analyzes the effect of the plasma equilibrium (Shafranov shift) on the power loss density profile. Note that the EXACTEC code calculates the results for the case of a plasma in a straight circular cylinder with a uniform axial magnetic field, where there are no plasma equilibrium effects, unlike CYNEQ calculations, where plasma equilibrium is taken into account.
The last step in analyzing the self-similarity of the ECR transport in toroidal plasmas with highly reflecting walls is a comparison of the CYNEQ results with the simple analytic model known as the locally applied Trubnikov formula (LATF) (see Appendix in [25]). This formula is based on an intuitive application of the formula suggested in [8] as a fit of the numerical results [5] for the total (i.e., volume-integrated, not spatially resolved) ECR power loss of a homogeneous plasma in a constant magnetic field. Formula [8] included the effect of wall reflection and inhomogeneity of the toroidal magnetic field. However, this formula was not intended to be used to estimate the spatial profile of the ECR power loss density. An intuitive extension of the formula [8] gives reasonable results: good results for the total power loss in an inhomogeneous plasma and less accurate results for the spatial profile (for more details see [25]). According to the main assumption of the LATF, this formula, in principle, cannot describe the inversion of the sign of PEC(ρ) in the peripheral plasma. The main features of LATF are illustrated here in Figure 20, which compares the results from Figure 6 for the CYNEQ code with LATF. It is seen that the self-similarity that is ad hoc assumed in an analytic model, does not guarantee satisfactory accuracy of the results. The latter is especially important in the central hot plasma, where LATF significantly underestimates the ECR power loss density.

3.4. Analysis of Self-Similarity of Continuous-Spectrum Transport for Model Transport Coefficients

The analysis of self-similarity of continuous-spectrum radiation transfer in plasmas with highly reflecting walls, carried out in the case of ECR transport, can be extended to show weak dependence of the phenomenon on the parameters of the problem. Now we consider the model case of the emission and absorption coefficients, different from the ECR case. We choose the following type of the absorption coefficient:
κ ( ρ , ω ) = κ 0   n e ( ρ ) n e ( 0 ) exp ( ( ω ω min ) 2 ω D 2 ) , ω D = ω m i n T e ( ρ ) T e ( 0 ) ,
where the half-width of the spectrum, ωD, depends on the temperature, Te(ρ), similarly to Doppler broadening. The emissivity is related to the absorption coefficient in the same way, according to Kirchhoff’s law at low frequencies. All other input parameters are taken the same as in the case of ECR transport. The characteristic value of the absorption coefficient, κ0, which determines the optical thickness, is also taken in the same range, because our goal is to analyze the sensitivity of the self-similarity of radiative transfer to spectral dependence of emissivity and absorption. The results for the spatial profile of radiation loss and radiation intensity are shown below in Figure 21.
More results for the model considered in this subsection can be found in the Supplementary Materials (Figures S28–S30). These results strengthen the conclusion based on the results for the ECR transport: the self-similarity of the main characteristics of the radiative transfer in the continuous spectrum in plasmas with highly reflecting walls; namely, the power balance profile and the radiation intensity spectrum, is observed in a wide range of parameters of the problem.

4. Discussion and Conclusions

The similarity of the radiative transfer (RT) in continuous spectrum in plasmas with highly reflecting walls is shown here for the main characteristics of RT, namely the spectral distribution of the radiation intensity escaping from a toroidal plasma, Jesc(ω), defined in (18), and the spatial distribution of the net power loss PEC(ρ), defined in (4). The results are presented for the transport of electron cyclotron radiation (ECR) in hot Maxwellian plasmas under conditions of a thermonuclear fusion tokamak-reactor and for RT with model functions of absorption and emission of radiation, connected by Kirchhoff’s law at low frequencies. The revealed similarity of RT is a consequence of the symmetry of highly reflecting walls (namely, toroidal symmetry of vacuum chamber in tokamaks, including the ITER tokamak [2] (under construction) and various next-step projects called DEMO [3]), which predetermines the isotropization of the radiation intensity with respect to angular and spatial variables in some parts of the phase space of the problem.
The use of symmetry-based properties of RT made it possible to create the fast-routine algorithm [16] (“simulator code” that is comparable to simple analytical expressions in terms of computation speed, as opposed to very time-consuming full transport calculations), which is used in the numerical modeling of the spatial profile of ECR power loss in tokamak-reactors. For example, numerical codes CYTRAN [16,21] and EXACTEC [23] were used in predictive modeling of operation scenarios, respectively, for ITER [11] and DEMO [3]. For CYNEQ code [20], these examples include predictive modeling [12] of quasi-steady-state scenarios of ITER operation, analysis of quenching of temperature rise by ECR loss for ITER long pulse operation [15], and elaboration of new ECR-based diagnostics for DEMO. The latter includes the diagnostics of superthermal electrons from ECR spectrum at high harmonics of fundamental EC frequency [39] and the complex diagnostics of electron temperature in central plasma, based on the high-harmonic ECR measurements and the Thomson scattering [40].
The problem of coupling for tokamak-reactors the codes for the ECR transport at moderate and high harmonics of EC fundamental frequency (n ≥ 3), such as SNECTR [17], CYTRAN, CYNEQ, EXACTEC, and RAYTEC [25], with the codes for EC resonance heating (ECRH) and EC current drive (ECCD) at low harmonics (n = 1 and n = 2), such as codes participated in the benchmarking of ECRH and ECCD in ITER [41], was discussed in [42] with respect to a coupling of CYNEQ with the following codes for ECRH and ECCD: the GENRAY code [43] for ray trajectory propagation of EC waves for given electron velocity distribution function (eVDF) and the CQL3D code [44] for space–time evolution of eVDF. The necessity of such coupling is motivated by a strong effect of the deviation of eVDF from Maxwellian, in the form of superthermal electrons, on the spatial profile of ECR power loss. For the model eVDFs and ITER-like condition, this effect was estimated using CYNEQ [10] and RAYTEC [45]. The simulations [46,47] of VDF of superthermal electrons using the ray tracing code TORBEAM [48] and the kinetic code RELAX [49] made it possible to evaluate in [46,50] the effect of superthermals on the ECR power profile under conditions of a strong ECRH and ECCD for ITER-like plasma. These studies continued the investigations of the impact of superthermal electrons on the ECR power loss in [51,52] in the case of various model eVDFs. The first step in self-consistent description of the wave transport and kinetics of electrons was made in analytic models [18,53], and the respective estimates [54] for ITER-like conditions have shown the effect of the transport of internal (not injected) ECR on the deviation of eVDF from Maxwellian.
The symmetry-based effect of ECR intensity isotropization in tokamaks was also used in the following works. Application of the CYNEQ code to the problem [55,56] of the start-up stage of tokamak-reactor operation made it possible to create a model [57] of multi-pass absorption of external EC radiation at initial stage of discharge in ITER. Application of ECR intensity isotropization to the problem of interpreting the ECR spectra at down-shifted frequencies (see, e.g., [58]) made it possible to reconstruct the VDF of superthermal electron in the outer layer of plasma in tokamak T-10 [59].
Let us discuss the relationship between the revealed self-similarity and the accuracy of numeric codes.
(i) Self-similarity was found using the results of mass calculations using the fast-routine codes CYNEQ [18,19,20] and CYTRAN code [16,21] (in its version participated in the benchmarking [22], see Section 3), which have been shown to have good accuracy when compared in [12,22,24] with the codes SNECTR [17] and RAYTEC [25] based on ab initio modeling. A comparison of CYNEQ and CYTRAN results with the latest results from RAYTEC [35] is made in Section 3.3. Thus, the self-similarity phenomenon is supported by the reliability of the CYNEQ and CYTRAN results.
(ii) The degree of self-similarity revealed in a wide range of parameters of the RT problem shows that some success of very simple models for the spatial profile of power loss PEC(ρ), such as the LATF formula [25], is not accidental. However, the similarity that is ad hoc assumed in an analytic model, does not guarantee satisfactory accuracy of the results (e.g., LATF, in principle, cannot describe the inversion of the sign of PEC(ρ) in the peripheral plasma). Consequently, self-similarity alone cannot be a measure of the accuracy of numeric codes.
(iii) The revealed self-similarity opens up new possibilities for constructing simple analytic models for PEC(ρ) and Jesc(ω), which could be used in various multi-parametric analyses of a complex problem, where the simplest versions of various components are required. For example, the self-similar profiles of PEC(ρ) combined with approximate formulas for total (i.e., volume-integrated) EC power loss can be used to assess the contribution of the ECR power loss to the local electron power balance in tokamak-reactors. The self-similar profiles of Jesc(ω) can be used in the ongoing analysis of the role of the internal ECR, escaping from the magnetized plasma in thermonuclear fusion facilities, as a source of thermal and electromagnetic loads on in-chamber components and diagnostic tools (see [13] for ITER).

Supplementary Materials

The following are available online at https://www.mdpi.com/article/10.3390/sym13071303/s1.

Author Contributions

The authors equally contributed to this work. All authors have read and agreed to the published version of the manuscript.

Funding

This research received no external funding.

Institutional Review Board Statement

Not applicable.

Informed Consent Statement

Not applicable.

Data Availability Statement

Not applicable.

Acknowledgments

The authors are grateful to A.Y. Dnestrovskii for consulting on the plasma equilibrium in the ASTRA code, and A.R. Polevoi for collaboration in applying the CYNEQ code to the modeling of ITER operation scenarios.

Conflicts of Interest

The authors declare no conflict of interest.

References

  1. Kukushkin, A.B.; Kulichenko, A.A.; Neverov, V.S.; Sdvizhenskii, P.A.; Sokolov, A.V.; Voloshinov, V.V. Self-similar solutions in the theory of nonstationary radiative transfer in spectral lines in plasmas and gases. Symmetry 2021, 13, 394. [Google Scholar] [CrossRef]
  2. Shimada, M.; Campbell, D.J.; Mukhovatov, V.; Fujiwara, M.; Kirneva, N.; Lackner, K.; Nagami, M.; Pustovitov, V.D.; Uckan, N.; Wesley, J.; et al. Chapter 1: Overview and summary. Nucl. Fusion 2007, 47, S1–S17. [Google Scholar] [CrossRef]
  3. Garcia, J.; Giruzzi, G.; Artaud, J.F.; Basiuk, V.; Decker, J.; Imbeaux, F.; Peysson, Y.; Schneider, M. Analysis of DEMO scenarios with the CRONOS suite of codes. Nucl. Fusion 2008, 48, 075007. [Google Scholar] [CrossRef]
  4. Trubnikov, B.A. Electromagnetic waves in a relativistic plasma in a magnetic field. In Plasma Physics and the Problem of Controlled Thermonuclear Reactions; Leontovich, M.A., Ed.; Pergamon Press: New York, NY, USA, 1959; Volume 3, p. 122. [Google Scholar]
  5. Trubnikov, B.A.; Bazhanova, A.E. Magnetic radiation from a plasma layer. In Plasma Physics and the Problem of Controlled Thermonuclear Reactions; Leontovich, M.A., Ed.; Pergamon Press: New York, NY, USA, 1961; p. 141. [Google Scholar]
  6. Drummond, W.E.; Rosenbluth, M.N. Cyclotron radiation from a hot plasma. Phys. Fluids 1963, 6, 276–283. [Google Scholar] [CrossRef]
  7. Rosenbluth, M.N. Synchrotron radiation in tokamaks. Nucl. Fusion 1970, 10, 340–343. [Google Scholar] [CrossRef]
  8. Trubnikov, B.A. Universal coefficients for synchrotron emission from plasma configurations. In Reviews of Plasma Physics; Leontovich, M.A., Ed.; Consultants Bureau: New York, NY, USA, 1979; Volume 7, p. 345. [Google Scholar]
  9. Bornatici, M.; Cano, R.; De Barbieri, O.; Engelmann, F. Electron cyclotron emission and absorption in fusion plasmas. Nucl. Fusion 1983, 23, 1153. [Google Scholar] [CrossRef]
  10. Cherepanov, K.V.; Kukushkin, A.B. Influence of suprathermal electrons kinetics on cyclotron radiation transport in hot toroidal plasmas. In Proceedings of the 20th IAEA Fusion Energy Conference, Vilamoura, Portugal, 1–6 November 2004; Available online: http://www-naweb.iaea.org/napc/physics/fec/fec2004/papers/th_p6-56.pdf (accessed on 3 November 2004).
  11. Albajar, F.; Bornatici, M.; Cortes, G.; Dies, J.; Engelmann, F.; Garcia, J.; Izquierdo, J. Importance of electron cyclotron wave energy transport in ITER. Nucl. Fusion 2005, 45, 642–648. [Google Scholar] [CrossRef]
  12. Kukushkin, A.B.; Minashin, P.V.; Polevoi, A.R. Impact of magnetic field inhomogeneity on electron cyclotron radiative loss in tokamak reactors. Plasma Phys. Rep. 2012, 38, 211–220. [Google Scholar] [CrossRef]
  13. Oosterbeek, J.W.; Udintsev, V.S.; Gandini, F.; Hirsch, M.; Laqua, H.P.; Maassen, N.; Ma, Y.; Polevoi, A.; Sirinelli, A.; Vayakis, G.; et al. Loads due to stray microwave radiation in ITER. Fusion Eng. Des. 2015, 96-97, 553–556. [Google Scholar] [CrossRef]
  14. Kukushkin, A.B.; Minashin, P.V.; Polevoi, A.R. Electron cyclotron power losses in ITER for 2D profile of magnetic field. In Proceedings of the 23rd IAEA Fusion Energy Conference, Daejon, Korea, 11–16 October 2010. [Google Scholar]
  15. Kukushkin, A.B.; Minashin, P.V.; Polevoi, A.R. Limit of electron cyclotron radiation in ITER long pulse operation. In Proceedings of the 38th EPS Conference on Plasma Physics, Strasbourg, France, 27 June–1 July 2011. [Google Scholar]
  16. Tamor, S. A Simple Fast Routine for Computation of Energy Transport by Synchroton Radiation in Tokamaks and Similar Geometries; SAI-023-81-189LJ/LAPS-72; Science Applications Inc.: La Jolla, CA, USA, 1981. [Google Scholar]
  17. Tamor, S. Calculation of energy transport by cyclotron radiation in fusion plasmas. Nucl. Technol. Fusion 1983, 3, 293–303. [Google Scholar] [CrossRef]
  18. Kukushkin, A.B. Heat transport by cyclotron waves in plasmas with strong magnetic field and highly reflecting walls. In Proceedings of the 14th IAEA Conference on Plasma Physics and Controlled Nuclear Fusion Research, Wuerzburg, Germany, 30 September–7 October 1992; pp. 35–45. [Google Scholar]
  19. Kukushkin, A.B. Analytic description of energy loss by a bounded inhomogeneous hot plasma due to the emission of electromagnetic waves. JETP Lett. 1992, 56, 487. [Google Scholar]
  20. Kukushkin, A.B.; Minashin, P.V. Influence of magnetic field inhomogeneity on electron cyclotron power losses in magnetic fusion reactor. In Proceedings of the 36th EPS Conference on Plasma Physics, Sofia, Bulgaria, 30 June–3 July 2009. [Google Scholar]
  21. Houlberg, W.A. CYTRAN 2.1; NTCC Modules Library: Oak Ridge, TN, USA, 2004. [Google Scholar]
  22. Albajar, F.; Bornatici, M.; Engelmann, F.; Kukushkin, A.B. Benchmarking of codes for calculating local net EC power losses in fusion plasmas. Fusion Sci. Technol. 2009, 55, 76–83. [Google Scholar] [CrossRef] [Green Version]
  23. Albajar, F.; Bornatici, M.; Engelmann, F. Electron cyclotron radiative transfer in fusion plasmas. Nucl. Fusion 2002, 42, 670–678. [Google Scholar] [CrossRef]
  24. Kukushkin, A.B.; Minashin, P.V. Benchmarking of codes for spatial profiles of electron cyclotron losses with account of plasma equilibrium in tokamak reactors. In Proceedings of the 24th IAEA Fusion Energy Conference, San Diego, CA, USA, 8–13 October 2012. [Google Scholar]
  25. Albajar, F.; Bornatici, M.; Engelmann, F. RAYTEC: A new code for electron cyclotron radiative transport modelling of fusion plasmas. Nucl. Fusion 2009, 49, 115017. [Google Scholar] [CrossRef]
  26. Bekefi, G. Radiation Processes in Plasmas; Wiley: New York, NY, USA, 1966. [Google Scholar]
  27. Zel’dovich, Y.B.; Raizer, Y.P. Physics of Shock Waves and High-Temperature Hydrodynamic Phenomena; Academic Press: New York, NY, USA, 1967. [Google Scholar]
  28. Ginzburg, V.L. The propagation of electromagnetic waves in plasmas. In International Series of Monographs in Electromagnetic Waves, 2nd ed.; Pergamon: Oxford, UK, 1970; Volume 7. [Google Scholar]
  29. Zakharov, L.E.; Shafranov, V.D. Equilibrium of Current-carrying plasmas in toroidal configurations. In Reviews of Plasma Physics; Leontovich, M.A., Ed.; Consultant Bureau: New York, NY, USA, 1986; p. 153. [Google Scholar]
  30. Pereverzev, G.V.; Yushmanov, P.N.; Dnestrovskii, A.Y.; Polevoi, A.R.; Tarasjan, K.N.; Zakharov, L.E. ASTRA—An Automatic System for Transport Analysis in a Tokamak; IPP 5/42; Max-Planck-Institut für Plasmaphysik: Garching, Germany, 1991. [Google Scholar]
  31. Pereverzev, G.V.; Yushmanov, P.N. ASTRA—Automated System for Transport. Analysis in a Tokamak; IPP 5/98; Max-Planck-Institut für Plasmaphysik: Garching, Germany, 2002. [Google Scholar]
  32. Polevoi, A.R.; Medvedev, S.Y.; Casper, T.; Gribov, Y.V.; Ivanov, A.A.; Snipes, J.A.; Campbell, D.J.; Chuyanov, V.A. Assessment of operational space for long-pulse scenarios in ITER. In Proceedings of the 37th EPS Conference on Plasma Physics, Dublin, Ireland, 22–25 June 2010. [Google Scholar]
  33. Cherepanov, K.V.; Kukushkin, A.B.; Minashin, P.V.; Neverov, V.S. Nonlocal vs. diffusion mechanisms of electron cyclotron radiation transport in fusion reactor-grade tokamaks. In Proceedings of the 7th 34th EPS Conference on Plasma Physics, Warsaw, Poland, 2–6 July 2007. [Google Scholar]
  34. Tamor, S. Synchrotron radiation loss from hot plasma. Nucl. Instrum. Methods Phys. Res. Sect. 1988, 271, 37–40. [Google Scholar] [CrossRef]
  35. Albajar, F.; Bornatici, M.; Engelmann, F. EC radiative transport and losses in demo-like high-temperature plasmas. EPJ Web Conf. 2015, 87, 01009. [Google Scholar] [CrossRef] [Green Version]
  36. Kukushkin, A.B.; Minashin, P.V.; Neverov, V.S. Similarity of spatial distributions of net electron cyclotron power losses in fusion plasmas. In Proceedings of the 35th EPS Conference on Plasma Physics, Hersonissos, Greece, 9–13 June 2008. [Google Scholar]
  37. Minashin, P.V.; Kukushkin, A.B. Influence of plasma equilibrium on scaling laws for local and total electron cyclotron power losses in tokamak-reactors. In Proceedings of the 39th EPS Conference on Plasma Physics, Stockholm, Sweden, 2–6 July 2012. P4.009. [Google Scholar]
  38. Albajar, F.; Bornatici, M.; Engelmann, F. Electron cyclotron radiative transfer in the presence of polarization scrambling in wall reflections. Nucl. Fusion 2005, 45, L9–L13. [Google Scholar] [CrossRef] [Green Version]
  39. Minashin, P.V.; Kukushkin, A.B. Spectroscopic diagnostics of superthermal electrons with high-number harmonic EC radiation in tokamak reactor plasmas. EPJ Web Conf. 2015, 87, 03009. [Google Scholar] [CrossRef] [Green Version]
  40. Sdvizhenskii, P.A.; Minashin, P.V.; Kukushkin, A.B.; Kurskiev, G.S.; Mukhin, E.E. Complex diagnostics of electron velocity distribution with thomson scattering and electron cyclotron emission in tokamaks. In Proceedings of the 42nd EPS Conference on Plasma Physics, Lisbon, Portugal, 22–26 June 2015. [Google Scholar]
  41. Prater, R.; Farina, D.; Gribov, Y.; Harvey, R.W.; Ram, A.K.; Lin-Liu, Y.-R.; Poli, E.; Smirnov, A.P.; Volpe, F.; Westerhof, E.; et al. Benchmarking of codes for electron cyclotron heating and electron cyclotron current drive under ITER conditions. Nucl. Fusion 2008, 48, 035006. [Google Scholar] [CrossRef] [Green Version]
  42. Minashin, P.V.; Kukushkin, A.B. Algorithm of self-consistent calculation of EC losses and kinetics of ECRH/ECCD in Tokamak-reactors. In Proceedings of the 40th EPS Conference on Plasma Physics, Espoo, Finland, 1–5 July 2013. [Google Scholar]
  43. Smirnov, A.P.; Harvey, R.W.; Kupfer, K. A general ray tracing code GENRAY. Bull. Am. Phys. Soc. 1994, 39, 1626. [Google Scholar]
  44. Harvey, R.W.; McCoy, M.G. The CQL3D code. In Proceedings of the IAEA Technical Committee Meeting on Advances in Simulation and Modeling of Thermonuclear Plasmas, Montreal, QC, Canada, 15–17 June 1992; pp. 489–526. [Google Scholar]
  45. Albajar, F.; Bornatici, M.; Engelmann, F. EC radiative transport in fusion plasmas with an anisotropic distribution of suprathermal electrons. In Proceedings of the 16th Joint Workshop Electron Cyclotron Emission and Electron Cyclotron Resonance Heating, Sanya, China, 12–15 April 2010; pp. 215–221. [Google Scholar]
  46. Cherepanov, K.V.; Kukushkin, A.B.; Kuznetsova, L.K.; Westerhof, E. EC radiation transport in hot tokamak plasmas with ECCD/ECRH-produced superthermal electrons. In Proceedings of the 6th International Workshop Strong Microwaves in Plasmas, Nizhny Novgorod, Russia, 25 July–1 August 2005; p. 533. [Google Scholar]
  47. Kuznetsova, L.K.; Cherepanov, K.V.; Kukushkin, A.B.; Westerhof, E. Formation of superthermal electrons under conditions of ECRH and ECCD in ITER-like tokamak. In Proceedings of the 14th Joint Workshop on Electron Cyclotron Emission and Electron Cyclotron Heating, Santorini, Greece, 9–12 May 2006; p. 379. [Google Scholar]
  48. Poli, E.; Peeters, A.G.; Pereverzev, G.V. TORBEAM—A beam tracing code for electron-cyclotron waves in tokamak plasmas. Comput. Phys. Commun. 2001, 136, 90–104. [Google Scholar] [CrossRef]
  49. Westerhof, E.; Peeters, A.G.; Schippers, W.L. RELAX: A Computer Code for the Study of Collisional and Wave Driven Relaxation of the Electron Distribution Function in Toroidal Geometry; FOM-Instituut voor Plasmafysica: Nieuwegein, The Netherlands, 1992. [Google Scholar]
  50. Kukushkin, A.B.; Cherepanov, K.V.; Kuznetsova, L.K.; Westerhof, E. Influence of ECCD/ECRH-produced superthermal electrons on transport of plasma’s electron cyclotron radiation in tokamak-reactor. In Proceedings of the 14th Joint Workshop on Electron Cyclotron Emission and Electron Cyclotron Heating, Santorini, Greece, 9–12 May 2006; p. 374. [Google Scholar]
  51. Kuznetsova, L.K.; Lazarev, V.B.; Chuyanov, V.A. Numerical simulation of the electron-cyclotron emission spectra for tokamak. Sov. J. Plasma Phys. 1988, 14, 682–685. [Google Scholar]
  52. Fidone, I.; Granata, G.; Giruzzi, G.; Mazzucato, E. Synchrotron radiation loss in a tokamak reactor in the presence of an enhanced electron tail. Nucl. Fusion 1991, 31, 2167–2171. [Google Scholar] [CrossRef]
  53. Bornatici, M. Relativistic Fokker-Planck equation for electron cyclotron radiation. Phys. Scr. 1994, T50, 38. [Google Scholar] [CrossRef]
  54. Cherepanov, K.V.; Kukushkin, A.B. Self-consistent simulation of electron cyclotron radiation transport and superthermal electron kinetics in hot tokamak plasmas. In Proceedings of the 32th EPS Conference on Plasma Physics, Tarragona, Spain, 27 June–1 July 2005. [Google Scholar]
  55. Lloyd, B.; Carolan, P.G.; Warrick, C.D. ECRH-assisted start-up in ITER. Plasma Phys. Control. Fusion 1996, 38, 1627–1643. [Google Scholar] [CrossRef]
  56. Stober, J.; Jackson, G.L.; Ascasibar, E.; Bae, Y.S.; Bucalossi, J.; Cappa, A.; Casper, T.; Cho, M.-H.; Gribov, Y.; Granucci, G.; et al. ECRH-assisted plasma start-up with toroidally inclined launch: Multi-machine comparison and perspectives for ITER. Nucl. Fusion 2011, 51, 083031. [Google Scholar] [CrossRef]
  57. Minashin, P.V.; Kukushkin, A.B.; Khayrutdinov, R.R.; Lukash, V.E. A model of multi-pass absorption of external EC radiation at initial stage of discharge in ITER. EPJ Web Conf. 2015, 87, 03005. [Google Scholar] [CrossRef] [Green Version]
  58. Kurzan, B.; Steuer, K.H.; Suttrop, W. Runaway electrons in a Tokamak: A free-electron maser. Rev. Sci. Instrum. 1997, 68, 423–426. [Google Scholar] [CrossRef]
  59. Minashin, P.V.; Kukushkin, A.B.; Poznyak, V.I. Reconstruction of superthermal electron velocity distribution function from electron cyclotron spectra at down-shifted frequencies in tokamak T-10. EPJ Web Conf. 2012, 32, 01015. [Google Scholar] [CrossRef] [Green Version]
Figure 1. Geometrical parameters, magnetic surfaces structure, and total magnetic field profile (on the right poloidal cross-section of the toroid) and respective profile of electron temperature (on the left poloidal cross-section of the toroid). R0, a—major and minor radii of the plasma column, kelong—elongation, θ, φ—poloidal and azimuthal angles, and Δ(0)—the shift of magnetic axis with respect to the vessel’s toroidal axis (Shafranov shift). Magnetic surfaces are calculated with (3) for the following given moments: magnetic surface radius, ametr(ρ), Shafranov shift, Δ(ρ), triangularity, δ(ρ), and vertical elongation, λ(ρ), which are taken from the ASTRA code calculations of quasi-steady-state ITER-like scenario.
Symmetry 13 01303 g001
Figure 2. Parameters of plasma for the ITER-like scenario: (a) profiles of the electron temperature, Te(ρ), and density, ne(ρ), 1D (i.e., averaged over magnetic surface) total magnetic field, B(ρ), and vacuum magnetic field on the axis, B0; (b) profiles of the moments of magnetic surfaces: half-width of the magnetic surface, ametr, Shafranov shift, Δ, elongation, λ, and triangularity, δ. Equilibrium is calculated using the ASTRA code.
Symmetry 13 01303 g002
Figure 3. Spectral–spatial distribution of the EC power loss for ITER-like scenario with parameters shown in Figure 2 and wall reflection coefficient Rw = 0.9. Boundaries between optically-thick inner plasma and optically-thin outer plasma are shown for two polarizations of the EC waves in plasma: X-mode (solid line) and O-mode (dashed line).
Symmetry 13 01303 g003
Figure 4. Normalized (by maximum value) profiles (27) (solid lines) and corresponding volume averages (dashed lines) for electron temperature (a) (see Table 1) and electron density (b) (see Table 2).
Symmetry 13 01303 g004
Figure 5. Dependence of the maximum frequency defined in (24) (in units of the fundamental cyclotron frequency) on the line-averaged temperature (35) in scenarios with different temperature profiles (see Table 1) and different values of the reflection coefficient. Semitransparent markers correspond to the non-flat density profile, nontransparent markers, to the flat density profile (see Table 2).
Symmetry 13 01303 g005
Figure 6. Self-similarity of ECR transport, calculated using the CYNEQ and CYTRAN codes, for tokamak-reactor conditions with a parabolic profile of electron temperature, different values of the central temperature indicated in the inset, and a flat profile of the electron density (see Table 1 and Table 2 and (27)): (a) radial profile of the net EC power loss density (4) (the color of the curve corresponds to the central temperature indicated in the inset); (b) the corresponding normalized profiles of the net EC power loss density (20); (c) the spectral intensity of the escaping ECR (18); (d) the corresponding normalized spectra (25). The wall reflection coefficient is Rw = 0.6. Plasma equilibrium was calculated using the ASTRA code, where for central temperatures Te(0) = 25 and 35 keV the plasma current was taken Ip = 15 MA, and for Te(0) = 50 keV, Ip = 20 MA.
Symmetry 13 01303 g006
Figure 7. The same as in Figure 6, except the wall reflection coefficient is Rw = 0.9.
Symmetry 13 01303 g007
Figure 8. Mean profiles (28) of the normalized radial distribution of the net EC power loss density (a), and mean spectra (29) of the normalized intensity (b), for the parabolic temperature profile and the flat density profile, and Rw = 0.6 and Rw = 0.9 (see Table 1 and (27)).
Symmetry 13 01303 g008
Figure 9. The same as in Figure 8, but for the advanced profile of electron temperature (see Table 1 and (27)).
Symmetry 13 01303 g009
Figure 10. The same as in Figure 8, but for the ITB profile of electron temperature (see Table 1 and (27)).
Symmetry 13 01303 g010
Figure 11. (a) Profiles of the relative deviation (30) of the normalized profiles of the EC power loss density from the mean normalized profile (28). (b) Profiles of the relative deviation (32) of the normalized spectral intensity of the escaping ECR from the mean normalized spectrum (29) for the parabolic profile of Te and the flat profile of ne (see Table 1) and different values of Rw. The color of the curve corresponds to the Rw value in the inset, the line type of the curve corresponds to the code shown in the inset.
Symmetry 13 01303 g011
Figure 12. Volume-averaged deviation (31) of the normalized profile of the net EC power loss density from the mean normalized profile (28) (a), and spectrum-averaged deviation (33) of the normalized spectra of EC radiation intensity from the mean normalized spectrum (29) (b), as a function of the wall reflection coefficient for the parabolic profile of the electron temperature and the flat profile of electron density (see Table 1 and (27)).
Symmetry 13 01303 g012
Figure 13. Comparison of the accuracy of the self-similarity for the flat (non-transparent thin lines) and non-flat (transparent thick lines) electron density profile, parabolic temperature profile with different central temperatures in the range 20–55 keV (see Table 1 and Table 2 and (27)). (a) Mean profiles (28) of the normalized radial distribution of the net EC power loss density; (b) mean spectra (29) of the normalized intensity of EC radiation; (c) deviation (30) of the normalized profile of the net EC power loss density from the mean normalized profile; and (d) deviation (32) of the normalized spectra of EC radiation intensity from the mean spectrum.
Symmetry 13 01303 g013
Figure 14. Self-similarity of ECR transport, calculated using the CYNEQ, CYTRAN, and RAYTEC codes, for tokamak-reactor conditions with the advanced profile of electron temperature, different values of the central temperature indicated in the inset, and a peaked profile of the electron density (see Table 1 and (27) in this paper, and case B and C in Table 1 and Figure 2 in [35]), wall reflection coefficient Rw = 0.8, R0 = 8.5 m, a = 2.7 m, kelong = 1.7, and B0 = 6 T: (a) radial profile of the net EC power loss density (4) (the color of the curve corresponds to the central temperature indicated in the inset) and (b) the corresponding normalized profiles of the net EC power loss density (20). CYNEQ code takes into account plasma equilibrium calculated using the ASTRA code for Ip = 20 MA.
Symmetry 13 01303 g014
Figure 15. The same as in Figure 14, but for flat density profile, there are different central temperatures (indicated in the inset) and different central electron densities (see case A in Table 1 and Figure 3 in [35]).
Symmetry 13 01303 g015
Figure 16. Radial profile of the net EC power loss density (4), calculated using the CYNEQ and RAYTEC codes for tokamak-reactor conditions with the advanced profile of electron temperature and the peaked electron density profile (see case B in Table 1 and Figure 2 in [35]), Rw = 0.8, R0 = 8.5 m, a = 2.7 m, kelong = 1.7, B0 = 6 T, and Ip = 20 MA. CYNEQ calculations for three approximations of the magnetic field (0D, 1D, and 2D (11)–(13)) were carried out with account of plasma equilibrium (nonzero Shafranov shift, Δ, brown lines) and with neglect of equilibrium effects (zero Shafranov shift, blue lines).
Symmetry 13 01303 g016
Figure 17. Self-similarity of ECR power loss density profiles, calculated using the CYNEQ, CYTRAN, and EXACTEC codes, for tokamak-reactor conditions with the parabolic profile of electron temperature, different values of the central temperature indicated in the inset, and a flat profile of the electron density (see Table 1 and Table 2 and (27) in this paper, and the graphs on the left side of Figures 6 and 7 in [22]), wall reflection coefficient Rw = 0.8, R0 = 6.2 m, a = 2.0 m, kelong = 1.0, and B0 = 5.3 T: (a) radial profile of the net EC power loss density (4) (the color of the curve corresponds to the central temperature indicated in the inset); (b) the corresponding normalized profiles of the net EC power loss density (20). CYNEQ code takes into account plasma equilibrium calculated using the ASTRA code for Ip = 10 MA, Te(0) = 22.5 keV and Ip = 15 MA, and Te(0) = 45 keV.
Symmetry 13 01303 g017
Figure 18. The same as in Figure 17 but for the advanced electron temperature profile.
Symmetry 13 01303 g018
Figure 19. Radial profile of the net EC power loss density (4), calculated using the CYNEQ and EXACTEC codes for tokamak-reactor conditions with the parabolic profile of electron temperature, Te(0) = 22.5 keV, and the flat electron density profile (see plots on the left side of Figure 6 in [22]), Rw = 0.8, R0 = 6.2 m, a = 2.0 m, kelong = 1.0, B0 = 5.3, and Ip = 10 MA. CYNEQ calculations for three approximation of the magnetic field (0D, 1D, and 2D (11)–(13)) were carried out with account of plasma equilibrium (nonzero Shafranov shift, Δ, brown lines) and with neglect of equilibrium effects (zero Shafranov shift, blue lines).
Symmetry 13 01303 g019
Figure 20. The same as in Figure 6 but the CYNEQ results are compared with the locally applied Trubnikov formula (LATF) [25].
Symmetry 13 01303 g020
Figure 21. The same as in Figure 6 but for the absorption coefficient (36).
Symmetry 13 01303 g021
Table 1. Parameters of the electron temperature profile (27).
Electron Temperature Profile
Edge and Central
Values
ParabolicAdvancedITB
βT = 2.0, γT = 1.5βT = 5.4, γT = 8.0βT = 9.3, γT = 16.1
Te(1), keVTe(0), keV<Te>V, keV T e e f f , keV<Te>V, keV T e e f f , keV<Te>V, keV T e e f f , keV
0.01208.011.88.012.410.014.0
2510.014.710.015.512.517.5
3012.017.712.018.615.021.0
3514.020.614.021.717.524.5
4016.023.616.024.820.028.0
4518.026.518.027.922.531.5
5020.029.520.031.025.035.0
5522.032.422.034.127.438.5
Table 2. Parameters of the electron density profile (27).
Flat ProfileNon-Flat Profile
βn = 2.0, γn = 0.1βn = 1.5, γn = 0.5
ne(0), 1020 m−31.101.00
ne(1), 1020 m−30.500.10
<ne>V, 1020 m−31.050.65
n e e f f , 1020 m−31.070.77
Table 3. Total (i.e., volume-integrated) EC power loss for ITER-like tokamak-reactor with plasma parameters from Table 1, calculated using the CYNEQ code, for different approximations of the magnetic field 0D, 1D, and 2D (11)–(13), and CYTRAN code, for constant magnetic field, 0D approximation (13), for different values of wall reflection coefficient, Rw.
Te profileRwTe(0), keV
253550
PEC, MW
CYNEQCYTRANCYNEQCYTRANCYNEQCYTRAN
0D1D2D0D0D1D2D0D0D1D2D0D
parabolic0.610.59.19.27.323.519.920.216.057.049.550.537.3
0.79.07.77.96.320.317.117.414.049.643.043.932.8
0.87.26.26.35.116.313.814.011.540.535.135.827.3
0.94.84.14.23.511.19.49.58.028.124.424.819.4
advanced0.614.913.013.410.133.828.829.722.983.372.674.854.8
0.712.711.111.58.829.124.825.620.072.563.265.148.3
0.810.28.99.27.223.420.020.716.559.251.653.240.2
0.96.85.96.14.915.913.614.111.541.335.937.128.7
ITB0.618.616.717.612.242.737.539.427.8106.595.599.767.6
0.715.914.215.010.636.732.233.924.392.382.886.659.6
0.812.611.312.08.629.425.827.219.975.167.470.549.4
0.98.47.58.05.919.917.518.513.952.046.748.935.2
Publisher’s Note: MDPI stays neutral with regard to jurisdictional claims in published maps and institutional affiliations.

