Article

Atoms in Highly Symmetric Environments: H in Rhodium and Cobalt Cages, H in an Octahedral Hole in MgO, and Metal Atoms Ca-Zn in C20 Fullerenes

1
Physics Department, Göztepe Kampus, Marmara University, Istanbul 34772, Turkey
2
Chemistry Department, University of Virginia, Charlottesville, VA 22902, USA
*
Author to whom correspondence should be addressed.
Symmetry 2021, 13(7), 1281; https://doi.org/10.3390/sym13071281
Submission received: 25 June 2021 / Revised: 11 July 2021 / Accepted: 14 July 2021 / Published: 16 July 2021
(This article belongs to the Section Chemistry: Symmetry/Asymmetry)

Abstract

:
An atom trapped in a crystal vacancy, a metal cage, or a fullerene might have many immediate neighbors. Then, the familiar concept of valency or even coordination number seems inadequate to describe the environment of that atom. This difficulty in terminology is illustrated here by four systems: H atoms in tetragonal-pyramidal rhodium cages, H atom in an octahedral cobalt cage, H atom in a MgO octahedral hole, and metal atoms in C20 fullerenes. Density functional theory defines structure and energetics for the systems. Interactions of the atom with its container are characterized by the quantum theory of atoms in molecules (QTAIM) and the theory of non-covalent interactions (NCI). We establish that H atoms in H2Rh13(CO)243− trianion cannot be considered pentavalent, H atom in HCo6(CO)151− anion cannot be considered hexavalent, and H atom in MgO cannot be considered hexavalent. Instead, one should consider the H atom to be set in an environmental field defined by its 5, 6, and 6 neighbors; with interactions described by QTAIM. This point is further illustrated by the electronic structures and QTAIM parameters of M@C20, M=Ca to Zn. The analysis describes the systematic deformation and restoration of the symmetric fullerene in that series.

1. Introduction

1.1. Background

Chemical species can be systematically described with the assumption that individual atoms can be bound to specific numbers of neighbors. Local geometry and the strength of bonds are easily rationalized by, for example, the tetravalency of carbon, the divalency of oxygen, and similar assignments to other common atoms. Departures from such simple counts are exceptional (though not rare) and require special description. Molecules with larger than normal numbers of bound partners, i.e., “hypervalent compounds”, were identified by Musher [1]. Many of these species may be written as XnGYm where G is a member of groups 14, 15, and 16. This includes for example ClF3, F3PO, PF5, XeF6, and IF7; these species have unusual tri-, penta- or hepta-valency, with the number of valence pairs in the neighborhood of a central atom exceeding the familiar value of four. If all bonds are covalent and we adopt the Lewis model of pair bonding, then, from the elementary valence-bond view, d atomic orbitals (AOs) are needed to mix with s and p AOs to form local hybrids on the central atom. An alternative representation assigns ionic structures to the ligands, so that trigonal-bipyramidal PF5 for example is assigned F3P2+ (F1−)2 with two negatively charged fluorides at the poles, and three PF bonds and a lone pair in the equatorial plane. These conceptual alternatives have been discussed mainly in pedagogical settings [2,3]. The question of the nature of bonding in such species is evaded by the noncommittal term “hypercoordinate” species apparently first coined by Schleyer [4].
Hypercoordinated species need not display hypervalence, whether involving d atomic orbitals or an expanded octet. High coordination numbers can be achieved by trapping a species in a strongly coordinating medium. This trap may be a cage, organic or metalorganic, or a hole in an otherwise orderly solid. In this work we examine H atoms in an oxide hole in MgO, in cages of rhodium atoms as in H2Rh13CO243− and of Co atoms as in HCo6(CO)151−. We study a wider range of atoms within C20 fullerenes.

1.2. Hypercoordinated H Atom

The hydrogen atom takes part in a range of interactions beyond its normal monovalence/monocoordination, including a number of forms of hydrogen bonding, agostic interactions, hydride bridging, and multicenter bonding. Kühl [5] has reviewed this behavior.
H atoms trapped within metal clusters have been ascribed coordination numbers as high as 4, 5, and 6 [6,7,8,9].
In solids, high coordination numbers for H atom have been reported. Quoting from Janotti and van der Walle [10],
“[We] discuss hydrogen as a substitutional impurity in the binary metal oxides ZnO and MgO. Contrary to expectations, hydrogen on a substitutional oxygen site forms genuine chemical bonds with all of its metal—atom nearest-neighbours, in a truly multicoordinated configuration.”
Their computed charge density leads the authors to conclude that
“hydrogen is equally bonded to all four Zn neighbours in ZnO, and to all six neighbours in MgO.”
The six-fold hypercoordination in MgO has, to our knowledge, not been further examined.

1.3. Endohedral Atoms in Fullerenes

Atoms, clusters, and molecular species have been incorporated in fullerenes [11]. The most thoroughly studied inclusion complexes employ larger fullerenes (C60 and greater). Molecules placed in C60 include H2, HF, H2O, and HF. Recently methane@C60 has been reported [12], and target species with captives O2, N2, CO, NO, ammonia, methanol, formaldehyde, and carbon dioxide are sought. Larger molecules can be enclosed in larger fullerenes, with one extreme being C60 in C240 [13].
Electronic structure modeling of endohedral complexes of fullerenes Cn with n ≥ 60 begins with the work of Cioslowski and Fleishmann on C60 species [14]. They characterized the charge distribution by RHF and a mixed basis (4-31G for C atoms and the DZP basis for guests). Their calculations for inclusion complexes of closed shell species F1−, Ne, Na1+, Mg2+, and Al3+ complexes imposed icosahedral symmetry for the most part; however, an estimate of the force constants revealed geometrical instability (symmetry breaking) for all species other than Ne@C60. Investigation of finite displacements of the Na cation in Na(+)@C60 found a minimum energy geometry with that ion 0.660 Å from the center point. Atoms-in-molecules analysis (AIM) [15,16] for Ne@C60 found all C atoms connected to Ne by interaction lines (often called bond paths), which are loci of points which have maximum density in two dimensions; we call these features “ridges” in the density. Intuitively recognizable C-C and C=C bonds correspond to density ridges in the fullerene shell. These are characterized by critical points, for which ∇ρ = 0, which have maxima normal to the interaction line and a minimum along the line. Substantial densities are found at these points, 0.266 and 0.308 atomic units respectively. Sixty other interaction lines were found, each connecting a C atom to the central neon atom. Because such lines can hardly be identified as bonds, an alternative terminology is called for; perhaps “interaction lines” would serve. Following Shahbazian [17], we refer to the CPs on such paths as “line critical points”, or LCPs. These LCPs have small density values, 0.0024 atomic units. The corresponding Laplacian values (−0.563 and −0.753 for C-C and C=C BCPs, and +0.0145 for the LCP) indicate normal covalent bonding in the cage and weak closed shell—closed shell interactions between the Ne atom and the fullerene cage. Cioslowski and Fleishmann [14] remarked that a reasonable model of their results would represent C60 as a spherical shell of charge, polarizable and responsive to the central atom or ion.
Jalife et al. reviewed noble gas inclusion complexes in fullerenes [18]. In the intervening three decades, X-ray structures for C60 inclusion complexes had become available for He [19], Xe [20] and Kr [21]. The QTAIM analysis reported by Cerpa et al. [22] revealed a multitude of cage C-to-noble gas paths and located associated line critical points with very small densities and small positive Laplacians. These authors remarked that the number of bond paths and BCPs was a consequence of the symmetry of the cage and had no necessary correspondence to chemical constructs. The apparent paradoxes in application of QTAIM to endohedral complexes was further explored by Popov and Dunsch [23]. Estrada-Salas and Valladares [24] studied endohedral and exohedral complexes of Mn, Fe, Co, Cu, and Zn with C60, optimizing structures with BPW91 and a DNP basis.
Modeling of neutral alkali metal and transition metal inclusion complexes in C20 has been pursued for more than a decade. An and co-authors [25] studied Li, Na, K, Rb, and Cs atoms in icosahedral C20 with DFT (PW91/DNP). Garg and co-workers [26] evaluated structures, energies, and magnetic moments with an alternative DFT model PBE with a pseudo potential representing core electrons and a DZP basis for valence electrons. Baei et al. [27] treated C20 inclusion complexes of transition metals Sc-Zn with DFT (PBE/6-31G(d) for C, LANL2DZ for metals), finding that inclusion complexes M@C20 of the later transition metals (Co-Zn) were not stable compared to the isolated metal atom M and the C20 fullerene. Vibrational analysis showed that the centrosymmetric structures for Sc, Cr, Fe, Ni had saddle-point character and would spontaneously break symmetry. Gonzalez, Lujan, and Beran [28] modeled TM@C20 for group 11 and 12 transition metals, Zhao, Li, and Wang [29] considered a broad sample of transition metals with configurations in 3d (Sc-Zn), 4d (Y-Cd) and 5d (Lu-Hg) shells, with the PBE functional and a numerical basis of double-zeta quality but apparently no relativistic corrections. They found maximum spin polarization for Mn, and most effective binding of Ti and V. Sarkar, Paul, and Misra [30] treated transition metals Ti, V, Cr, Mn, Fe, Co, and Ni in all spin states with UB3LYP expressed in a mixed basis, 6-31++G(d,p) for C and LANL2DZ for metals. They found that the structures all retained centrosymmetry and that maximum multiplicity state was most stable in every case except for Cr and Fe, which prefer the triplet. While details of binding energy and structure are not disclosed, the authors provide the range of M-C distances; these show that the endohedral complexes are nearly not perfectly centrosymmetric.
In this report we address first the description of coordination of H atom captured in metal cages and in a salt crystal [6,7,8,9,10]. QTAIM provides a unified description of the environment of the captured H atom. Despite claims to the contrary, the QTAIM results show that it is misleading to use the chemical terminology of pair bonds in these cases. Such time-honored representations of molecules are even less well suited to the description of the environment of atoms isolated in a small fullerene. The structures of C20 systems enfolding metal atoms are not systematically established, nor is the thermodynamics of capture well established.

2. Systems Studied

The choice of systems was guided by theoretical concerns—the characterization of H atom confined in a structure with many immediate neighbors—and the need to refine the description of structure and bonding in the smallest metal atom endohedral fullerenes. Such analysis must precede the study of electrical, magnetic, and spectroscopic properties, which for these systems may be particularly interesting and useful.

2.1. H Atom Capture in Inorganic Vacancies

The high-symmetry environments we have chosen include a rhodium trianion with H atoms occupying nearly square-pyramidal cage sites [H2Re13(CO)24]3−, [7] and a cobalt nearly-octahedral cage of cobalt atoms enclosing a single H atom [HCo6(CO)15)]1−, [8,9] a fragment of MgO crystal with a H atom occupying a hole left by removal of an O atom, [10] and fullerenes C20 with inclusion complexes of single atoms including uncharged transition metals and noble gases. We have experimental data for some of these species [7,9] and have constructed some computational models for others to advance the discussion. In the following discussion we provide brief initial discussions of these systems.

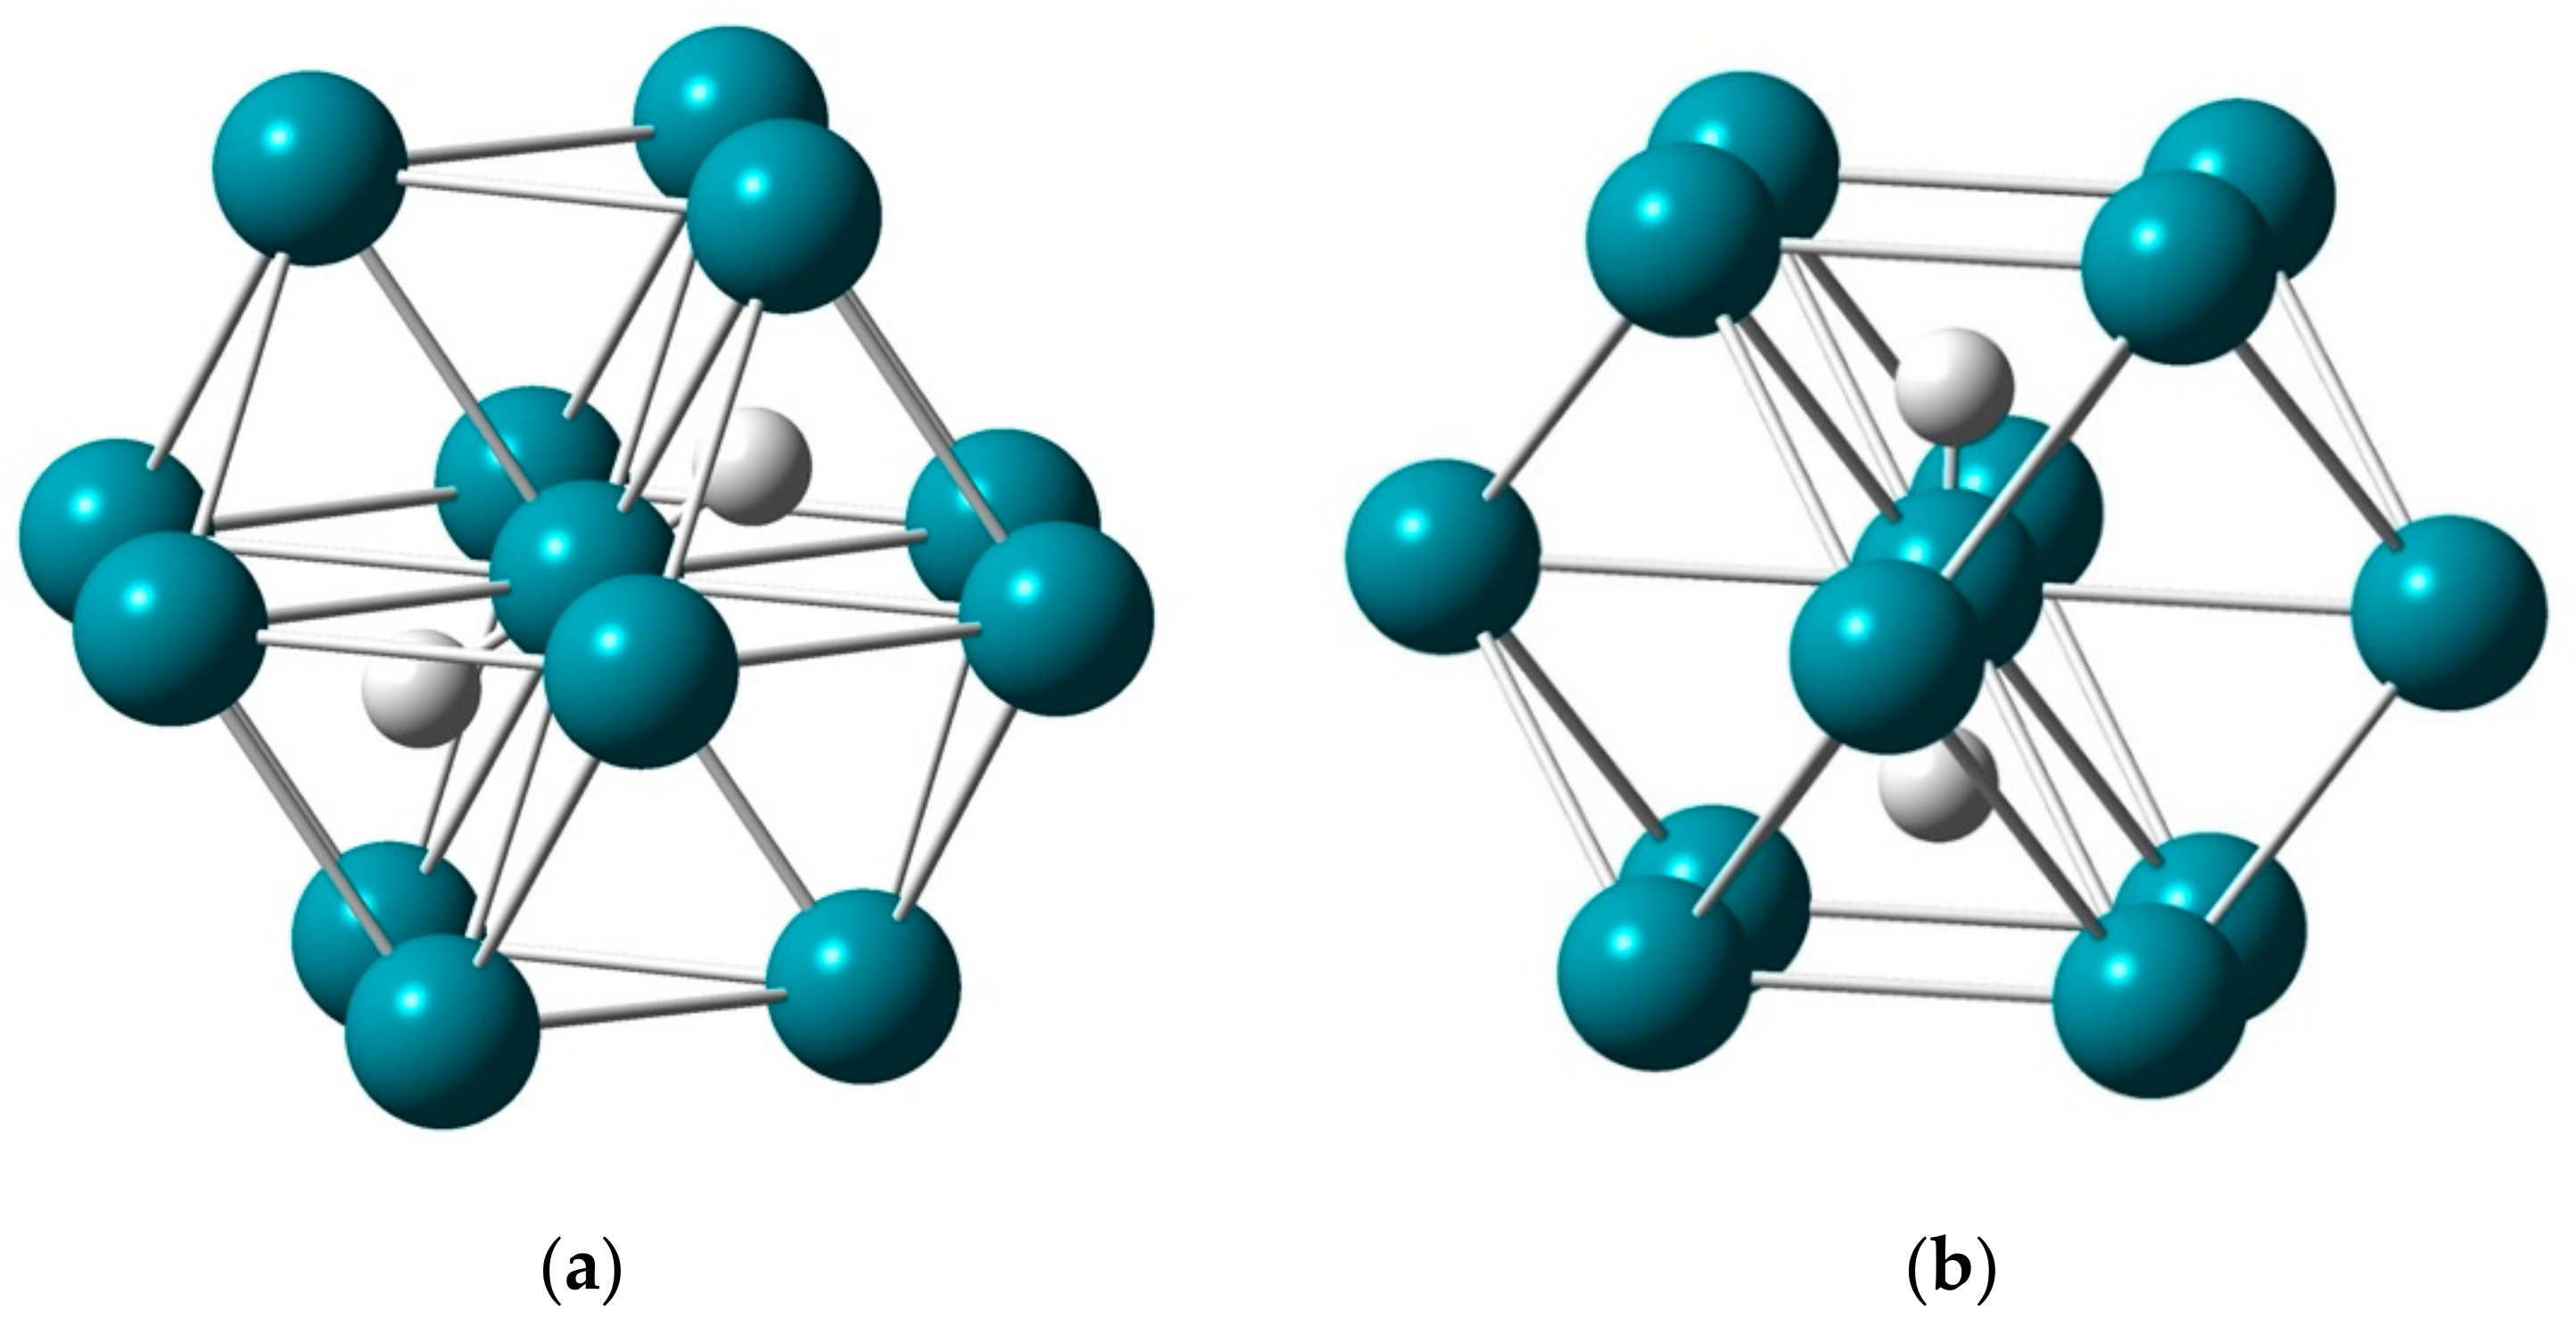
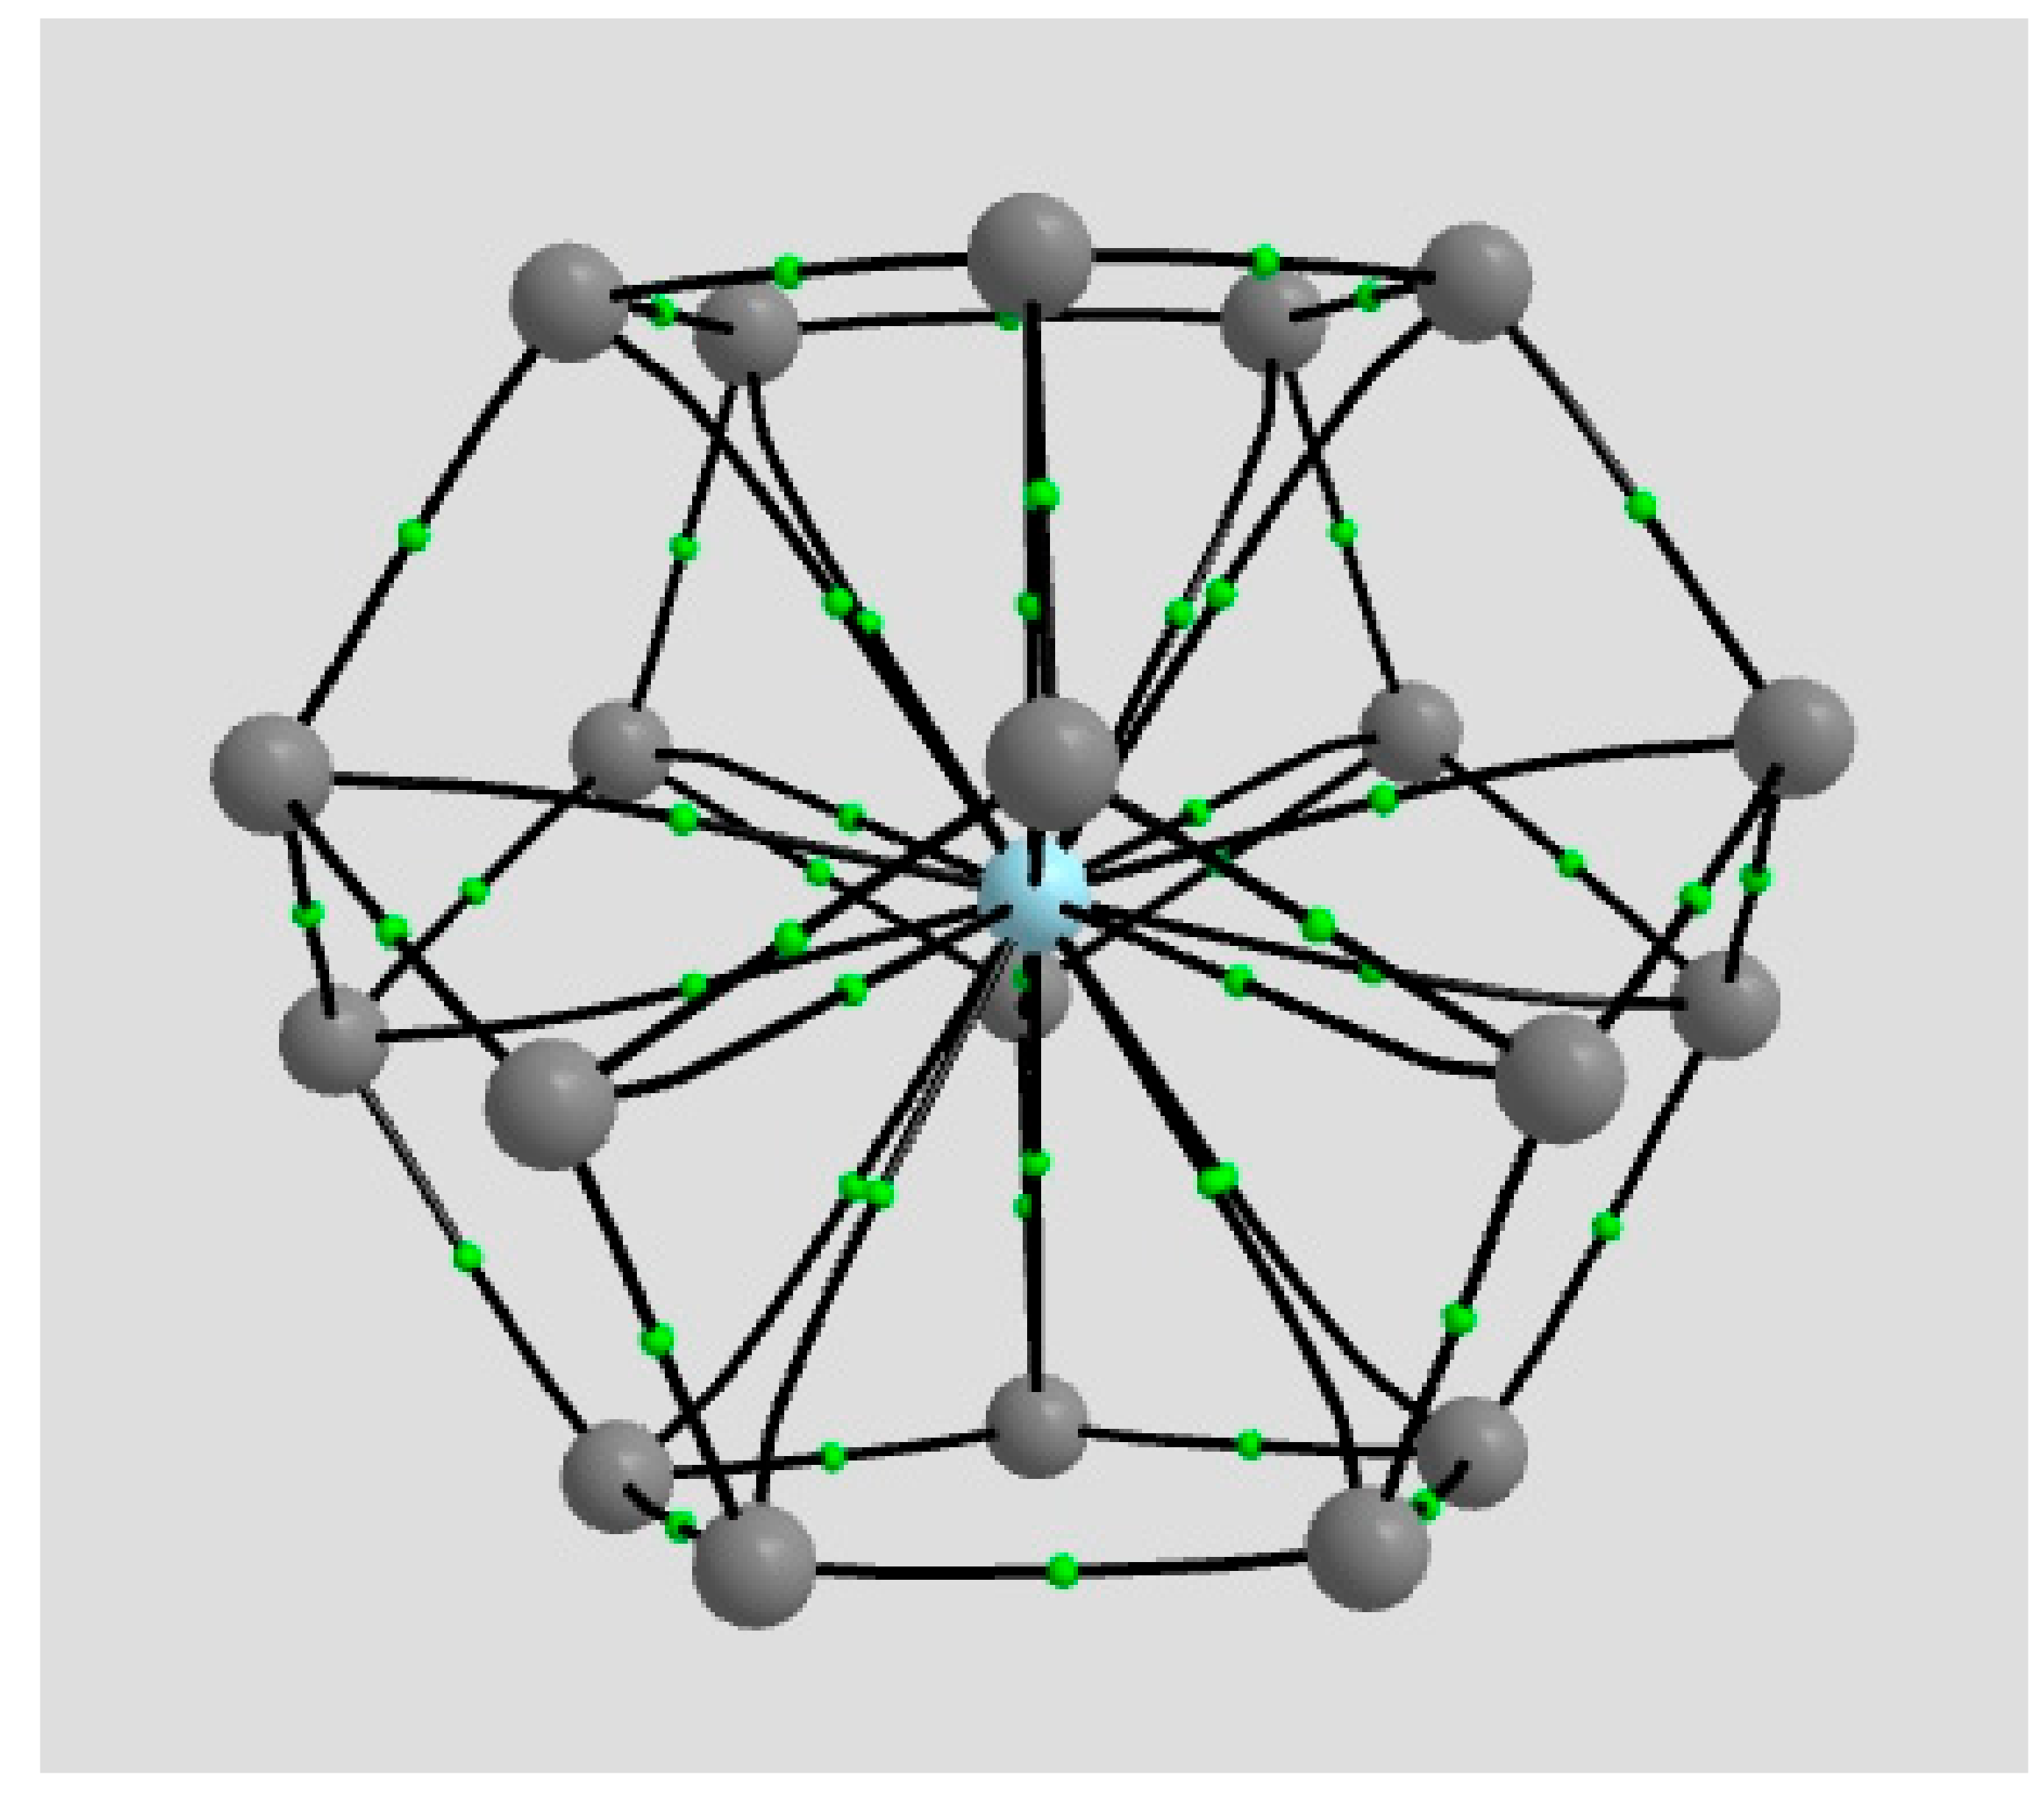
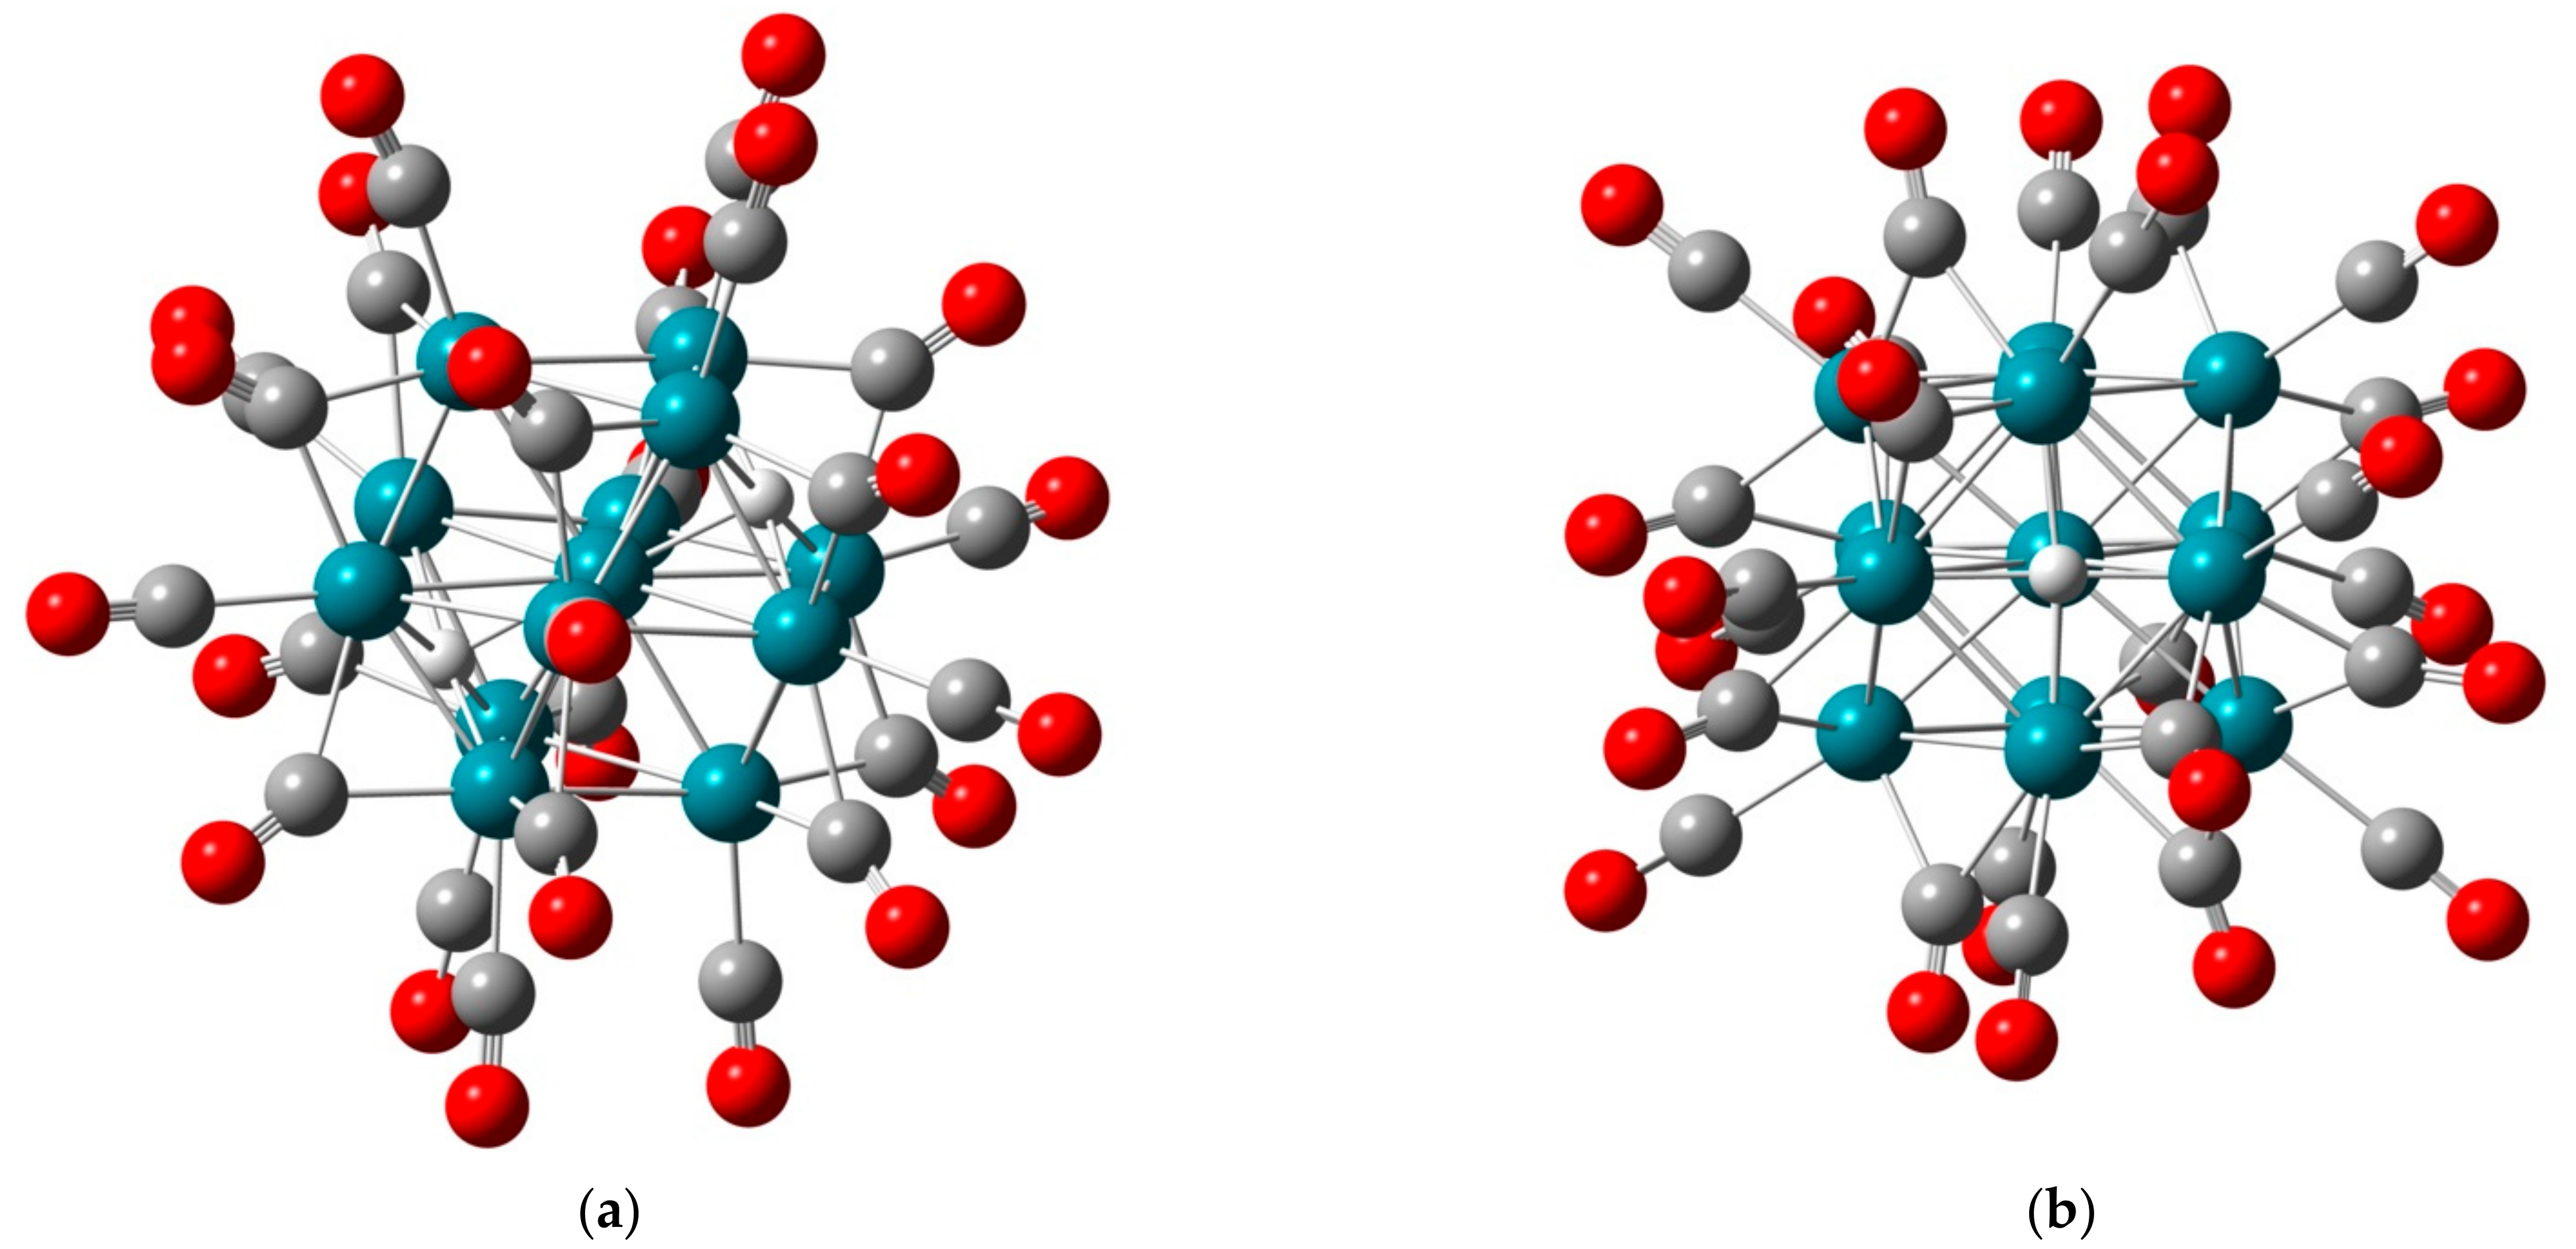
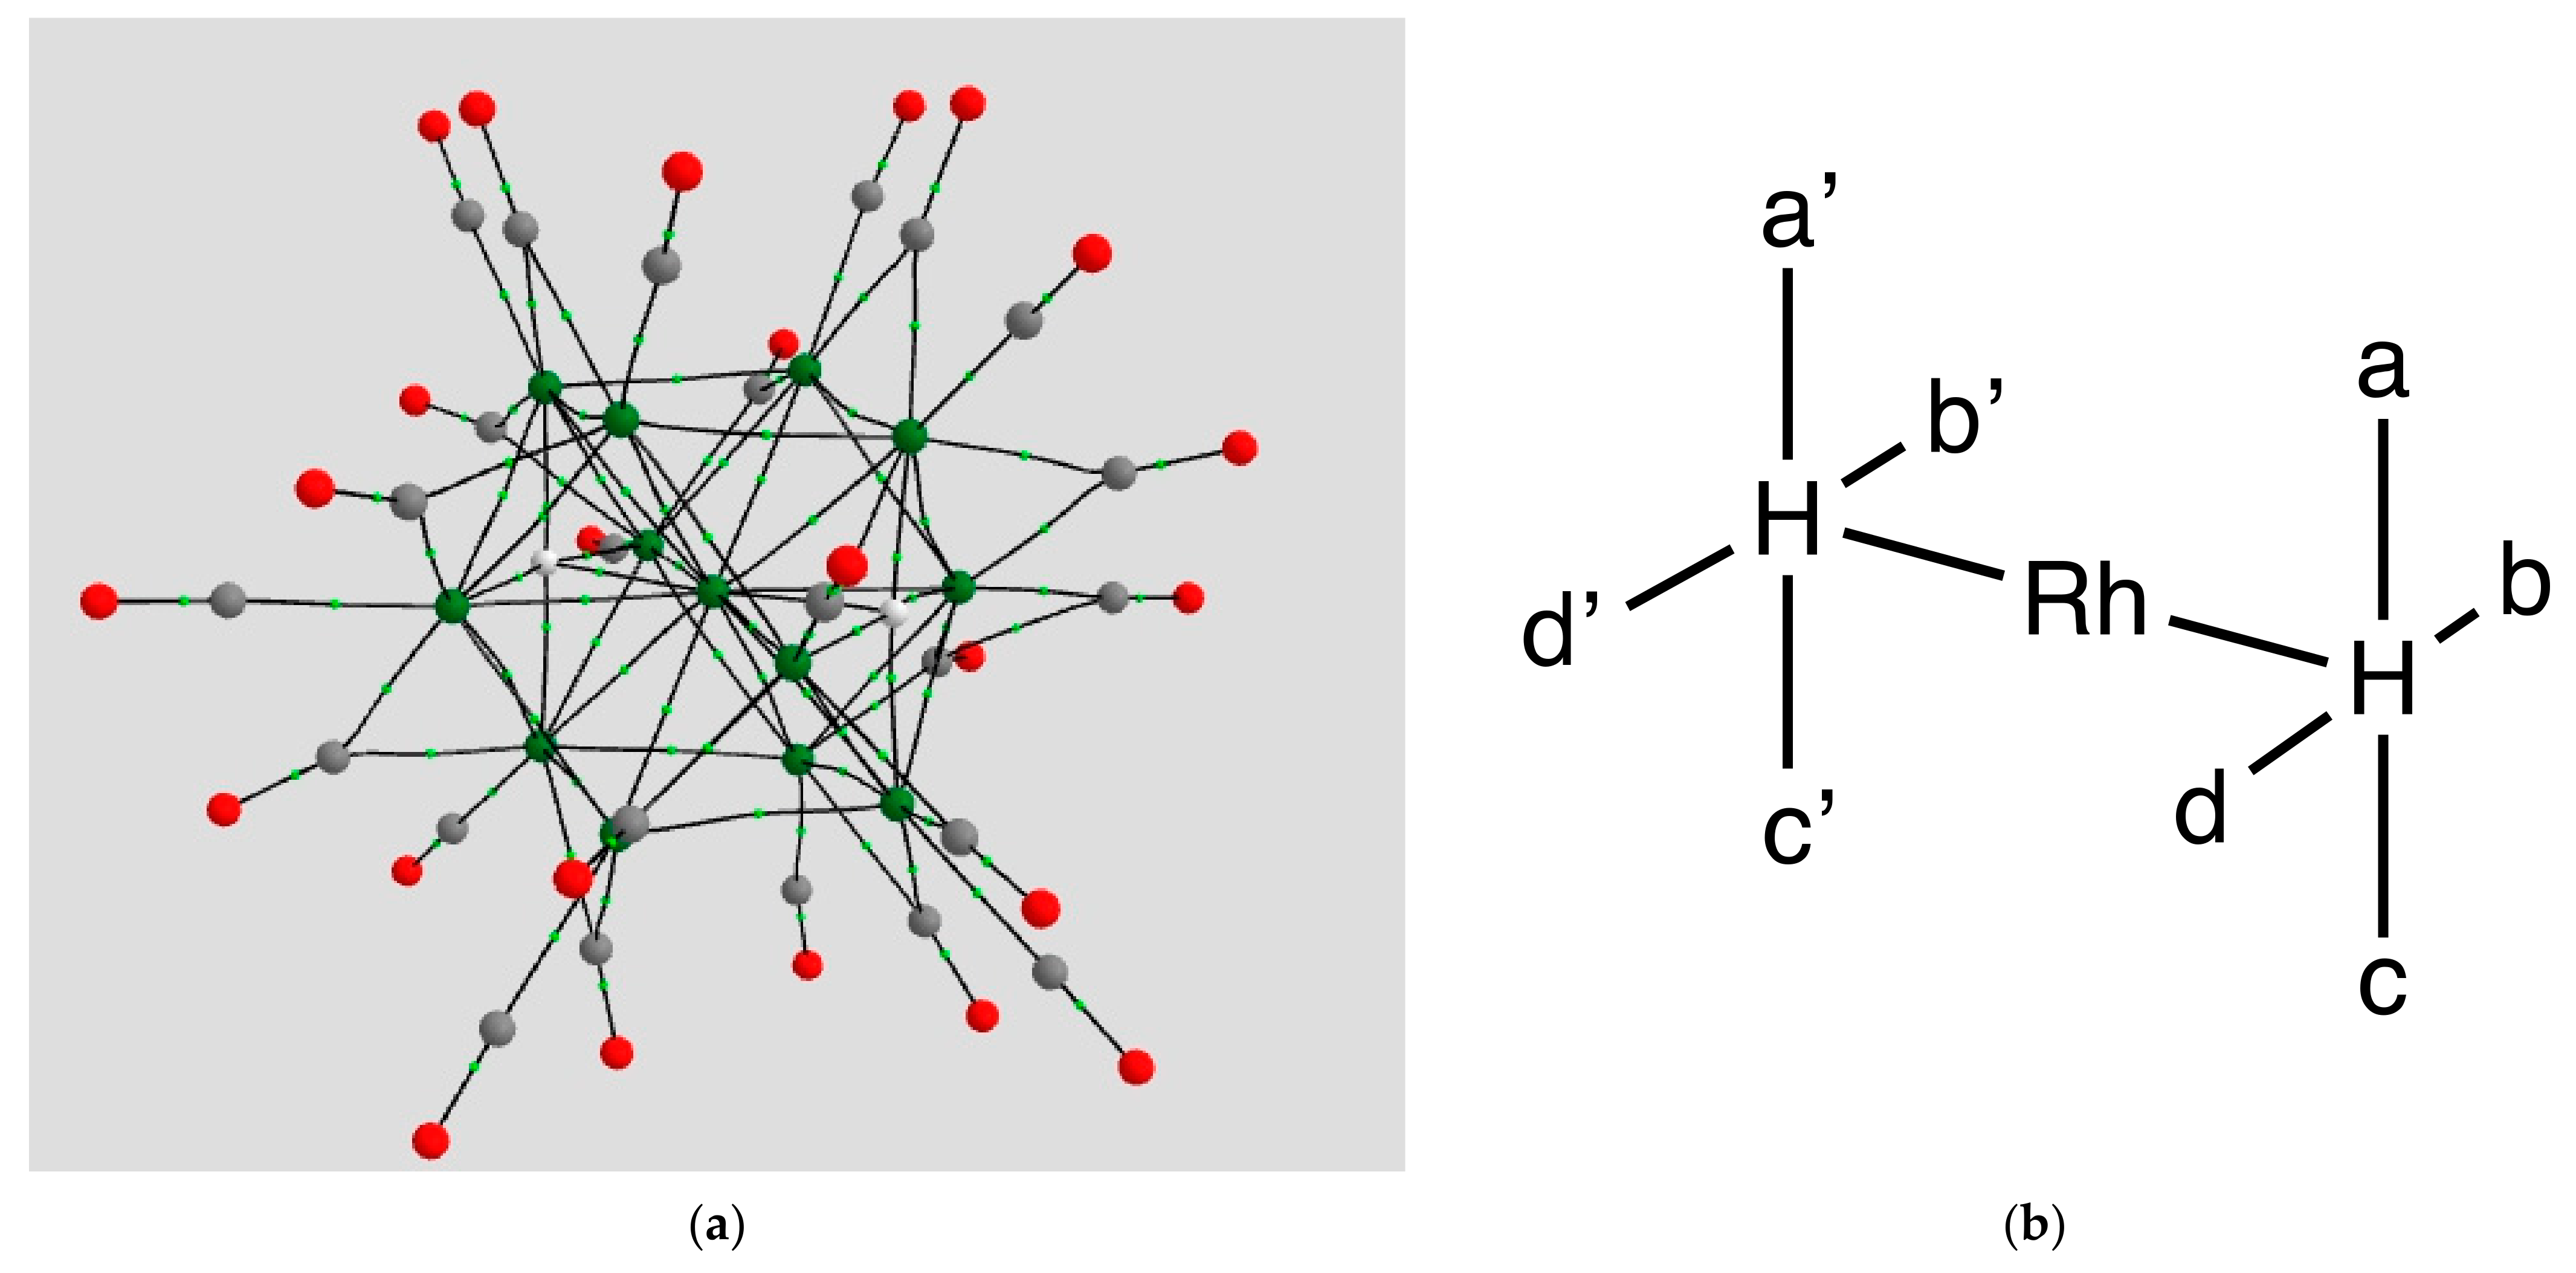
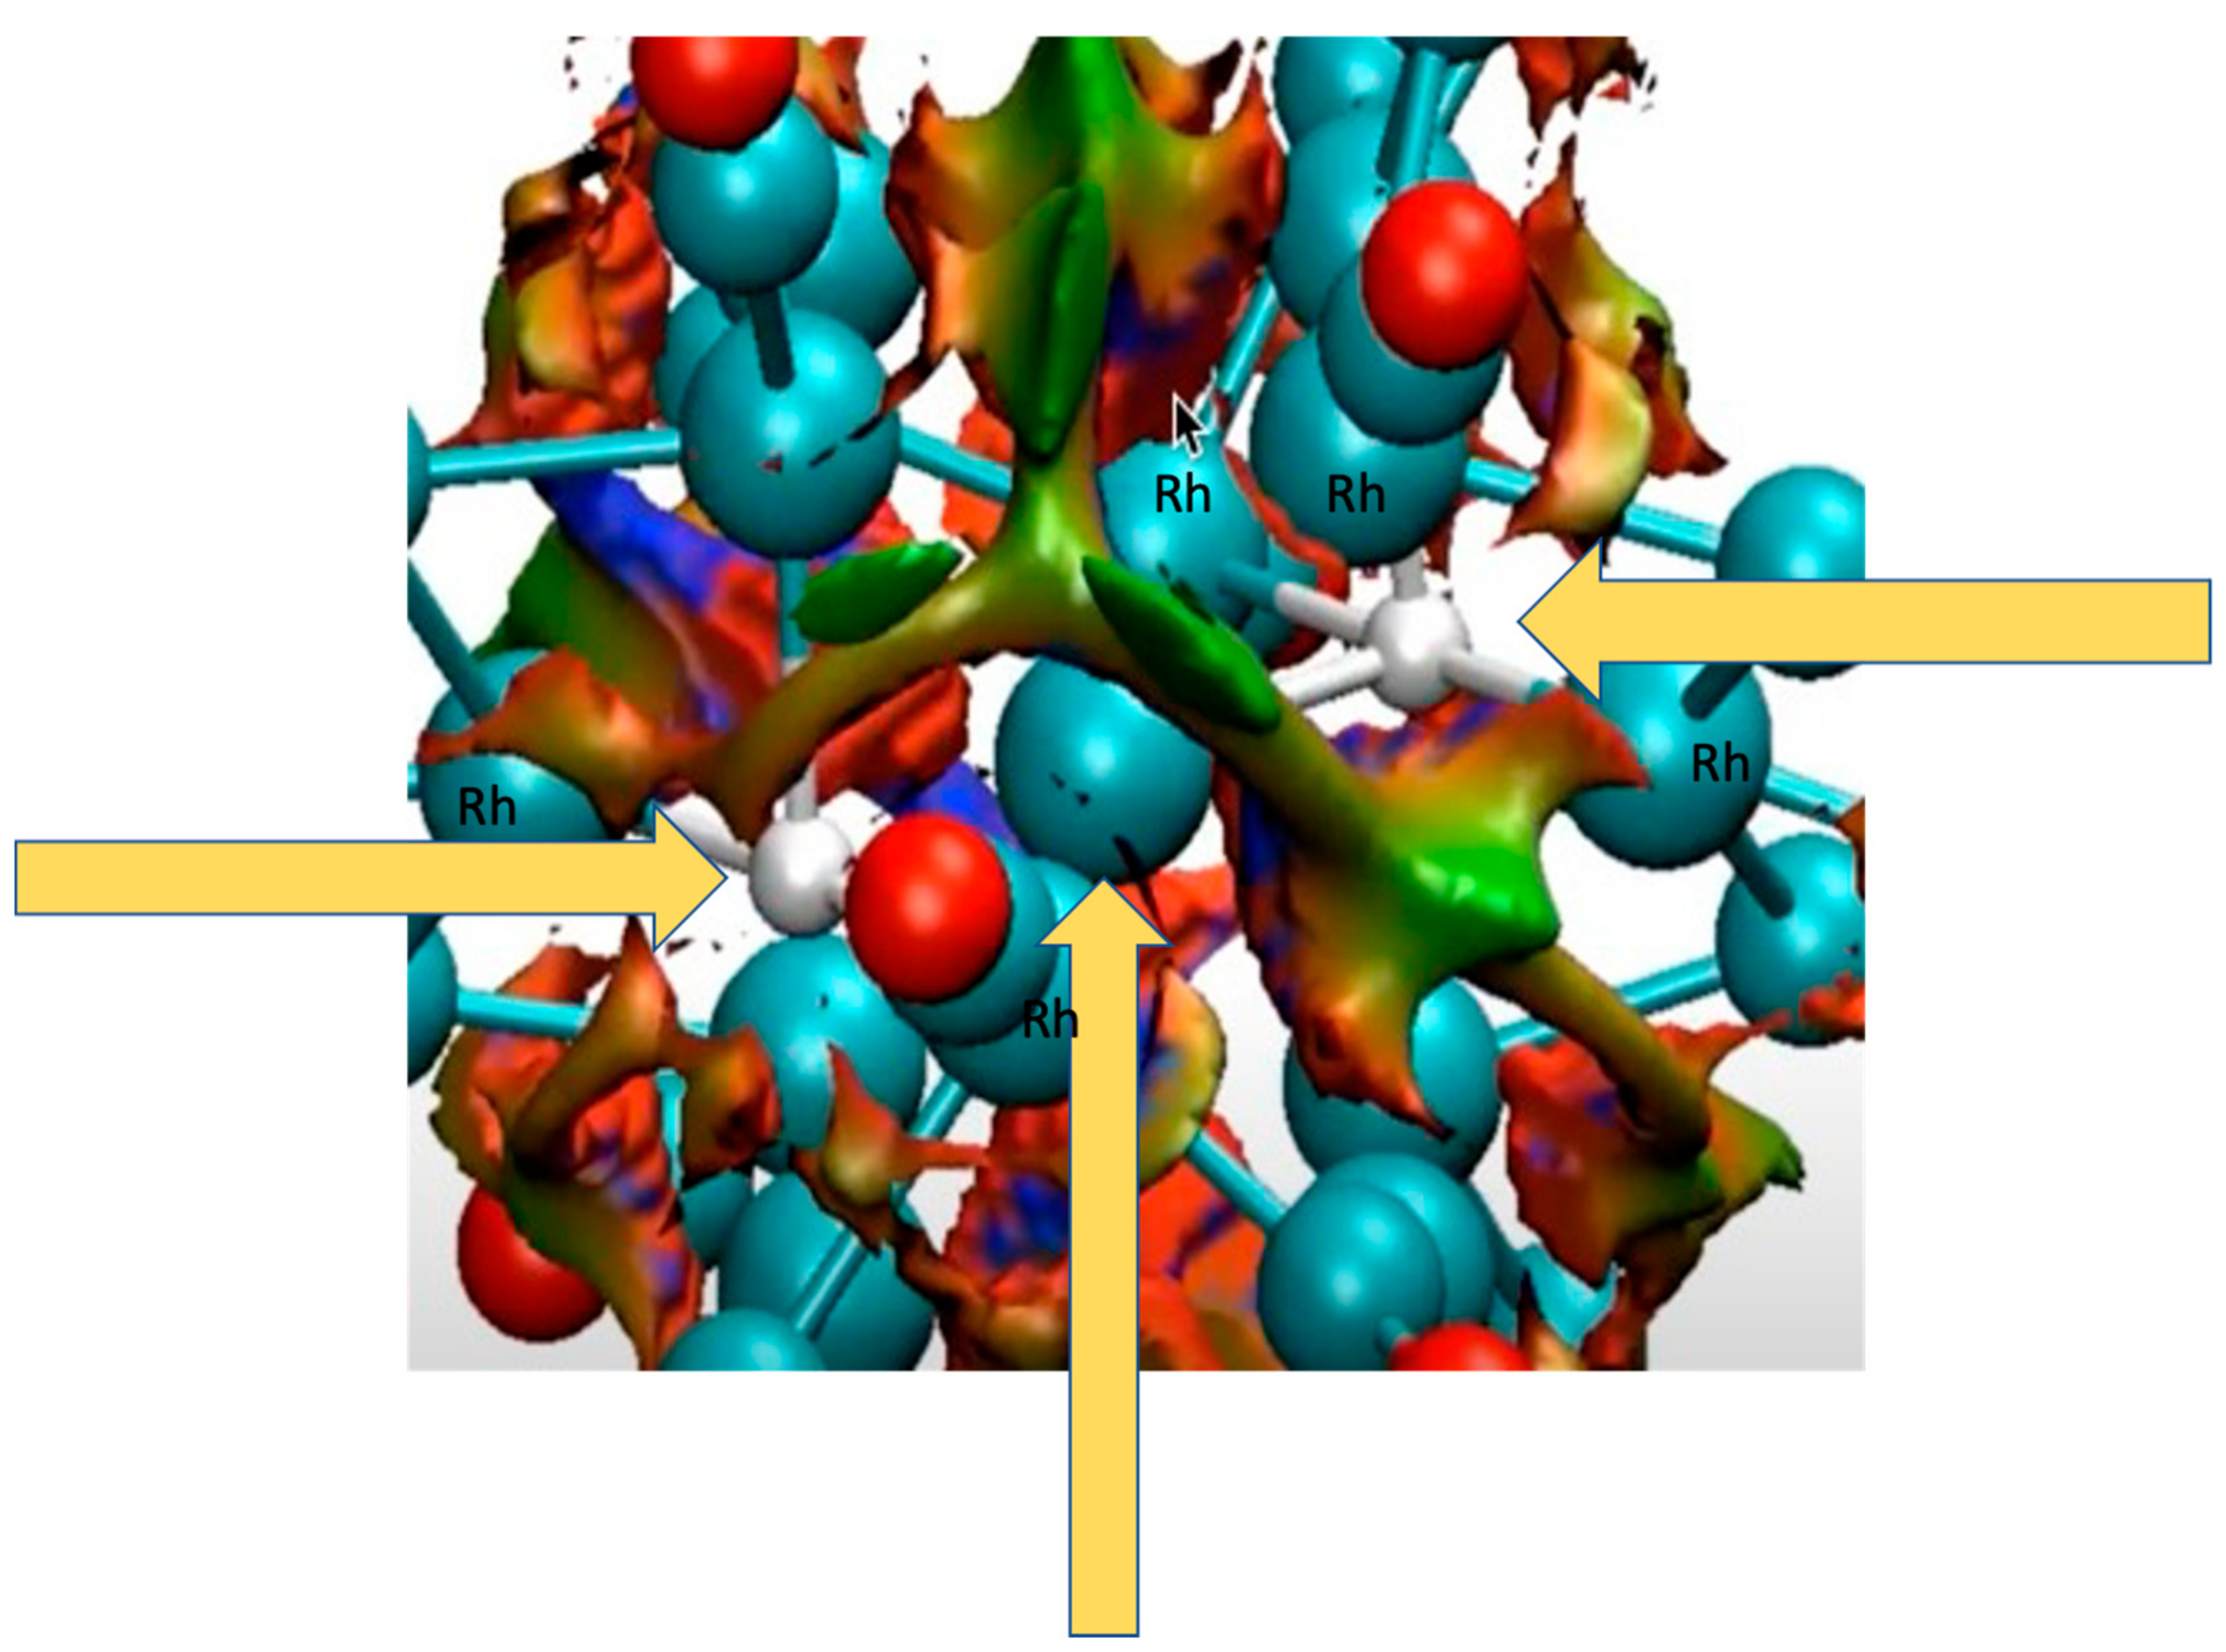
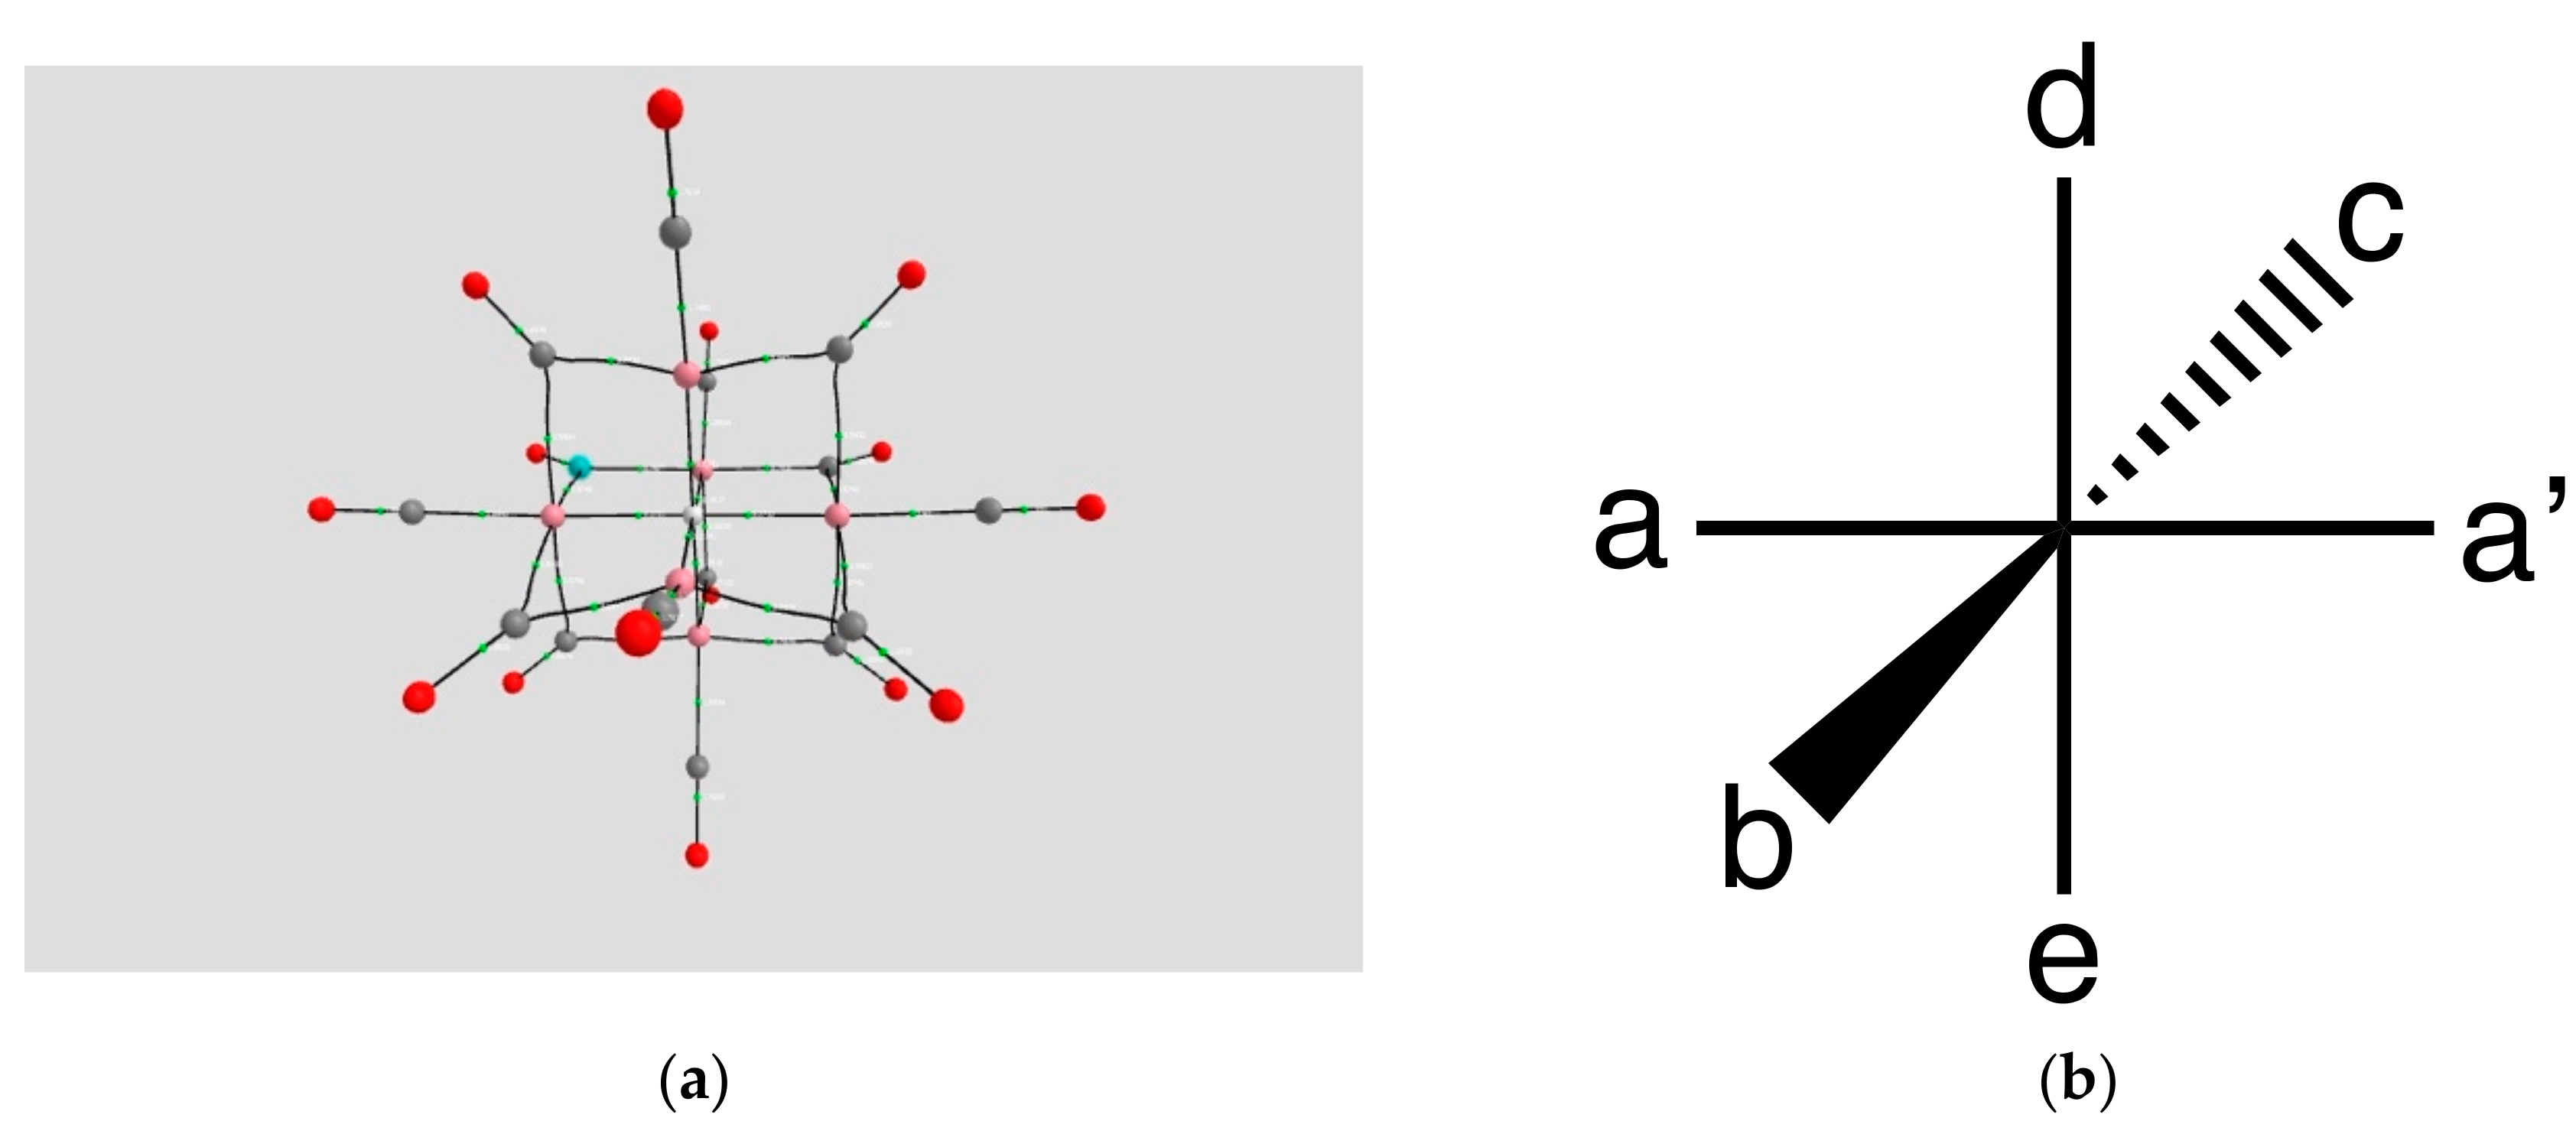
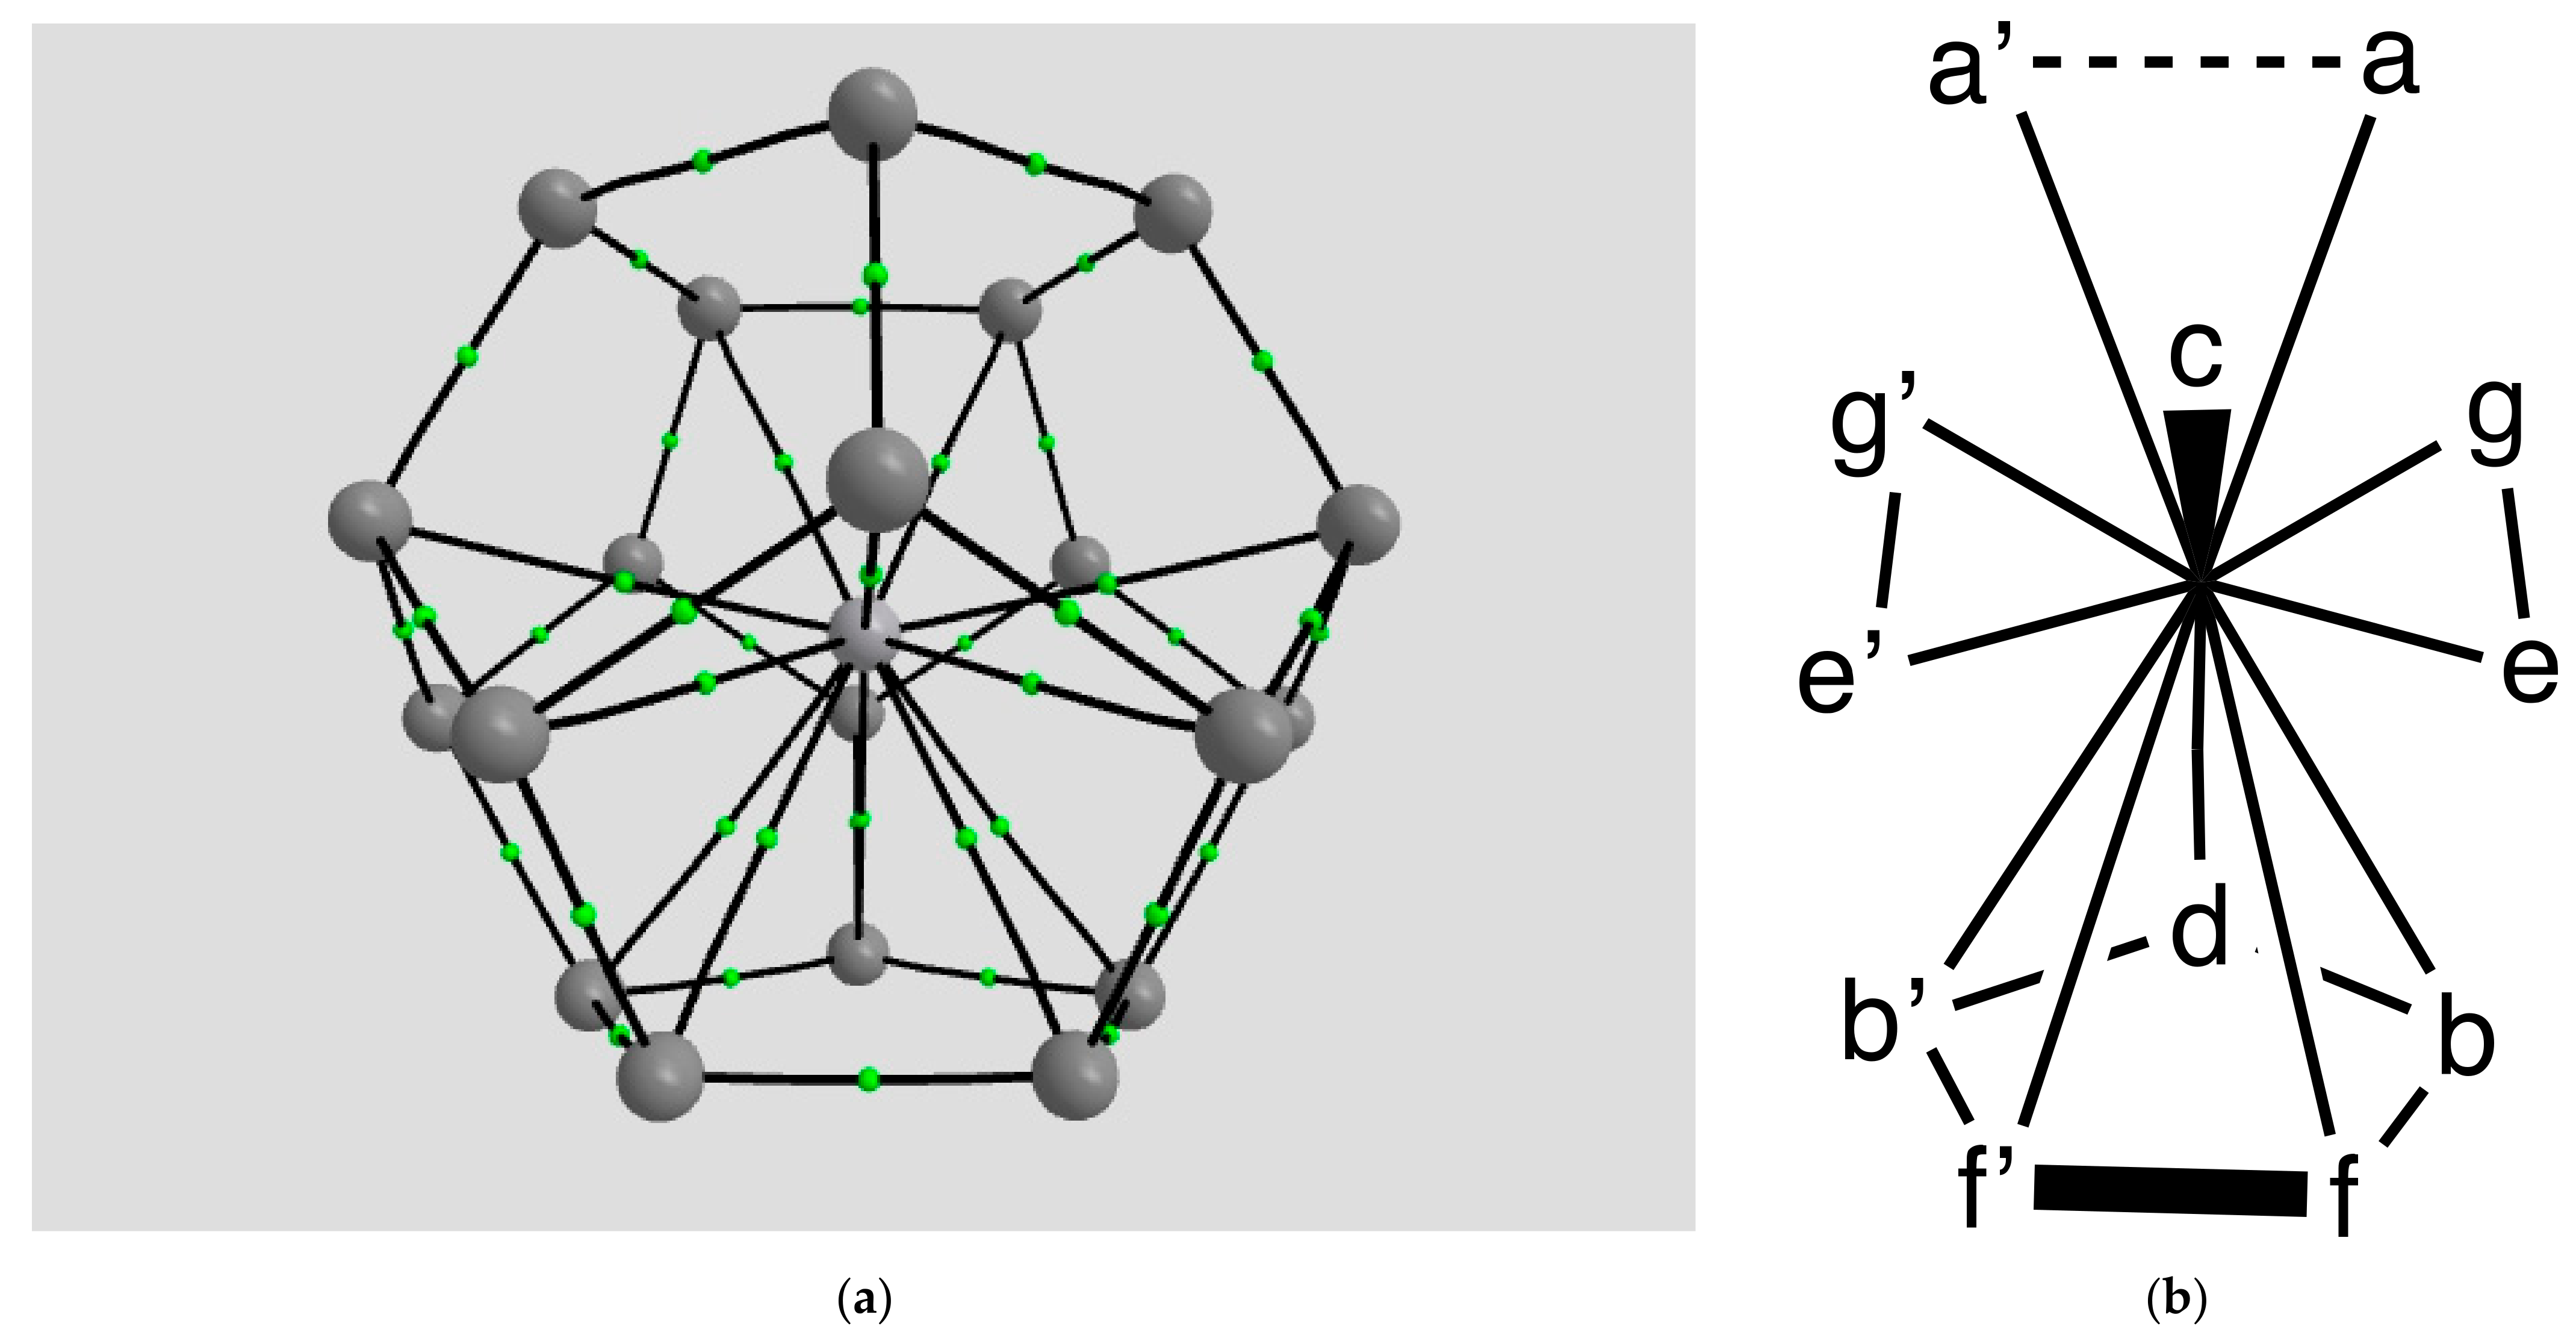
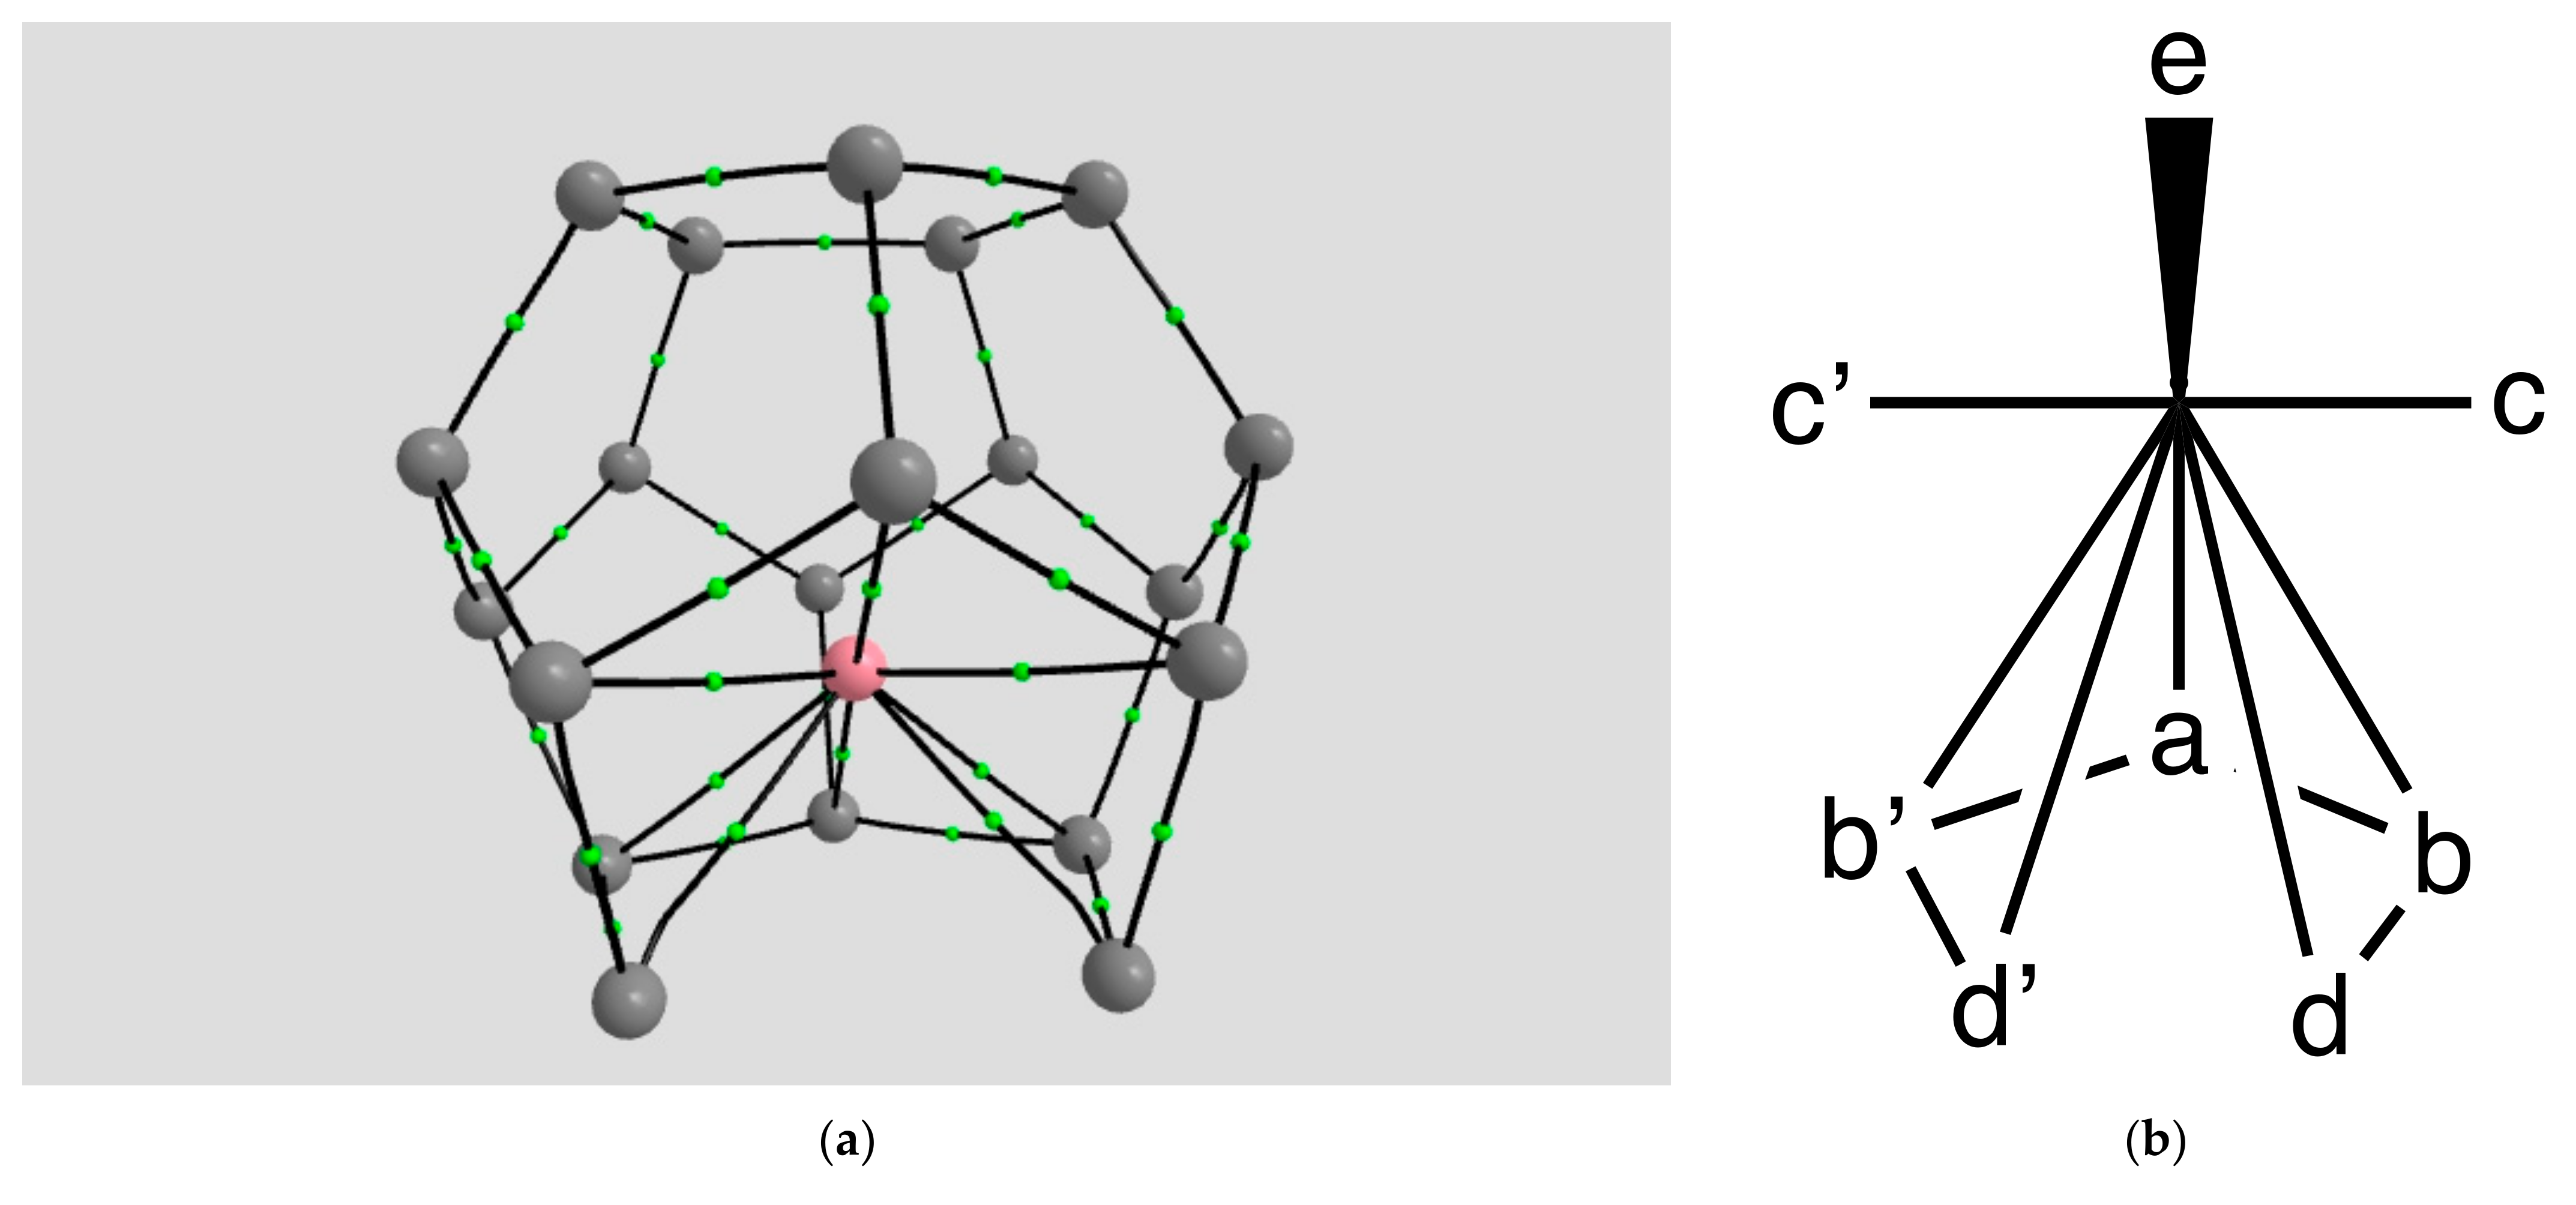
2.1.1. H Atoms in the Rhodium Square-Pyramidal Cages

In [H2Rh13(CO)24]3− which has a rhodium cage structure [7] there would seem to be six equivalent square-pyramidal open sites (three above the equator, three below). Idealized forms are shown in Figure 1. Each of the open sites is enclosed by four Rh atoms forming a square face of the polyhedron and the central metal atom. The electronic structure of the experimental system is represented by QTAIM interaction lines connecting nuclear centers in Figure 2.
QTAIM critical points of types (3, −3)—that is, nuclear attractors, or atomic centers—are shown in Figure 2, along with interaction lines (which have maximum density in two dimensions, a “ridge” in the density) connecting the nuclear attractors. The object is oriented to suggest a left-right symmetry, which is imperfect. The symmetry of the experimentally studied structure is reduced in part by the bridging carbon dioxide fragments which reduce the symmetry to Cs. Symmetry is further reduced by the counterions in the crystal. Then the “square” pyramidal holes are deformed into three nonequivalent sets of two equivalent quadrilateral pyramidal holes. In the experimental system [7], the trapped H atoms occupy two non-equivalent holes.
More detailed description of the experimental system is in the Supplementary Material. Discussion of a symmetrized model is deferred to the section on results.

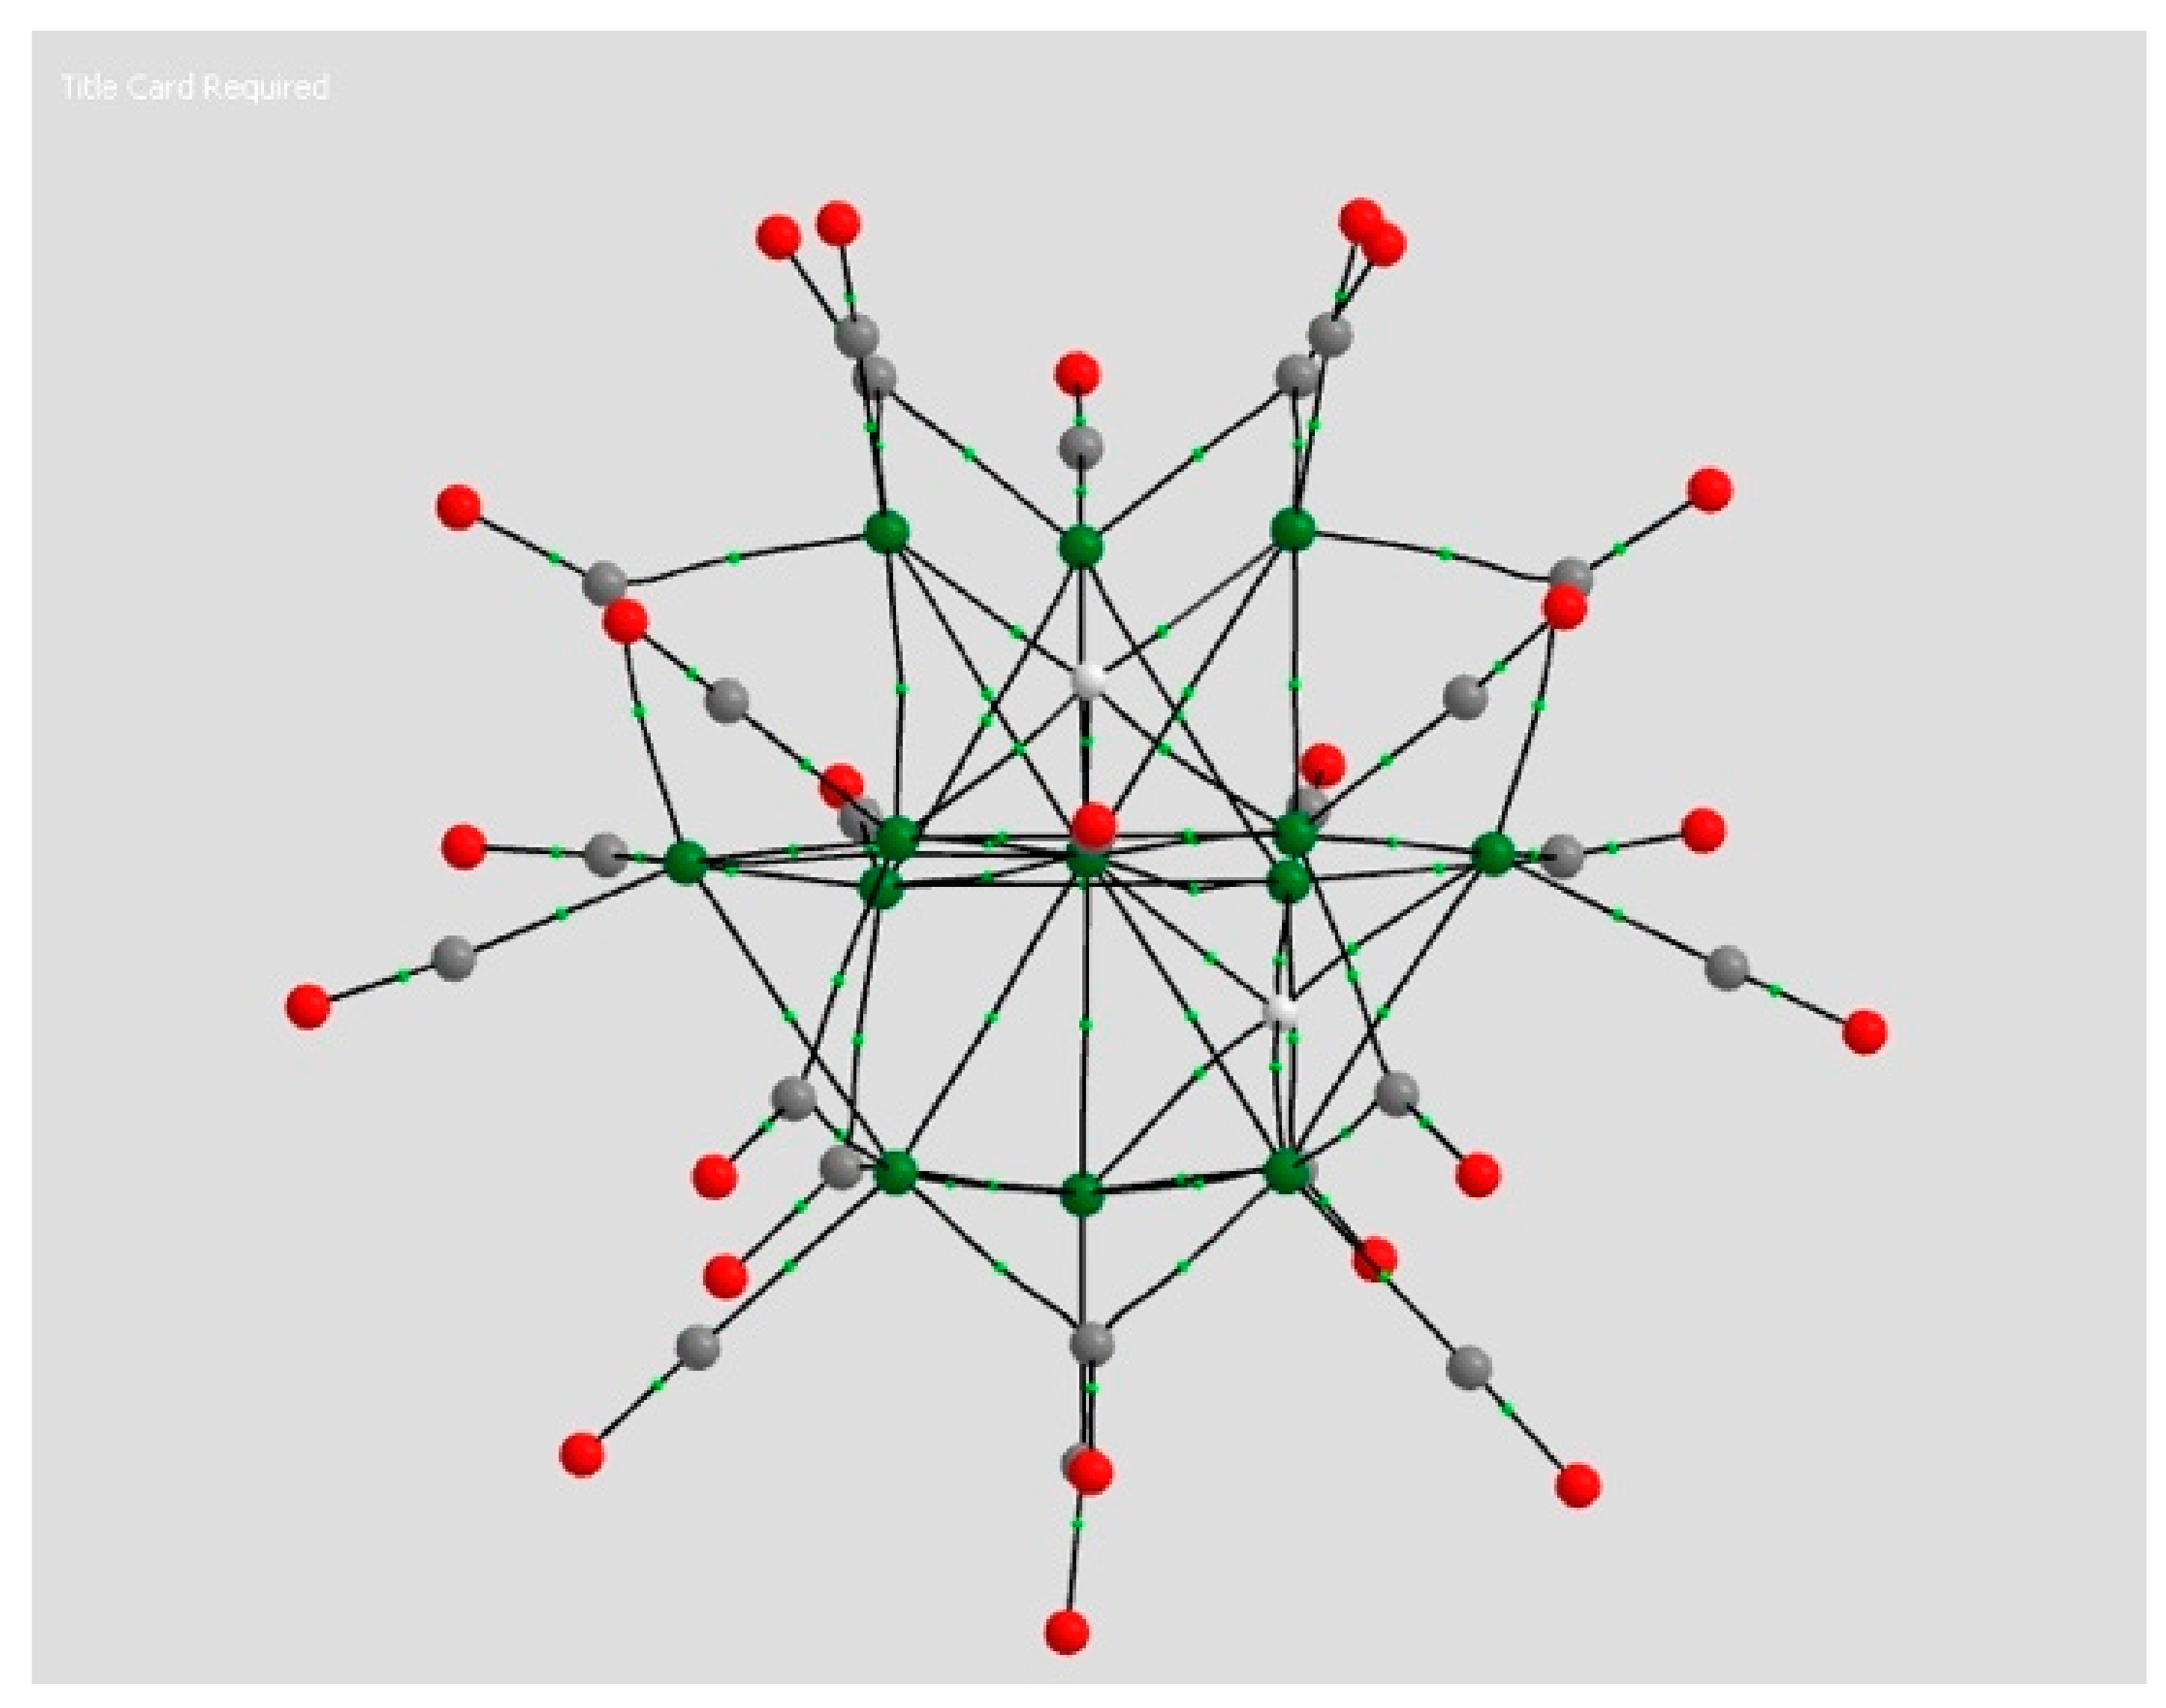
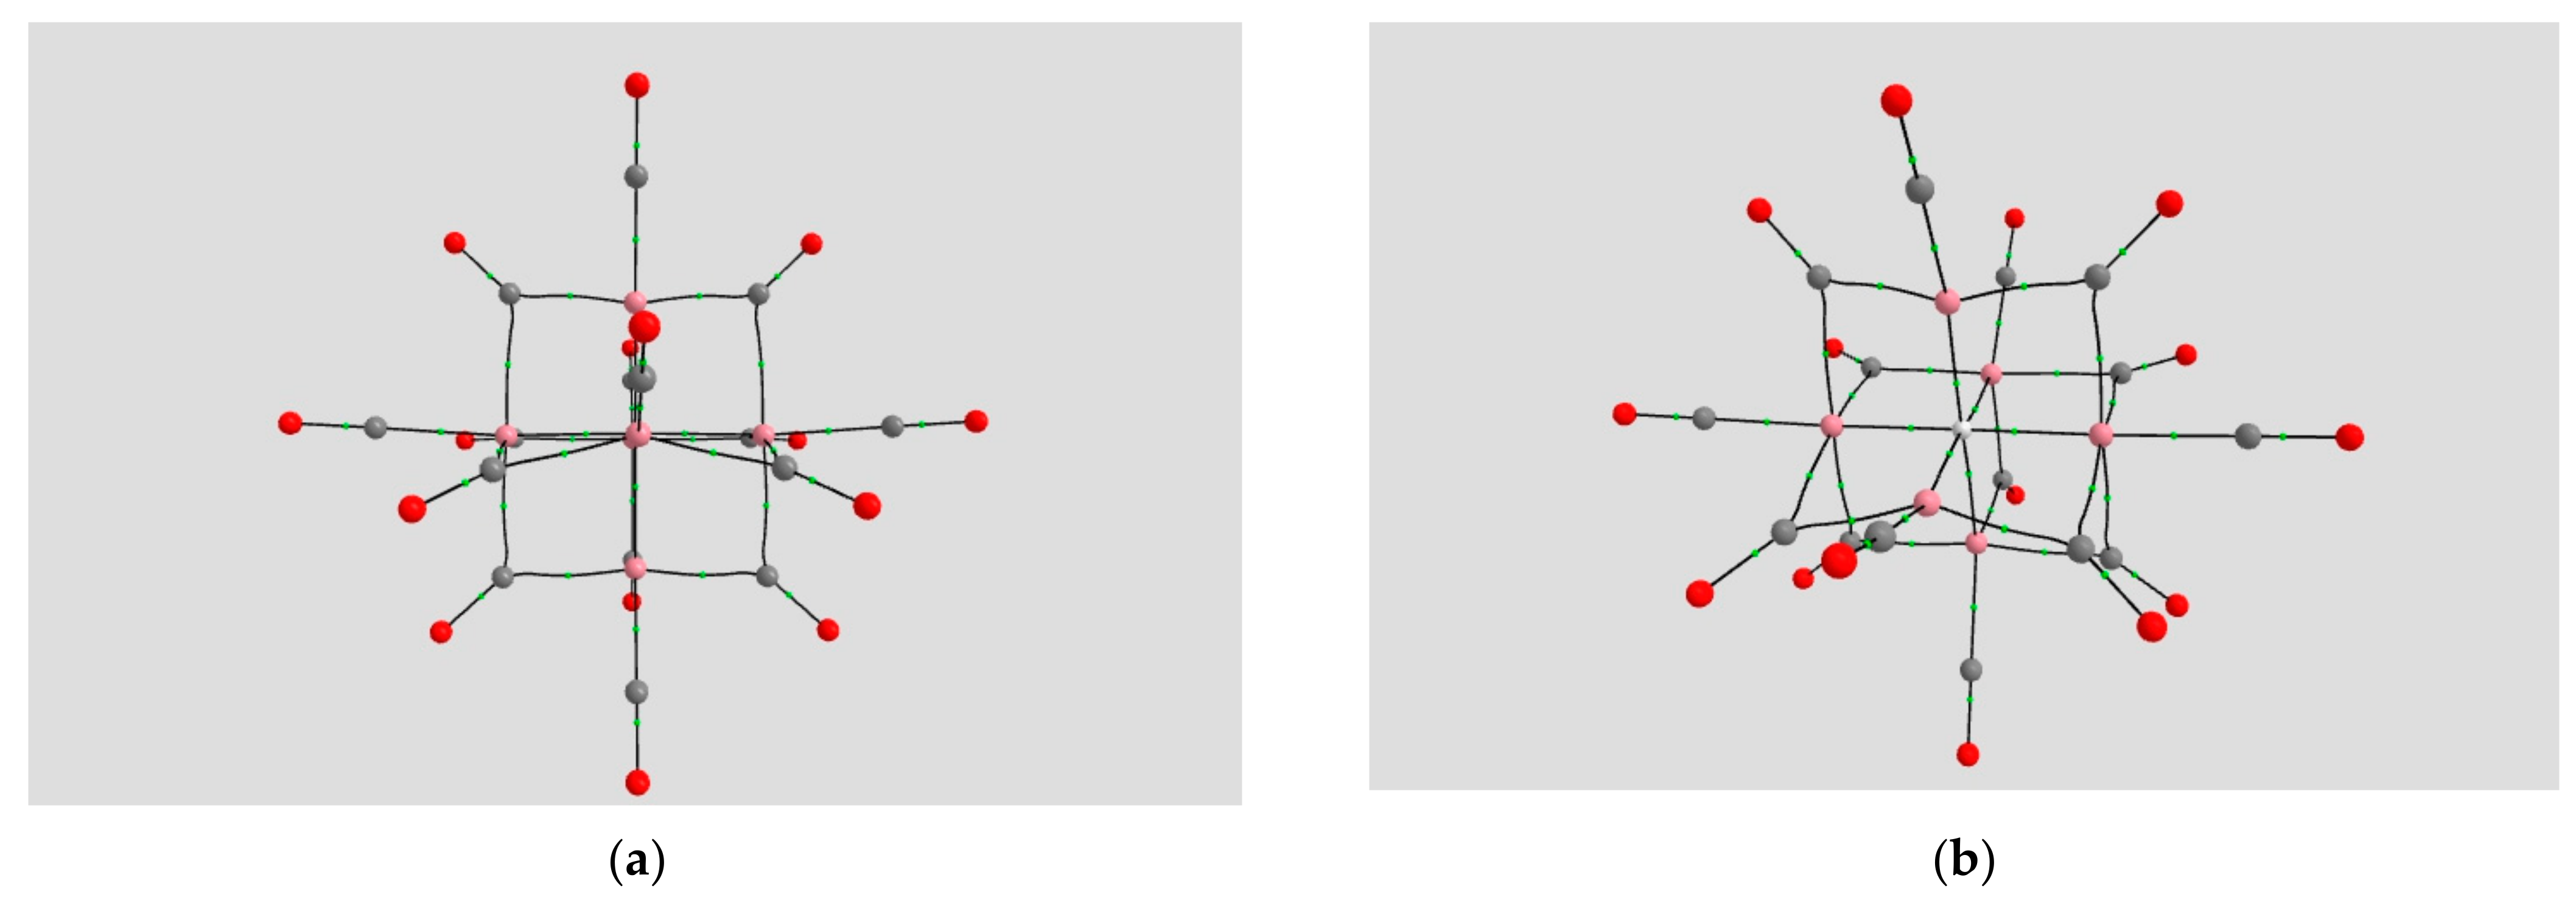
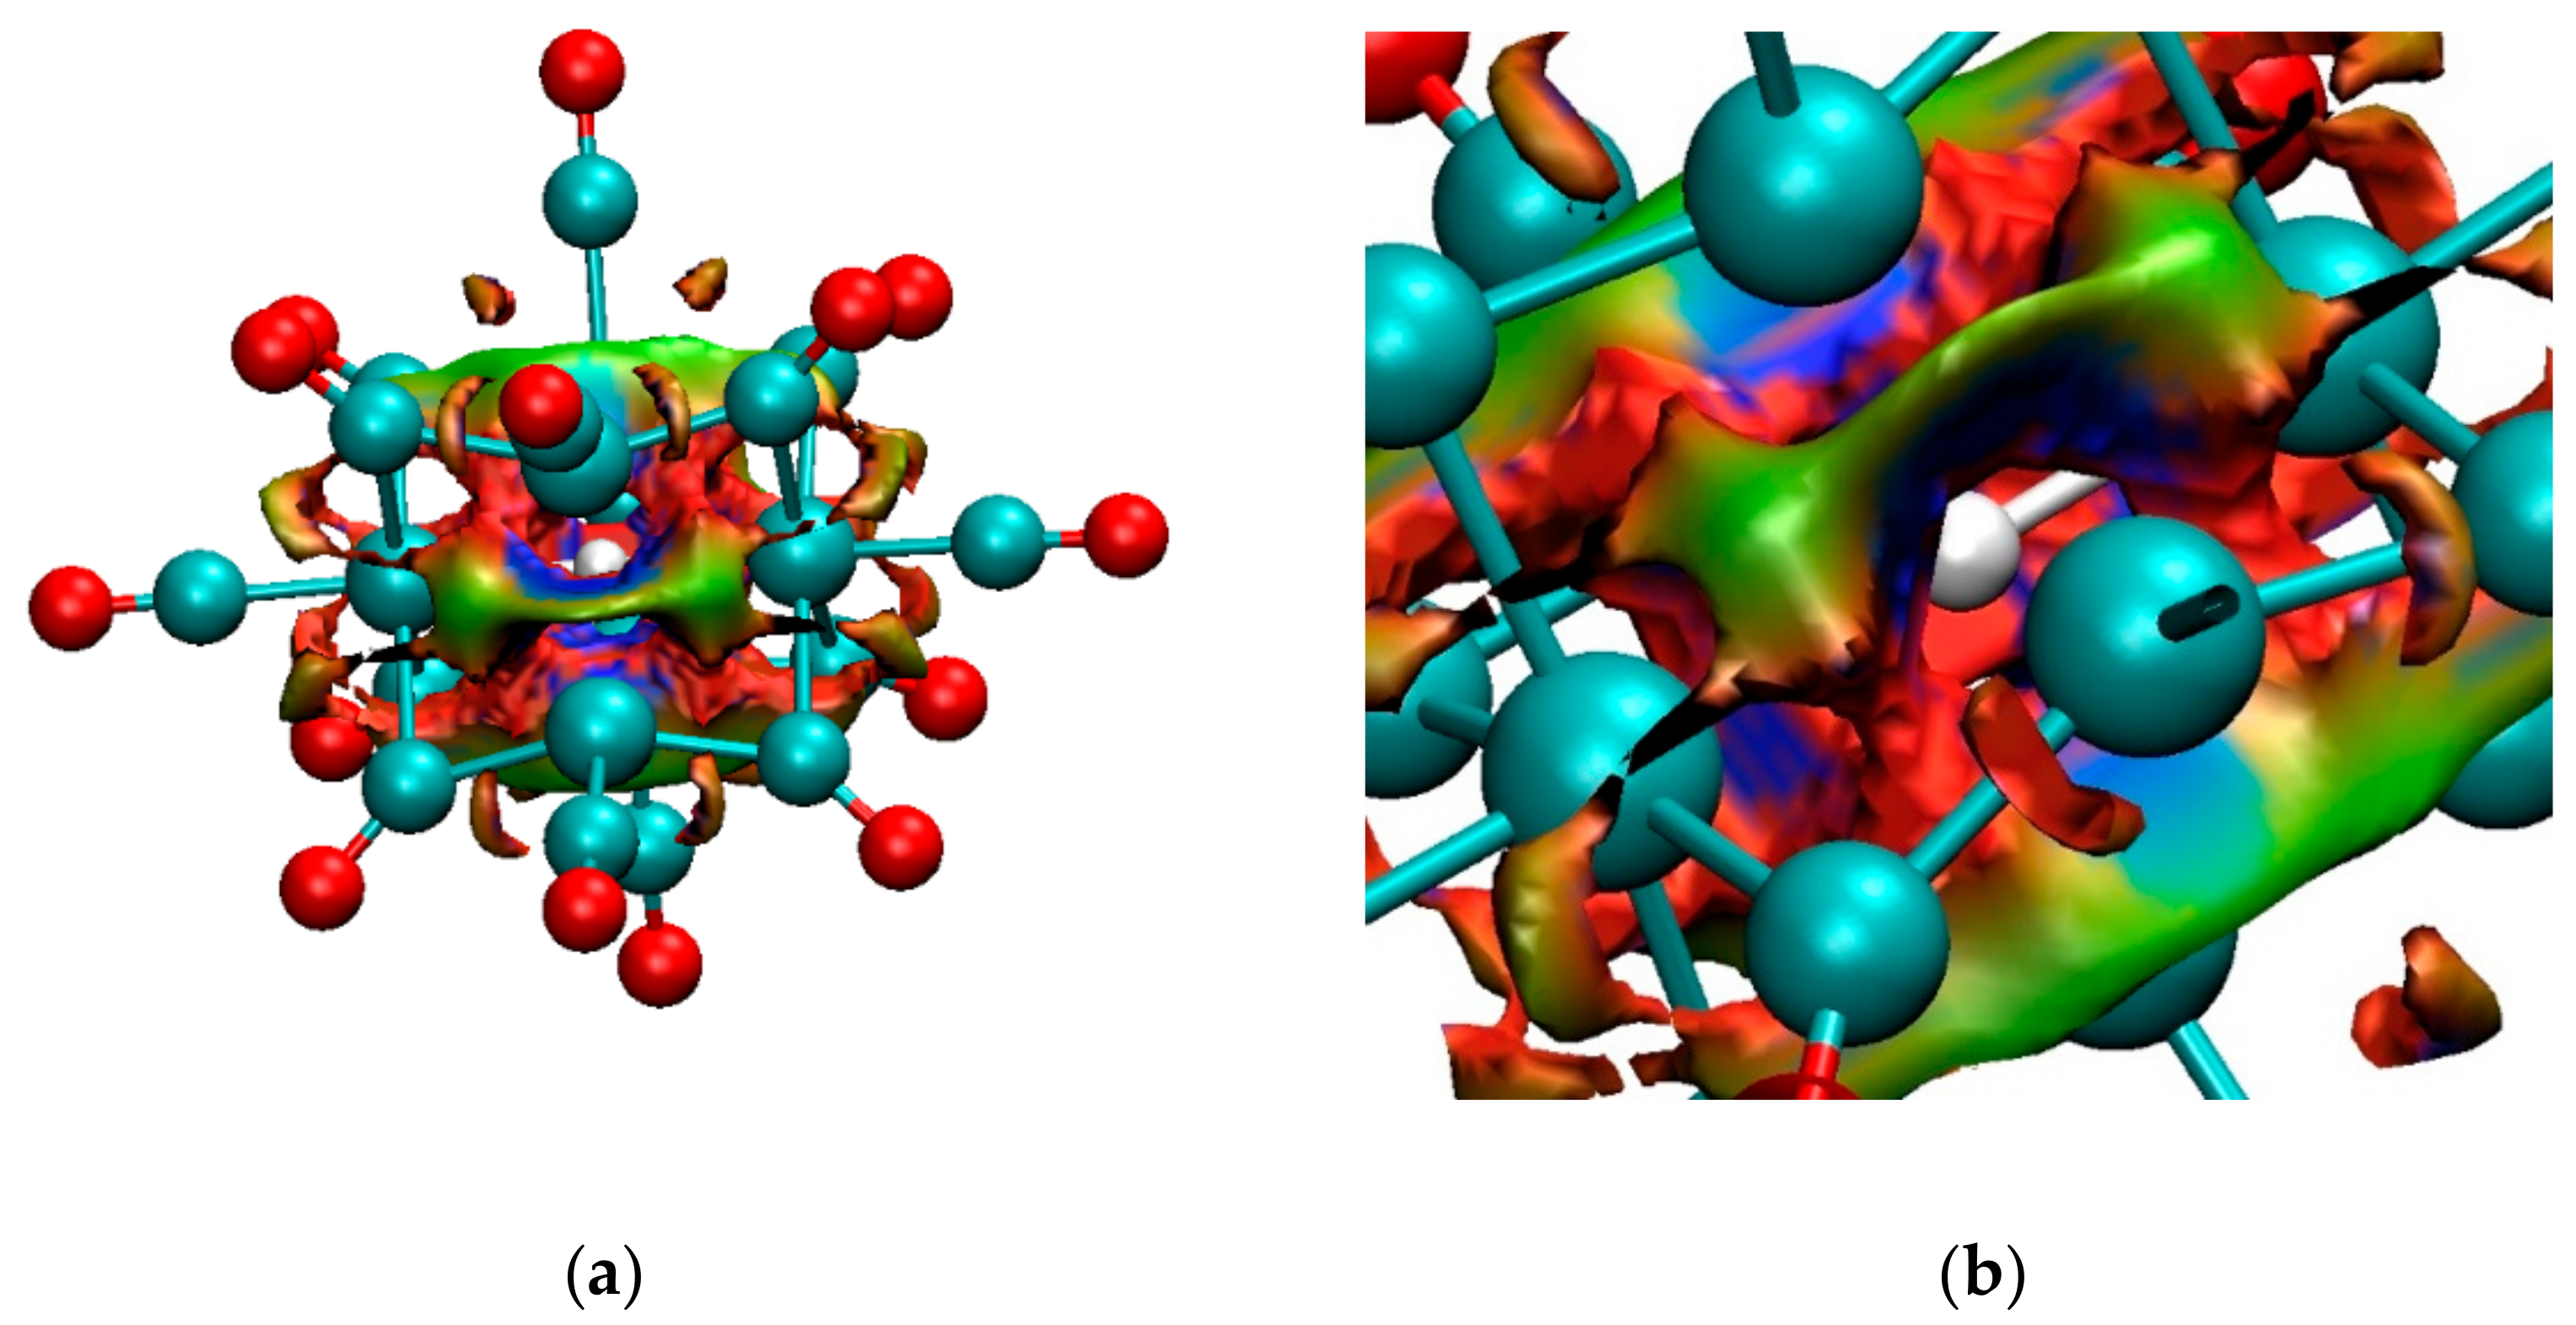
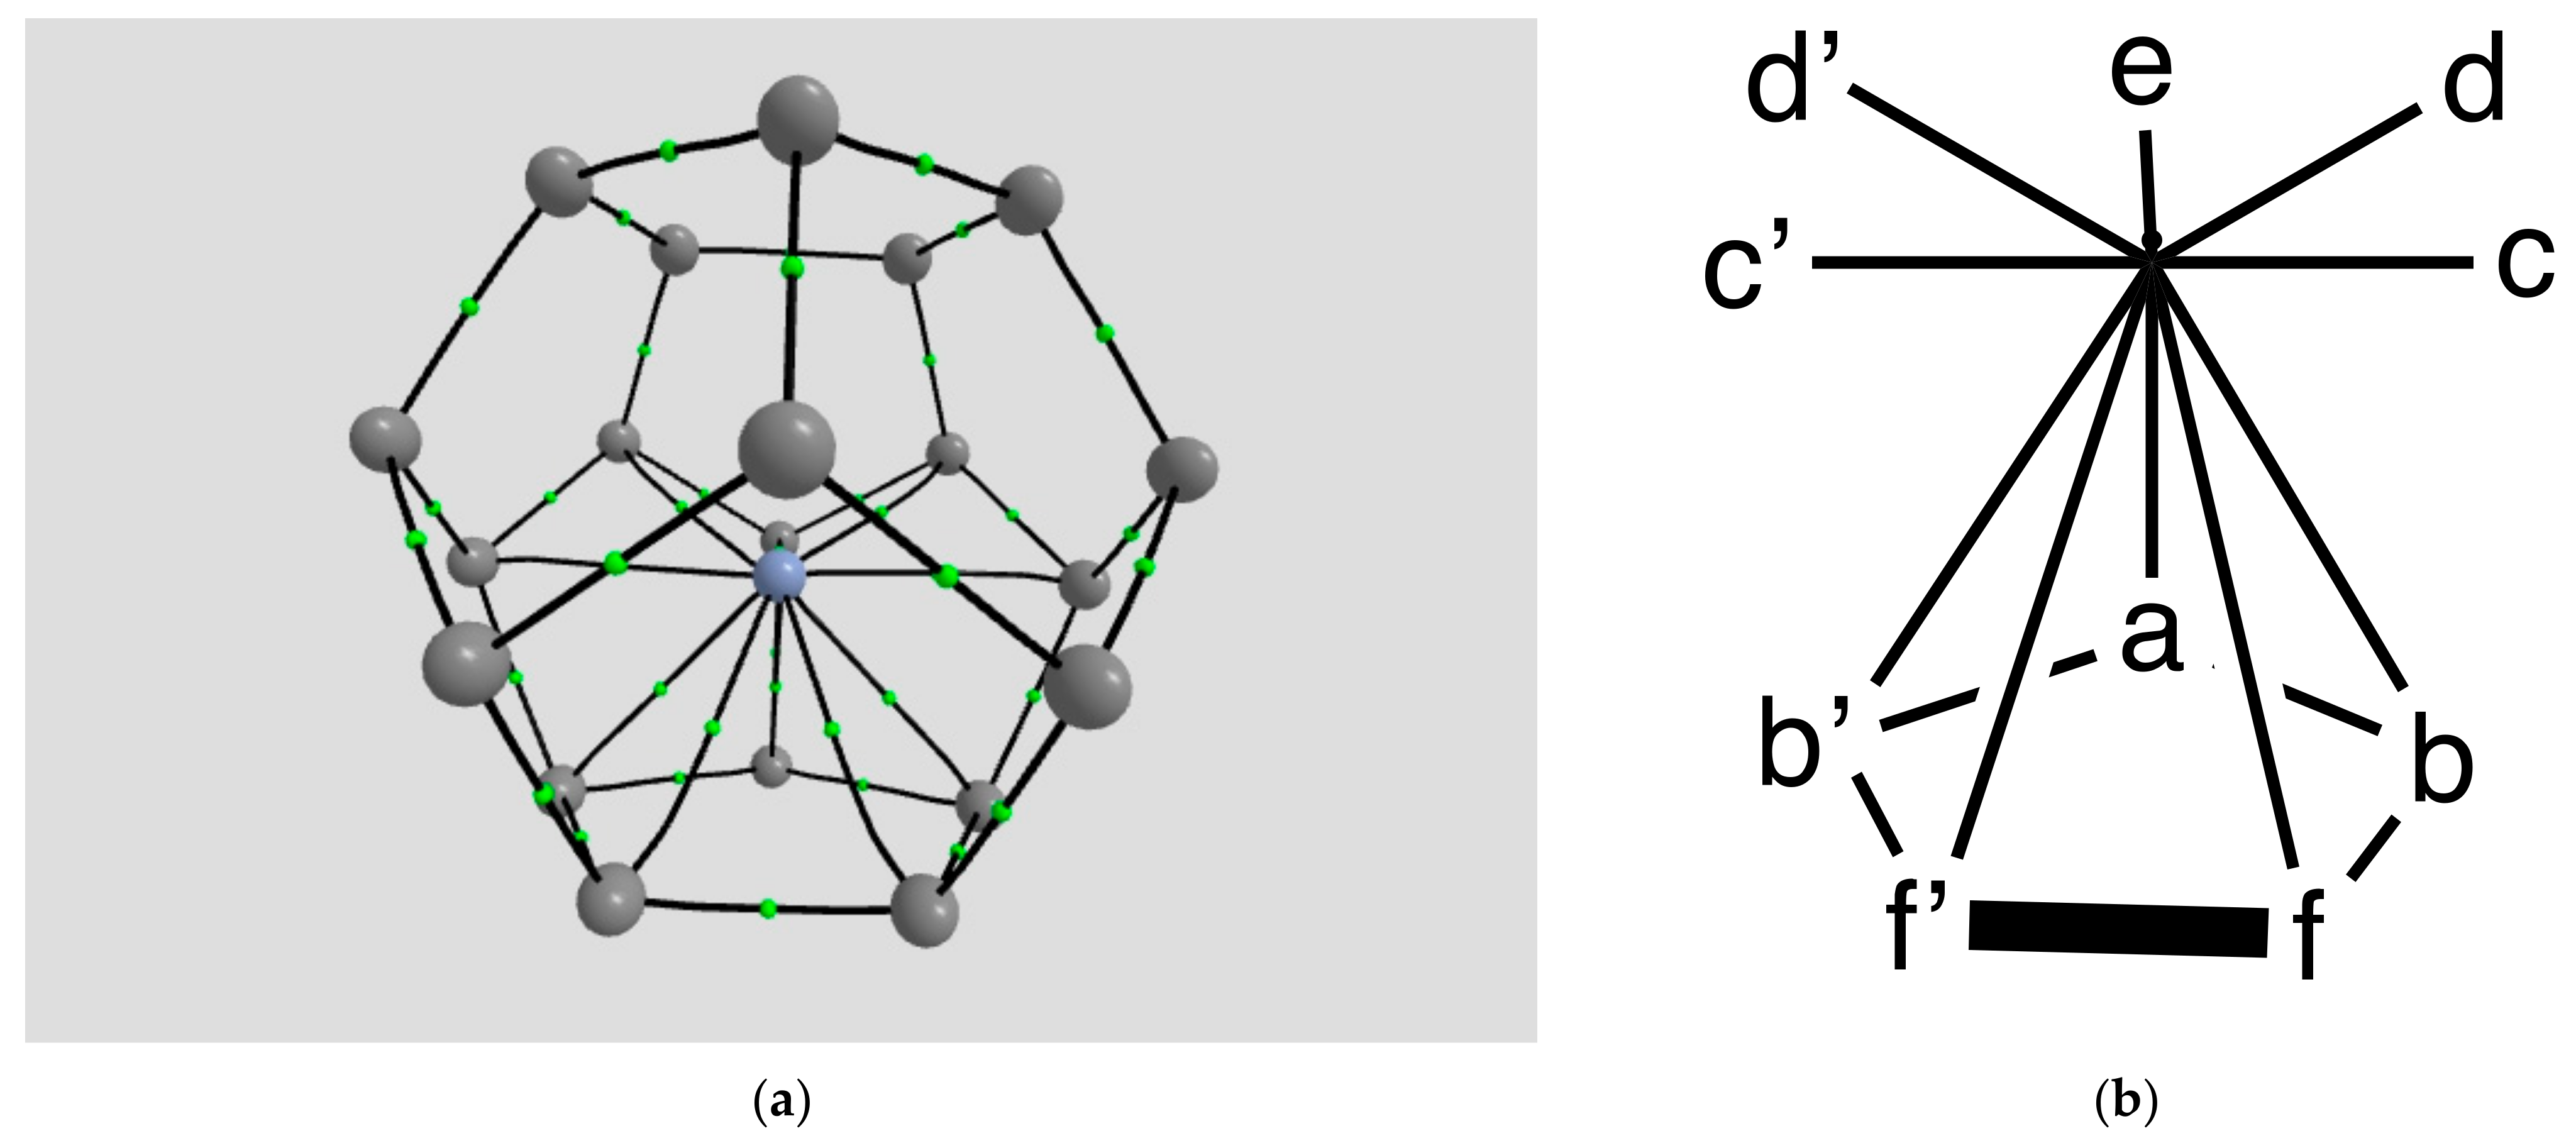
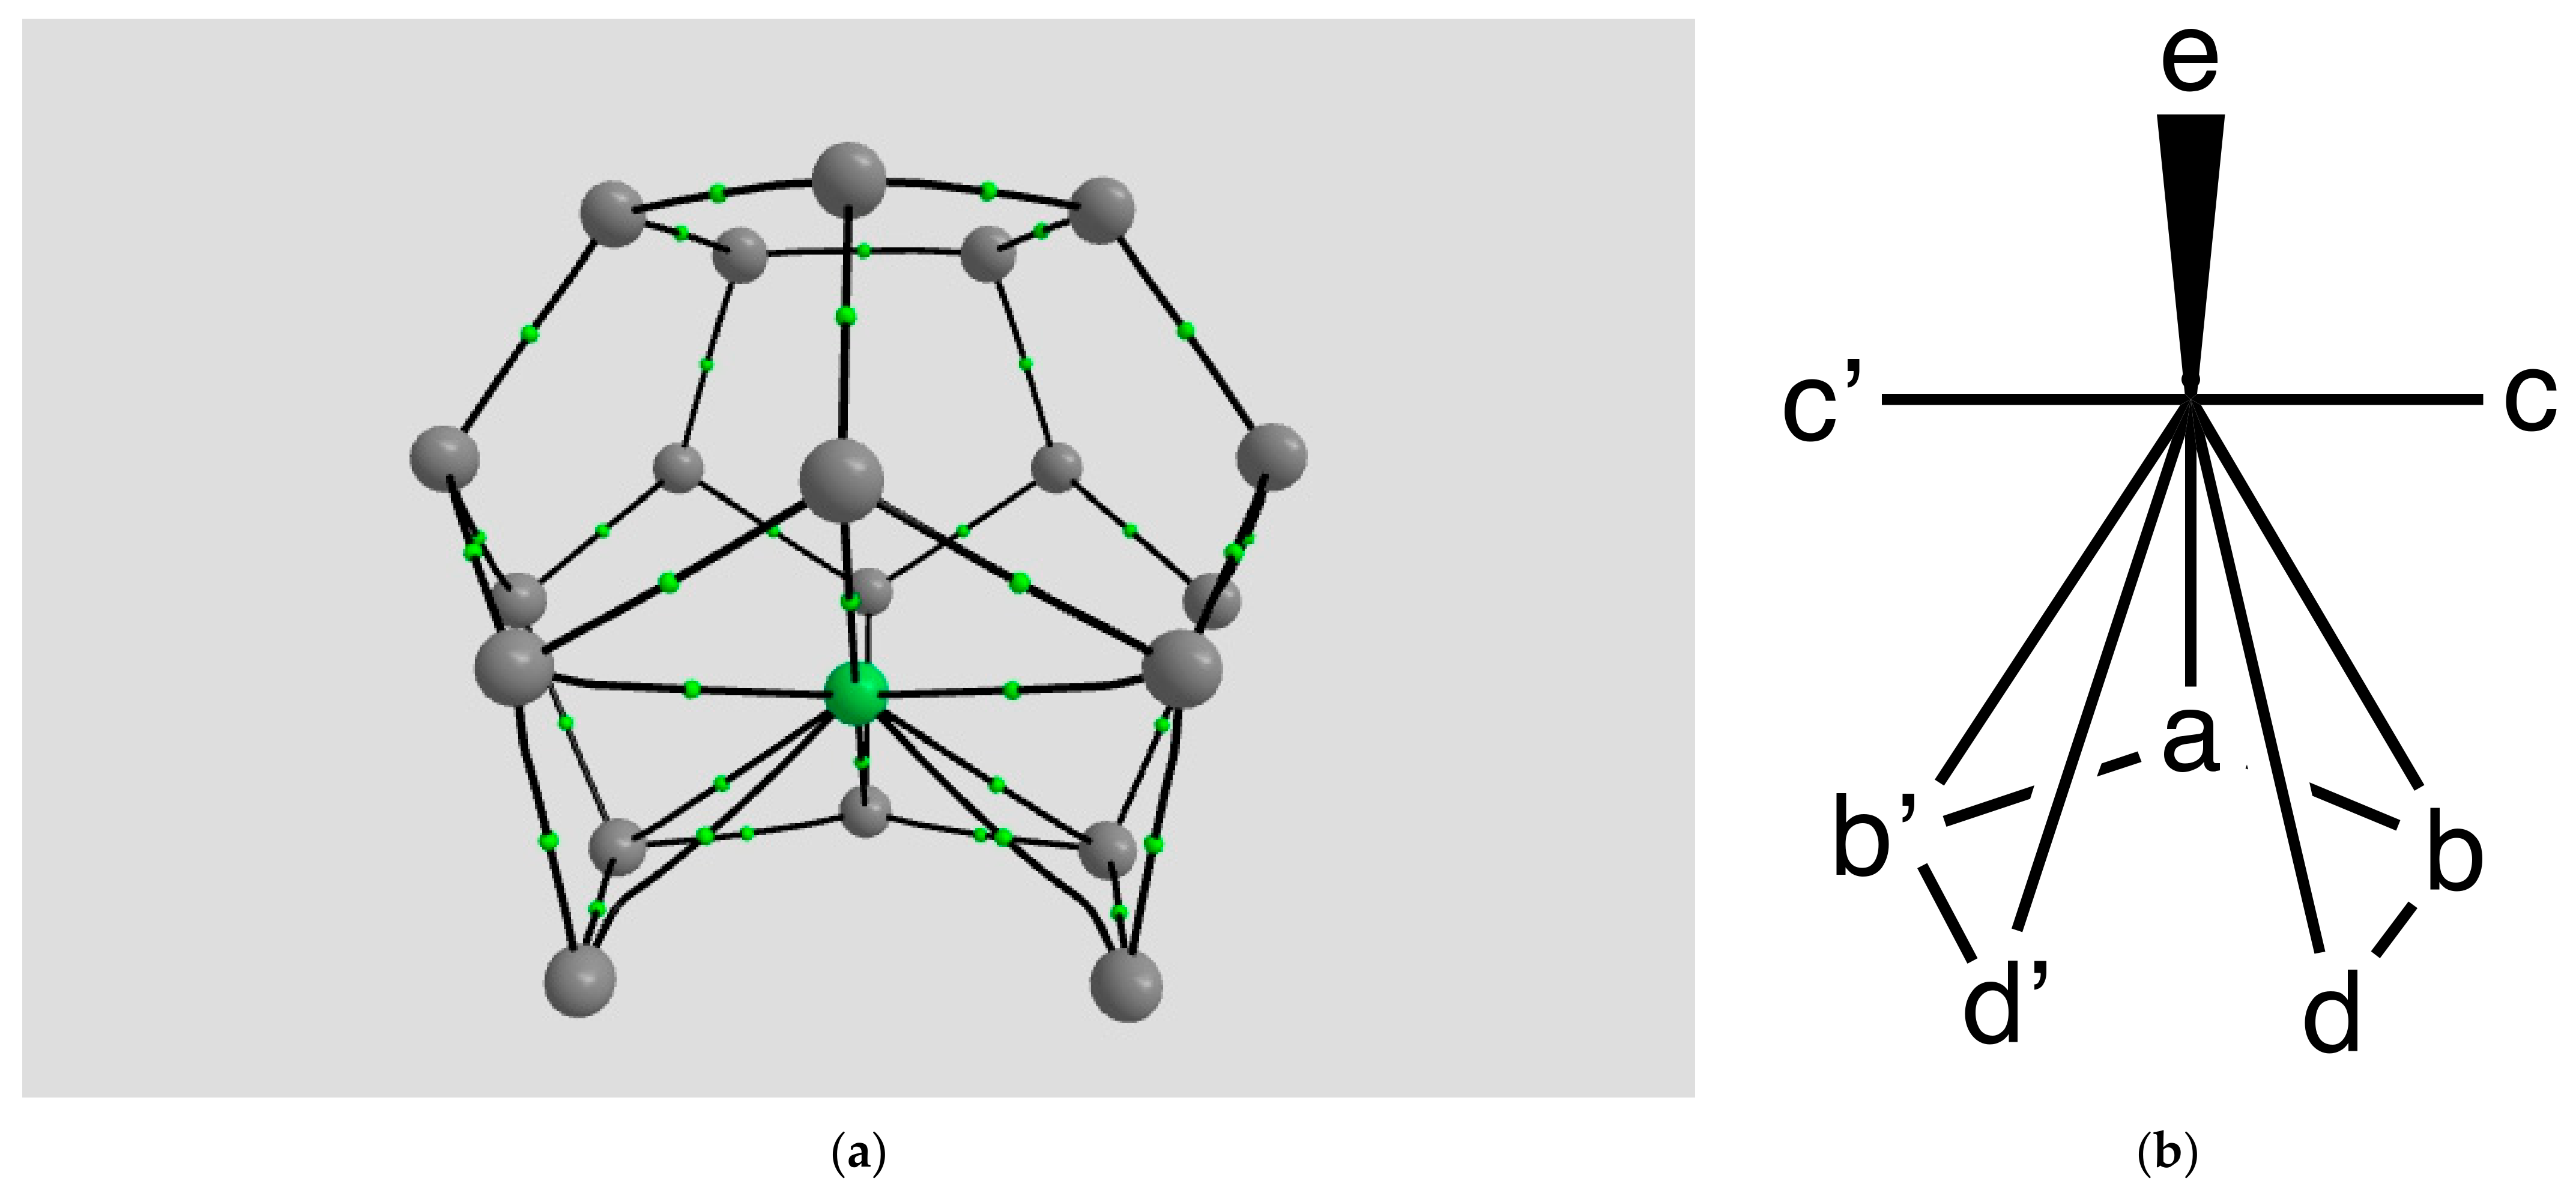
2.1.2. H Atom in a Cobalt Octahedral Cage

Two views of the C2v—symmetric framework in [HCo6(CO)15]1− anion [8,9] appear in Figure 3. This symmetric structure was obtained by geometry optimization with density functional theory, using the model ωB97XD/cc-pVTZ (see Methods and Software section for details). According to the QTAIM analysis, there are six interaction lines connecting Co atoms with the trapped H atom

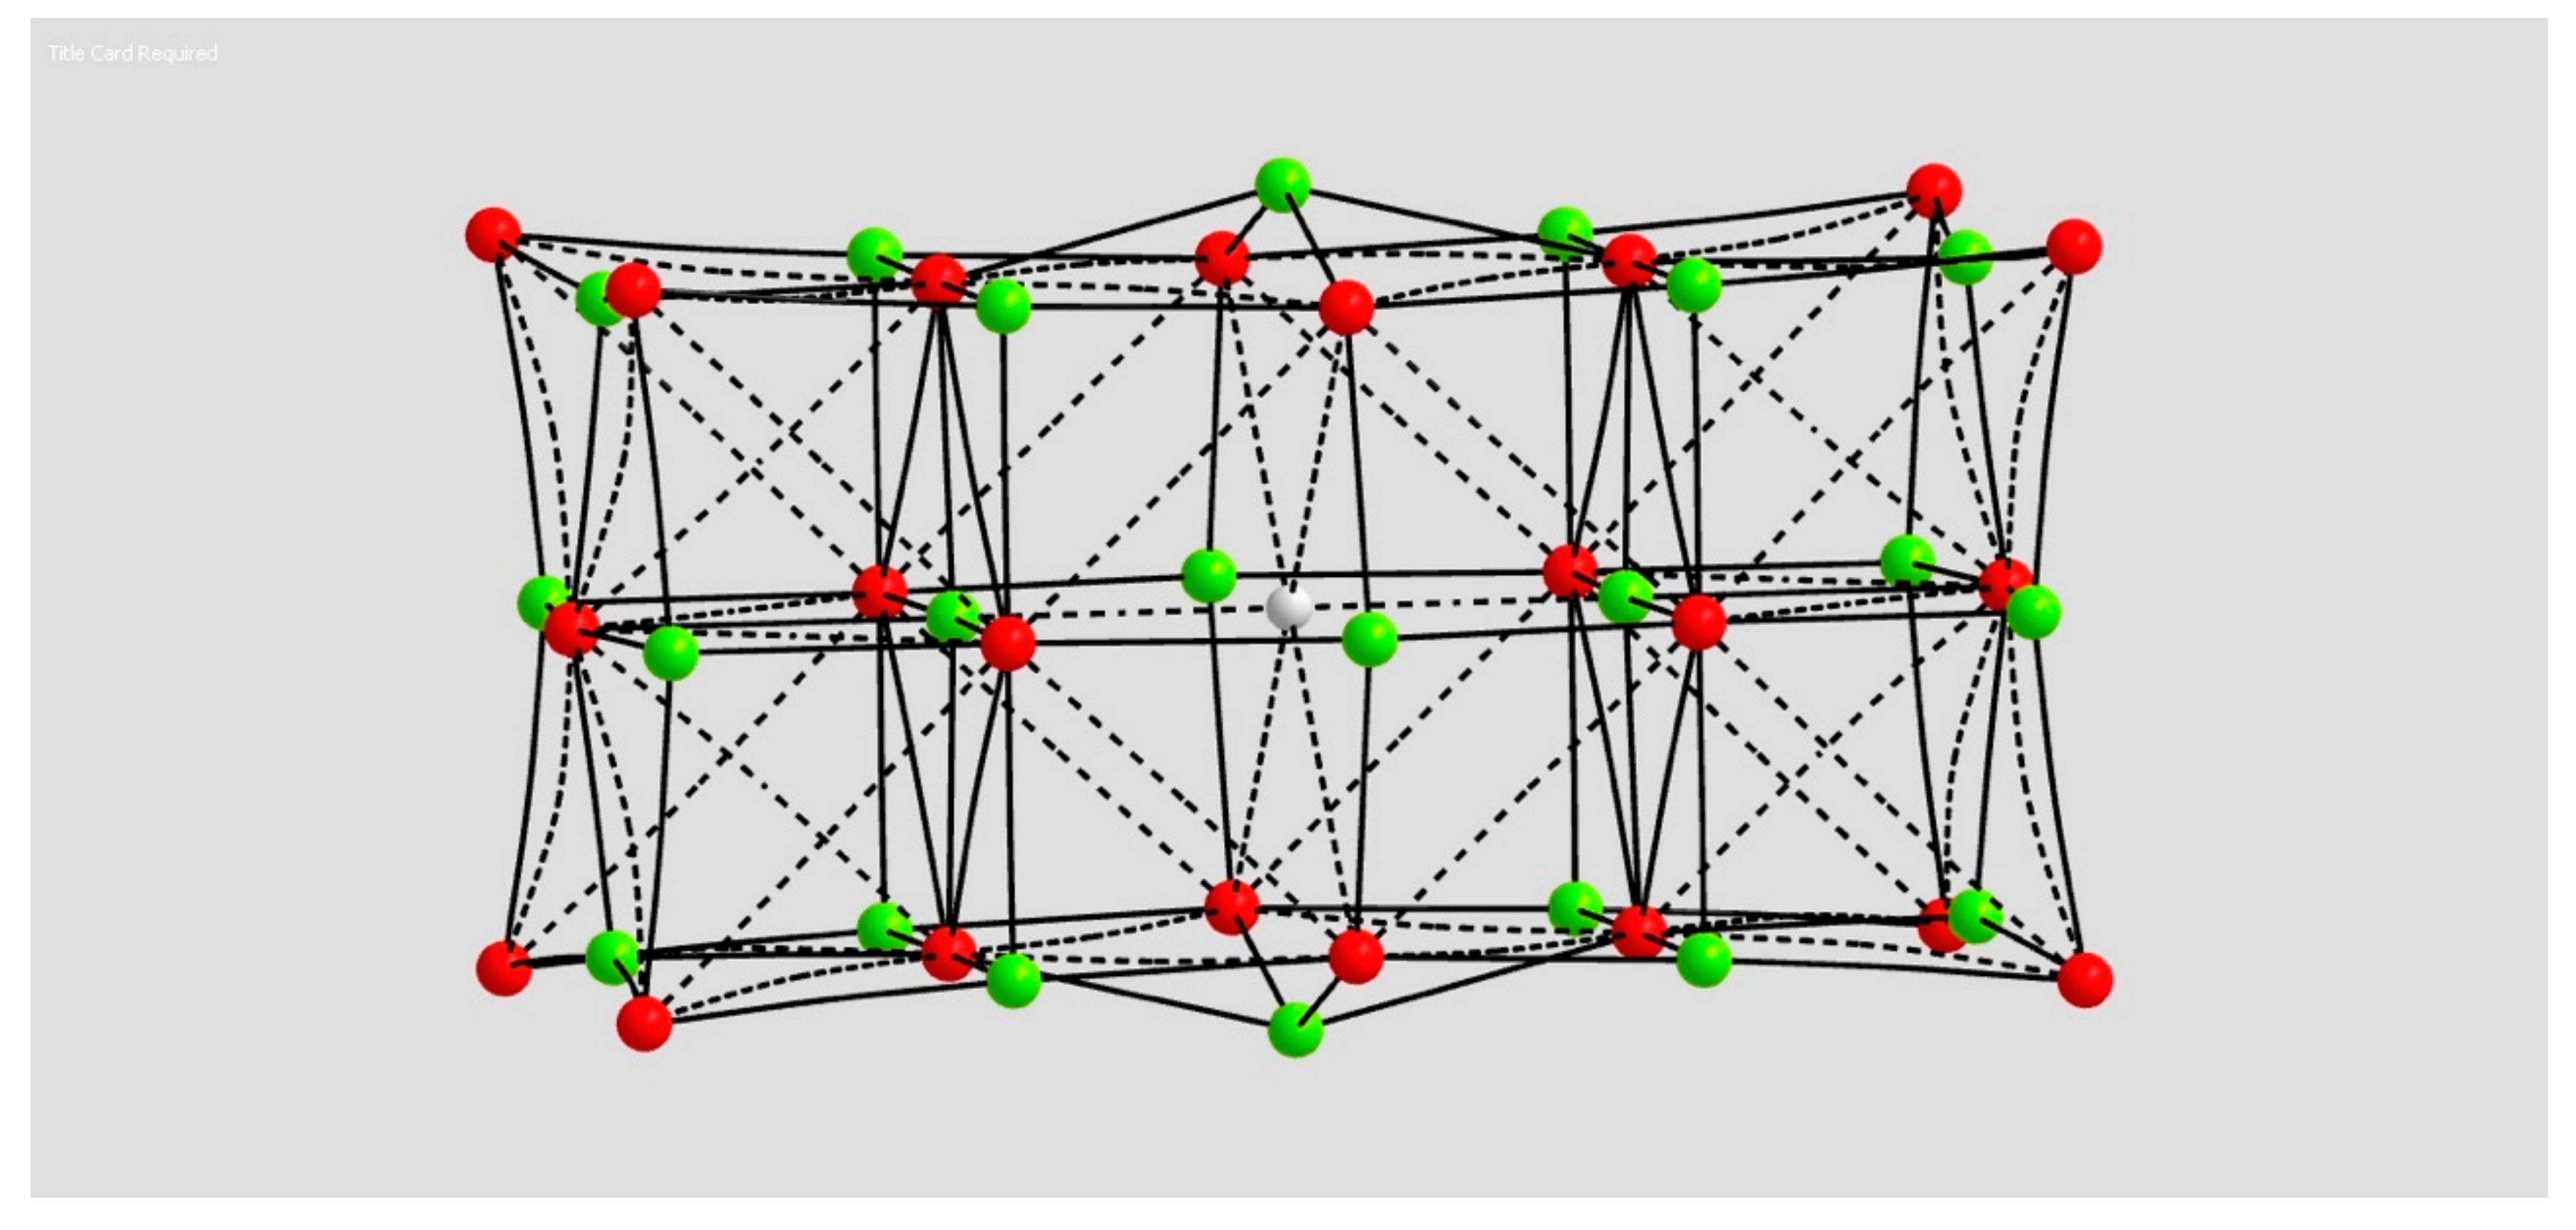
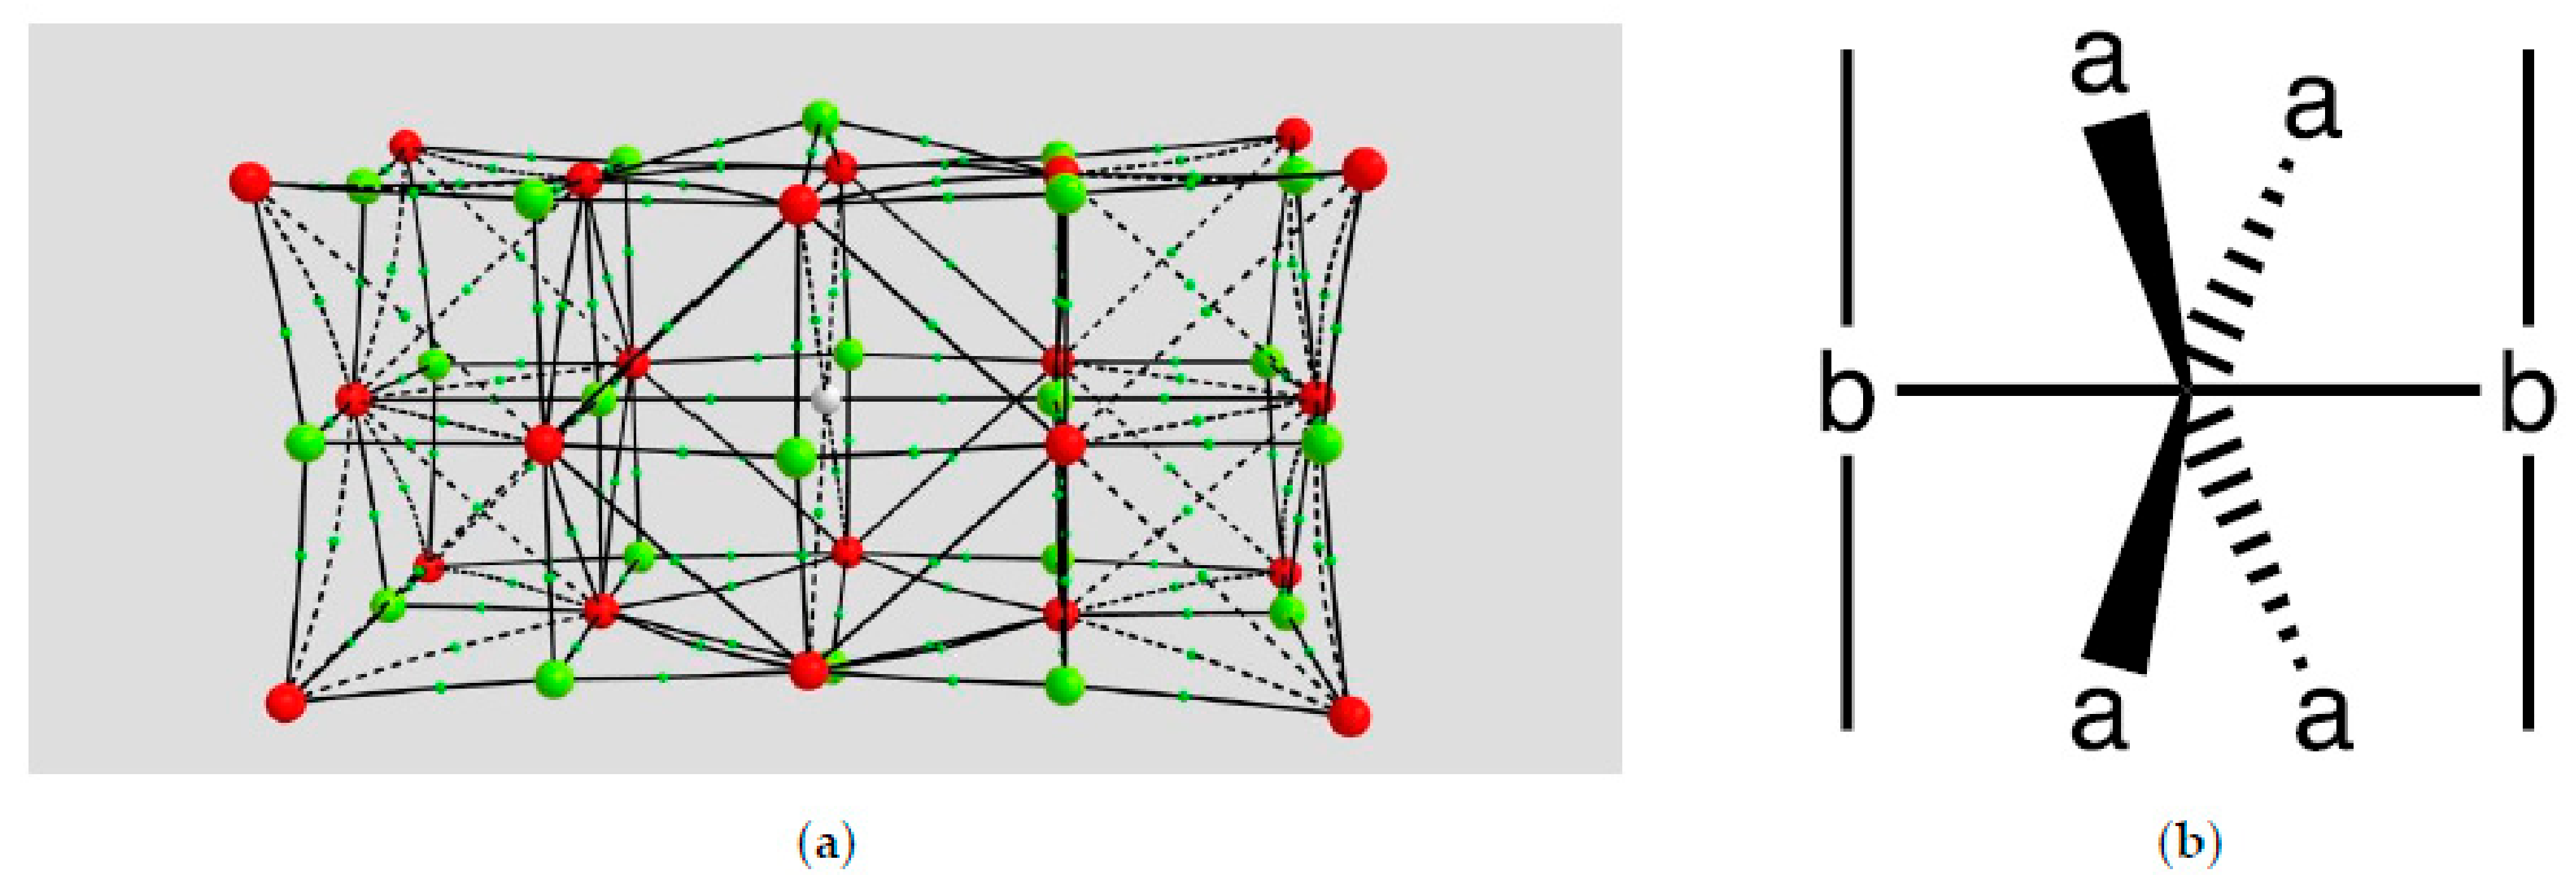
2.1.3. H Atom in a Magnesium Oxide Crystal Vacancy

Figure 4 shows a fragment of a MgO crystal, with a neutral H atom replacing an oxygen atom [10]. In the perfect crystal each magnesium atom is coordinated with six oxygen atoms, and each oxygen atom by is coordinated with six magnesium atoms. The distortion of the crystal arising from the substitution of neutral H for the O dianion is evident. Some Mg atoms depart from the mean (MgO)n plane since they are more weakly attracted by H than by O−2.
Figure 4 includes QTAIM interaction paths between nuclear attractors—that is, critical points of type (3, −3). Solid lines denote strong interactions, as between neighboring atomic centers of opposite charge. Interactions over longer distances and between ions of like charge are weaker, as shown by broken lines. The single H atom shown here interacts with two neighboring Mg atoms and four neighboring O atoms.

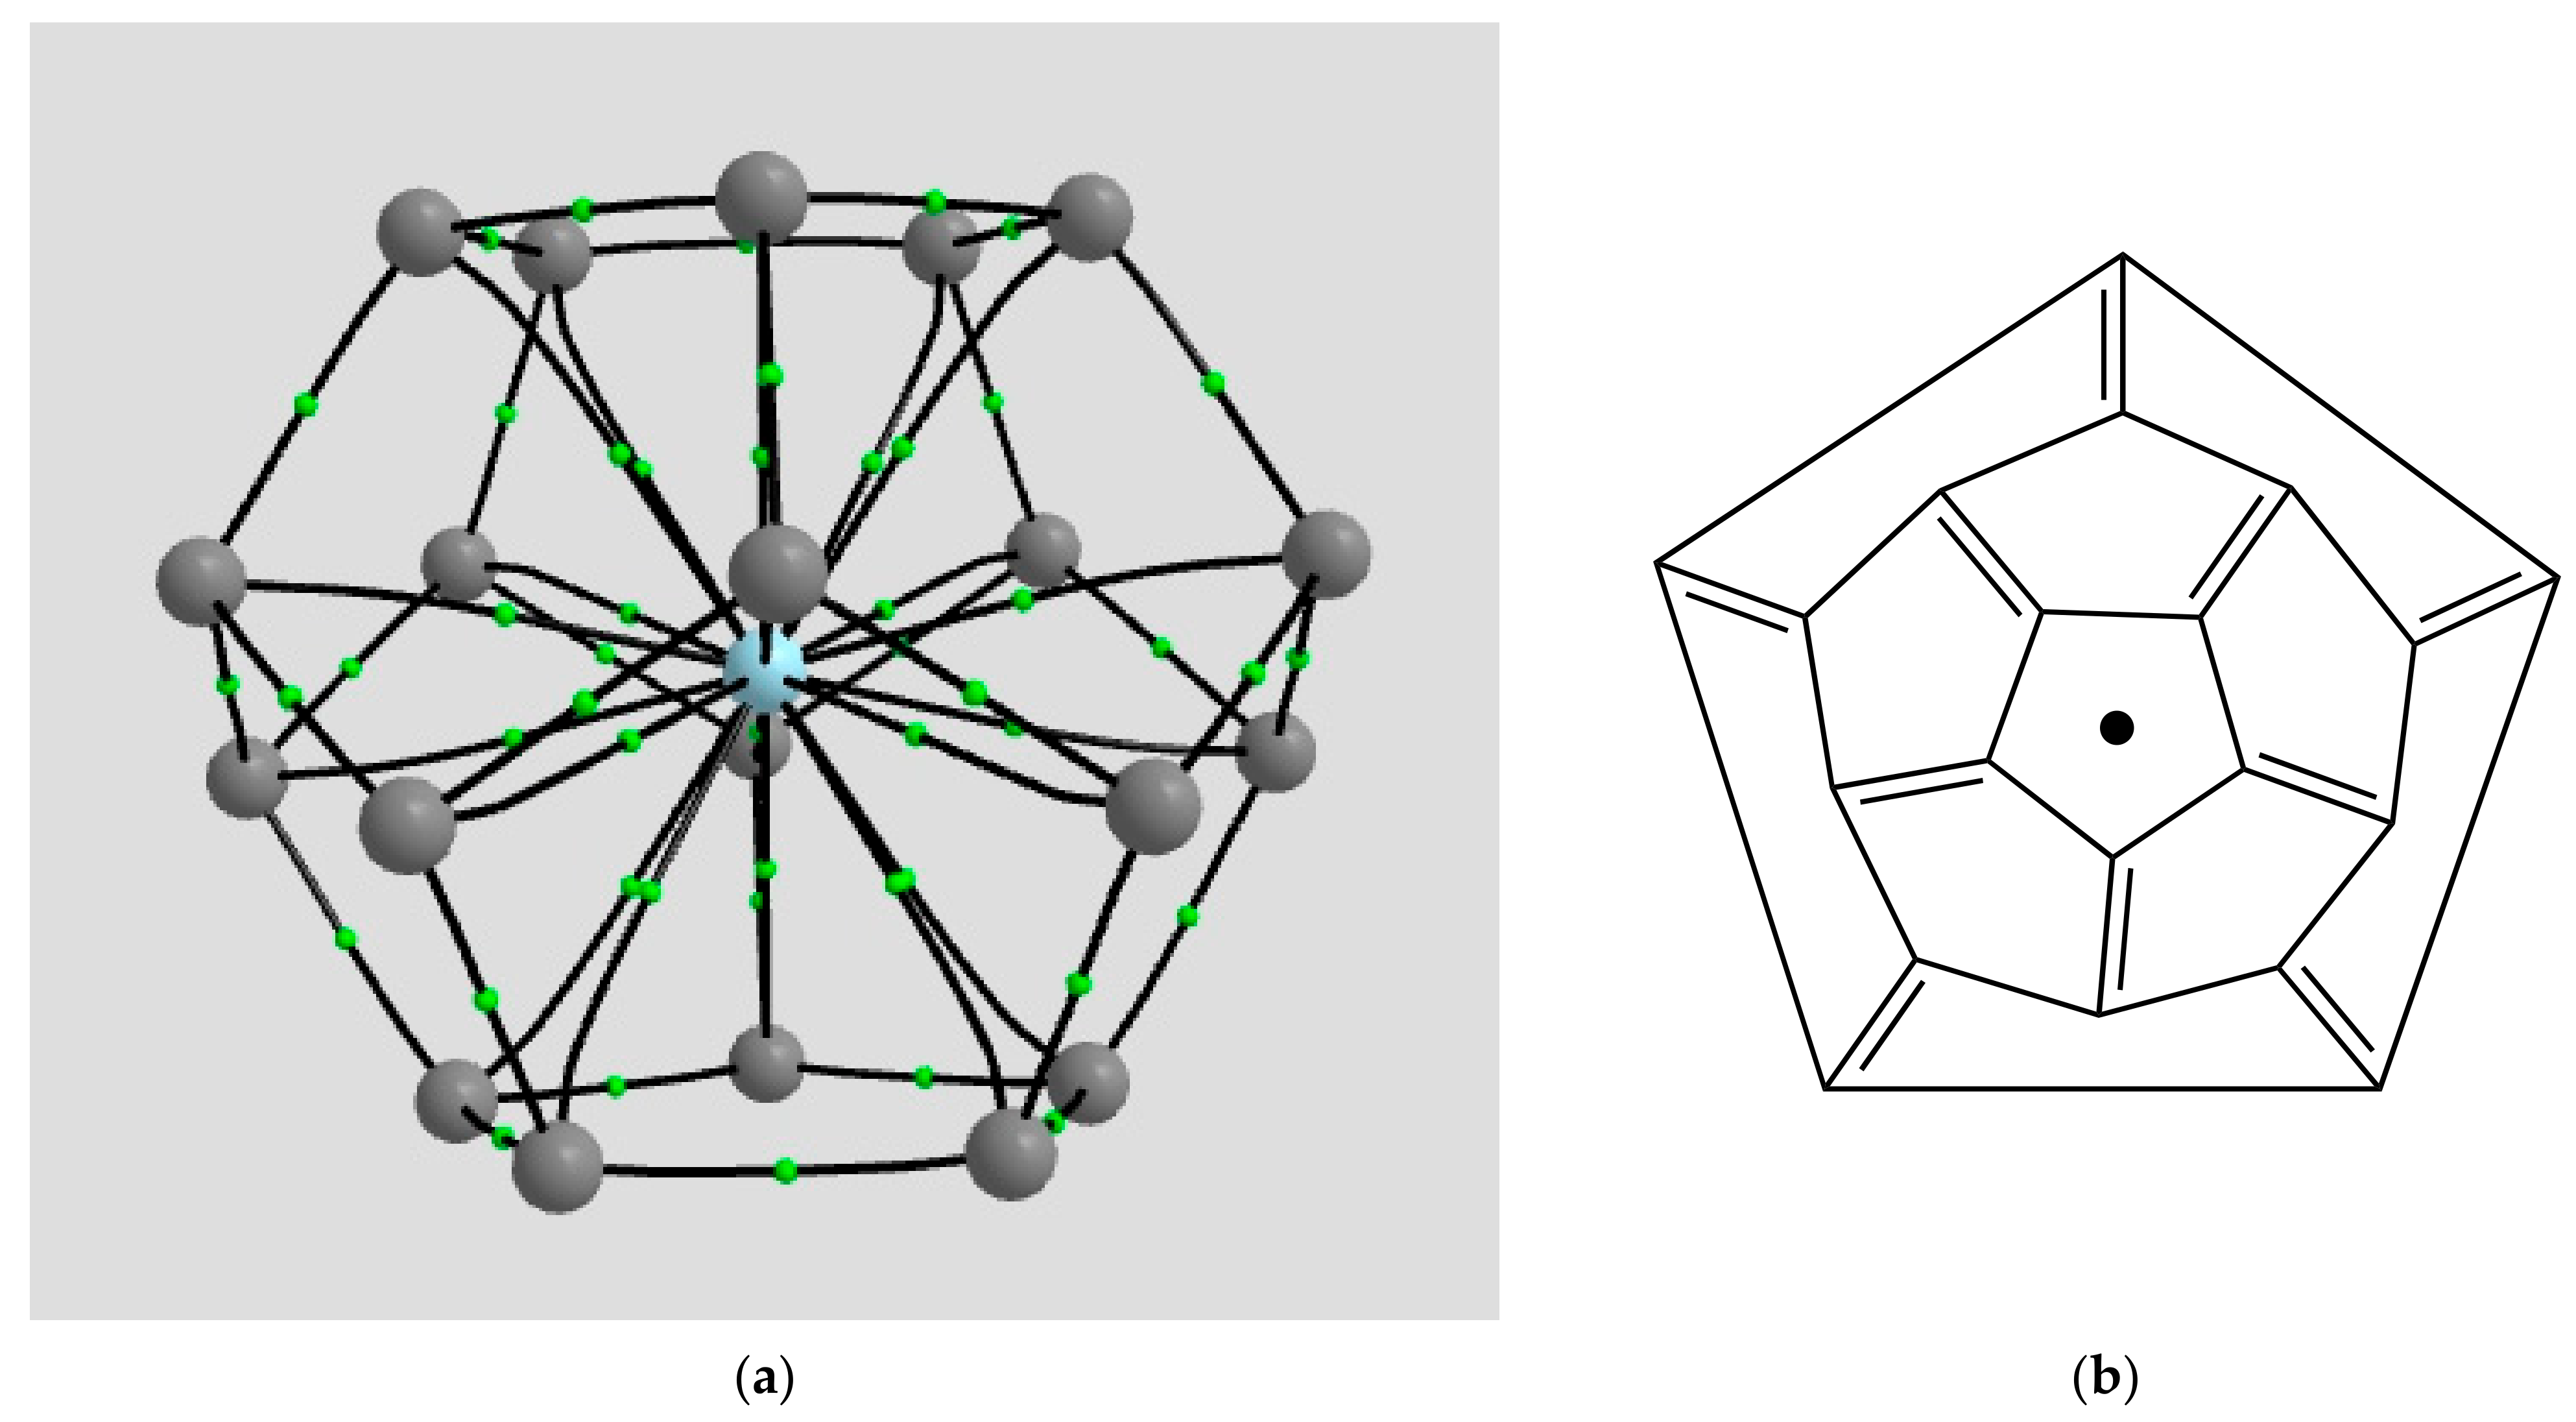
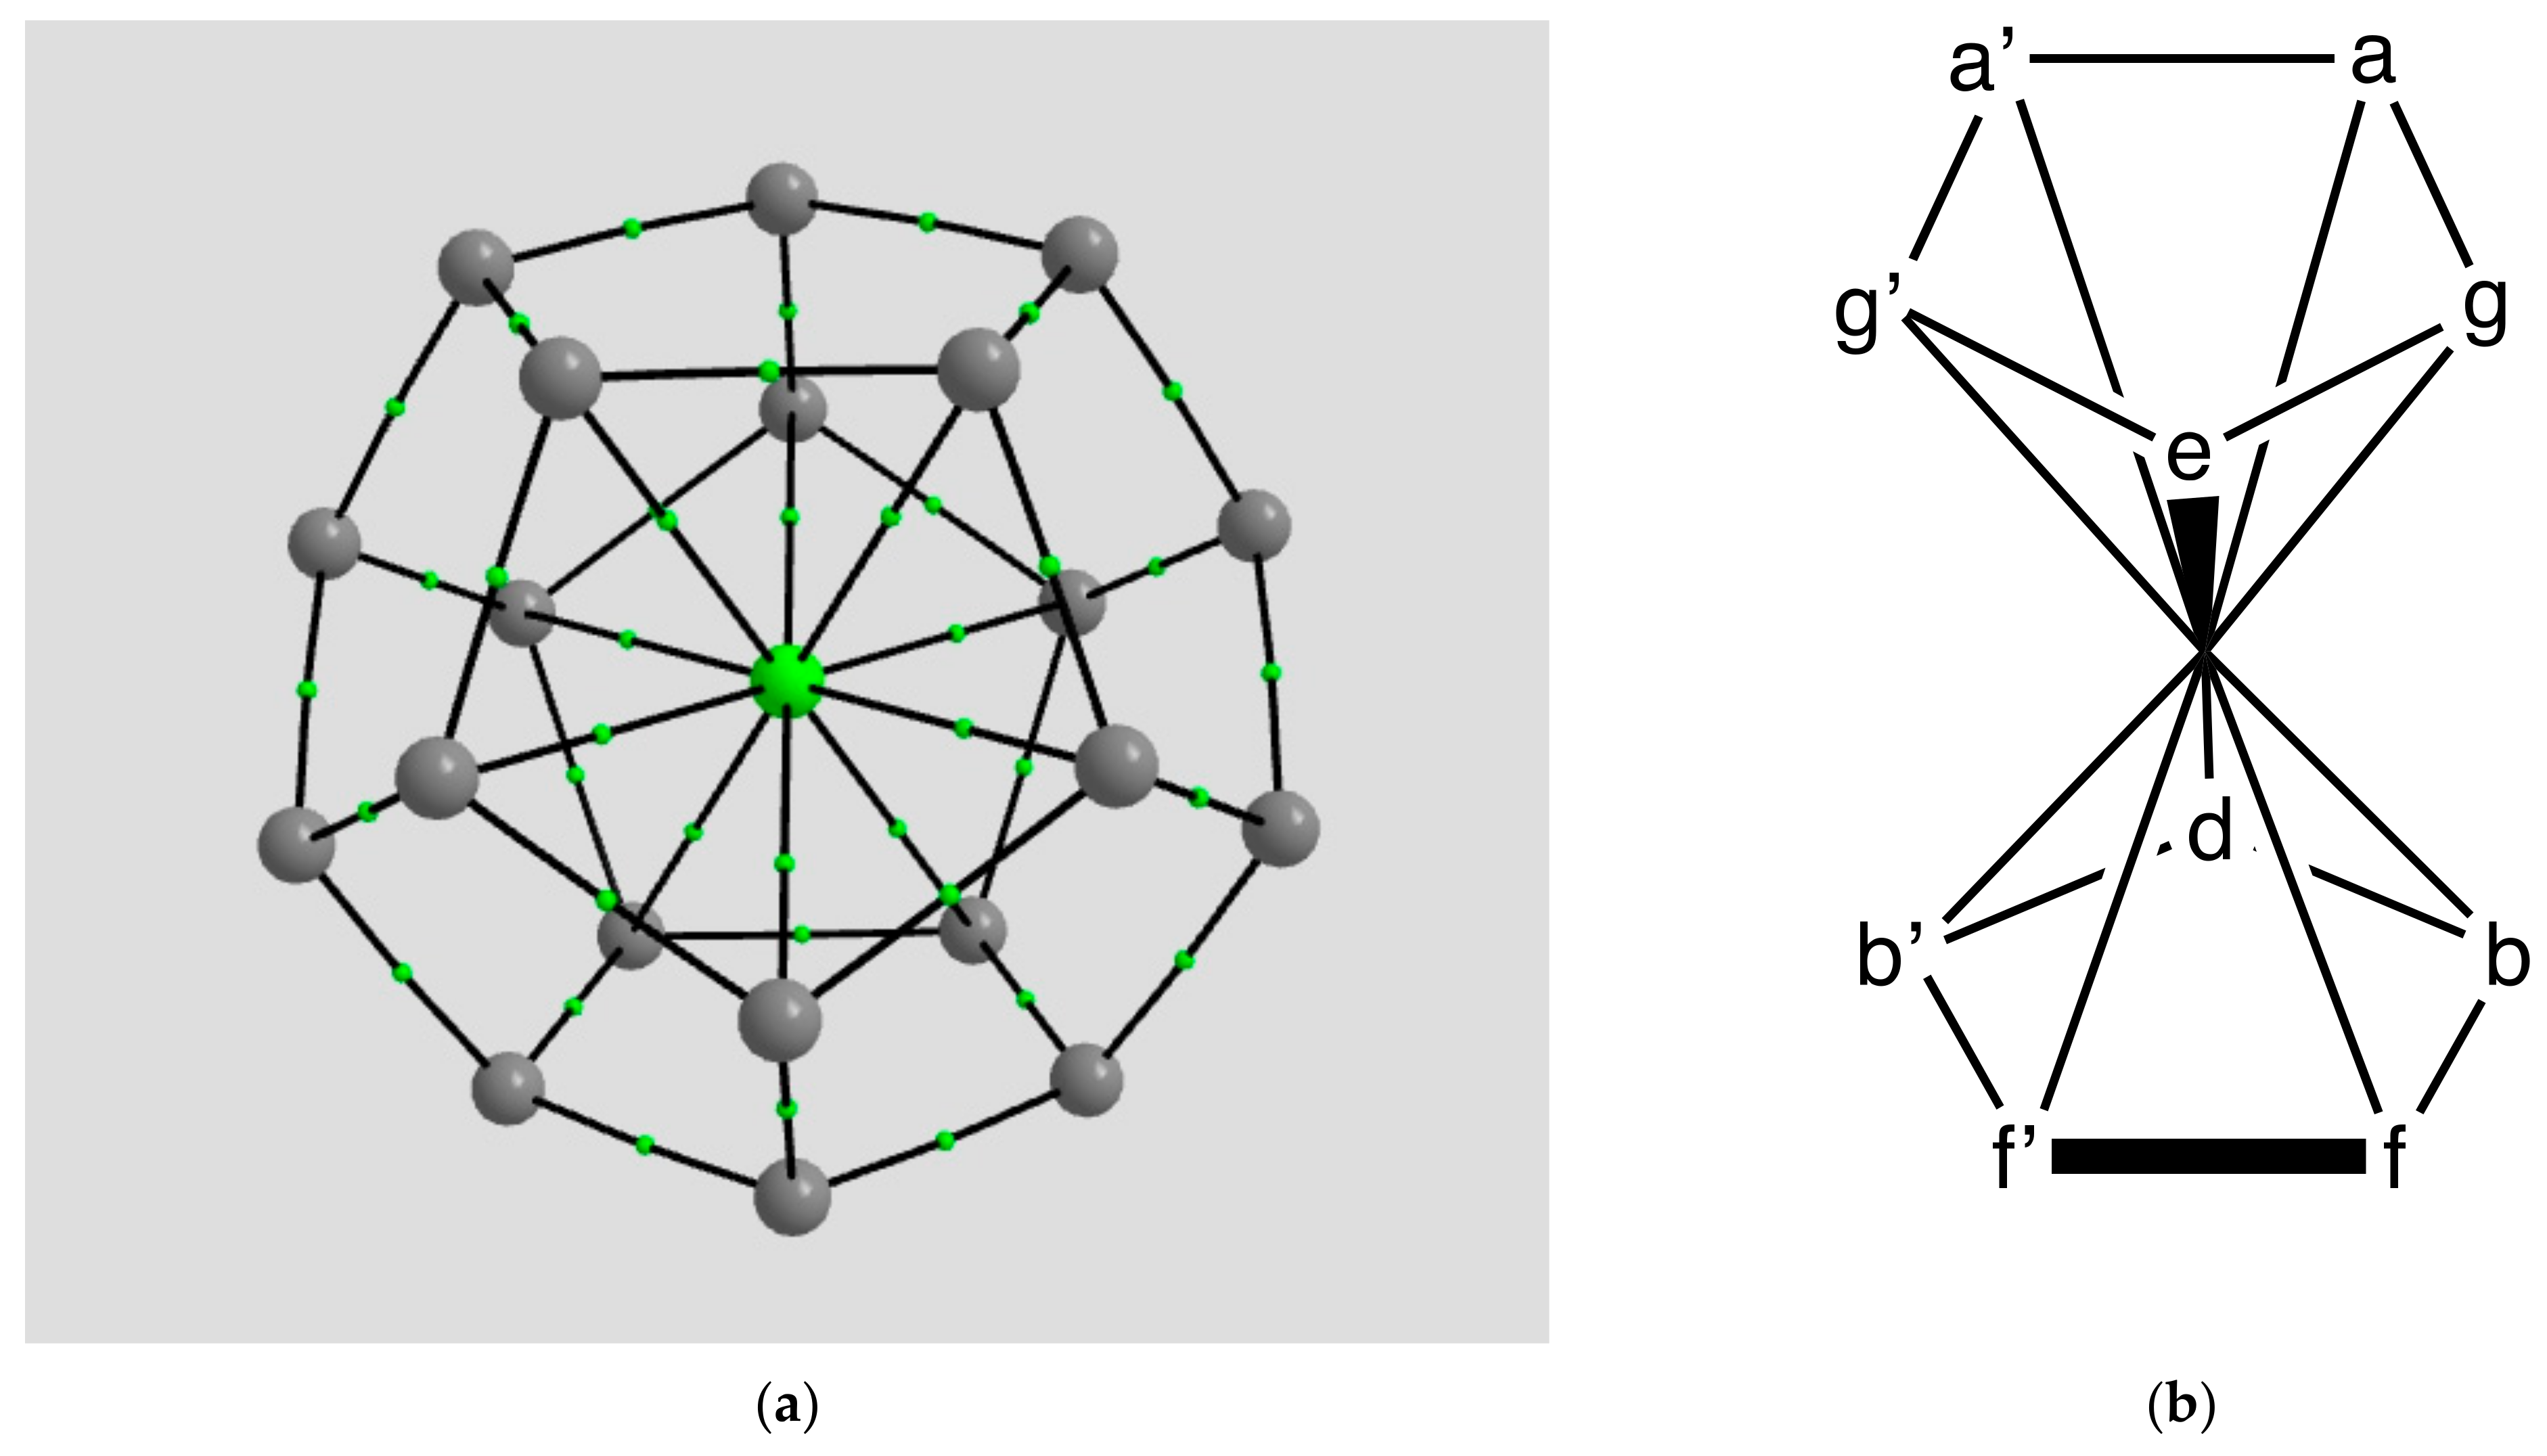
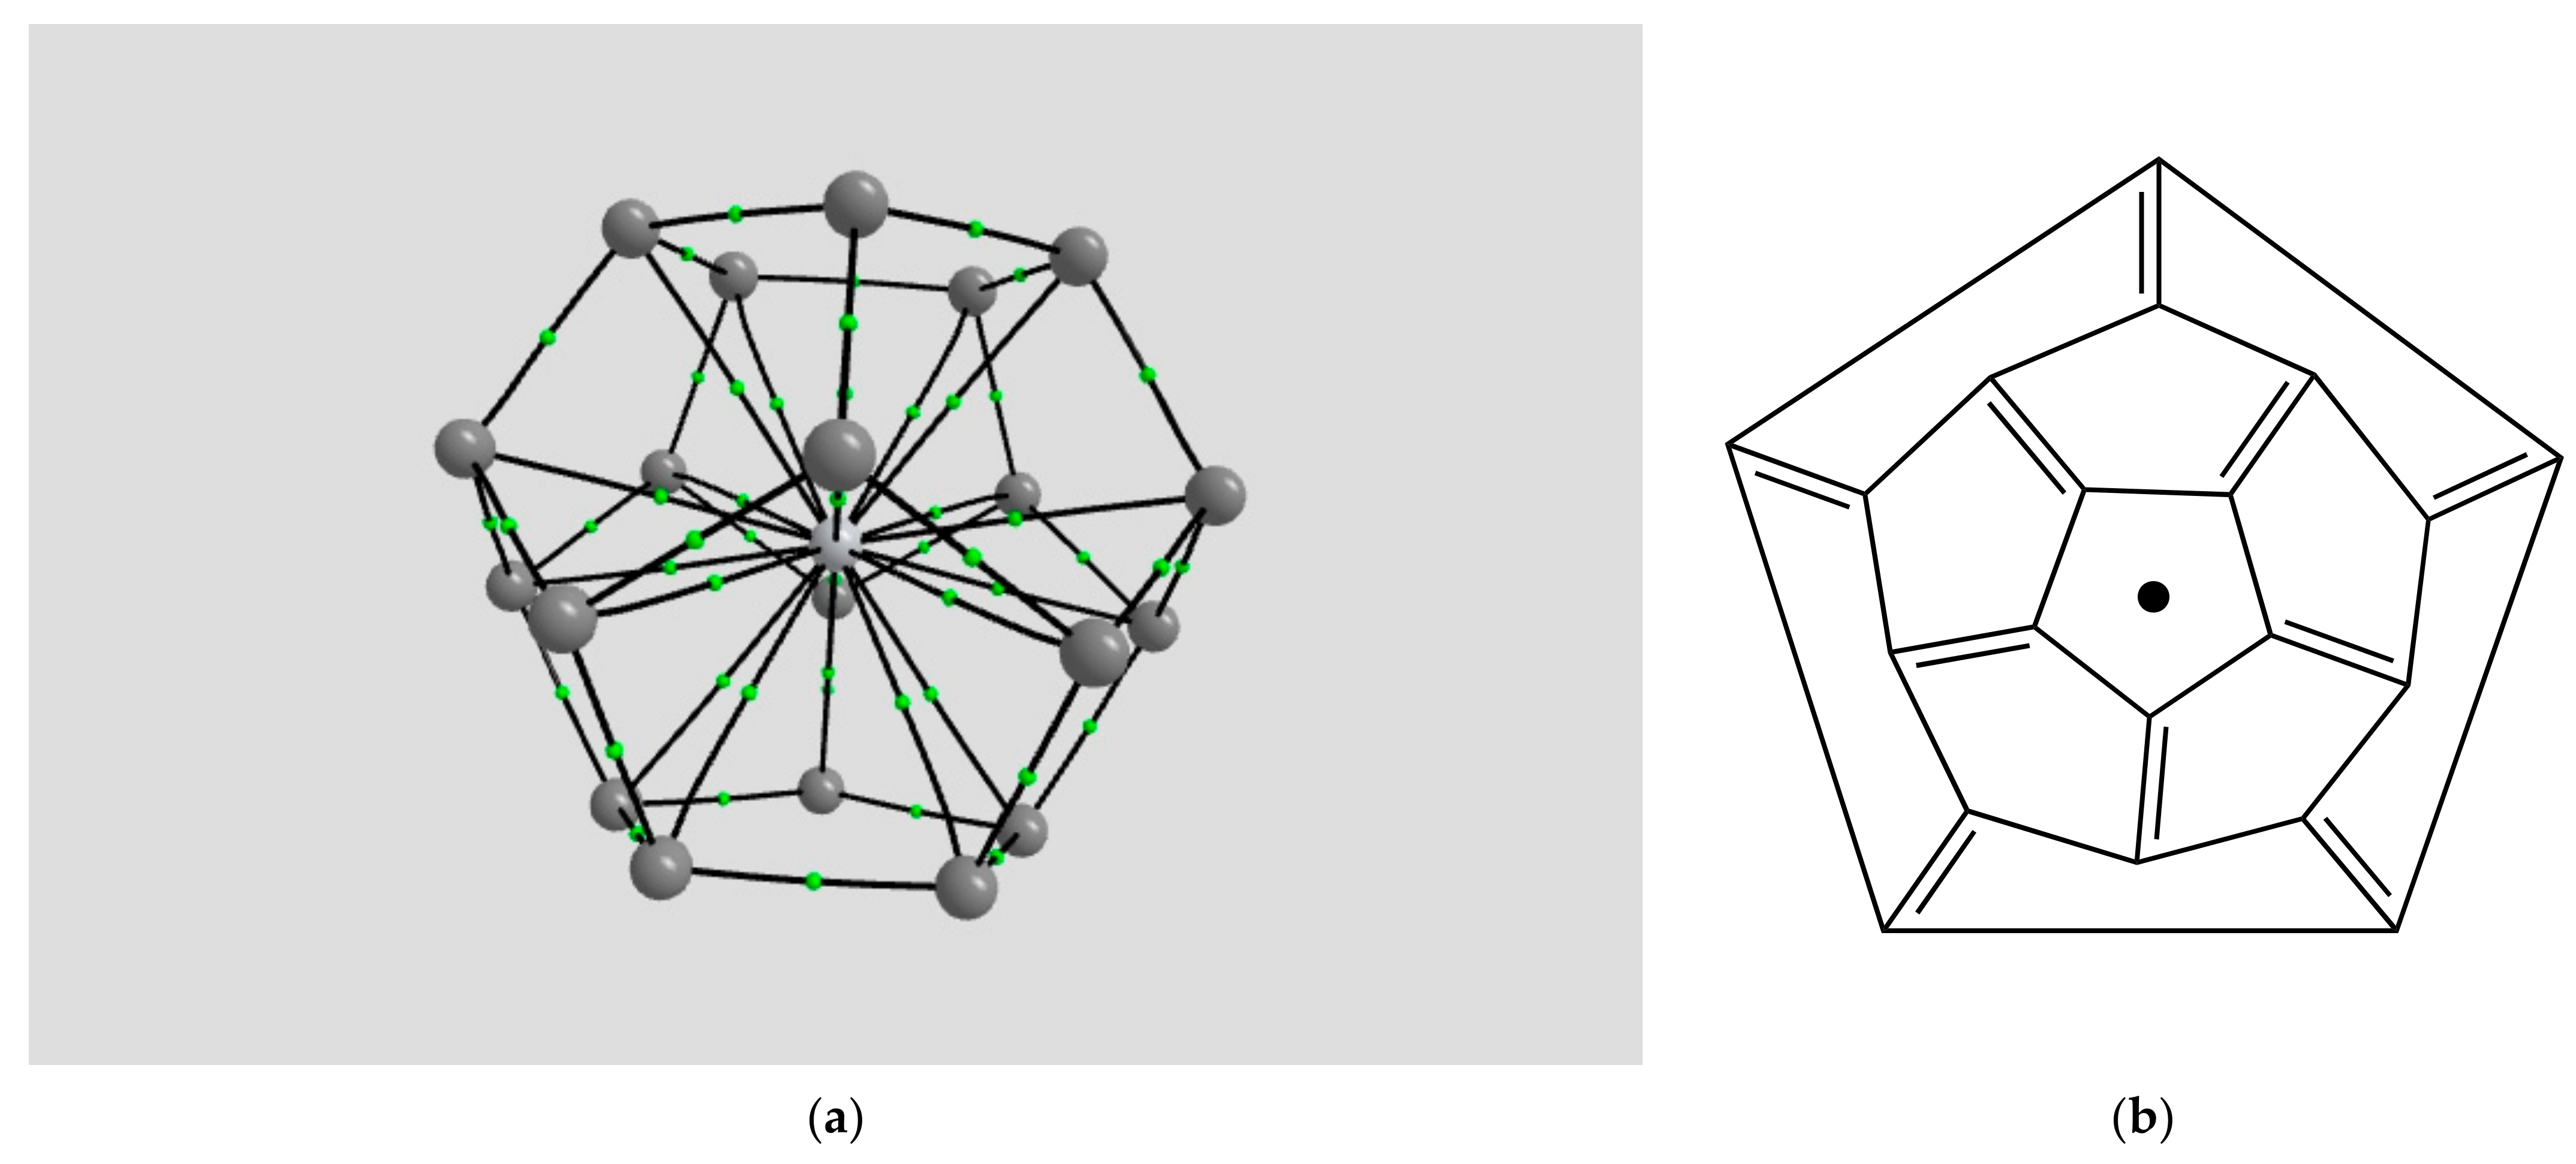
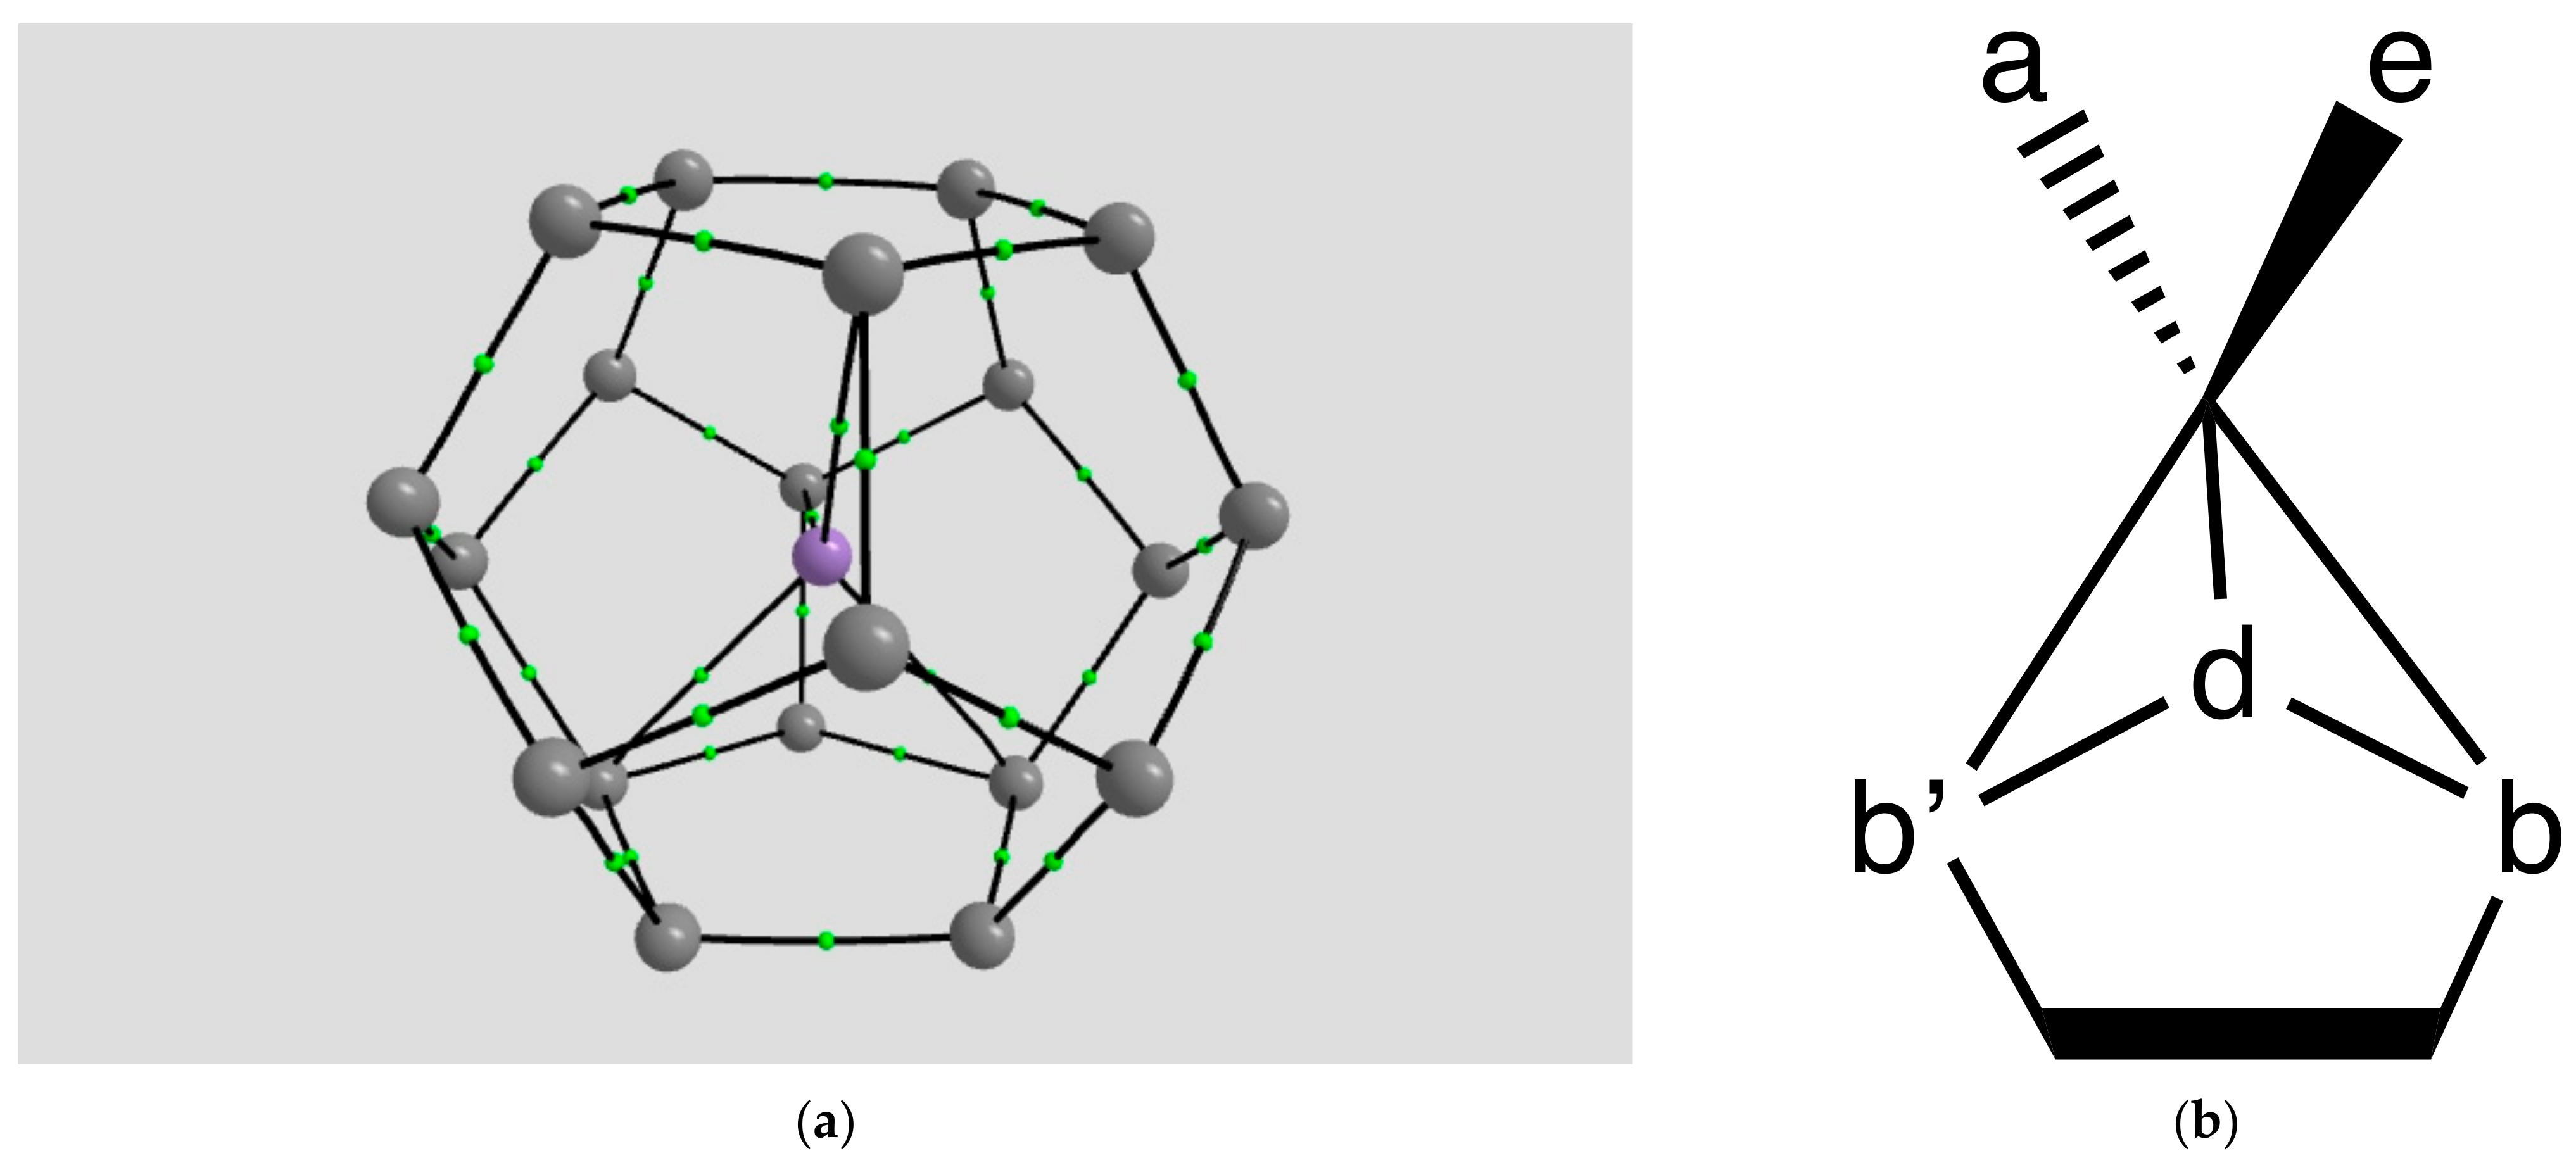
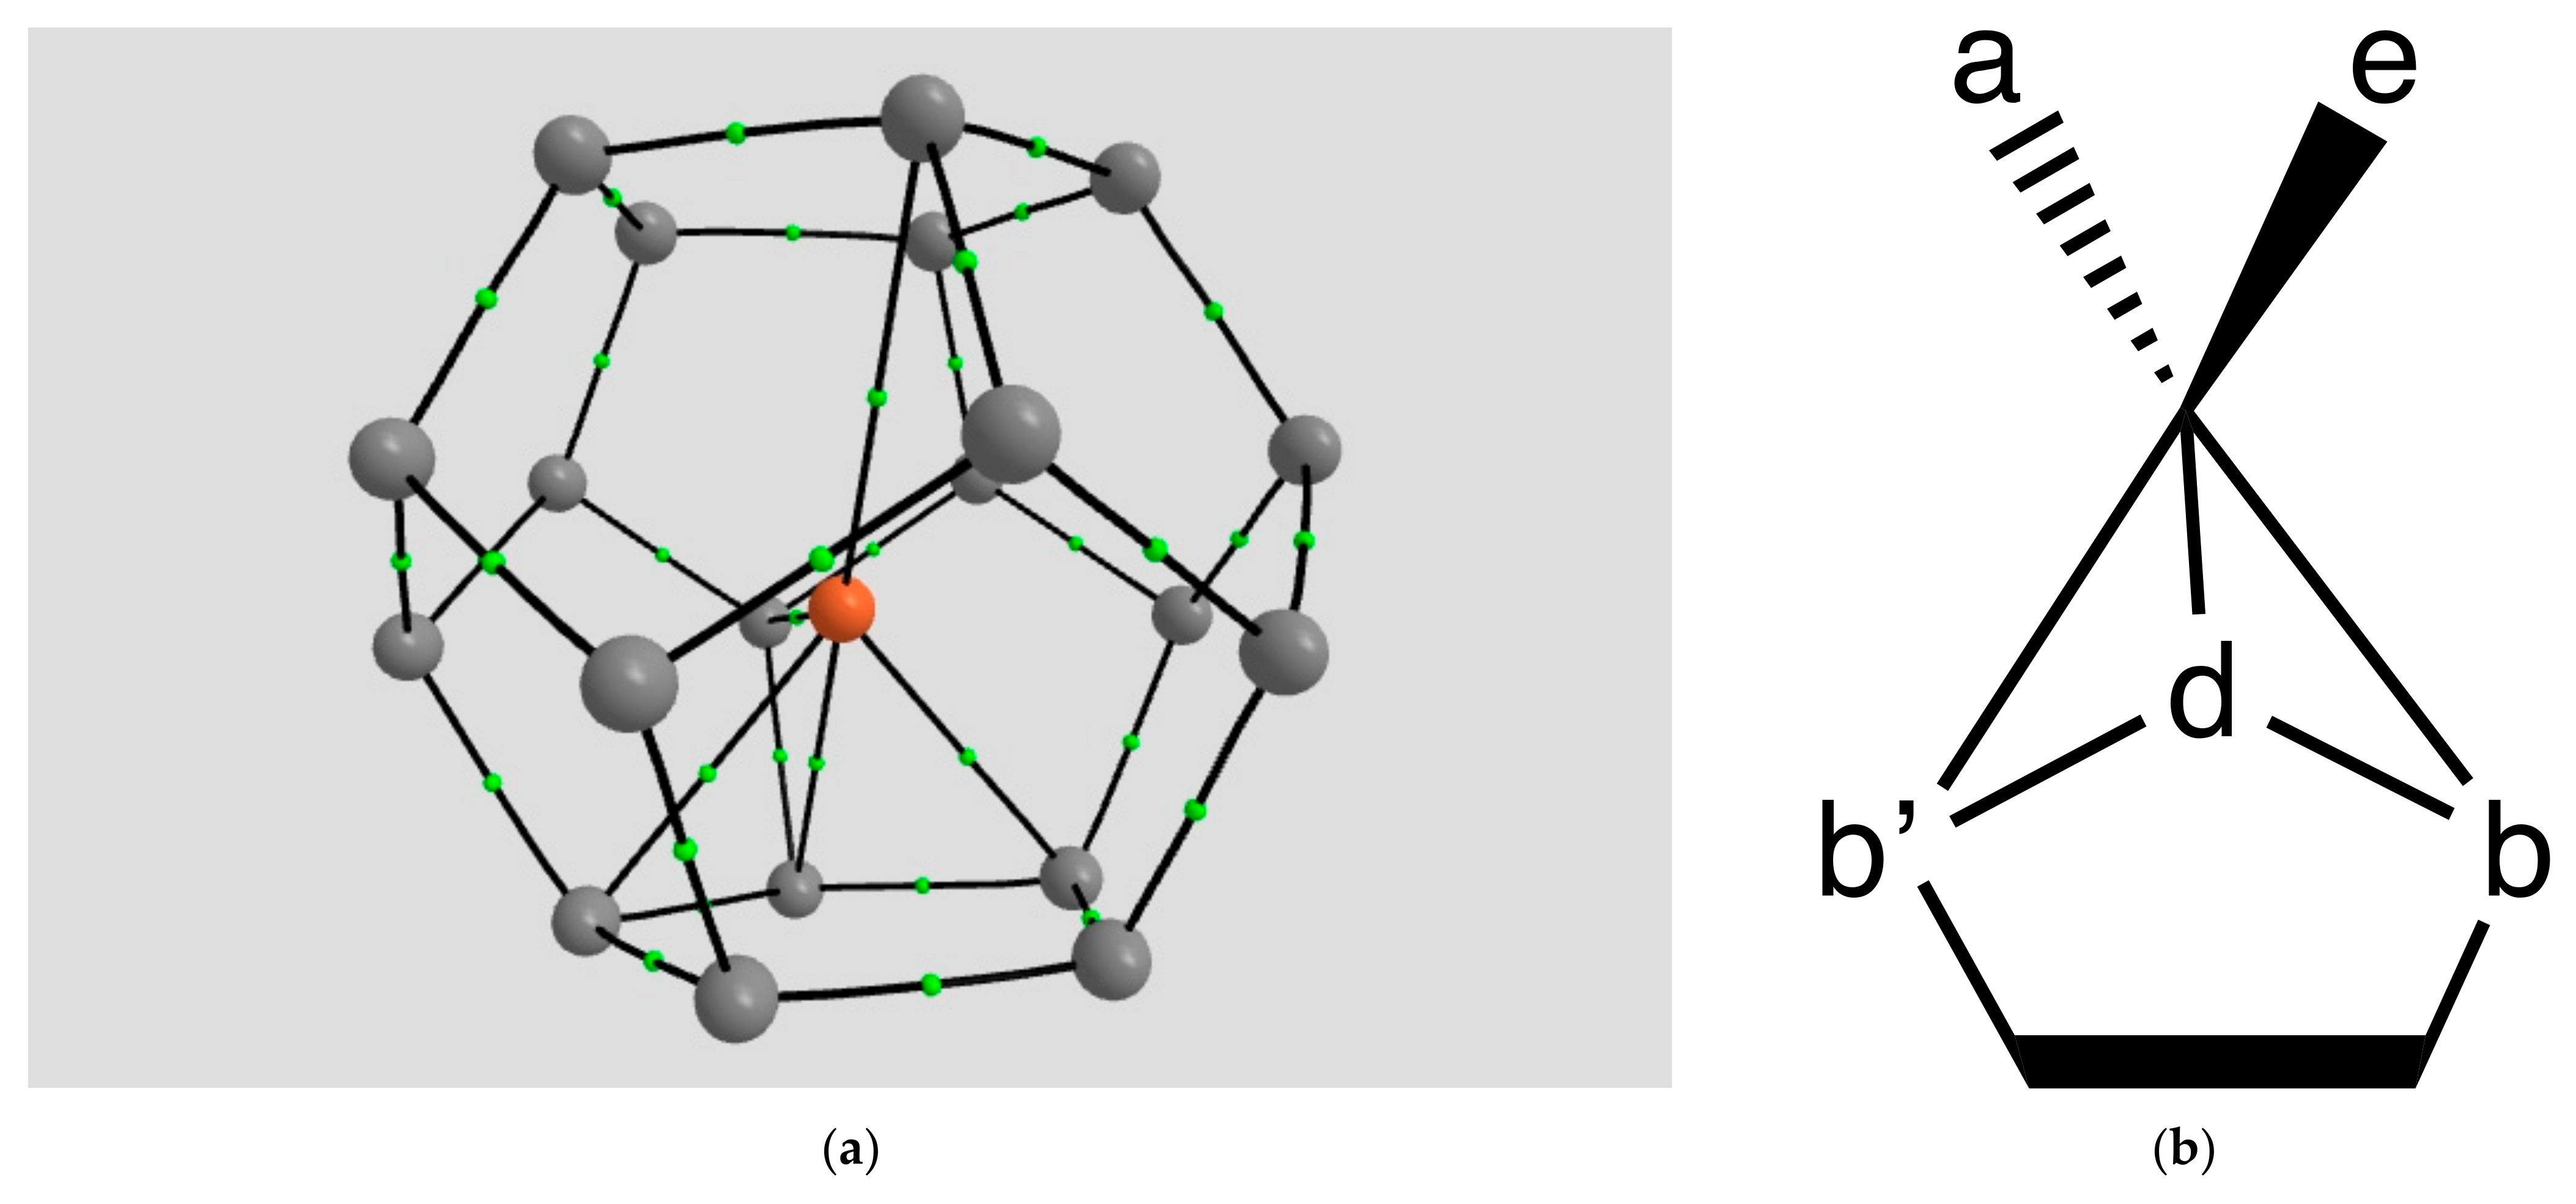
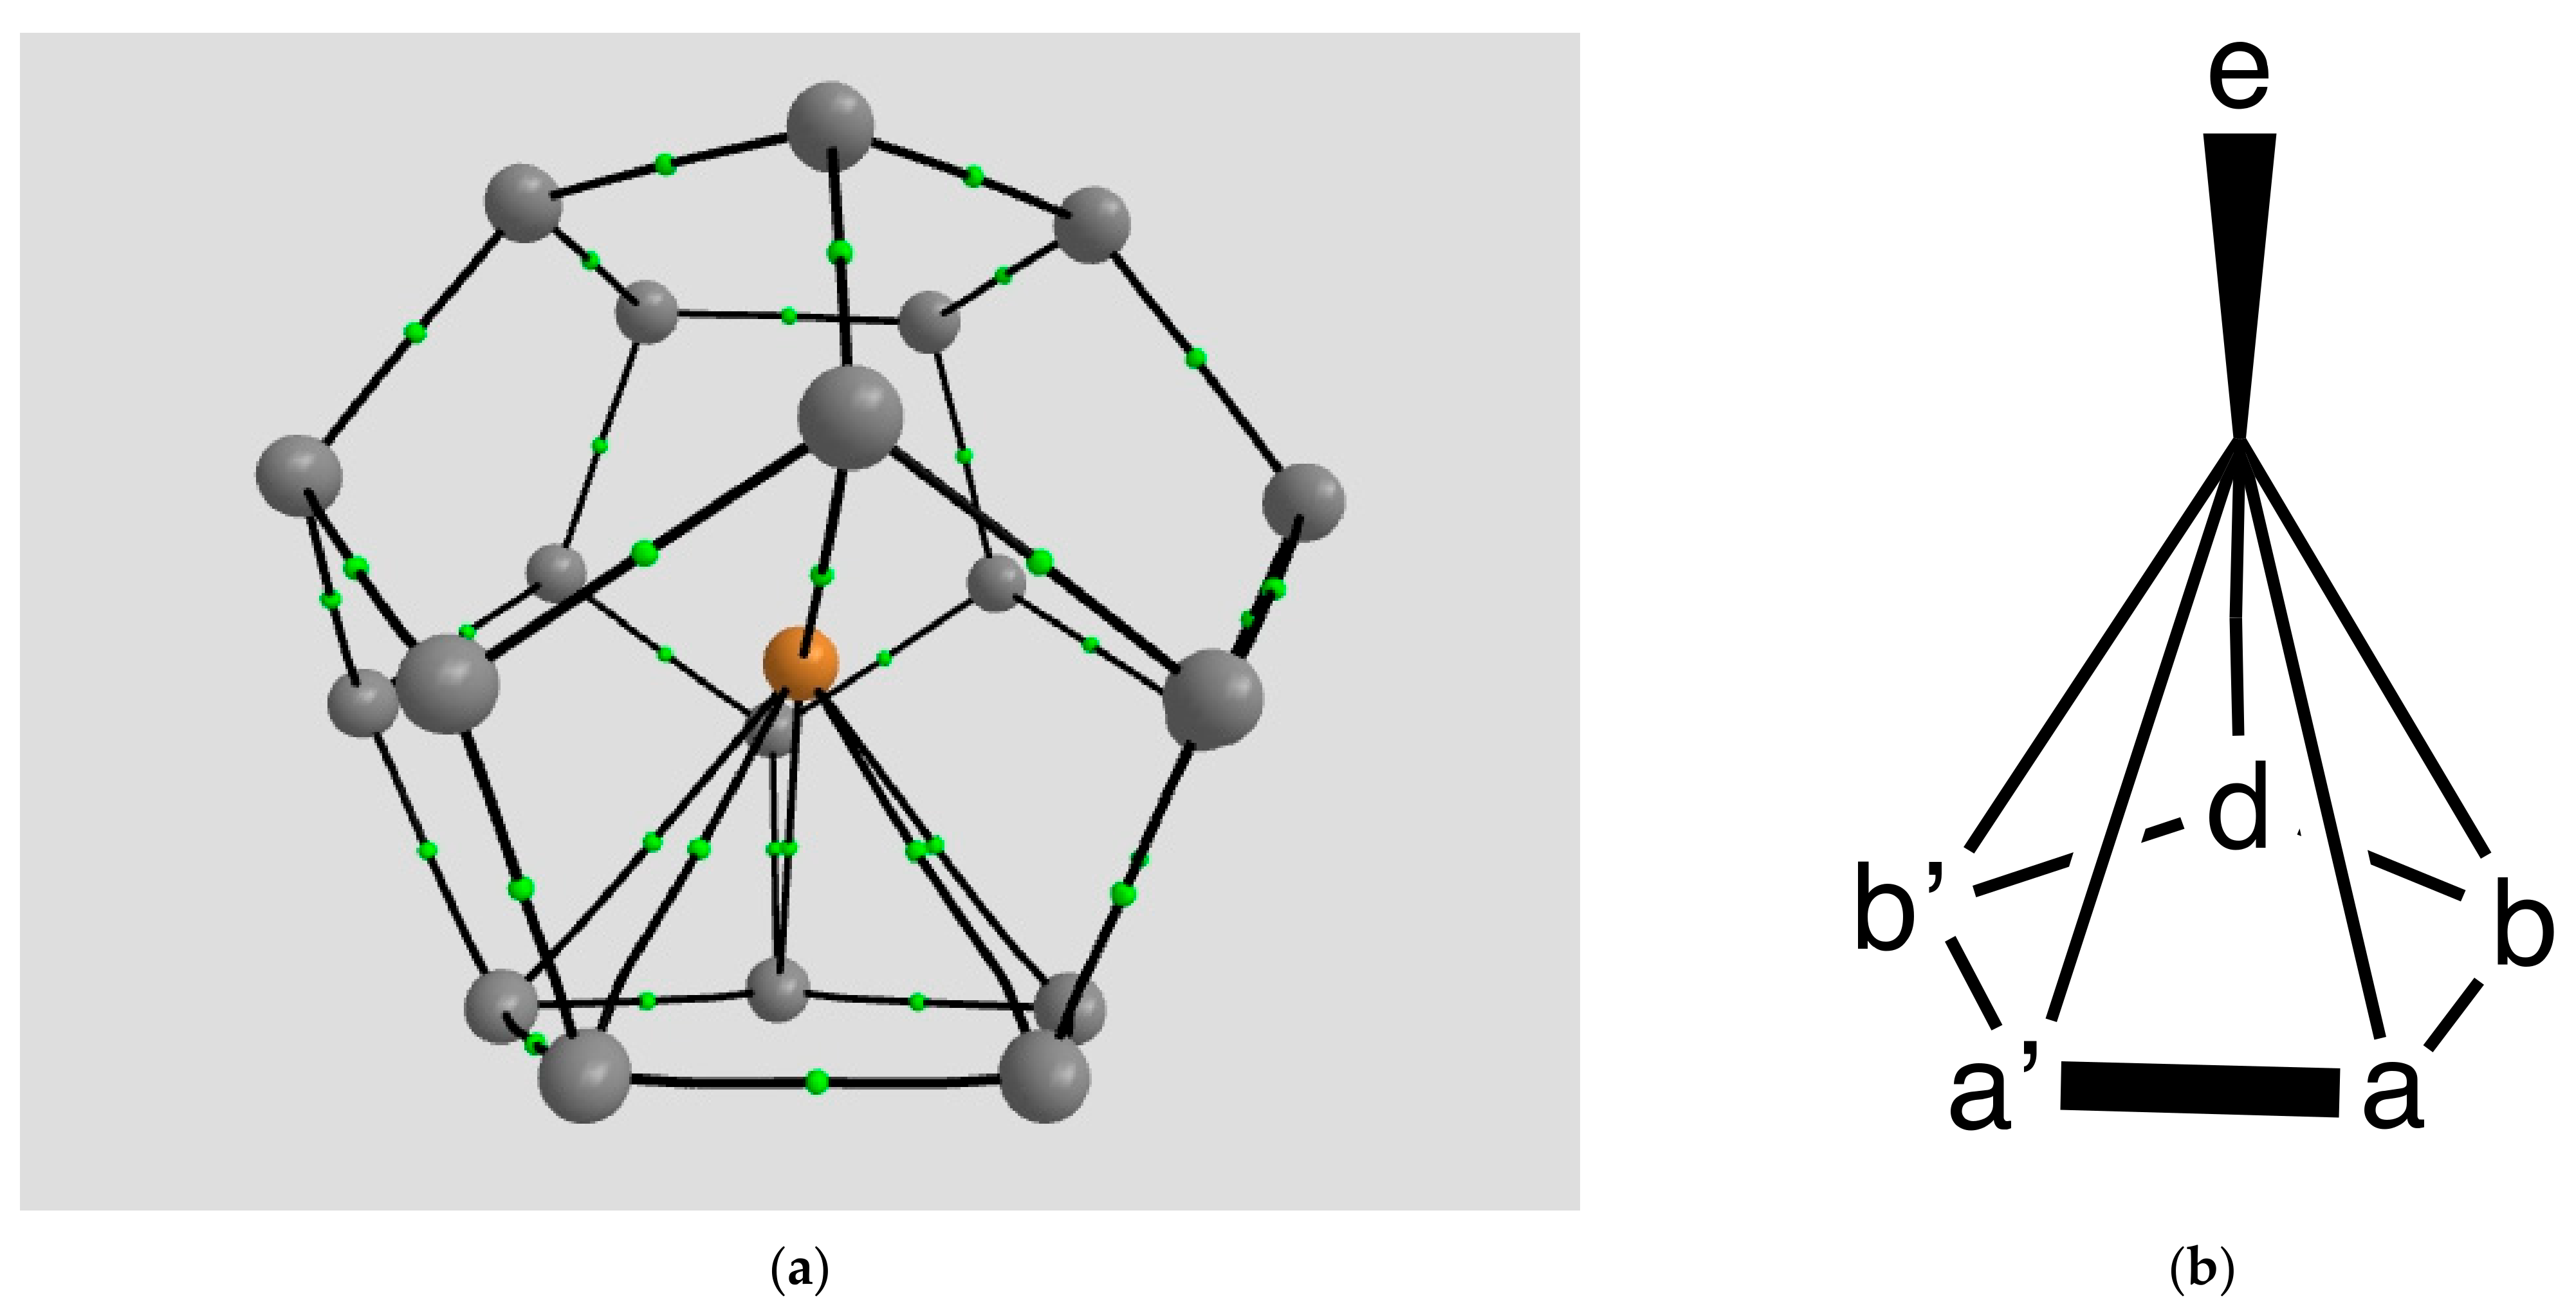
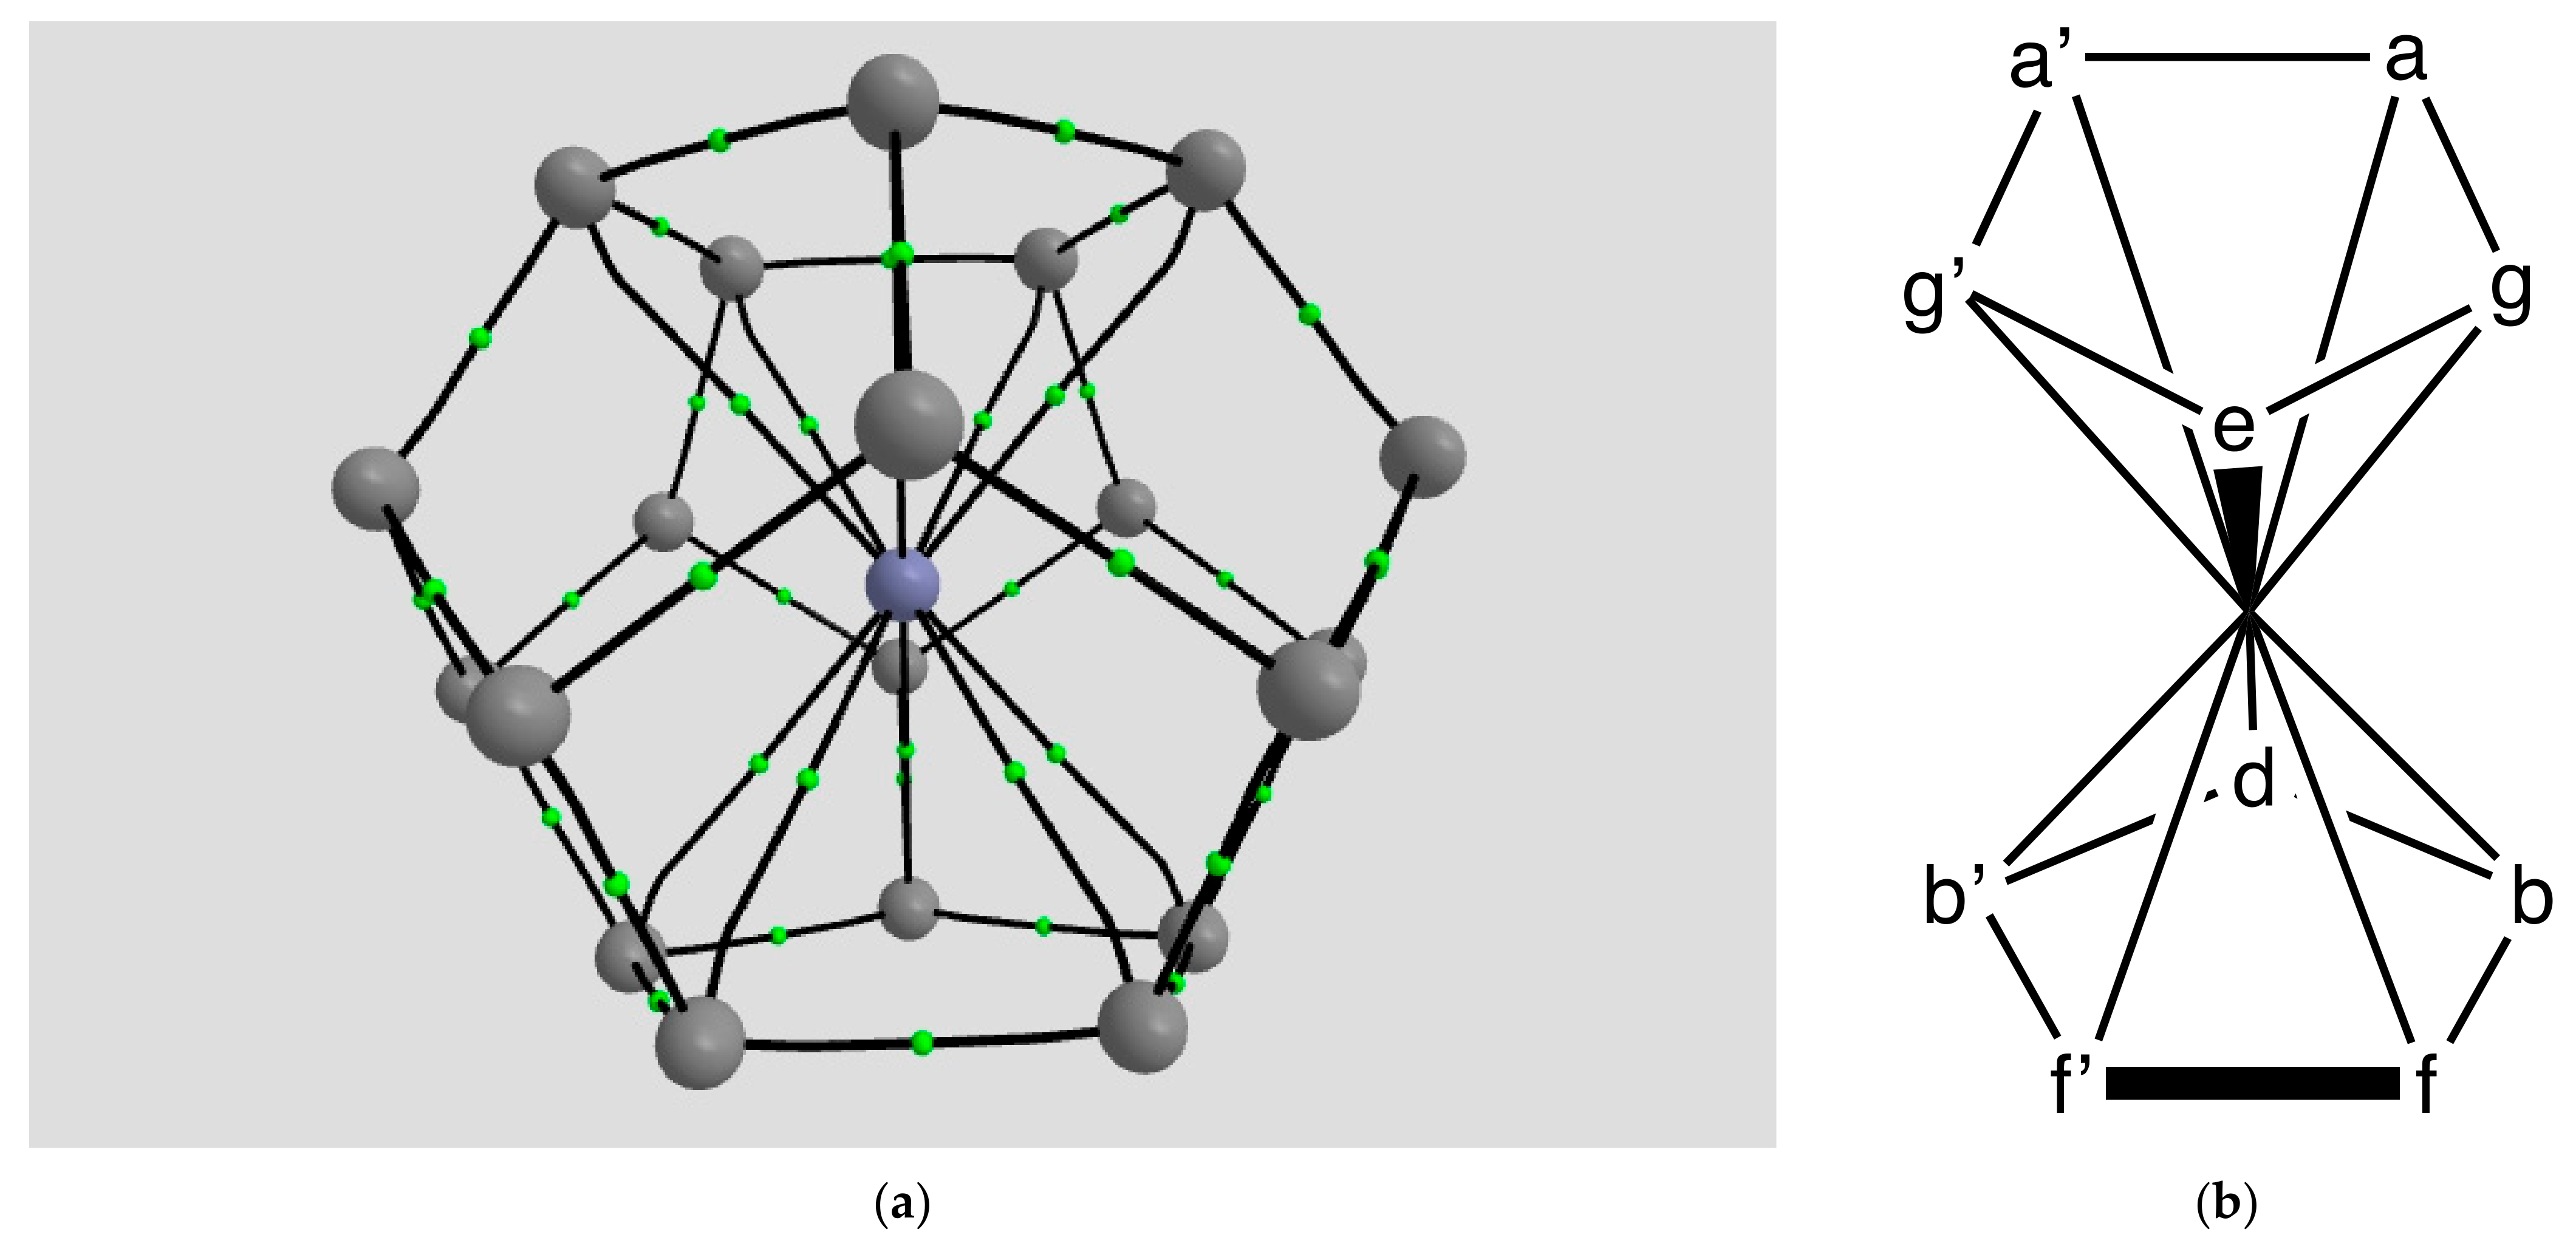
2.1.4. Endohedral M in C20 Fullerene

Illustrating use of QTAIM analysis [14,15] for M@C20, Figure 5 describes Ne@C20. The structure is optimized in ωB97XD/cc-pVDZ, and is shown in the QTAIM topology. Solid black lines connect nuclear attractors’ (3, −3) critical points (atomic centers). The lines represent ridges in the electron density function and suggest that the central Ne atom interacts strongly with all 20 of the C atoms of the fullerene container. Green dots on these connectors mark a minimum density along the ridge; these points are termed line critical points (LCPs). These are termed (3, −1) extreme points. At those points, the gradient of the density is zero and the matrix of second derivatives has one positive root corresponding the increase in density along the interaction line (call this z), and the decrease in density in the other two dimensions (x and y).

3. Methods and Software

We used density functional theory to compute the ground state energies and harmonic vibrational frequencies, and electron distribution. For the fullerenes our choice of functional was ωB97XD [31]. This functional is gradient-corrected, its exchange is scaled for distance, and the functional includes an empirical term describing dispersion interactions, Grimme’s D2 formulation [32]. The cc-pVDZ basis [33,34] was used for fullerenes and inclusion complexes. For the rhodium system, we used the Ahlrichs–Weigend basis SVP [35,36] and the Stuttgart basis SDD, [37] each of which incorporates a relativistic pseudopotential. These basis sets are all available for download [38]. Gaussian 09 [39] and Gaussian 16 [40] produced optimized structures and the wfx files required by QTAIM analysis. QTAIM treats the molecular charge density ρ and its gradients ∇ρ, and identifies interaction lines between atomic centers. Atomic centers have three negative roots of the matrix of second derivatives of the density with respect to Cartesian displacement coordinates [∂2ρ/∂xi∂xj] and are denoted as (3, −3) critical points (CPs). The interaction lines are loci of points with maximum density (negative curvature) in two dimensions, a “ridge” in the density. The minimum density point along the ridge (a saddle point with two negative and one positive curvature) may be called a line critical point (LCP) of type (3, −1).
QTAIM reports the Laplacian of the density at LCPs, and energy densities G (kinetic) and potential (V) as well. The mathematical formulation of these quantities has been clearly described [41]. This report also defines the delocalization index (DI) which counts the number of shared electron pairs. These quantities have been used widely to characterize the strength and degree of covalency of bonding.
Non-covalent interactions (NCIs) appear in regions of low density and small values of the reduced density gradient (RDG) [42]. These may be attractive (as van der Waals forces or H-bonding) or repulsive (most closed shell–closed shell interactions, such as steric effects. A useful description of the RDG, its graphical characterization, and its interpretation is given by Contreras-Garcia et al. [43,44].
QTAIM results were obtained with AIMALL [45] and Multiwfn [46,47] software. NCIPLOT software was obtained by download from the Contreras-Garcia group [44].
For the model structure for the rhodium cage, we began with idealized geometric forms (a dodecahedron of 12 Rh atoms with one more at the center of the figure) for the Rh13 cluster, and introduced terminal and then bridging CO groups to mimic the connectivity of the X-ray structure. Two H atoms were introduced along the approximately fourfold axis passing through the central Rh and the tetragonal faces of Rh atoms. The energies of these starting forms were optimized in ωB97XD/SDD and ωB97XD/def2-tzvp models. For H@MgO, structures were taken from the X-ray analysis.
Initial M@C20 structures were obtained by placing the M atom at the center of the D3d form of C20. [46] The optimization did not enforce symmetry, and several systems were found to depart substantially from this initial symmetry.

4. Results

In this section we present details of the QTAIM and NCI analyses for the three cage-confined H atom systems (Section 4.1, parts Section 4.1.1, Section 4.1.2 and Section 4.1.3) and metal endohedral C20 fullerenes (Section 4.2, parts Section 4.2.1, Section 4.2.2, Section 4.2.3, Section 4.2.4, Section 4.2.5, Section 4.2.6, Section 4.2.7, Section 4.2.8, Section 4.2.9, Section 4.2.10, Section 4.2.11, Section 4.2.12, Section 4.2.13, Section 4.2.14 and Section 4.2.15). Summary remarks on the QTAIM analysis for members of the M@C20 series are to be found in Section 4.2.14, and an overview of the NCI results is to be found in Section 4.2.15.

4.1. Captured H Atoms

In the following sections we describe geometries of systems in which foreign atoms are captured. Some structures are simply borrowed from reported X-ray crystallography studies (as in the H-doped MgO solid sample and the experimentally known unsymmetric rhodium cage compound), while other structures are found by geometry optimization in ωB97XD/cc-pVDZ. These include all the M@C20 fullerenes and the modeled high-symmetry rhodium and cobalt cage compounds.

4.1.1. H Atoms in Rhodium Cages

The unsymmetric experimental rhodium cage [7] and the symmetrized analog capture H atom in a square-pyramidal environment, as shown above in Figure 2. The QTAIM analysis is unwieldy owing to the low symmetry of the species; it can be found in supplementary information. An idealized D4h structure of a simplified structure H2Re13(CO)12]3−, is shown in Figure 6a. Then H atoms occupy square-pyramidal holes and have five Rh atoms as neighbors in a square pyramid. Each Rh is bound to a CO carbon and four Rh neighbors, as in the experimental structure. A further idealization of the rhodium system with bridging carbonyls and formula H2Re13(CO)24]3− is shown in Figure 6b.
Figure 7 shows the linear H-Rh-H arrangement, and (less evident) the square base in which the H atoms are to be found. The connectivity is presented in schematic fashion in Figure 7b, which defines the labeling scheme used for Table 1.
Table 1 contains QTAIM data for the symmetrized H2Rh13(CO)243− trianion. The structure is obtained by optimization with ωB97XD/SDD. Symmetrization is far from perfect but it is clear that the distance from H to the central Rh (2.628 ± 0.04 Å) is larger than the distance from H to the Rh atoms making up the square bases (1.786 ± 0.026 Å). The Laplacian values are all positive, indicating a depletion of charge at the H-Rh LCPs, characteristic of closed shell interactions. However, the delocalization index (DI), which reflects the number of shared electron pairs [48], suggests that covalent interactions are significant. If the ratio |V|/G < 1, we take the bonding to be mainly ionic, while if the ratio exceeds 2, the bonding is covalent. In this case, the ratio lies between 1 and 2, and bonding is considered “mixed” [48]. The bond strength measure −V/2 [49,50] assigns the interaction energy (about 0.05 to 0.06 Hartree) to the H-Rh interaction energy. For a detailed guide to the mathematical formulation of these QTAIM constructs see [48].
The delocalization index DI is an estimate of electron pairs shared between atoms. Negative values for H = G + V, or values of |V|/G > 1 (here they average about 1.4) suggest that covalent interactions are significant.
The DI index for H atom and the five surrounding Rh atoms is 1.304 ± 0.026, which does exceed the ideal limit of 1.00 for perfectly covalent dihydrogen. However, if a pentavalent species is to share five electron pairs, we see that it is seriously misleading to describe hydrogen atom in the Rh square pyramid as being pentavalent. It is of course pentacoordinate since it interacts with five immediate neighbors.
A view of the NCI surfaces for H2Rh13(CO)243− trianion is given in Figure 8.
NCI zones appear around the outer surface of the Rh dodecahedron, but there are no such zones near H atoms. This suggests that dispersion and steric interactions between H atom and Rh atoms making up its cage are not significant. The bonding is weak according to QTAIM but results predominantly from covalent/orbital mixing interactions.

4.1.2. The H Atom Captured in a Six-Coordinate Cobalt Cage

Figure 9a shows the cobalt cage compound HCo6(CO)151− anion, by the density ridge lines connecting nuclear centers (in QTAIM terminology, (3, −3) critical points, meaning that density decreases in all three directions from the critical point. The density ridge or line critical points (LCPs) are minima along the line, and are called (3, −1) points. The trapped H atom interacts with all six Co atoms. Figure 9b schematizes those interactions and provides a labeling scheme, which is used in Table 2, summarizing QTAIM parameters.
The delocalization index DI is an estimate of electron pairs shared between atoms. Negative values for H = G + V, or values of |V|/G > 1 (here they average about 1.4) suggest that covalent interactions are significant.
Values of QTAIM collected in Table 2 attest to weak Co-H bonding with a degree of covalency. The delocalization index DI is an estimate of electron pairs shared between atoms. Negative values for H, or values of |V|/G > 1 suggest that covalent interactions are significant. Here |V|/G averages about 1.3, so bonding is mixed. This is appropriate for these weakly charged systems and consistent with the modest values of the DI. The positive values of the Laplacian are characteristic of closed shell—closed shell interaction, so we must infer a delicate balance between weak covalent interaction and near-canceling steric repulsion and attractive dispersion.
The total DI of 1.4033 electron pairs shared among the six immediate Co neighbors of H atom, is comparable to the DI of H in the rhodium cage. In analogy to the Rh case, if hexavalency implies that six electron pairs participate in bonding with H, it cannot be said that H is hexavalent. It is surely hexacoordinate; there is a small degree of covalency associated with those six interactions.
The NCI graphical analysis for the HCo6(CO)151− anion (Figure 10) shows noncovalent interactions between Co atoms but no evident NCI from Co to H atom. Evidently the dispersion and steric NCIs tend to cancel.

4.1.3. Hydrogen Atom in MgO

The H atom in the system H@MgO takes the place of an O atom in the crystal’s rock salt structure. The interaction lines derived from QTAIM analysis are shown in Figure 11a.
The QTAIM analysis assigns charges of +1.7671 to Mg, −1.7858 to O, and −0.7839 to H. (Units are absolute electrons, |e|). Table 3 shows small densities at line critical points and positive values for the Laplacian, indicating charge depletion at the LCPs. This is characteristic of closed shell–closed shell interactions. The delocalization index DI four interactions to suggests minimal electron pair sharing, and the H index shows that the weak H…O interaction is balanced between covalent and ionic character. H…Mg tilts slightly to the covalent side, while Mg…O is decidedly ionic; the ratio |V|/G is 0.83. Mg…O is also the strongest interaction according to −V/2, ca 0.024 Hartrees.
With four H…O interactions and two H…Mg interactions identified by QTAIM the total number of electron pairs shared with H and neighbors is 0.50; that value falls short of the total Mg…O DI of 6 × 0.144 = 0.86 shared pairs. Again, although H has six neighbors, it is far from hexavalent. Of course, the high degree of ionicity in the salt virtually precludes covalency.
The non-covalent interaction analysis produces surfaces enclosing regions of low density and low reduced density gradient. Figure 12 provides a view through the top layer of MgO.
Behind the central Mg atom is a surface enclosing the H atom and blocking it from view. The blue–green color coding suggests that the Mg-H interaction is weak. Behind every edge-Mg lies an O atom, with a blue NCI zone between them. This is a strongly attractive ion-ion NCI. A similar but darker blue ring can be seen between edge O atoms and the Mg atoms behind them. The NCI visualization is entirely consistent with the semi-quantitative QTAIM description

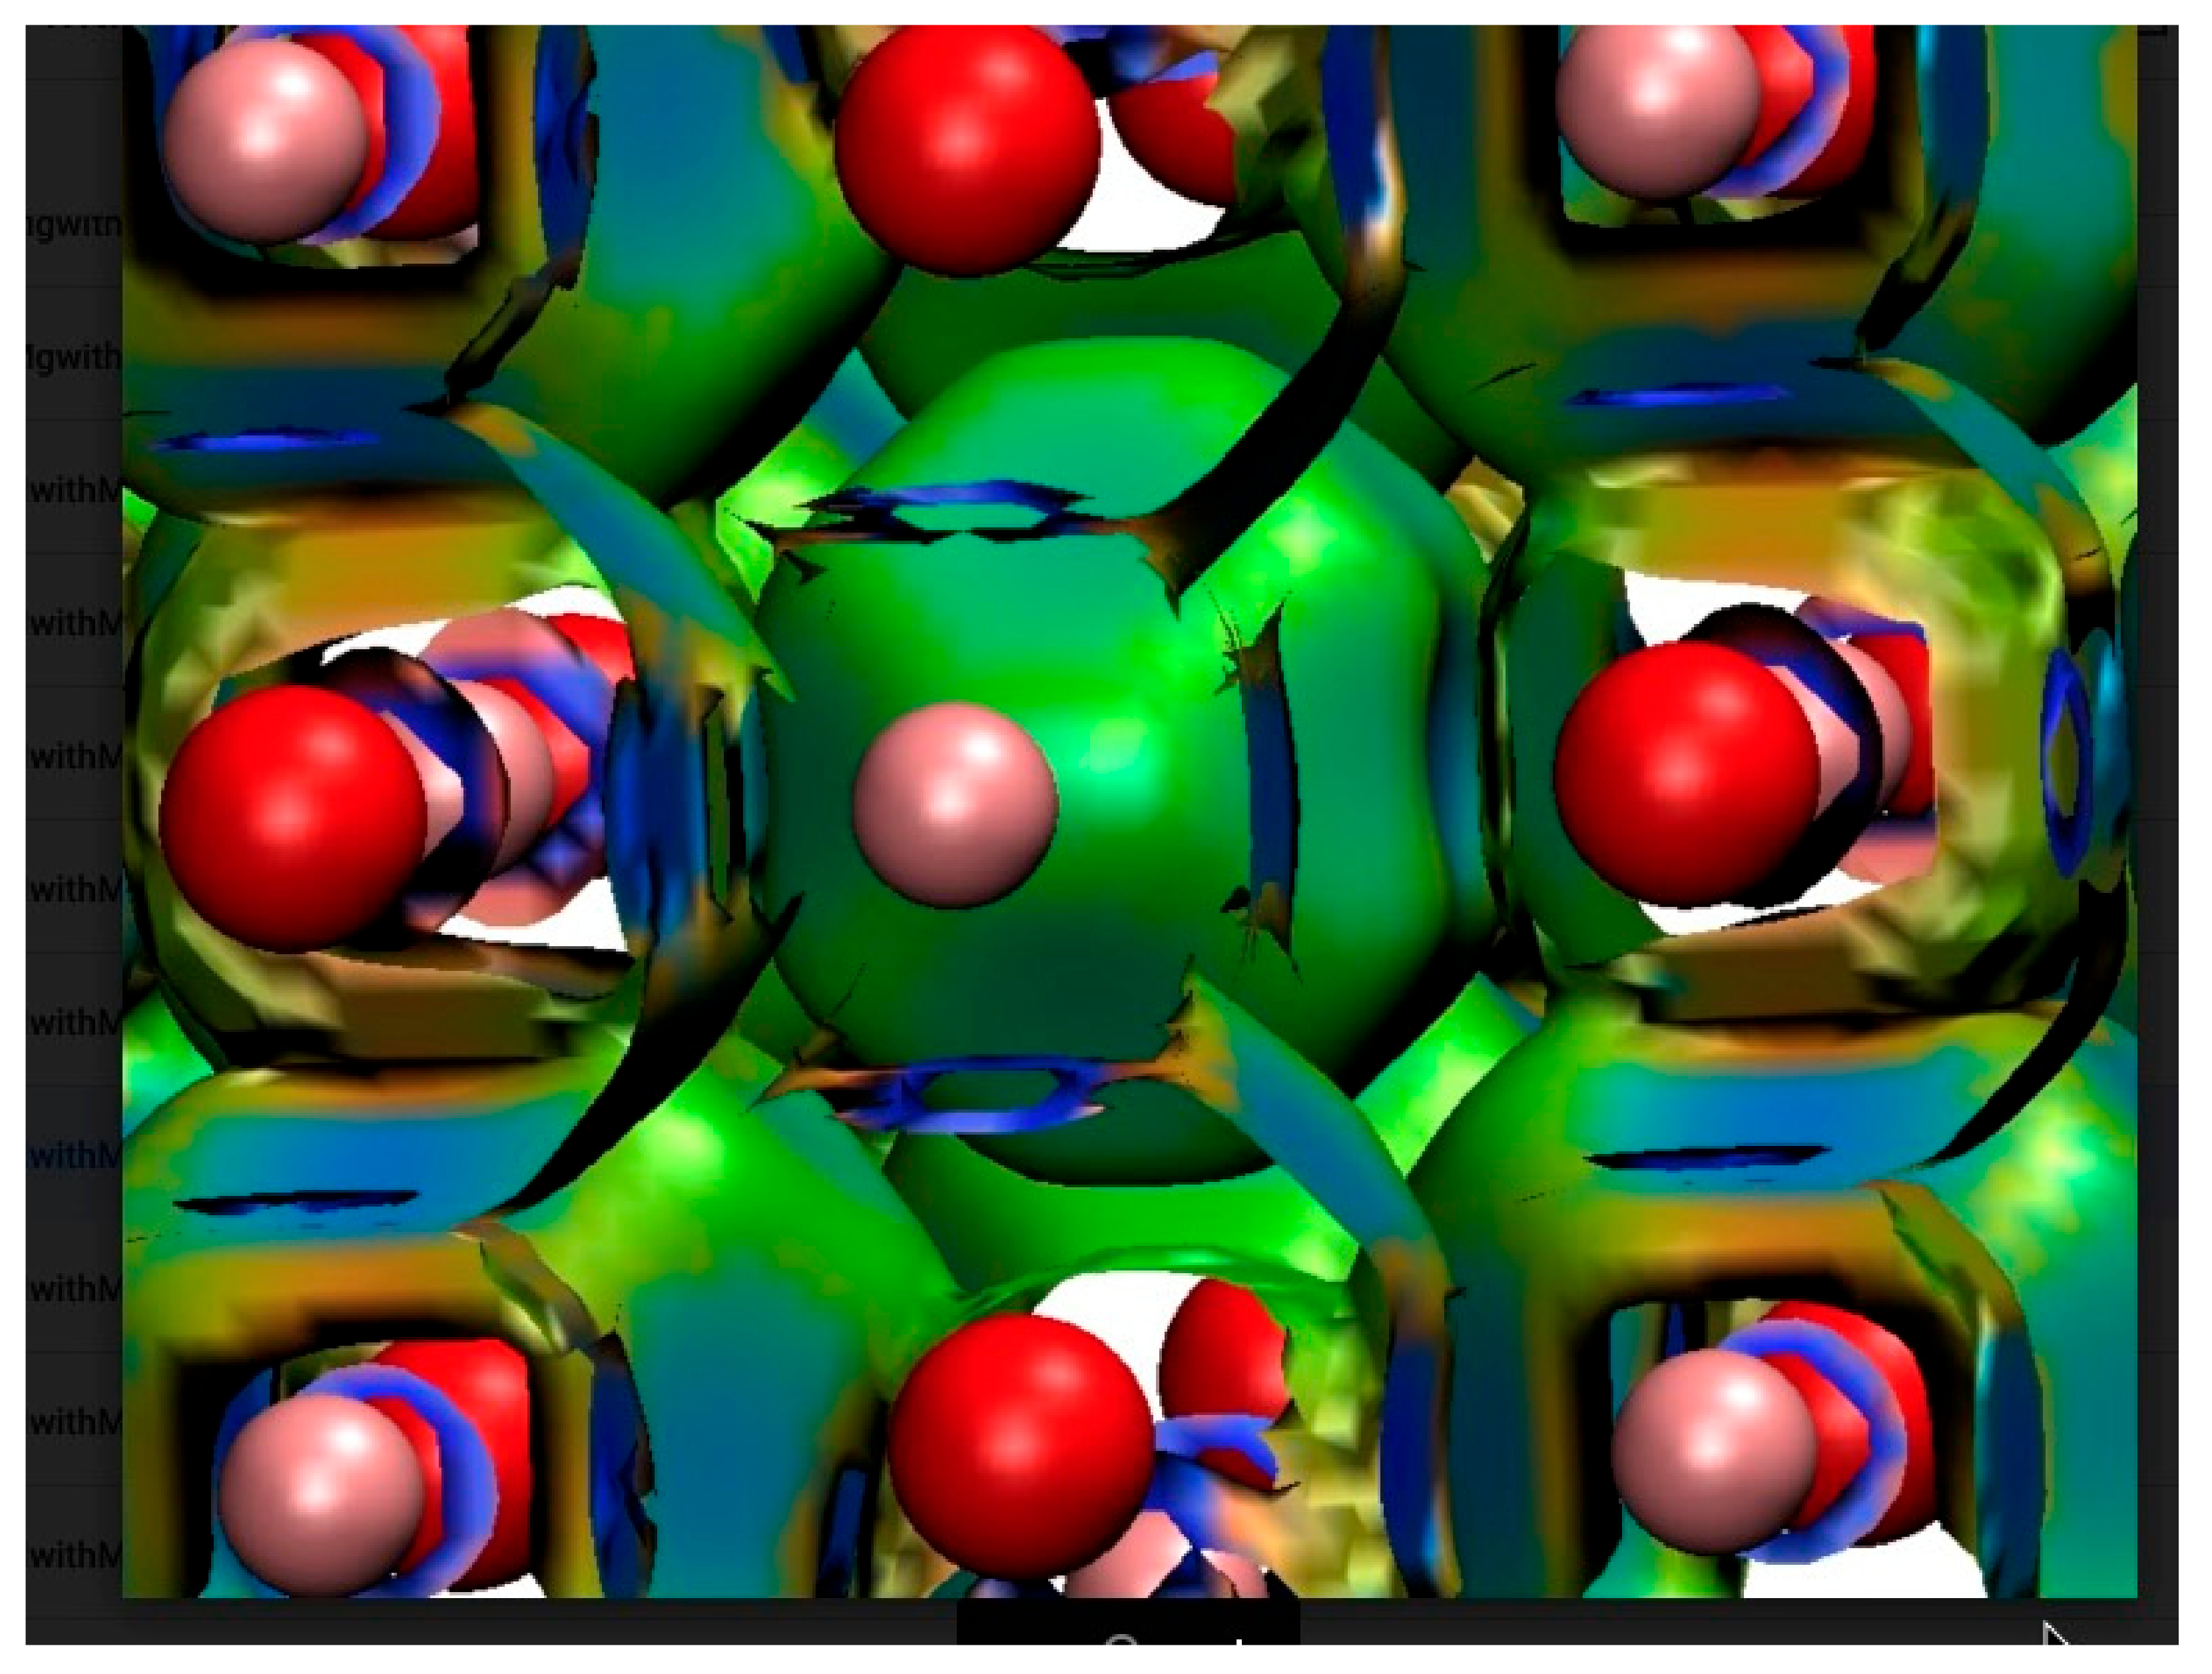
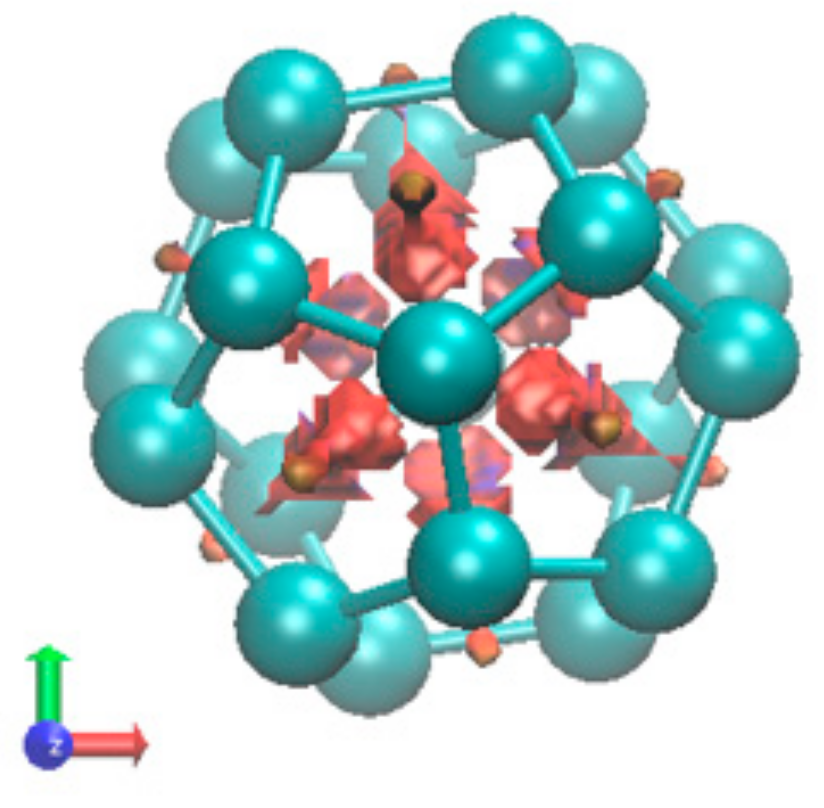
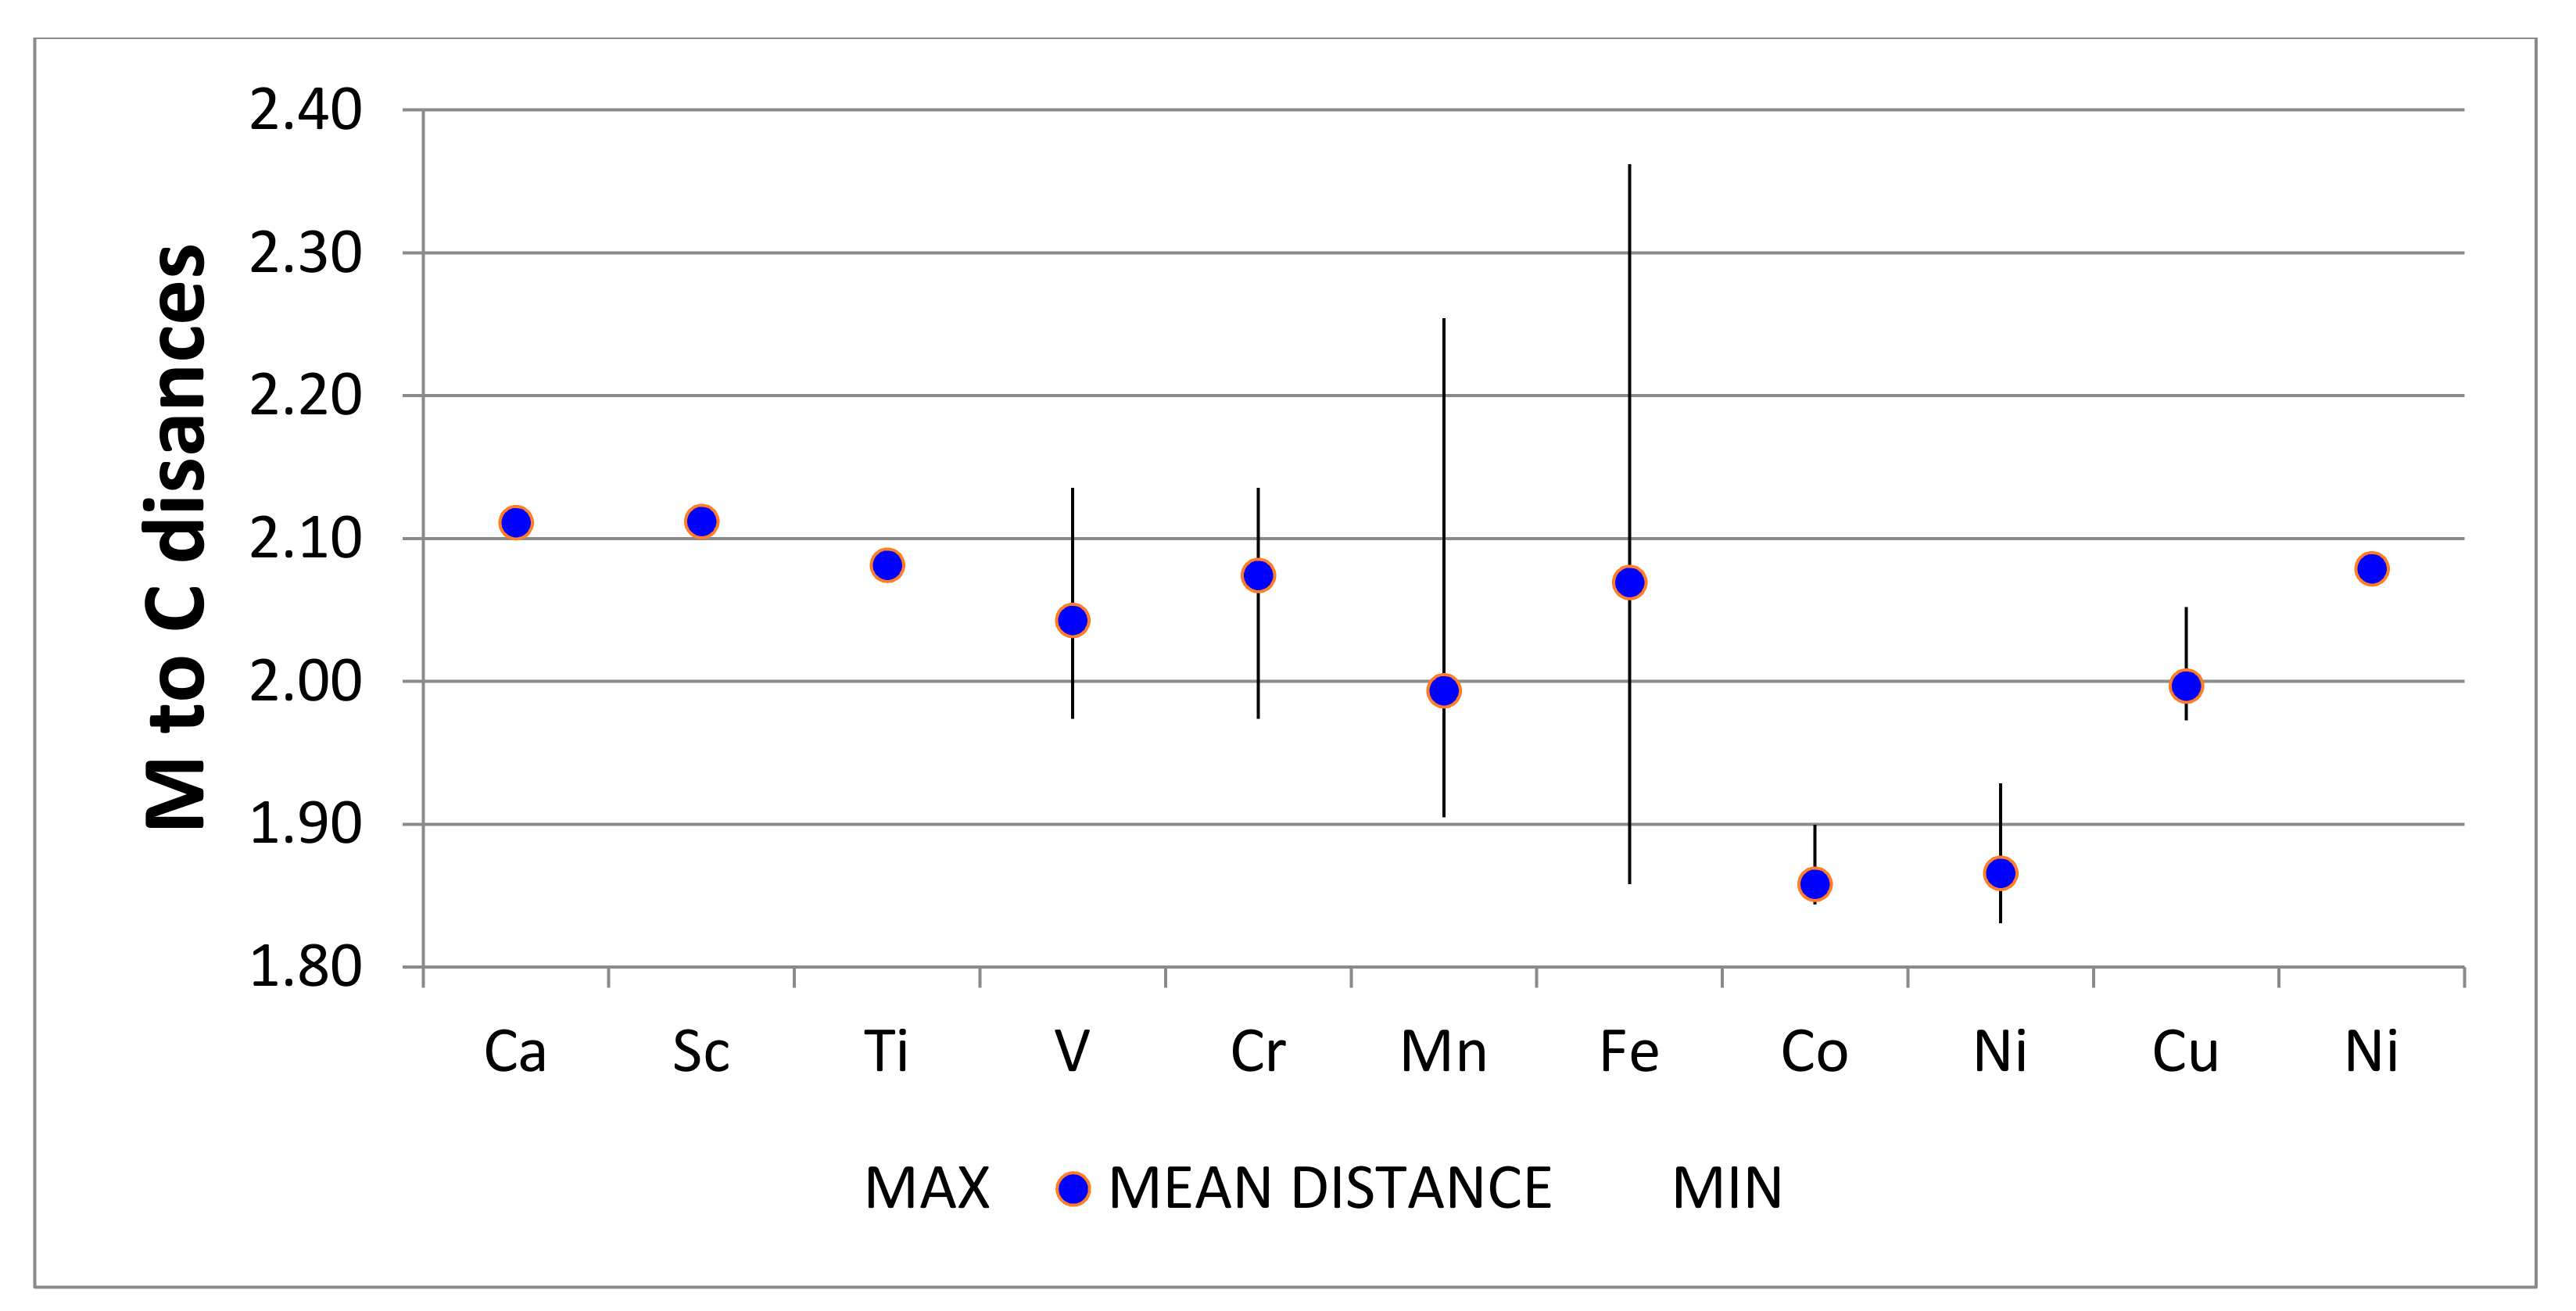
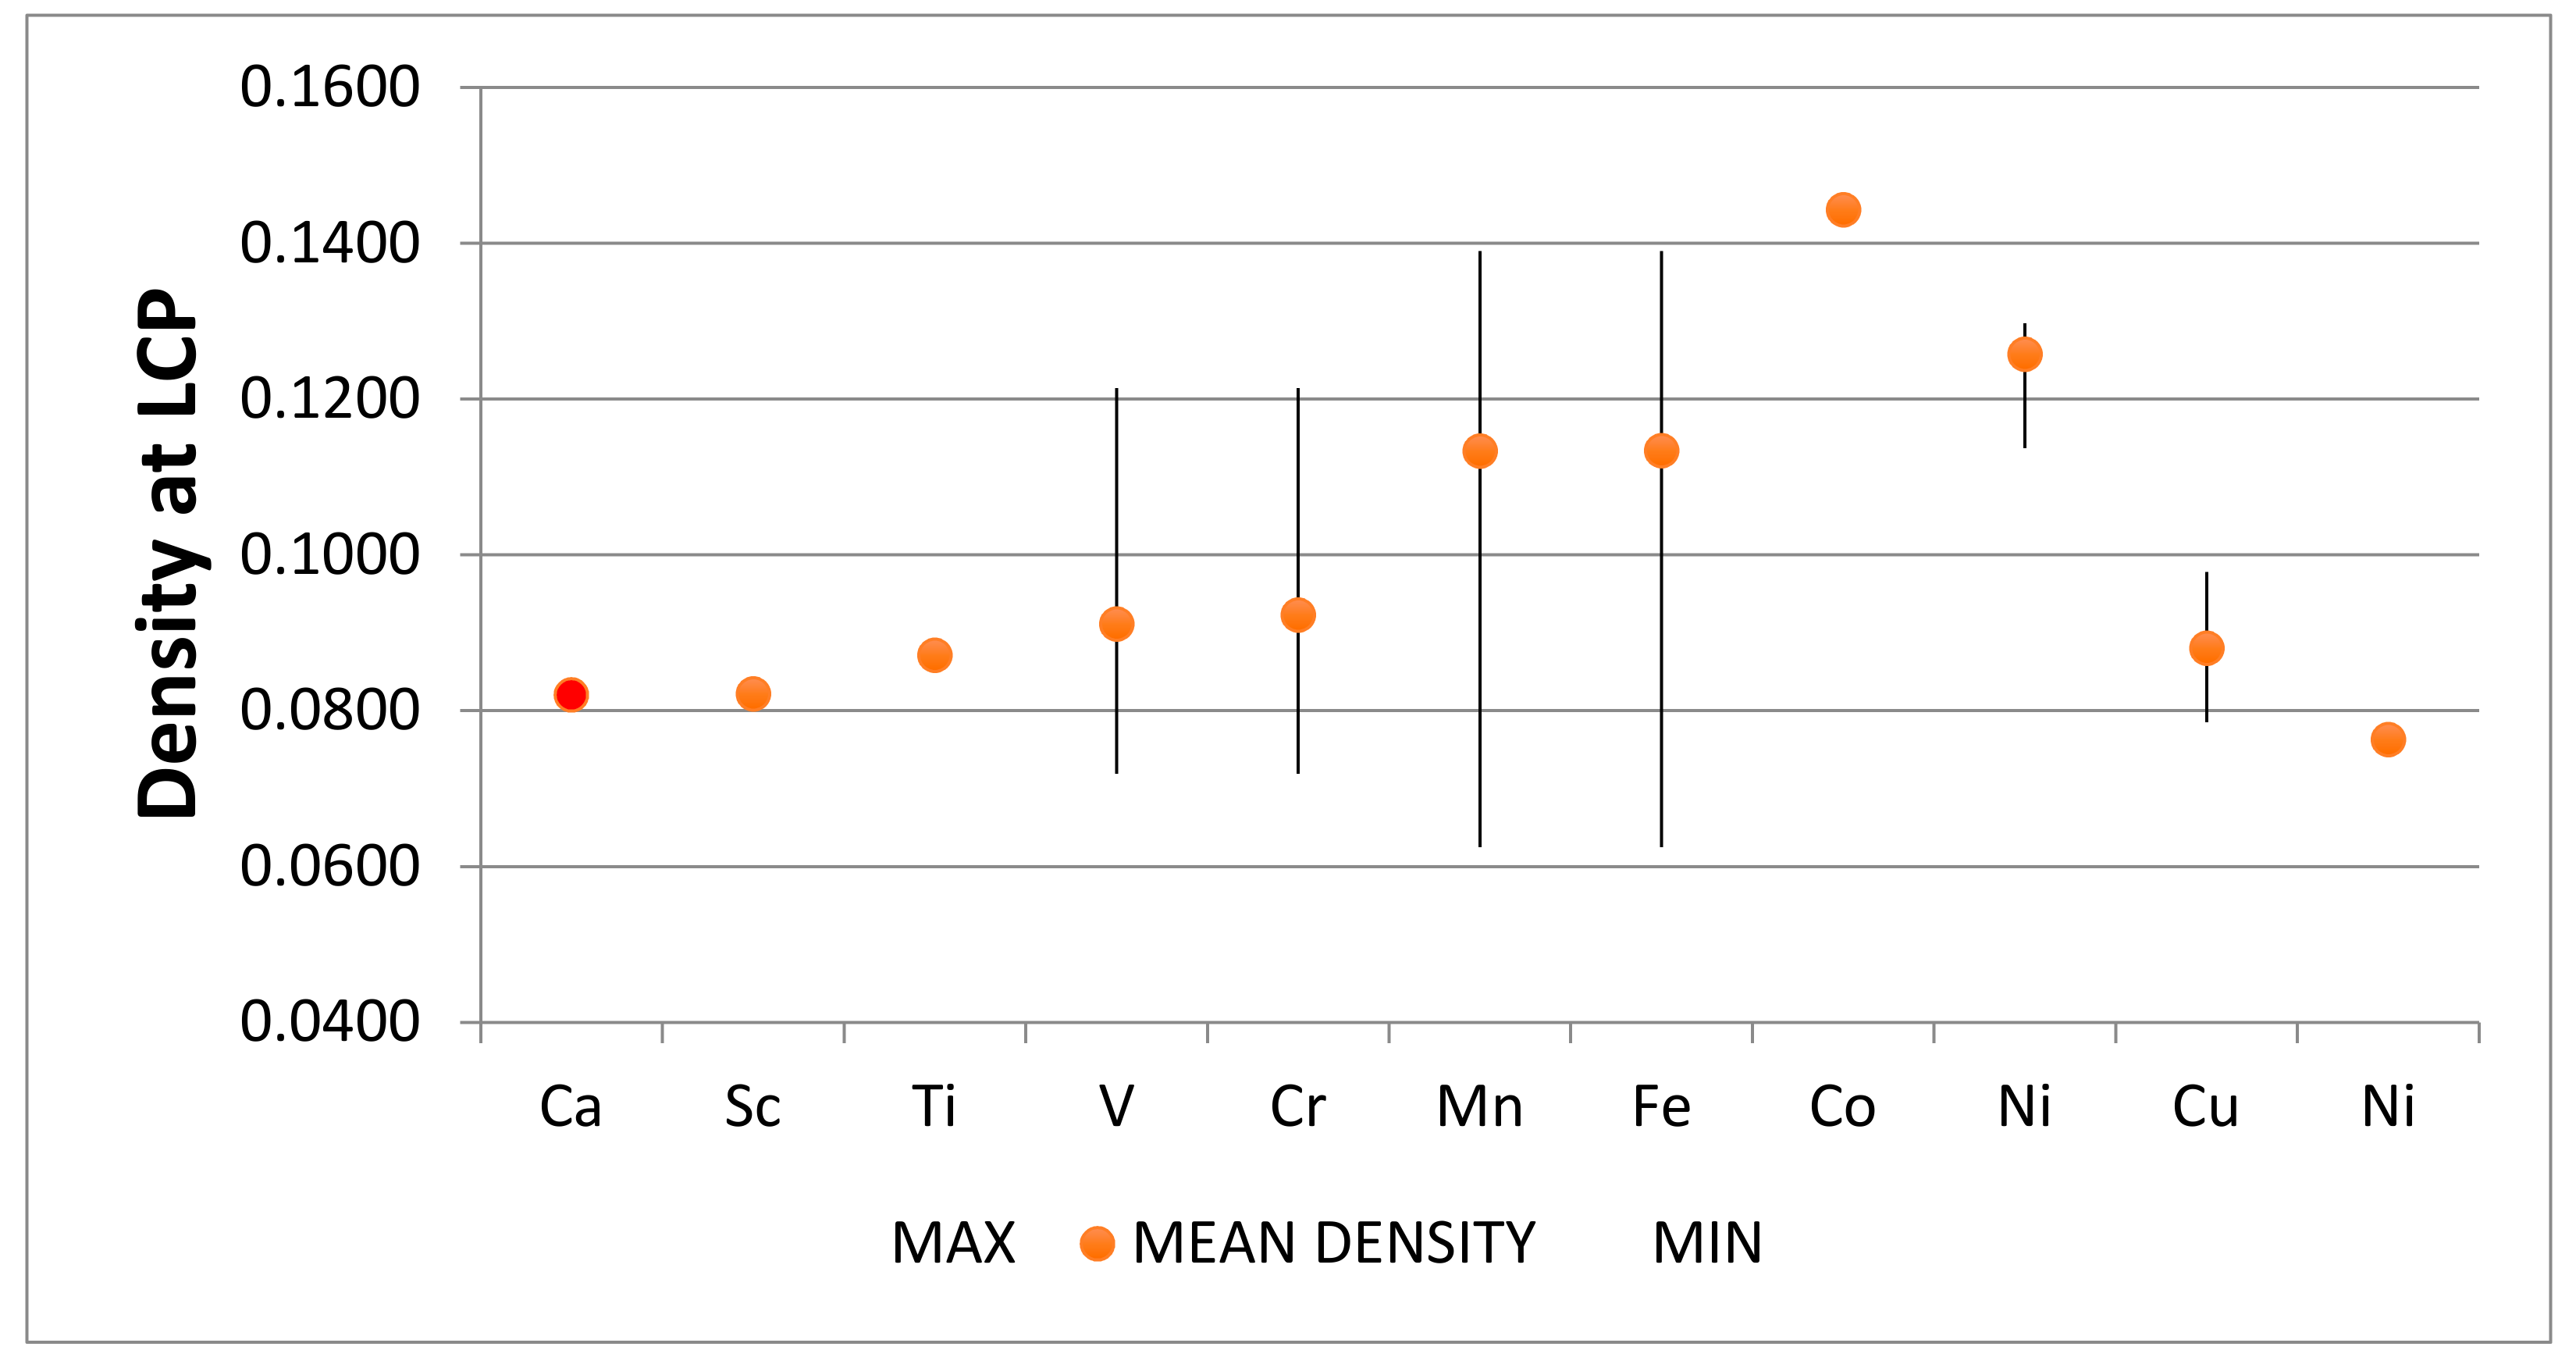
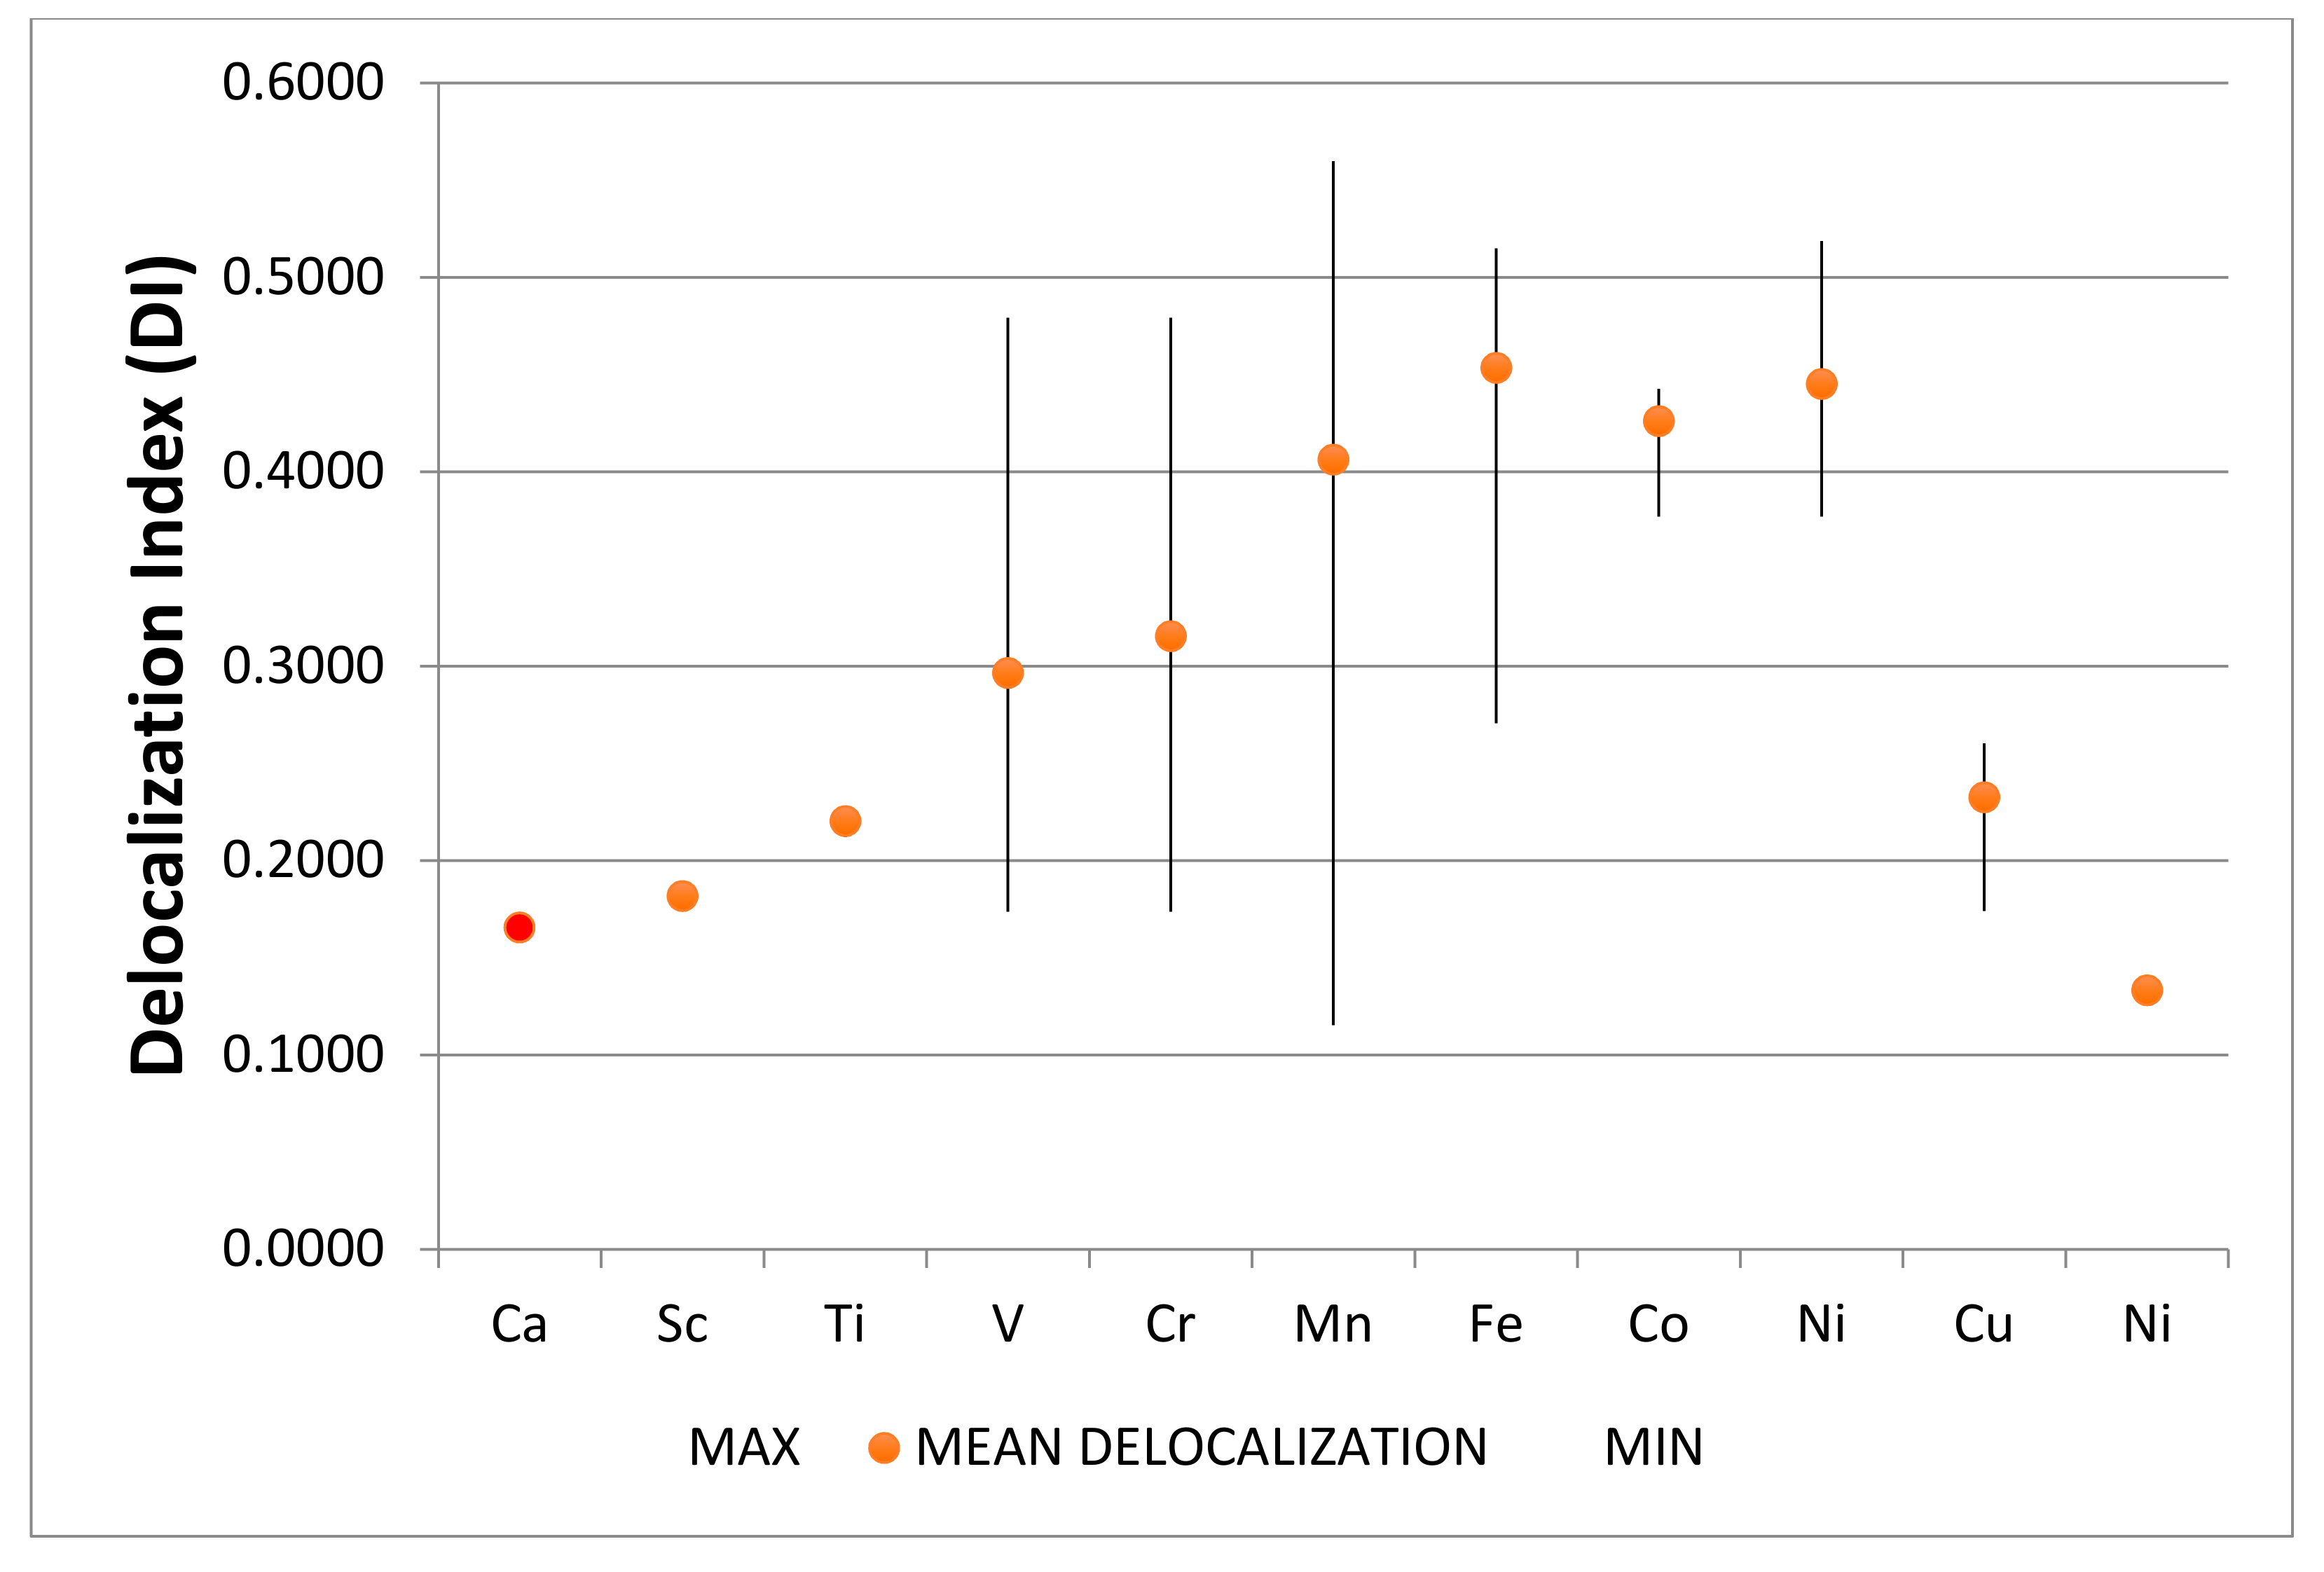
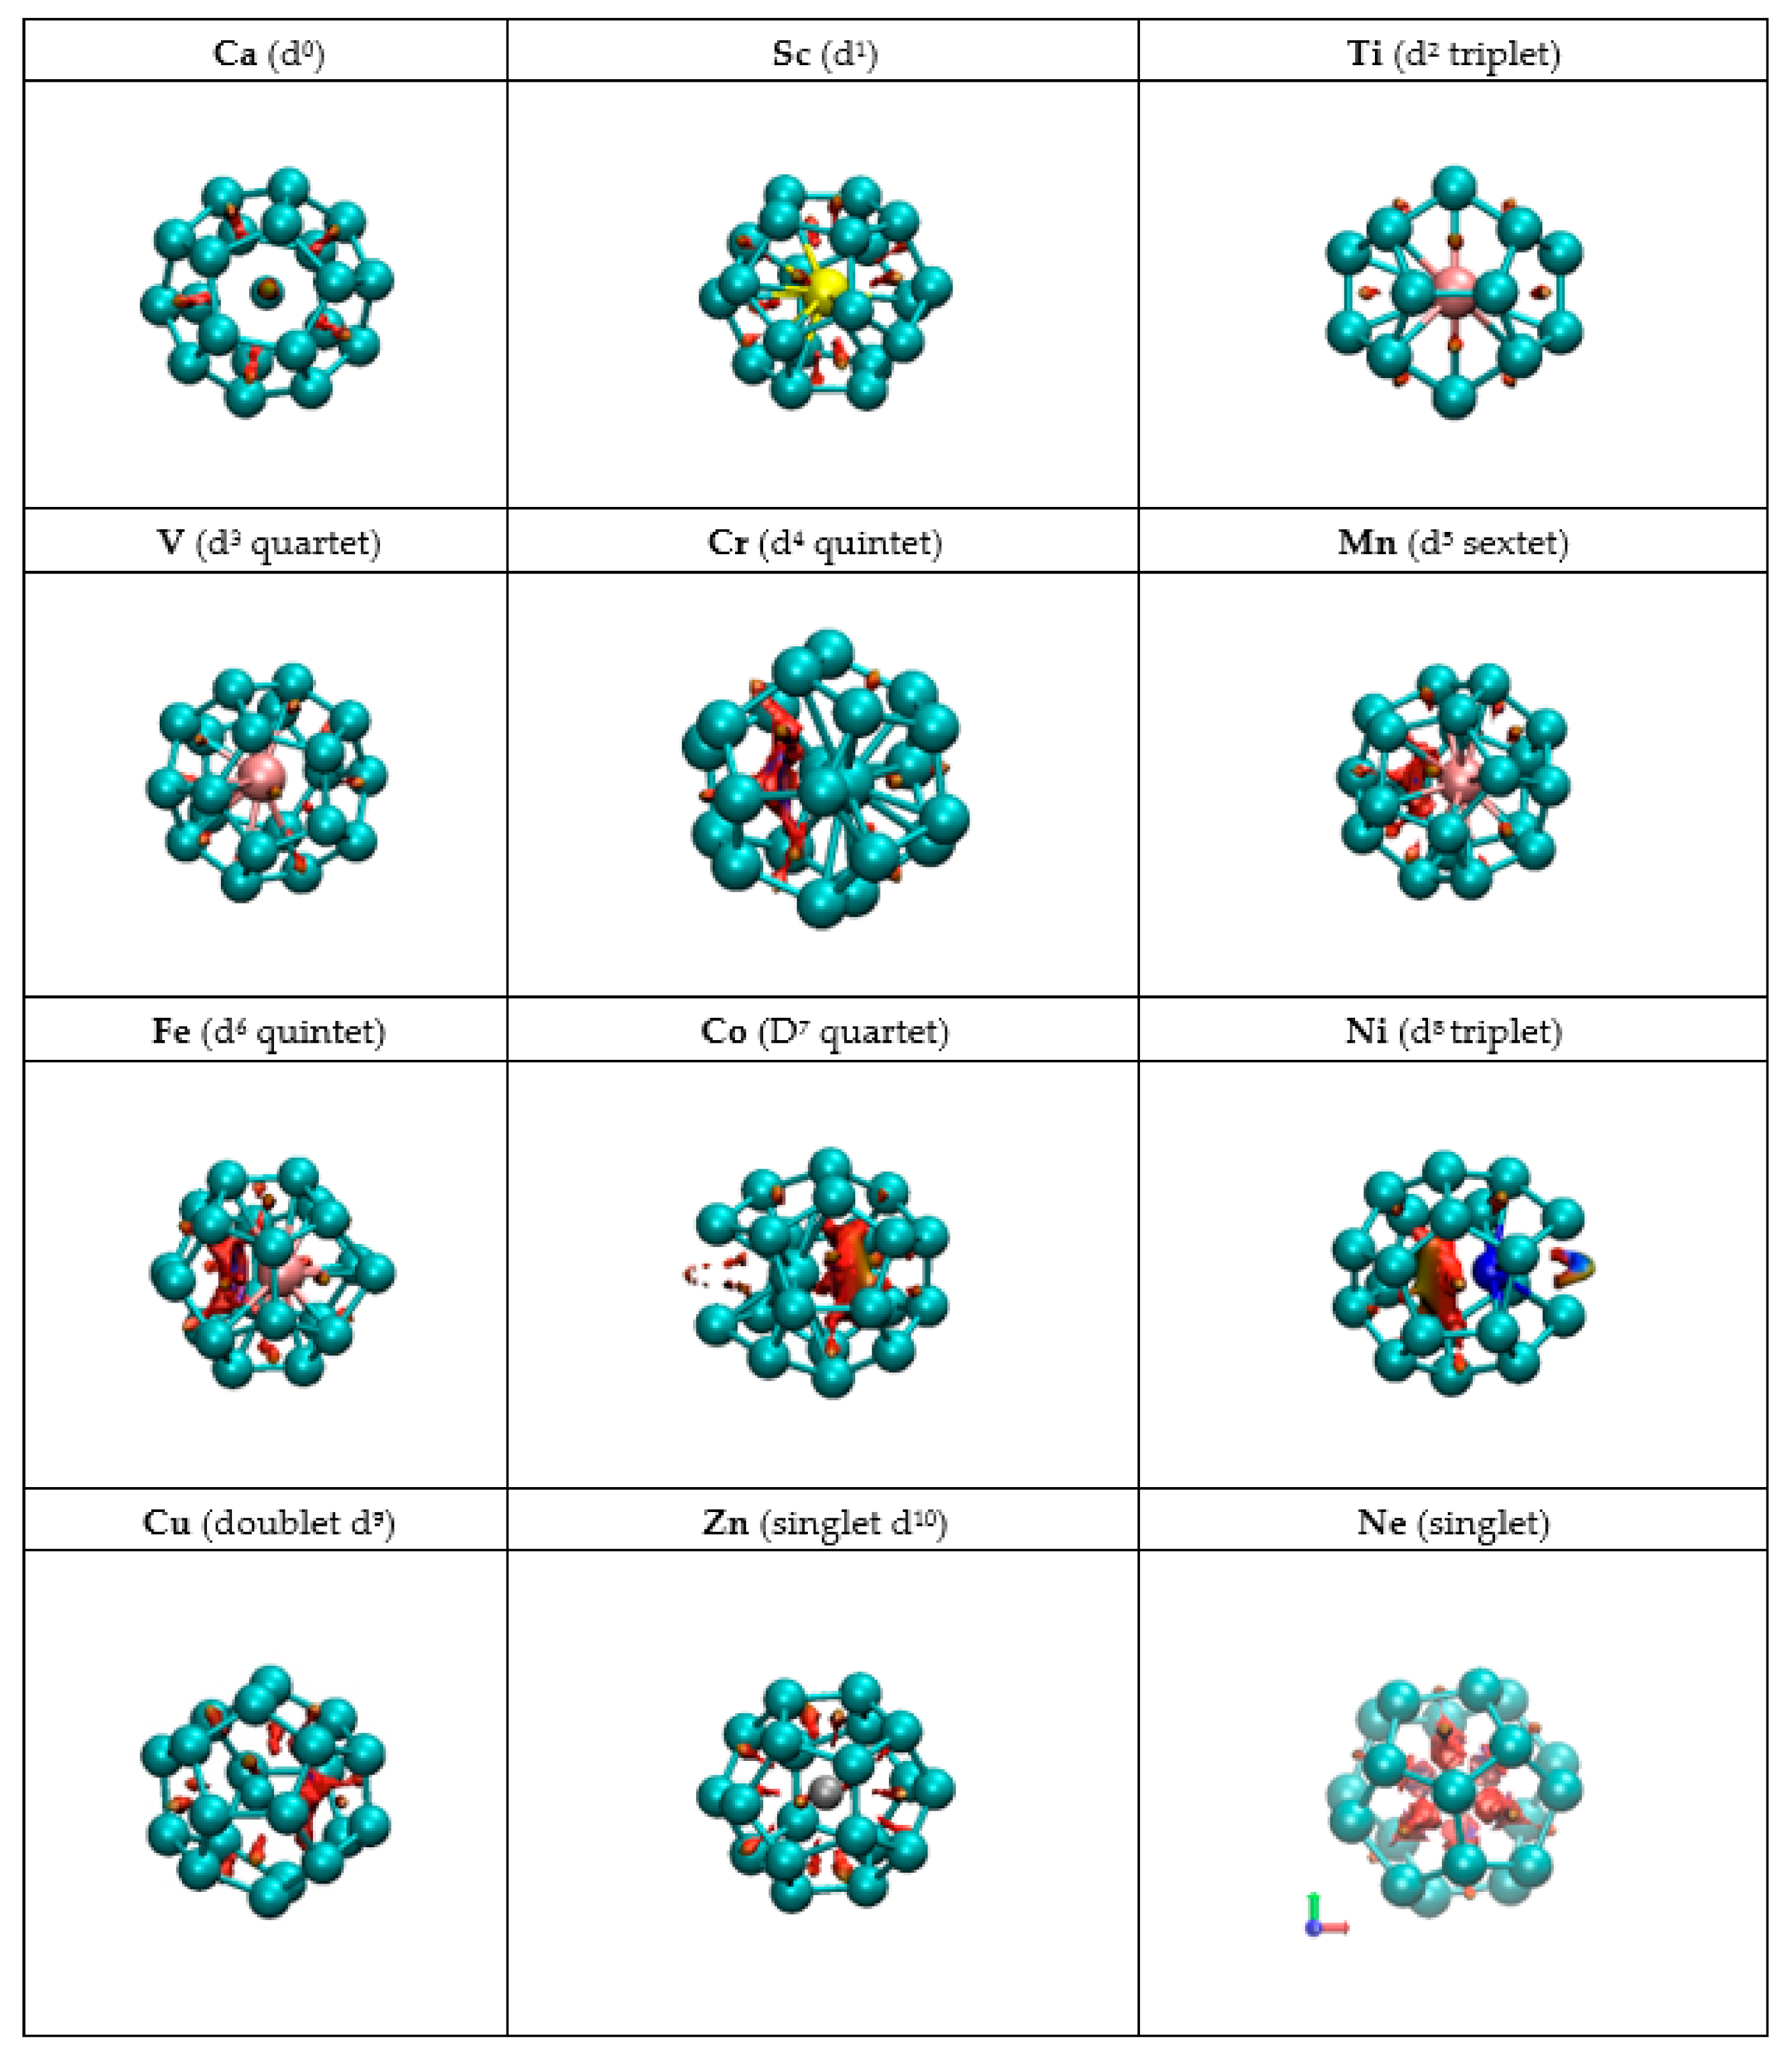
4.2. Neutral Metal Atoms in C20 Fullerene: Overview of Binding, QTAIM Interaction Ridges, and Non-Covalent Interactions

The following sections deal with a series of inclusion complexes M@C20. First (Section 4.2.1) we report the thermodynamic energy change associated with capture of neutral atoms in the C20 cage. The reference point for bonding analysis (Section 4.2.2) is Ne@C20, which retains high (D3d) symmetry for the C20 shell. Ne interacts almost identically with each of the shell carbons, in keeping with that high symmetry. NCI analysis shows regions of repulsion between Ne and each C.
Section 4.2.3, Section 4.2.4, Section 4.2.5, Section 4.2.6, Section 4.2.7, Section 4.2.8, Section 4.2.9, Section 4.2.10, Section 4.2.11, Section 4.2.12 and Section 4.2.13 are each devoted to a single endohedral complex M@C20 for M in the series Ca to Zn. In each case the interaction lines define a structure, and the QTAIM properties of line critical points (LCPs) are compiled. Key variables include the LCP electron density, its Laplacian, the delocalization index, and he kinetic and potential energy densities. Both the LCP electron density and the LCP potential energy density have been considered useful measures of interaction strength. The ratio of kinetic to potential energy density K/V, as well as their sum H has been used to judge the relative degree of ionic and covalent interaction, while the delocalization index is considered a measure of the number of shared electron pairs.
General description of behavior of the QTAIM quantities of the M@C20 is found in Section 4.2.14, and an overall view of the NCI analysis is in Section 4.2.15.

4.2.1. Energetics for M + C20 → M@C20 for the Series M = Ca-Zn

In this section, we describe the set of M@C20 fullerene inclusion complexes. The set of M lies in the first transition row and range from Ca to Zn. The atoms are all neutral, of configuration dn (n = 0 to 10). We chose maximum multiplicity since the set of d AOs span a single irreducible representation in the reference Ih-symmetrical structure of C20. While all M@C20 structures occupy a relative minimum in the potential surface (all vibrational frequencies are real) some species are thermodynamically unstable according to our unrestricted ωB97XD/cc-pVDZ calculations. Our estimates of the thermodynamic stability of the endohedral metal species M@C20 relative to separate M and C20 (Table 4) disagree sharply with those of Garg et al. [26] and Gonzalez and co-workers [28]. Since these investigators used rather different computational models and the structures they used are not defined in detail the discrepancy is difficult to resolve.
Misra and co-workers reported [30] that the triplet Fe@C20 was lower in energy than the maximum-multiplicity quintet; we confirmed that finding, with our ωB97/XD/cc-pVDZ placing the triplet 0.09 eV lower than the quintet. The structure of the triplet is quite different from that of the quintet. Similarly, for Cr, we find the triplet more stable by 0.57 eV, and of distinct structure. Neither of these revisions alter the thermodynamic instability of the endohedral species.

4.2.2. The Ne@C20 Reference System

As a reference for further discussion of the series M@C20 with M being members of the first transition series of the periodic table, we report the QTAIM analysis for Ne@C20. Figure 13 displays the connectivity for this system.
Solid black “interaction lines” follow ridges in the electron density and connect nuclear centers, i.e., (3, −3) critical points. Green dots mark line critical points (LCPs) of type (3, −1). (b) an adaptation of a Schlegel representation of the C20 cage, with the Ne atom shown as a dot. In D3d symmetry, there are three distinct Ne-C connections: along the D3 axis; to a C which is a neighbor to a C on the axis; and to a C, which has no such neighbor on the axis
The numerical results of a QTAIM analysis for Ne@C20 are shown in Table 5. In D3d symmetry there are four distinct types of CC interactions in the fullerene shell, with density at the LCPs ranging from 0.22 to 0.28 atomic units. This is typical of carbon–carbon bonds. There are 20 Ne-C interaction lines, in three symmetry equivalent sets of two, six, and twelve. In contrast to the CC LCP densities, the Ne-C LCP densities are much smaller. The Laplacian values are negative for CC interactions, suggesting charge accumulation characteristic of covalent bonding. Laplacian values for Ne-C lines are smaller and positive, suggesting charge depletion at the LCPs, characteristic of closed shell–closed shell interactions.
Energy density values at LCPs further distinguish the interactions. The Ne-C interaction, for which H is near zero and |V|/G is near 1, is not dominated by either extreme of ionic or covalent interaction. DI, an index of electron pair sharing, is very small for the Ne-C interactions, in contrast to the CC bonds which are highly covalent and have multiple bond character.
We use the properties of Ne-C bonds, as revealed in QTAIM analysis, as a basis for comparison for the series of M@C20 systems. Explicitly these are LCP densities in the range 0.05 to 0.06; Laplacian values near 0.33; DI near 0.08; and balanced covalent/ionic interactions.
We take the averages of QTAIM parameters for Ne@C20 as a reference for discussion of the M@C20 species described below. That is, we will consider departures from 1: the D3d symmetry; 2. The mean Ne-C distances, 2.02 (short) and 2.10 (long); The LCP density 0.055; the mean Laplacian +0.32; the mean DI 0.075; the kinetic energy density 0.082l; the potential energy density V; and the near-perfect balance between G and V (H = G + V near zero).
Though there are 20 interactions between Ne and C in Ne@C20 identified by QTAIM, one would never claim twenty-fold valency of the noble gas. It is already remarkable that QTAIM would consider ca. 1.50 electron pairs to be shared between Ne and the C20 shell.
The NCI analysis shown in Figure 14 displays small NCI zones at ring critical points and considerably larger zones between the central Ne and the fullerene shell. The color coding has blue as attractive and red as repulsive, so we infer that for the Ne-C connection the steric (Pauli pressure) repulsion is larger than the dispersive (London force) attraction.
In the following sections we present results for M@C20, with a minimum of discussion. Comparisons are deferred to Section 4.2.14. Presentation of results for each metal (Section 4.2.3, Section 4.2.4, Section 4.2.5, Section 4.2.6, Section 4.2.7, Section 4.2.8, Section 4.2.9, Section 4.2.10, Section 4.2.11, Section 4.2.12 and Section 4.2.13) follows the format established for the Zn@C20 example.
NCI results are presented in summary form, in Section 4.2.15.

4.2.3. QTAIM Analysis for Ca@C20 (d0 Spin Singlet)

Figure 15a displays the C and Ca nuclei, that is, (3, −3) critical points, as spheres. Interaction lines between atoms and their (3, −1) critical points define the structure of the electron density distribution. Figure 15b provides a schematic view of the ten interactions between Ca and fullerene C atoms, and defines the labeling used in Table 6.
Table 6 shows that the fullerene inclusion complex Ca@C20 retains high symmetry (all Ca-C distances are identical). A small density is found at the LCPs, and according to the Laplacian, charge is depleted. This is characteristic of closed shell–closed shell interactions, but the delocalization index (DI) indicates a degree of electron pair sharing. The small and negative value of H indicates a near balance of ionic and covalent bonding.

4.2.4. Sc@C20 (d1 Spin Doublet)

Figure 16a shows the QTAIM interactions lines for Sc@C20 while Figure 16b schematizes the interactions using an adaptation of the Schlegel diagram for the cage. Similar to the case of Ca@C20, symmetry is approximately preserved upon introduction of the endohedral atom. QTAIM data collected in Table 7 indicate approximate symmetry, weak interactions, modest pair sharing, and a balance between covalent and ionic interaction between Sc and C.
There are 20 C-Sc interaction lines, with greater LCP density and DI than is found for Ca@C20. Sc is near the center of the fullerene. Counterintuitively, the basin charge for the Sc atom is +1.47 |e| with charge on C atoms—or more properly (3, −3) CPs—about −0.07 |e|.

4.2.5. Ti@C20 (d2 Spin Triplet)

Figure 17a shows the QTAIM interaction lines defining the density for TiC20. Ti interacts with all twenty fullerene carbons; the Schlegel diagram in Figure 17b displays the fullerene net and the central atom.
Table 8 collects the Ti-C interatomic distances and QTAIM parameters for the Ti-C interaction LCPs. These have increased relative to Ne@C20, Ca@C20, and Sc@C20, indicating a strengthening interaction between the fullerene cage and the endohedral metal atom.

4.2.6. V@C20 (d3 Spin Quartet)

Figure 18a,b displays the interactions in V@C20, and the V-C interaction lines respectively. Figure 18b defines the labeling system for Table 9.
Table 9 shows that the symmetry for V@C20 is disrupted, and some interactions have become strong. The negative value of H and its larger magnitude relative to values for Ca-Ti indicates that covalent bonding has become more significant.

4.2.7. Cr@C20 (d4 Spin Quintet)

QTAIM interaction lines characterize the electron density in Cr@C20 (Figure 19a) and are the basis for the schematic representation in Figure 19b, which defines the labeling used in Table 10.
QTAIM entries for CrC20 in Table 10 indicate a continuation of a trend toward greater distortion of the fullerene and stronger and more covalent interactions its carbon atoms with the endohedral atom.

4.2.8. Mn@C20 (d5 Spin Sextet)

Figure 20a displays the QTAIM interactions lines characterizing the fullerene framework and connections between certain C atoms and the endohedral Mn atom. In Figure 20b we see the labeling scheme for entries in Table 11. Note the sudden decrease in the number of lines connecting Mn and C atoms.
Table 11 shows the shortening of Mn-C bonds and the enhanced, density, DI, and covalency in this system.

4.2.9. Fe@C20 (d6 Spin Quintet)

Interaction lines obtained from QTAIM analysis for Fe@C20 are shown in Figure 21a. The notation used in Table 12 is defined in Figure 21b.
QTAIM parameters collected in Table 12 show that the Fe complex has more interaction lines than Mn, and that the covalency is higher for Fe than for Mn. The departure from high symmetry of the fullerene of Fe@C20 is even greater than that seen in Mn@C20.

4.2.10. Co@C20 (d7 Spin Quartet)

Figure 22a shows QTAIM interaction lines for Co@C20; note the lack of connection between C atoms in the base. Figure 22b defines the labeling scheme used in Table 13.
Table 13 shows the compression of the C20 cage, and the increase in bond strength measures density, DI, and |V|/2.

4.2.11. Ni@C20 (d8 Spin Triplet)

Figure 23a shows QTAIM interaction lines deduced from the density for Ni@C20; note the lack of connection between C atoms in the base. The system of notation used in Table 14 is defined in Figure 23b.
Table 14 shows that the Ni@C20 endohedral fullerene is still seriously compressed; the strength of Ni-C bonding is reflected in a relatively large LCP density, DI, and |V|/2.

4.2.12. Cu@C20 (d9 Spin Doublet)

Figure 24a depicts the interaction lines connecting nuclear centers for Cu@C20 and Figure 24b defines the notation used in Table 15.
Table 15 shows that while the fullerene in Cu@C20 is compressed relative to C20 itself, the size reduction and the departure from symmetry is minor.

4.2.13. Zn@C20

Figure 25 shows the network of interaction lines as defined by a QTAIM analysis, and a schematic representation of interactions with the labeling scheme used in Table 16.
In Table 16 we find a very uniform set of QTAIM parameters, characteristic of a near-perfect symmetry in the Zn@C20 system.

4.2.14. Summary Remarks on QTAIM Description of M@C20

Calculations with a ωB97XD/cc-pVDZ density functional model have produced structures and energetics for the M@C20 inclusion complexes of fullerenes, with metals M = Ca, Sc, Ti, V, Cr, Mn, Fe, Co, Ni, Cu, and Zn. A reference is provided by the Ne@C20 and Ar@C20 complexes, which are centrosymmetric. In some cases (vanadium, manganese, and iron especially—see Figure 26) the inclusion complexes depart seriously from the high symmetry assumed in initial model-building. All reported structures occupy relative minima in the potential surfaces (they are stable with respect to small distortions). However, the inclusion complexes are not always thermodynamically stable relative to symmetric C20 and free gas phase metal.
We take the averages of QTAIM parameters for Ne@C20 as a reference for discussion of the M@C20 species described below (see Table 17). That is, we will consider departures from (a) the D3d symmetry; (b) the mean Ne-C distances, which range from 2.02 (short) to 2.10 (long); (c) the mean LCP density 0.055; (d) the mean Laplacian +0.32; (e) the mean DI 0.075; (f) the mean kinetic energy density 0.082; (g) the potential energy density V, and (h) the near-perfect balance between G and V (H = G + V near zero).
A detailed numerical comparison with the Ne reference is compiled in Table 17. Entries show maximum and minimum values for the several parameters, which for distorted systems can span a considerable range.
A few examples will illustrate broad trends. Figure 26 shows M-C distances for the series Ca-Zn. The vertical lines through dots representing mean values are not error bars but rather represent the range of values of the bond distance. The range of values reflects the departure from a perfect sphere, which is minimal for Ca, Sc, and Ti at the beginning of the row, and Cu and Zn at the end. There is recognizable shortening beginning with V, and serious shortening for Co and Ni.
These features are imposed on the trend in van der Waals radii of the endohedral atoms [51]. The van der Waals radii decrease monotonically across the row, with argon then increasing sharply.
Figure 27 shows the electron density at line critical points for M-C interactions. The magnitude of the density is associated with the strength of the interaction. It shows a broad maximum extending from Mn to Ni. The vertical lines through dots representing mean values represent the range of values of the LCP densities. Ne@C20 values range from to 0.0521 to 0.0591. M@C20 density values at LCPs are substantially higher for Mn-Ni. Ar@C20 values range from 0.0744 to 0.1202, reflecting the larger interaction of Ar with the C20 fullerene compared with the effect of Ne.
According to Figure 28, covalent bonding as measured by mean DI passes through a broad maximum extending from Mn to Ni. The vertical lines through dots representing mean values represent the range of values of the DI The range of values increases beginning with V, for which we see the first major distortion of the fullerene cage. Mean DI and its variance decrease sharply for Cu and Ni.
The LCP density reaches a maximum about 0.14 at Fe and Co, more than twice the value for Ne@C20. The bonding strength measure −V/2 is largest for Mn through Ni, up to four times the value for the Ne inclusion complex. The mean delocalization index is large for Cr through Ni, reaching a fivefold increase over the value for Ni@C20. These features are reflected in the mean radius of the fullerene, which declines from the Ne@C20 value (ca. 2.02 A) to 1.83 for Fe and Co.
The behavior of all measures of bonding suggests tighter M-C binding and greater distortion of the fullerene as we pass from weakly bound and very symmetric Ca@C20 to the late transition metals. The C20 cage distorts as the metals interact more strongly with particular areas of the surface. However, binding weakens and symmetry is re-established at the end of the passage with Cu and Zn. Neon provides a limit of minimal interaction between fullerene and its captured atom, while argon is large enough to have an impact on the cage structure.

4.2.15. Non-Covalent Interactions in M@C20

Figure 29 presents graphics for the zones of non-covalent interaction for all species Ca-Zn with Ne@C20 for reference.
We find only the repulsive NCI zones at ring critical points (RCPs) of the C20 five-carbon rings for calcium, scandium, chromium, manganese, copper and zinc. In contrast, the Neon endohedral system displays pronounced repulsive NCI zones between the captured atom and the C20 fullerene. These compounds are approximately centrosymmetric. More interesting are the non-centrosymmetric cases chromium, manganese, and iron. We note the severe increase of a CC distance for cobalt and nickel complexes. Although these endohedral complexes occupy relative minima in potential energy, attested by the absence of imaginary vibrational frequencies, this suggests that the Co and Ni complexes can easily lose their captured atom.

5. Conclusions

The valency theory is challenged by chemical systems which enclose single atoms in a container. We have addressed H atoms in H2Rh13(CO)243− trianion, for which each H is enclosed in a square-pyramidal rhodium cage; H atom in HCo6(CO)151− anion, for which the H atom in trapped an octahedral cobalt cage, H@MgO in which the H atom occupies a hole from which O atom is absent. Ionic bonding dominates for MgO, but covalency as reflected in QTAIM theory is prominent in the H to metal interactions of the Rh and Co molecules. In these cases, the H atom shares about 1.4 electron pairs with its metallic neighbors, justifying a characterization of the bonding as hypervalent, but far short of penta- or hexa-valency.
We modeled endohedral complexes of metal atoms Ca-Zn in C20 fullerenes using density functional theory, which provided energetics and structures for M@C20 species. Our values for energetics of M + C20 → M@C20 are at variance with values from prior studies. Lack of detail of structures impedes resolution of this issue.
We found patterns in the density-based parameters of the QTAIM theory for M@C20. There seems to be a link between strength of the strength of individual M-C interaction and the number of unpaired electrons in these systems. Interactions between the trapped metal atom and the C20 wrapping and the accompanying distortion of C20 reach a peak late in the transition series (Mn-Ni), but decline for the more symmetric Cu and Ni species. This is reflected in the size of the C20 shell, the extent of its distortion upon trapping of the metal atom, the magnitude of the density at line critical points, the number of electron pairs shared in bonding, and the extent of covalent bonding.
The confusion in terminology for the interaction of atoms with many neighbors is, we believe, resolved by the examples given for H atom captured in cages. Rather than speaking of valency or even coordination number in these cases, it is recommended to consider that a field is defined by the cage, with spatial properties well described by the constructs of QTAIM. This is reminiscent of the crystal field theory.
The properties of transition metals confined within a C20 fullerene cannot be reliably described without first establishing stable structures and then reasonable energetics. This work will continue; once these properties are well characterized electrical and magnetic properties of these species can be estimated reliably.

Supplementary Materials

The following are available online at https://www.mdpi.com/article/10.3390/sym13071281/s1, Coordinates of all species as .mol2 files, and a sumviz file readable by AIMALL providing QTAIM parameters for the l H2Rh13(CO)243− trianion in its X-ray structure.

Author Contributions

Conceptualization, C.T. and Z.A.; methodology, C.T. and Z.A.; investigation, Z.A., E.A.B. and C.T.; resources, Z.A., E.A.B. and C.T.; writing—original draft preparation, C.T.; writing—review and editing, Z.A. and C.T.; visualization (NCI), Z.A. and E.A.B.; supervision, C.T. and Z.A.; project administration, C.T. and Z.A. All authors have read and agreed to the published version of the manuscript.

Funding

This research received no external funding.

Acknowledgments

We acknowledge with gratitude the encouragement by the Body Foundation, and material support from BAPKO, the Marmara University Research Foundation.

Conflicts of Interest

The authors declare no conflict of interest.

References

  1. Musher, J.I. The Chemistry of Hypervalent Molecules. Angew. Chem. Int. Ed. 1969, 8, 54–68. [Google Scholar] [CrossRef]
  2. Jensen, W.B. The Origin of the Term “Hypervalent”. J. Chem. Educ. 2006, 83, 1751. [Google Scholar] [CrossRef]
  3. Jackson, B.A.; Harshman, J.; Miliordos, E. Addressing the Hypervalent Model: A Straightforward Explanation of Traditionally Hypervalent Molecules. J. Chem. Educ. 2020, 97, 3638–3646. [Google Scholar] [CrossRef]
  4. Schleyer, P.V.R. LETTERS p4, 70. Chem. Eng. News 1984, 62. Available online: https://pubs.acs.org/toc/cenear/62/22 (accessed on 15 July 2021).
  5. Kühl, O. The coordination chemistry of the proton. Chem. Soc. Rev. 2011, 40, 1235–1246. [Google Scholar] [CrossRef] [PubMed]
  6. Yousufuddin, M.; Gutmann, M.J.; Baldamus, J.; Tardif, O.; Hou, Z.; Mason, S.A.; McIntyre, G.J.; Bau, R. Neutron Diffraction Studies on a 4-Coordinate Hydrogen Atom in an Yttrium Cluster. J. Am. Chem. Soc. 2008, 130, 3888–3891. [Google Scholar] [CrossRef] [PubMed]
  7. Bau, R.; Drabnis, M.H.; Garlaschelli, L.; Klooster, W.T.; Xie, Z.; Koetzle, T.F.; Martinengo, S. Five-Coordinate Hydrogen: Neutron Diffraction Analysis of the Hydrido Cluster Complex [H2Rh13(CO)24]3−. Science 1997, 275, 1099–1102. [Google Scholar] [CrossRef] [PubMed]
  8. Hart, D.W.; Teller, R.G.; Wei, C.-Y.; Bau, R.; Longoni, G.; Campanella, S.; Chini, P.; Koetzle, T.F. Six-Coordinate Hydrogen: Structure of [(Ph3P)2N]+[HCo6(C)O)15]- by Single-Crystal Neutron Diffraction Analysis. Angew. Chem Int. Ed. Engl. 1979, 18, 80–81. [Google Scholar] [CrossRef]
  9. Hart, D.W.; Teller, R.G.; Wei, C.-Y.; Bau, R.; Longoni, G.; Campanella, S.; Chini, P.; Koetzle, T.F. An Interstitial Hydrogen Atom in a Hexanuclear Metal Cluster: X-ray and Neutron Diffraction Analysis of [(Ph3P)2N]1+[HCo6(CO)15]1−. J. Am. Chem. Soc. 1981, 103, 1458–1466. [Google Scholar] [CrossRef]
  10. Janotti, A.; van der Walle, X. Hydrogen multicentre bonds. Nat. Mater. 2007, 6, 44–47. [Google Scholar] [CrossRef]
  11. Popov, A.A.; Yang, S.; Dunsch, L. Endohedral Fullerenes. Chem. Rev. 2013, 113, 5989–6113. [Google Scholar] [CrossRef] [PubMed]
  12. Bloodworth, S.; Sitinova, G.; Alom, S.; Vidal, S.; Bacanu, G.R.; Elliott, S.J.; Light, M.E.; Herniman, J.M.; Langley, G.J.; Levitt, M.H.; et al. First Synthesis and Characterization of CH4@C60. Angew. Chem. Int. Ed. 2019, 58, 5038–5043. [Google Scholar] [CrossRef] [Green Version]
  13. Mordkovich, V.Z.; Umnov, A.G.; Inoshita, T.; Endo, M. The Obserbation of multiwall fullerenes in thermally treated laser pyrolysis carbon blacks. Carbon 1999, 37, 1855–1858. [Google Scholar] [CrossRef]
  14. Cioslowski, J.; Fleishmannn, E.D. Endohedral complexes: Atoms and ions inside the C60 cage. J. Chem. Phys 1991, 94, 3730–3734. [Google Scholar] [CrossRef]
  15. Bader, R.F.W. Atoms in Molecules. A Quantum Theory; Clarendon: Oxford, UK, 1990. [Google Scholar]
  16. Bader, R.F.W. A Quantum Theory of Molecular Structure and its Applications. Chem. Rev. 1991, 91, 893–928. [Google Scholar] [CrossRef]
  17. Shahbazian, S. Why Bond Critical Points Are Not “Bond” Critical Points. Chem. Eur. J. 2018, 24, 5401–5405. [Google Scholar] [CrossRef]
  18. Jalife, S.; Arcudia, J.; Pan, S.; Merino, G. Noble gas endohedral fullerenes. Chem. Sci. 2020, 11, 6642–6652. [Google Scholar] [CrossRef] [PubMed]
  19. Morinaka, Y.; Sato, S.; Wakamiya, A.; Nikawa, N.; Mizorogi, N.; Tanabe, F.; Murata, M.; Komatsu, K.; Furukawa, K.; Kato, T.; et al. X-ray observation of a helium atom and placing a nitrogen atom inside He@C60 and He@C70. Nat. Commun. 2013, 4, 1554–1559. [Google Scholar] [CrossRef] [PubMed] [Green Version]
  20. Yakigaya, K.; Takeda, A.; Yokoyama, Y.; Ito, S.; Miyazaki, T.; Suetsuna, T.; Shimotani, H.; Kakiuchi, T.; Sawa, H.; Takagi, T.; et al. Superconductivity of domed Ar@C60. New J. Chem. 2007, 31, 973–979. [Google Scholar] [CrossRef]
  21. Lee, H.M.; Olmstead, M.M.; Suetsuna, T.; Shimotani, H.; Dragoe, N.; Cross, R.J.; Kitazawa, K.; Balch, A.L. Crystallographi characterization of Kr@C60 in (0.09 Kr @ C60/0.91C60)∙{NiII)OEP)}∙2C6H6. Chem. Commun. 2002, 1352–1353. [Google Scholar] [CrossRef]
  22. Cerpa, E.; Krapp, A.; Vela, A.; Merino, G. The Implications of Symmetry of the External Potential on Bond Paths. Chem. Eur. J. 2008, 14, 10232–10234. [Google Scholar] [CrossRef]
  23. Popov, A.A.; Dunsch, L. Bonding in Endohedral Metallofullerenes as Studied by Quantum Theory of Atoms in Molecules. Chem. Eur. J. 2009, 15, 9707–9729. [Google Scholar] [CrossRef]
  24. Estrada-Salas, R.E.; Valladares, A.A. DFT calculations of the structure and electronic properties of late 3d transition metal atoms endohedrally doping C60. J. Mol. Struct. THEOCHEM 2008, 869, 1–5. [Google Scholar] [CrossRef]
  25. An, Y.-P.; Yang, C.-L.; Wang, M.-S.; Ma, X.-G.; Wang, D.-H. Geometrical and Electronic Properties of the Clusters of C20 Cage Doped with Alkali Metal Atoms. J. Cluster Sci. 2011, 22, 31–39. [Google Scholar] [CrossRef]
  26. Garg, I.; Sharma, H.; Kapila, N.; Dharamvir, K.; Jandal, V.K. Transition metal induced magnetism in smaller fullerenes (Cn for n ≤ 36. Nanoscale 2011, 3, 217–224. [Google Scholar] [CrossRef]
  27. Baei, M.T.; Soltani, A.; Torabi, P.; Hosseini, F. Formation and electronic structure of C20 fullerene transition metal clusters. Monatsch. Chem. 2014, 145, 1401–1405. [Google Scholar] [CrossRef]
  28. Gonzalez, M.; Lujan, S.; Beran, K.A. Investigation into the molecular structure, electronic properties, and energetic stability of endohedral (TM@C20) and exohedral (TM-C20) metallofullerene derivatives of C20: TM = Group 11 and 12 transition metal atoms/ions. Comp. Theoret. Chem. 2017, 1119, 32–44. [Google Scholar] [CrossRef]
  29. Zhao, Z.; Li, Z.; Wang, Q. Density functional theory study on the transition metal atoms encapsulated C20 cage clusters Mater. Res. Express 2018, 5, 065605. [Google Scholar] [CrossRef]
  30. Sarkar, S.; Paul, S.; Misra, A. Spin-polarized electrical transport in transition metal encapsulated C20 fullerenes: A theoretical account. Chem. Phys. Impact 2020, 1, 100002. [Google Scholar] [CrossRef]
  31. Chai, J.-D.; Head-Gordon, M. Long-range corrected hybrid density functionals with damped atom-atom dispersion corrections. Phys. Chem. Chem. Phys. 2008, 10, 6615–6620. [Google Scholar] [CrossRef] [Green Version]
  32. Grimme, S. Semiempirical gga-type density functional constructed with a long-range dispersion correction. J. Comp. Chem. 2006, 27, 1787–1799. [Google Scholar] [CrossRef]
  33. Dunning, T.H., Jr. Gaussian basis sets for use in correlated molecular calculations. I. The atoms boron through neon and hydrogen. J. Chem. Phys. 1989, 90, 1007–1023. [Google Scholar] [CrossRef]
  34. Dunning, T.H., Jr. Gaussian-basis sets for use in correlated molecular calculations. 3. The atoms aluminum through argon. J. Chem. Phys. 1993, 98, 1358–1371. [Google Scholar] [CrossRef] [Green Version]
  35. Weigend, F.; Ahlrichs, R. Balanced basis sets of split valence, triple zeta valence and quadruple zeta valence quality for H to Rn: Design and assessment of accuracy. Phys. Chem. Chem. Phys. 2005, 7, 3297–3305. [Google Scholar] [CrossRef] [PubMed]
  36. Weigend, F. Accurate Coulomb-fitting basis sets for H to Rn. Phys. Chem. Chem. Phys. 2006, 8, 1057–1065. [Google Scholar] [CrossRef] [PubMed]
  37. Bergner, A.; Dolg, M.; Kuechle, W.; Stoll, H.; Preuss, H. Ab-initio energy-adjusted pseudopotentials for elements of groups 13–17. Mol. Phys. 1993, 80, 1431–1441. [Google Scholar] [CrossRef]
  38. Pritchard, B.P.; Altarawy, D.; Didier, B.; Gibson, T.D.; Windus, T.L. A New Basis Set Exchange: An Open, Up-to-date Resource for the Molecular Sciences Community. J. Chem. Inf. Model. 2019, 59, 4814–4820. [Google Scholar] [CrossRef]
  39. Frisch, M.J.; Trucks, G.W.; Schlegel, H.B.; Scuseria, G.E.; Robb, M.A.; Cheeseman, J.R.; Scalmani, G.; Barone, V.; Mennucci, B. Gaussian 09, Revision, E.01; Gaussian, Inc.: Wallingford, CT, USA, 2009. [Google Scholar]
  40. Frisch, M.J.; Trucks, G.W.; Schlegel, H.B.; Scuseria, G.E.; Robb, M.A.; Cheeseman, J.R.; Scalmani, G.; Barone, V.; Petersson, G.A. Gaussian 16, Revision, A.03; Gaussian, Inc.: Wallingford, CT, USA, 2016. [Google Scholar]
  41. Outeiral, C.; Vincent, M.A.; Pendás, Á.M.; Popelier, P.L.A. Revitalizing the concept of bond order through delocalization measures in real space. Chem. Sci. 2018, 9, 5517–5529. [Google Scholar] [CrossRef] [Green Version]
  42. Johnson, E.R.; Keinan, S.; Mori-Sanchez, P.; Contreras-García, J.; Cohen, A.J.; Yang, W. Noncovalent Interactions. J. Am. Chem. Soc. 2010, 132, 6498–6506. [Google Scholar] [CrossRef] [Green Version]
  43. Contreras-García, J.; Johnson, E.R.; Keinan, S.; Chaudret, R.; Piquemal, J.-P.; Beratan, D.N.; Yang, W. NCIPLOT: A Program for Plotting Noncovalent Interaction Regions. J. Chem. Theory Comput. 2011, 7, 625–632. [Google Scholar] [CrossRef]
  44. Available online: http://www.jcrystal.com/steffenweber/gallery/Fullerenes/Fullerenes.html (accessed on 27 June 2021).
  45. Todd, A.; Keith, T.K. AIMAll (Version 19.10.12), Gristmill Software; AIMAll: Overland Park, KS, USA, 2019; Available online: Aim.tkgristmill.com (accessed on 15 April 2021).
  46. Lu, T.; Chen, F. Multiwfn: A multifunctional wavefunction analyzer. J. Comput. Chem. 2012, 33, 580–592. [Google Scholar] [CrossRef]
  47. Available online: http://sobereva.com/multiwfn (accessed on 15 June 2021).
  48. Popelier, P.L.A. The QTAIM Perspective of Chemical Bonding. In The Chemical Bond: Fundamental Aspects of Chemical Bonding; Frenking, G., Shaik, S., Eds.; Wiley-VCH Verlag GmbH & Co KGaA, Boschstr.: Weinheim, Germany, 2014; Chapter 8. [Google Scholar]
  49. Espinosa, E.; Espinosa, J.E.; Elguero, J. From weak to strong interactions: A comprehensive analysis of the topological and energetic properties of the electron density involving X-H···F-Y systems. J. Chem. Phys. 2002, 117, 5529–5542. [Google Scholar] [CrossRef]
  50. Espinosa, J.E.; Molins, E.; LeComte, C. Hydrogen bond strengths revealed by topological analyses of experimentally observed electron densities. Chem. Phys. Lett. 1998, 285, 170–173. [Google Scholar] [CrossRef]
  51. Mantina, M.; Chamberlin, A.C.; Valero, R.; Cramer, C.J.; Truhlar, D.G. Consistent van der Waals Radii for the Whole Main Group. J. Phys. Chem. 2009, 113, 5806–5812. [Google Scholar] [CrossRef] [PubMed] [Green Version]
Figure 1. The idealized rhodium cage Rh13 is composed of a fragment of a hexagonal close packed structure. (a) the three layers of (3, 6, 3) rings. Rhodium atoms form a truncated trigonal prism; the 13th Rh is at the center of the cluster. H atoms occupy square pyramidal arrays of Rh atoms, sharing the central Rh as a shared apex. (b) A reoriented view with the polyhedron resting on a square base of four Rh atoms; the Rh atom at the center of the midplane completes the square pyramids.
Symmetry 13 01281 g001
Figure 2. The experimental X-ray structure [7] of the complex [H2Rh13(CO)24]3− as represented in the AIM topology. Oxygen atoms are color-coded red, rhodium atoms are dark green, carbon atoms dark gray, and hydrogen atoms are light gray. Of the 24 CO ligands, 12 are attached each to a single Rh and 12 bridge two rhodium atoms. The bridging reduces the global symmetry to Cs. Even that plane of symmetry is broken in the crystal since the H atoms occupy nonequivalent sites.
Symmetry 13 01281 g002
Figure 3. Two views of HCo6(CO)151− with color code red = O atom, gray = C atom, pink = Co atom, light gray = H atom. System optimized in C2v symmetry with DFT model ωB97XD/def2-SVP. Connections are QTAIM features, ridges in the electron density linking nuclear centers. (a) A view along the C2 axis (b) An offset view revealing the hexacoordinated H atom and displaying the lines connecting the H atomic center with Co atoms according to QTAIM.
Symmetry 13 01281 g003
Figure 4. A fragment of a MgO crystal, with one oxygen hole occupied by H atom, as represented in the AIM topology. The fragment has a net +2 charge. Solid and dashed lines, ridge lines in the electron density, lead between nuclear attractors; solid lines denote stronger interactions than dashed lines.
Symmetry 13 01281 g004
Figure 5. Ne@C20, as represented in the AIM topology. View along the three-fold axis in symmetry D3d. Carbons are coded gray, Ne is light blue.
Symmetry 13 01281 g005
Figure 6. Two views of a symmetrized H2Rh13(CO)243− trianion. The color code has Rh in blue–green, C in dark gray, O in red, and H in light gray. (a) The H atoms are seen on a diagonal in the 3-6-3 orientation of the three rhodium layers. (b) A view of H atom through a nearly square base.
Symmetry 13 01281 g006
Figure 7. Two symmetrized models of Rh13 species containing H atoms in square-pyramidal holes. (a) A simplified complex [H2Re13(CO)12]3− as represented in the AIM topology. Color-coding as in Figure 3. The paths imply coordination of H atoms with five rhodium atoms. (b) a D4h—symmetric model of [H2Re13(CO)24]3− with H atoms in equivalent square-pyramidal holes.
Symmetry 13 01281 g007
Figure 8. Surfaces inclosing zones of non-covalent interaction, color coded blue for attraction and red for repulsion. Atoms are coded red for O, blue-green for Rh and C, and light gray for H. Two H atoms are pointed out by horizontal gold arrows, and the central Rh is designated by a vertical gold arrow. The H atoms are each in a plane defined by a square face of the Rh cage. Those base Rh atoms visible from this perspective are labeled.
Symmetry 13 01281 g008
Figure 9. Two views of the HCo6(CO)151− anion (a) Cs—symmetric HCo6(CO)151− anion as represented in the AIM topology. Solid lines connect nuclear attractors (large spheres; H is light gray, Co is pink, Ne is light blue, carbon is dark gray) Green dots on these connectors represent line critical points and reinforce the suggestion that the central H atom interacts strongly with six Co atoms of the Co cage. (b) Labeling scheme for interaction lines.
Symmetry 13 01281 g009
Figure 10. Two views of the NCI surfaces of HCo6(CO)151− anion (a) side view showing zones of weak interaction (b) a tilted view revealing the H atom.
Symmetry 13 01281 g010
Figure 11. Two views of the H-doped MgO crystal, according to the QTAIM topology. (a) D4h—symmetric fragment, with three layers. Color code red = O atom, green = Mg, and light gray = H atom. Note distortion of top and bottom layers, arising from the weaker interaction of H with Mg compared with the interaction of O with Mg. (b) view normal to the middle layer, with six interaction lines. Two (from H to Mg, coded b) lie in the plane, and four (from H to O, labeled a) lie in a perpendicular plane. The interaction from Mg to O is labeled x.
Symmetry 13 01281 g011
Figure 12. A view through the top layer of MgO. Mg atoms (pink) are seen in the corners and the center of a square array, and O atoms are shown in red.
Symmetry 13 01281 g012
Figure 13. Two views of Ne@C20, according to the QTAIM analysis. (a) Structure of Ne@C20 according to QTAIM analysis. Color coding has C atoms in dark gray, Ne atom in light blue–gray. (b) Schlegel diagram for the C20, with the central atom represented by the dot.
Symmetry 13 01281 g013
Figure 14. View down a threefold axis for D3d Ne@C20. Color coding of NCI zones has red designating repulsive, blue attractive, and green weak interactions. Here we see small NCI repulsions at ring centers and larger zones between Ne and C.
Symmetry 13 01281 g014
Figure 15. Two representations of connectivity of Ca in C20 fullerene. (a) Ten interaction lines connecting nuclear centers (QTAIM attractors of type (3, −3)); two types of connection are seen, along the C3 axis in D3d symmetry and normal to that axis. (b) The ten interaction lines are symmetry equivalent (D5d) extending from the metal Ca to two symmetry-equivalent five membered rings on the surface.
Symmetry 13 01281 g015
Figure 16. Two representations of connectivity of Sc in C20 fullerene. (a) Twenty lines with ∇ρ = 0 connecting nuclear centers (QTAIM attractors of type (3, −3)); two types of connection are seen, along the C3 axis in D3d symmetry and normal to that axis. (b) Adaptation of a Schlegel diagram for M@C20 (dodecahedral); QTAIM interaction lines extend from the metal (Sc, represented by the central dot) to each vertex.
Symmetry 13 01281 g016
Figure 17. Two representations of connectivity of Ti in C20 fullerene. (a) Twenty lines with ∇ρ = 0 connecting nuclear centers (QTAIM attractors of type (3, −3)); two types of connection are seen, along the C3 axis in D3d symmetry and normal to that axis. (b) Adaptation of a Schlegel diagram for M@C20 (dodecahedral); QTAIM interaction lines extend from the metal (Ti, represented by the central dot) to each vertex.
Symmetry 13 01281 g017
Figure 18. Two representations of connectivity of V in C20 fullerene. (a) Twelve lines with ∇ρ = 0 connecting nuclear centers (QTAIM attractors of type (3, −3)). (b) Labeling scheme for interaction lines.
Symmetry 13 01281 g018
Figure 19. Two representations of connectivity of Cr in C20 fullerene. (a) Ten lines with ∇ρ = 0 connecting nuclear centers (QTAIM attractors of type (3, −3)). (b) Labeling scheme for interaction lines.
Symmetry 13 01281 g019
Figure 20. Two representations of connectivity of Mn in C20 fullerene. (a) Four lines with ∇ρ = 0 connecting nuclear centers (QTAIM attractors of type (3, −3)). (b) Labeling scheme for interaction lines.
Symmetry 13 01281 g020
Figure 21. Two representations of connectivity of Fe in C20 fullerene. (a) Five lines with ∇ρ = 0 connecting nuclear centers (QTAIM attractors of type (3, −3)). (b) Labeling scheme for interaction lines.
Symmetry 13 01281 g021
Figure 22. Two representations of connectivity of Co in C20 fullerene. (a) Eight lines with ∇ρ = 0 connecting nuclear centers (QTAIM attractors of type (3, −3)). (b) Labeling scheme for interaction lines.
Symmetry 13 01281 g022
Figure 23. Two representations of connectivity of Ni in C20 fullerene. (a) Eight lines with ∇ρ = 0 connect nuclear centers (QTAIM attractors of type (3, −3)). (b) Labeling scheme for interaction lines.
Symmetry 13 01281 g023
Figure 24. Two representations of connectivity of Cu in C20 fullerene. (a) Six lines with ∇ρ = 0 connect nuclear centers (QTAIM attractors of type (3, −3)). (b) Labeling scheme for interaction lines.
Symmetry 13 01281 g024
Figure 25. Two representations of connectivity of Zn in C20 fullerene. (a) Ten lines with ∇ρ = 0 connecting nuclear centers (QTAIM attractors of type (3, −3)). (b) Labeling scheme for interaction lines.
Symmetry 13 01281 g025
Figure 26. A M3 (max—mean—min) plot for M to C distances in the series M@C20, M from Ca to Zn. The radius of Ih—symmetric C20 is 2.030 A and the Ne-C distances in the D3d Ne reference vary from 2.0183 to 2.1047 A. Most species display M-C distances within this range, though Mn and Fe have large ranges of M-C distances; Co and Ni shrink the C20 envelope. Argon expands C20 to Ar-C distances ranging from 2.159 to 2.187 A.
Symmetry 13 01281 g026
Figure 27. A similar M3 plot for the electron density at M-C line critical points.
Symmetry 13 01281 g027
Figure 28. Delocalization Index for the series Ca-Zn. Ne@C20 values ranged from 0.064 to 0.082, and Ar@C20 values from 0.156 to 0.366, once again reflecting the strong interaction between Ar and the C20 cage.
Symmetry 13 01281 g028
Figure 29. NCI zones for M@C20 for M = Ca to Zn and Ne.
Symmetry 13 01281 g029
Table 1. The coordination around the two H atoms in of [H2Rh13(CO)24]3− trianion. Interatomic distances are in Angstroms. Density ρ and its Laplacian ∇2ρ are in atomic units, (absolute electrons per Bohr-cubed for the density, for example), as are the kinetic and potential energy densities G and V. Density was computed in ωB97XD/SDD.
CoordinationLengthDensity ρ at LCP2ρ at LCPDIGVH
a, a’1.5963, 1.65900.1271, 0.1114+0.2826, +0.24500.3734, 0.30750.1250, +0.1037−0.1799, −0.1465−0.0549, −0.0428
b, b’1.8013, 1.81550.0912, 0.0875+0.1998, +0.19020.2284, 0.22860.0812, 0.0767−0.1125, −0.1160−0.0313, −0.0393
c, c’1.7419, 1.75280.0963, 0.0913+0.2260, +0.20690.2694, 0.26220.0896, 0.0829−0.1229, −0.1142−0.0333, −0.0313
d, d’1.7949, 1.78320.0909, 0.0969+0.2150, 22210.2451, 0.26680.0845, 0.0893−0.1154, −0.1235−0.0309, −0.0342
Rh-H1.8105,1.78360.0937, 0.0976+0.2353, +0.23560.2038, 0.22260.0914, 0.0942−0.1241, −0.1293−0.0327, −0.0351
Table 2. The coordination around H atom in HCo6(CO)151− anion. Interatomic distances are in Angstroms. Density ρ and its Laplacian ∇2ρ are in atomic units (e.g., absolute electrons per Bohr-cubed for the density), as are the kinetic and potential energy densities G and V. Geometry was optimized in ωB97XD/def2-SVP. There are no interaction lines nor LCPs from Co to Co.
CoordinationLengthDensity ρ at LCP2ρ at LCP
a, a’1.79330.0689+0.1267
b1.81580.0642+0.1376
d1.91290.0538+0.1337
c1.81580.0643+0.1376
e1.91300.0526+0.1338
Co a-a’2.4666* 1*
Co b-b’2.4647**
Co a-b (a’-b’)2.7959**
DIGVH
a, a’0.27310.0529−0.0741−0.0212
b0.23410.0519−0.0694−0.0175
d0.19710.0442−0.0580−0.0138
c0.23410.0519−0.0694−0.0175
e0.19180.0442−0.0551−0.0551
1 There are no interaction lines connecting Cobalt atoms.
Table 3. The coordination around H atom. Interatomic distances are in Angstroms. Density ρ and its Laplacian ∇2ρ are in atomic units.
CoordinationLengthDensity ρ at LCP2ρ at LCPDIGVH
a (H…O)2.61080.0177+0.03990.08800.0107−0.0113−0.0006
b (H…Mg)2.40250.0265+0.12410.07460.0286−0.0263+0.0023
x (MgO)1.91090.0556+0.27310.14400.0583−0.0483−0.0100
Table 4. Electronic energy of endohedral complexes for Ca-Zn (Hartrees), binding energy (eV), and number of QTAIM lines from the metal to fullerene carbons. Negative BE, which is the electronic energy change in the reaction M + C20 → M@C20 with no corrections for effects of the medium, means the complex is more stable. LN refers to the number of QTAIM lines connecting the metal to C atoms of the fullerene. These values do not incorporate zero-point vibrational energies.
Atom MLNE (M + C20)E (M@C20)BE (eV)BE (eV) 1
1Ca d010−1438.799965−1438.515743+7.73a
2Sc d120−1521.861237−1521.890211−0.79a
3Ti d220−1610.588977−1610.724727−3.69a3.80b
4V d312−1705.143352−1705.194267−1.39a1.93b
5Cr d48−1805.655613−1805.591705+1.74a−3.23b
6Mn d54−1912.089623−1912.078599+0.30a−6.31b
5Fe d65−2024.881830−2024.791288+2.46a−3.47b
4Co d78−2144.000844−2143.843613+4.28a−4.19b
3Ni d88−2269.221160−2269.386339−4.49a−4.75b
2Cu d96−2401.807669−2401.507195+8.18a−7.52b, −2.17c
1Zn d1010−2540.729908−2540.386014+9.36a−4.31c
1 BE values labeled a are from this work; those labeled b and c are from [26,28] respectively.
Table 5. The coordination around Ne atom in Ne@C20. Interatomic distances are in Angstroms. Density ρ and its Laplacian ∇2ρ are in atomic units.
CoordinationLengthDensity ρ at LCP2ρ at LCPDIGVH
a (to C along D3 axis)2.01830.0591+0.34380.08250.0870−0.0879−0.0009
b (to a neighboring C)2.03360.0566+0.32270.07620.0822−0.0822+0.0023
c (to a non-neighboring C)2.10470.0512+0.30420.06420.0746−0.0732+0.0014
DI (delocalization index) is a measure of electron sharing. H (=G + V) < 0 suggests a degree of covalent bonding.
Table 6. The coordination around Ca atom (triplet). Interatomic distances are in Angstroms. Density ρ and its Laplacian ∇2ρ are in atomic units.
CoordinationLengthDensity ρ2ρDIGVH
Ca to C in polar 5-rings2.11120.0782+0.34180.16540.0992−0.1128−0.0136
Table 7. The coordination around Sc atom (doublet). Interatomic distances are in Angstroms. Density ρ and its Laplacian ∇2ρ are in atomic units.
CoordinationLengthDensity ρ2ρDIGVH
Sc- C to a C5 ring2.118
to
2.106
0.0832
to
0.0810
+0.3233
to
+0.3158
0.1852
to
0.1784
0.1009
to
0.0842
−0.1201
to
−0.1172
−0.03
to
−0.02
DI (delocalization index) is a dimensionless measure of electron sharing. Energy densities G and V are in Hartrees/cubic Bohr, i.e., atomic units. H (which = G + V) < 0 suggests a degree of covalent bonding.
Table 8. The coordination around Ti atom (triplet). Interatomic distances are in Angstroms. Density ρ and its Laplacian ∇2ρ are in atomic units.
CoordinationLengthDensity ρ2ρDIGVH
Ti C square plane2.0870.0851+0.32280.22300.1016−0.1225−0.0209
Ti-C four triangles C42.1010.0877+0.31900.21210.0901−0.1228−0.0327
Ti-C four triangles S42.1010.0874+0.31480.22330.0980−0.1173−0.0193
DI (delocalization index) is a measure of electron pair sharing. H (=G + V) < 0 suggests a degree of covalent bonding.
Table 9. The coordination around V atom (quartet). Interatomic distances are in Angstroms. Density ρ and its Laplacian ∇2ρ are in atomic units.
CoordinationLengthDensity ρ2ρDIGVH
a, a’2.13560.0719+0.27720.17370.0830−0.0967−0.0137
b, b’2.07900.0917+0.30260.37490.1272−0.1686−0.0414
c1.97370.1214+0.39580.23370.1165−0.1686−0.0531
d2.10880.0839+0.24540.47930.1141−0.1553−0.0412
e, e’1.97850.11350.34260.28140.1014−0.1272−0.0258
f, f’1.99150.11120.31790.37060.1196−0.1598−0.0402
g, g’2.02990.10360.28010.35500.1059−0.1419−0.0360
DI (delocalization index) is a measure of electron pair sharing. H (=G + V) < 0 suggests a degree of covalent bonding.
Table 10. The coordination around Cr atom (quintet) in Cr@C20. Interatomic distances are in Angstroms. Density ρ and its Laplacian ∇2ρ are in atomic units.
CoordinationLengthDensity ρ2ρDIGVH
a2.09190.0928+0.16930.41360.0928−0.1108−0.0180
b, b’1.89100.1249+0.24960.34980.1249−0.1772−0.0523
c, c’1.98540.1165+0.29130.39030.1165−0.1686−0.0531
d, d’1.98800.1142+0.31960.38690.1142−0.1687−0.0545
e1.90680.1221+0.26560.47250.1221−0.1765−0.0544
f, f’2.02480.1138+0.33730.34980.1138−0.1739−0.0601
DI (delocalization index) is a measure of electron sharing. H (=G + V) < 0 suggests a degree of covalent bonding.
Table 11. The coordination around Mn atom (sextet) in Mn@C20. Interatomic distances are in Angstroms. Density ρ and its Laplacian ∇2ρ are in atomic units.
CoordinationLengthDensity ρ2ρDIGVH
a1.90480.1390+0.24190.55990.1269−0.1935−0.0666
b, b’1.90740.1259+0.22960.47520.1274−0.2022−0.0748
e2.25430.0625+0.19280.11520.0475−0.0647−0.0172
DI (delocalization index) is a measure of electron sharing. H (=G + V) < 0 suggests a degree of covalent bonding.
Table 12. The coordination around Fe atom (quintet) in Fe@C20. Interatomic distances are in Angstroms. Density ρ and its Laplacian ∇2ρ are in atomic units.
CoordinationLengthDensity ρ2ρDIGVH
a1.85980.1380+0.20870.51350.1269−0.1935−0.0666
b, b’1.85880.1376+0.20760.51500.1274−0.2025−0.0851
d1.98740.1046+0.36750.27070.0693−0.1721−0.1028
e2.36210.0453+0.16860.10590.0475−0.0529−0.0054
DI (delocalization index) is a measure of electron sharing. H (=G + V) < 0 suggests a degree of covalent bonding.
Table 13. The coordination around Co atom (quintet). Interatomic distances are in Angstroms. Density ρ and its Laplacian ∇2ρ are in atomic units.
CoordinationLengthDensity ρ2ρDIGVH
a1.89730.1336+0.31790.41730.1366−0.1935−0.0569
b, b’1.84380.1442+0.29130.47500.1442−0.2155−0.0713
c, c’1.84450.1444+0.29140.47250.1442−0.2156−0.0714
d, d’1.83740.1358+0.23700.56720.1360−0.2127−0.0767
e1.89750.1336+0.31830.41840.1366−0.1938−0.0400
DI (delocalization index) is a measure of electron sharing. H (=G + V) < 0 suggests a degree of covalent bonding.
Table 14. The coordination around Ni atom (triplet) in Ni@C20. Interatomic distances are in Angstroms. Density ρ and its Laplacian ∇2ρ are in atomic units.
CoordinationLengthDensity ρ2ρDIGVH
a1.92850.1137+0.23500.37700.1171−0.1571−0.0400
b, b’1.85180.1297+0.28360.44260.1369−0.2030−0.0661
c, c’1.85160.1297+0.28350.44270.1369−0.2030−0.0661
d, d’1.83060.1329+0.23470.51880.1289−0.1991−0.0702
e1.92850.1137+0.26830.37700.1171−0.1571−0.0400
DI (delocalization index) is a measure of electron sharing. H (=G + V) < 0 suggests a degree of covalent bonding.
Table 15. The coordination around Cu atom (doublet) in Cu@C20. Interatomic distances are in Angstroms. Density ρ and its Laplacian ∇2ρ are in atomic units.
CoordinationLengthDensity ρ2ρDIGVH
a, a’2.00340.0785+0.30380.24540.1077−0.1395−0.0318
b, b’1.97260.0978+0.31770.23480.1155−0.1586−0.0475
d1.97660.0967+0.31280.26040.0956−0.1475−0.0531
e2.05200.0785+0.29600.17400.0642−0.1172−0.0530
DI (delocalization index) is a measure of electron sharing. H (=G + V) < 0 suggests a degree of covalent bonding.
Table 16. The coordination around Zn atom (doublet) in Zn@C20. Interatomic distances are in Angstroms. Density ρ and its Laplacian ∇2ρ are in atomic units. To a good approximation the system is D5d—symmetric.
CoordinationLengthDensity ρ2ρDIGVH
a, a’2.07920.0763+0.28980.13330.0950−0.1175−0.0225
b, b’2.07880.0763+0.28970.13320.0948−0.1172−0.0220
d2.07920.0765+0.29010.13340.0964−0.1174−0.0110
e2.07860.0761+0.29600.13340.0948−0.1173−0.0221
f, f’2.07750.0762+0.28910.13300.0947−0.1171−0.0218
g, g’2.07860.07620.28940.13330.0948−0.1173−0.0221
DI (delocalization index) is a measure of electron sharing. H (=G + V) < 0 suggests a degree of covalent bonding.
Table 17. Ne@C20 is a reference, with LCP densities in the range 0.05 to 0.06; Laplacian values near 0.33; DI near 0.08; and balanced covalent/ionic interactions (|H| near zero). All energies are in Hartrees; the van der Waals radii are in picometers and charges are in absolute electrons |e|.
M@C20Density
M-C LCP
Laplacian M-C LCPH
(G-V)
−V/2Radius
(C20)
vdW Radius 1
Q
Range of
DI
Ne0.05910.344<0.0100.0442.0341540.082
0.05120.3220.0412.018−0.0040.076
Ca0.78400.340−0.0140.0562.1111940.165
1.028
Sc0.08320.323−0.030.0602.1181840.185
0.08100.316−0.020.0582.1061.4740.178
Ti0.08740.3228−0.033−0.12272.08141760.2223
0.08510.3150−0.019−0.11732.08141.7320.2120
V0.11350.396−0.0360.0712.031710.355
0.10360.280−0.01930.0641.971.6200.281
Cr0.1249+0.2496−0.0600.0891.8911660.472
0.11380.3373−0.0520.0842.0251.4320.350
Mn0.13500.2419−0.0670.10112.101610.560
0.12590.2296−0.0750.09672.091.3620.475
Fe0.13800.2076−0.0670.09671.861560.514
0.10460.3675−0.0850.10121.991.2980.377
Co0.13580.2370−0.0400.09671.8371520.519
0.14440.3183−0.0770.10771.8970.9200.377
Ni0.13290.2347−0.0770.09951.8311490.519
0.11370.3183−0.0400.07861.9230.8340.377
Cu0.09780.3177−0.0530.07931.9731450.260
0.07850.3038−0.0320.06982.0030.9990.245
Zn0.07620.2930−0.0220.05862.0791420.133
1.404
Ar0.12020.3305−0.0520.07212.1801880.366
0.07420.1568−0.0100.05161.968−0.0510.156
1 van der Waals radii are from [51].
Publisher’s Note: MDPI stays neutral with regard to jurisdictional claims in published maps and institutional affiliations.

