Article

A Decision Analysis Model for the Brand Experience of Branded Apps Using Consistency Fuzzy Linguistic Preference Relations

1
Department of Marketing and Distribution Management, National Kaohsiung University of Science and Technology, Kaohsiung City 811, Taiwan
2
College of Management, National Kaohsiung University of Science and Technology, Kaohsiung City 811, Taiwan
*
Author to whom correspondence should be addressed.
Symmetry 2021, 13(7), 1151; https://doi.org/10.3390/sym13071151
Submission received: 7 June 2021 / Revised: 24 June 2021 / Accepted: 24 June 2021 / Published: 27 June 2021
(This article belongs to the Special Issue Research on Fuzzy Logic and Mathematics with Applications)

Abstract

:
Branded apps are not only an important platform for enterprises and customers to have real-time interactions and communicate marketing messages, but also a new business model that encourages value co-creation between the two. In order to explore the impact of branded apps on customers, this study constructs a fuzzy multi-criteria decision making (FMCDM) analysis model, and it uses consistent fuzzy linguistic preference relations (CFLPR) to set up a symmetric pairwise comparison matrix, which greatly reduces the complexity and error rate of calculations. Empirical research findings show that brand experience attributes and the influence of brand experience on customer loyalty and satisfaction can be more accurately measured. As a consequence of this study, we show that, among the brand experience facets of two retail chain branded apps, behavioral experience is the most favored, while affective experience is the least favored. Furthermore, brand attachment and active participation should be strengthened to enhance customer loyalty. Through the analytical model employed in this study, enterprises can regularly monitor changes in the brand experience preferences of branded app users and evaluate app performance to flexibly adjust mobile device-based marketing campaigns and strategies. It can also aid enterprises in using mobile devices effectively to improve customer loyalty and address the issue of diminishing brand loyalty.

1. Introduction

The rapid development of the internet has made mobile applications (“apps”) an important platform for real-time interactions between enterprises and customers [1]. As part of consumers’ daily life, mobile apps represent the latest trend of branding. They help build brand identity, create brand experience, and encourage brand–consumer interactions, thus generating both opportunities and challenges for enterprises [2]. According to Stocchi et al. [3], with consumers worldwide using mobile apps extensively, a growing number of enterprises have realized the importance of app-based marketing. Well-known major brands, including Apple, Google, and Amazon, have already established their presence in the app market. Furthermore, marketers in big companies are trying to make mobile apps an integral part of their marketing strategies for consumer participation [4]. Mobile apps have, thus, opened a new area of research. In Taiwan, two well-known retailers, 7-ELEVEn and FamilyMart, have long been actively investing in developing their branded apps in the hope of preemptively building a new business model featuring brand–customer interactions based on mobile devices, thus enhancing brand experience and boosting customer brand loyalty. Kim and Yu [5] reported that consumers’ holistic brand experience of branded apps is positively correlated with brand loyalty. Compared to other marketing instruments, branded apps are the most popular among enterprises. Apps have built a platform for the consumption activities of a new generation of consumers and for enterprises to interact with customers and assess the effectiveness of their marketing strategies. This makes the use of branded apps an important research area. While much of the past literature on branded apps focused on the causal relationships among brand image, customer loyalty, satisfaction, purchase intention, and performance [1,3,6,7], limited studies used fuzzy decision analysis to identify differences between major facets of consumers’ holistic brand experience of branded apps. Furthermore, the impact of branded apps on customer loyalty and satisfaction has not received much attention. To make contributions in this regard, building on the fuzzy set theory and consistent fuzzy linguistic preference relations (CFLPR), this study employs fuzzy linguistic variables and fuzzy interval data [8] to build a symmetric pairwise comparison matrix for accurately measuring the linguistic ambiguity of consumers’ branded app-based brand experience [9,10,11,12,13,14]. As noted by Khan and Rahman [15], although brand experience has been a focus area for years, there are few studies on the retail industry. Therefore, with two well-known retail chain stores in Taiwan—7-ELEVEn and FamilyMart—as the empirical objects, this study identifies differences in the holistic branded app-based experience provided by business competitors, gauges the performance of brand experience attributes, and analyzes the impact of brand experience on customer loyalty and satisfaction. In doing so, we hope to provide insights for the retail industry into the making of interactive marketing strategies and to promote value co-creation between enterprises and customers in an era where the service-dominant logic prevails.

2. Literature Review

2.1. Mobile App and Branded App

A mobile app can be downloaded free of charge on mobile devices. Unlike traditional marketing tools, the mobile app integrates diverse innovative contents and functions and extends enterprises’ customer service. It encourages value co-creation between brands and customers through real-time online interaction and acts as a platform for communicating marketing messages. Newman et al. [16] noted that using apps to provide value to customers generates an opportunity for many retailers to regain or reinforce their competitiveness. Meanwhile, branded apps on mobile devices can help build a unique brand identity through the brand’s name, logo, or totem [17]. As a new marketing instrument, mobile apps may go some way toward boosting brand loyalty and purchase intention, strengthening the customer–brand bond and pushing up overall sales through enhanced brand satisfaction [18]. An increasing number of enterprises today use branded apps as a tool to communicate with their consumers. This shift in communication strategy, according to Stocchi et al. [19], is partially attributable to the significant impact of good user experience through branded apps on brand loyalty and purchase intention. These apps, therefore, have an advantage over traditional marketing tools in promoting brand–consumer interactions.

2.2. Brand Experience of Branded App

Schmitt put forward the holistic brand experience theory in 1999. He viewed experiences as “private events that occur in response to some stimulation”. They normally result from direct observation of or participation in events—real, illusionary, or constructed—and are, therefore, induced rather than self-generated. Brand experience is defined as customers’ sensations, feelings, cognition, and behavioral responses triggered by brand-related stimuli—all of which are part of a brand’s design, identity, packaging, communication, and environment [20]. Lee and Kang [21] noted that different dimensions of brand experience coordinate with each other to generate a holistic brand experience and help brands build customer rapport. Ambler et al. [22] posited that brand experience develops through customers using the brand, as well as discussing and collecting brand-related information or promotions. Nadzri et al. [23] argued that customers have brand experiences even before they encounter brands. While searching for products in the market, customers are exposed to stimuli from all kinds of brands. Therefore, marketing professionals should not only focus on the functional attributes and efficacy of products but also understand consumers’ feelings from the perspective of holistic brand experience. Kim and Yu [5] proposed that customers’ holistic brand experience generated by their interactions with a brand through its branded app includes four major facets, namely, affective, cognitive, behavioral, and relational experiences. The definition of each facet is given in Table 1.
Table 2 contains the attributes of the major facets of branded app-based brand experience.

2.3. Loyalty and Satisfaction of Brand Experience

Brakus et al. [24] defined brand experience as an information-collecting behavior that helps customers understand brand personality and choose brands that suit them better. In this process, brand loyalty and satisfaction are enhanced, and stronger brand–customer ties are built. Huang [27] and van der Westhuizen [28] noted that many previous studies have found that brand experience preludes and is positively related to customer loyalty. Research on consumers’ brand experience has shown that it can positively affect customer loyalty and satisfaction [6]. Furthering previous academic works, this paper places detailed focus on different attributes of customers’ brand experience of branded apps and the influence of each attribute on customer loyalty and satisfaction.

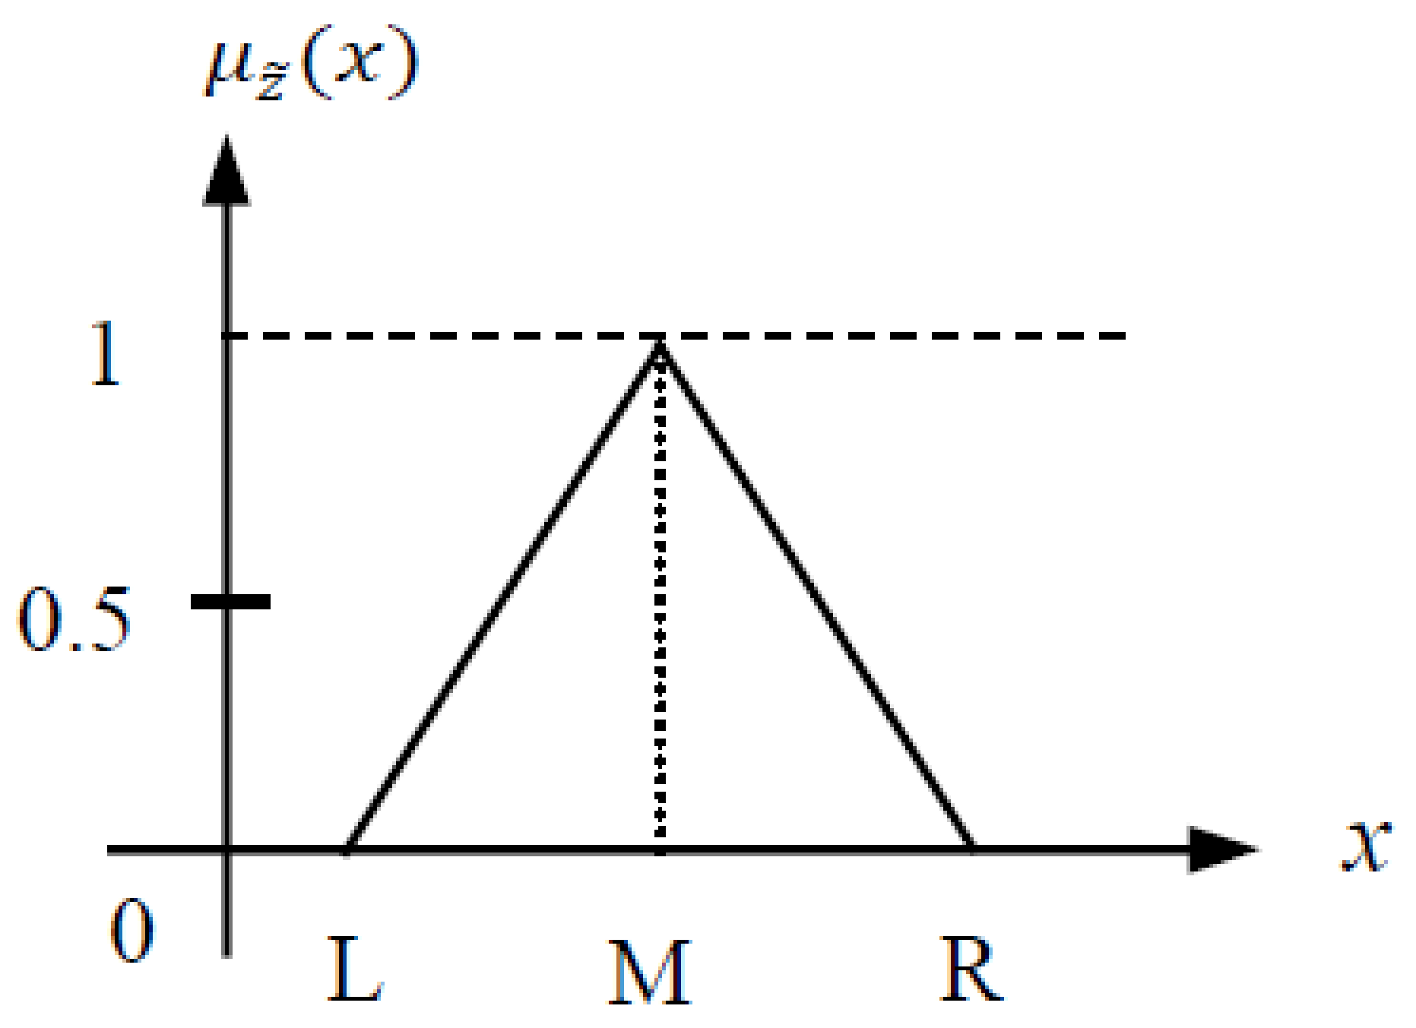
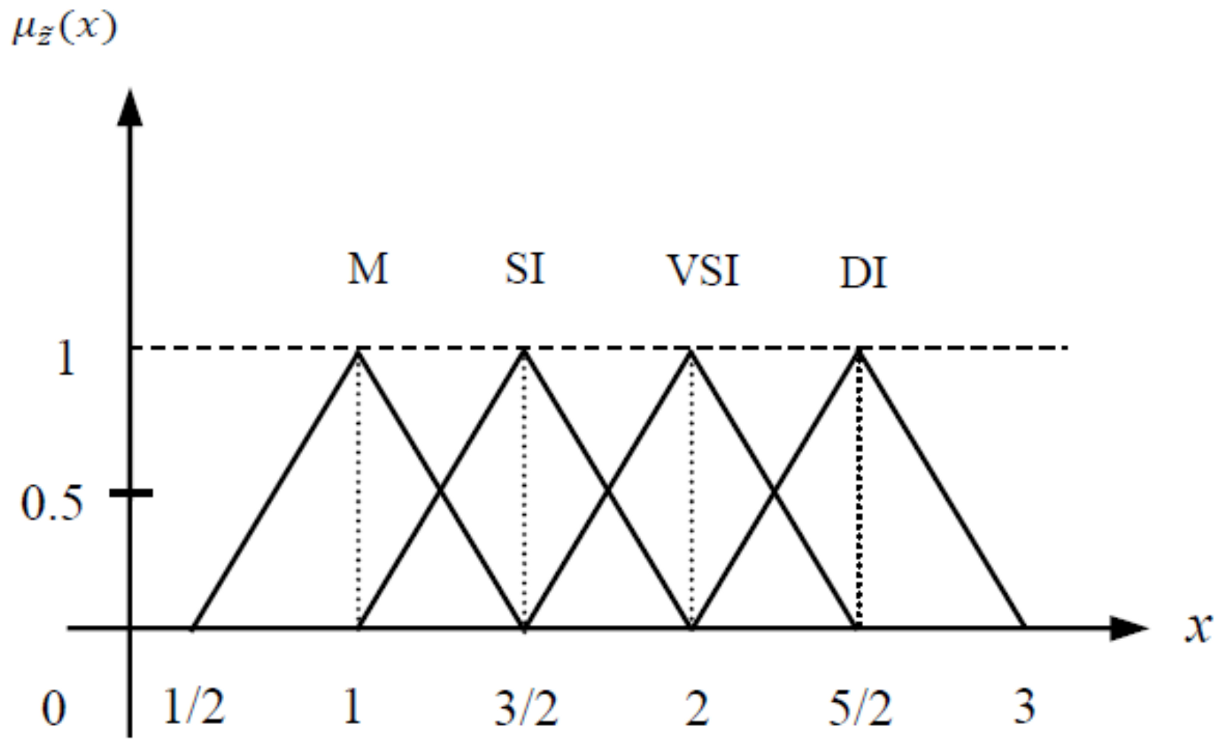
2.4. Consistency Fuzzy Linguistic Preference Relations

FMCDM is a powerful decision analysis tool that has been widely applied in situations where decision-makers have to choose from several alternatives of actions [29]. In more recent times, the ambiguous information environment has prompted scholars to develop many FMCDM tools based on the fuzzy set theory to assist decision-makers in tackling the issue of ambiguity when comparing alternative pairs [30]. Among these tools, the most commonly used include fuzzy analytic hierarchy process (FAHP) [31] and fuzzy analytic network process (FANP) [13,32]. In FAHP, for a pairwise comparison matrix that includes n alternatives, as many as n(n − 1)/2 comparisons are requested. Keeping aside the complexity of the entire process, the evaluation results produced by different experts could also be inconsistent. Therefore, scholars developed CFLPR, through a symmetric matrix that only requires n − 1 pairwise comparisons from the given n alternatives. Compared with FAHP, CFLPR is simpler, requires fewer comparisons, and can avoid the problem of inconsistent evaluation outcomes. It is a new FMCDM tool that has emerged in recent years [33,34]. As noted by Pandey and Kumar [35], although CFLPR can greatly reduce the likeliness of inconsistent expert opinions, the method has some logical flaws in the derivation of its formula. This issue was addressed by Wang [36]. CFLPR, in recent years, has been applied for selecting excellent suppliers in the TFT-LCD TV-panel manufacturing industry [37] and choosing marketing strategic alliances in the mobile telecommunication industry [13]. For efficiency and accuracy, this study uses CFLPR in lieu of FAHP to evaluate aspects of customers’ brand experience generated by branded apps and their relative importance.

3. Decision Analysis Model Building

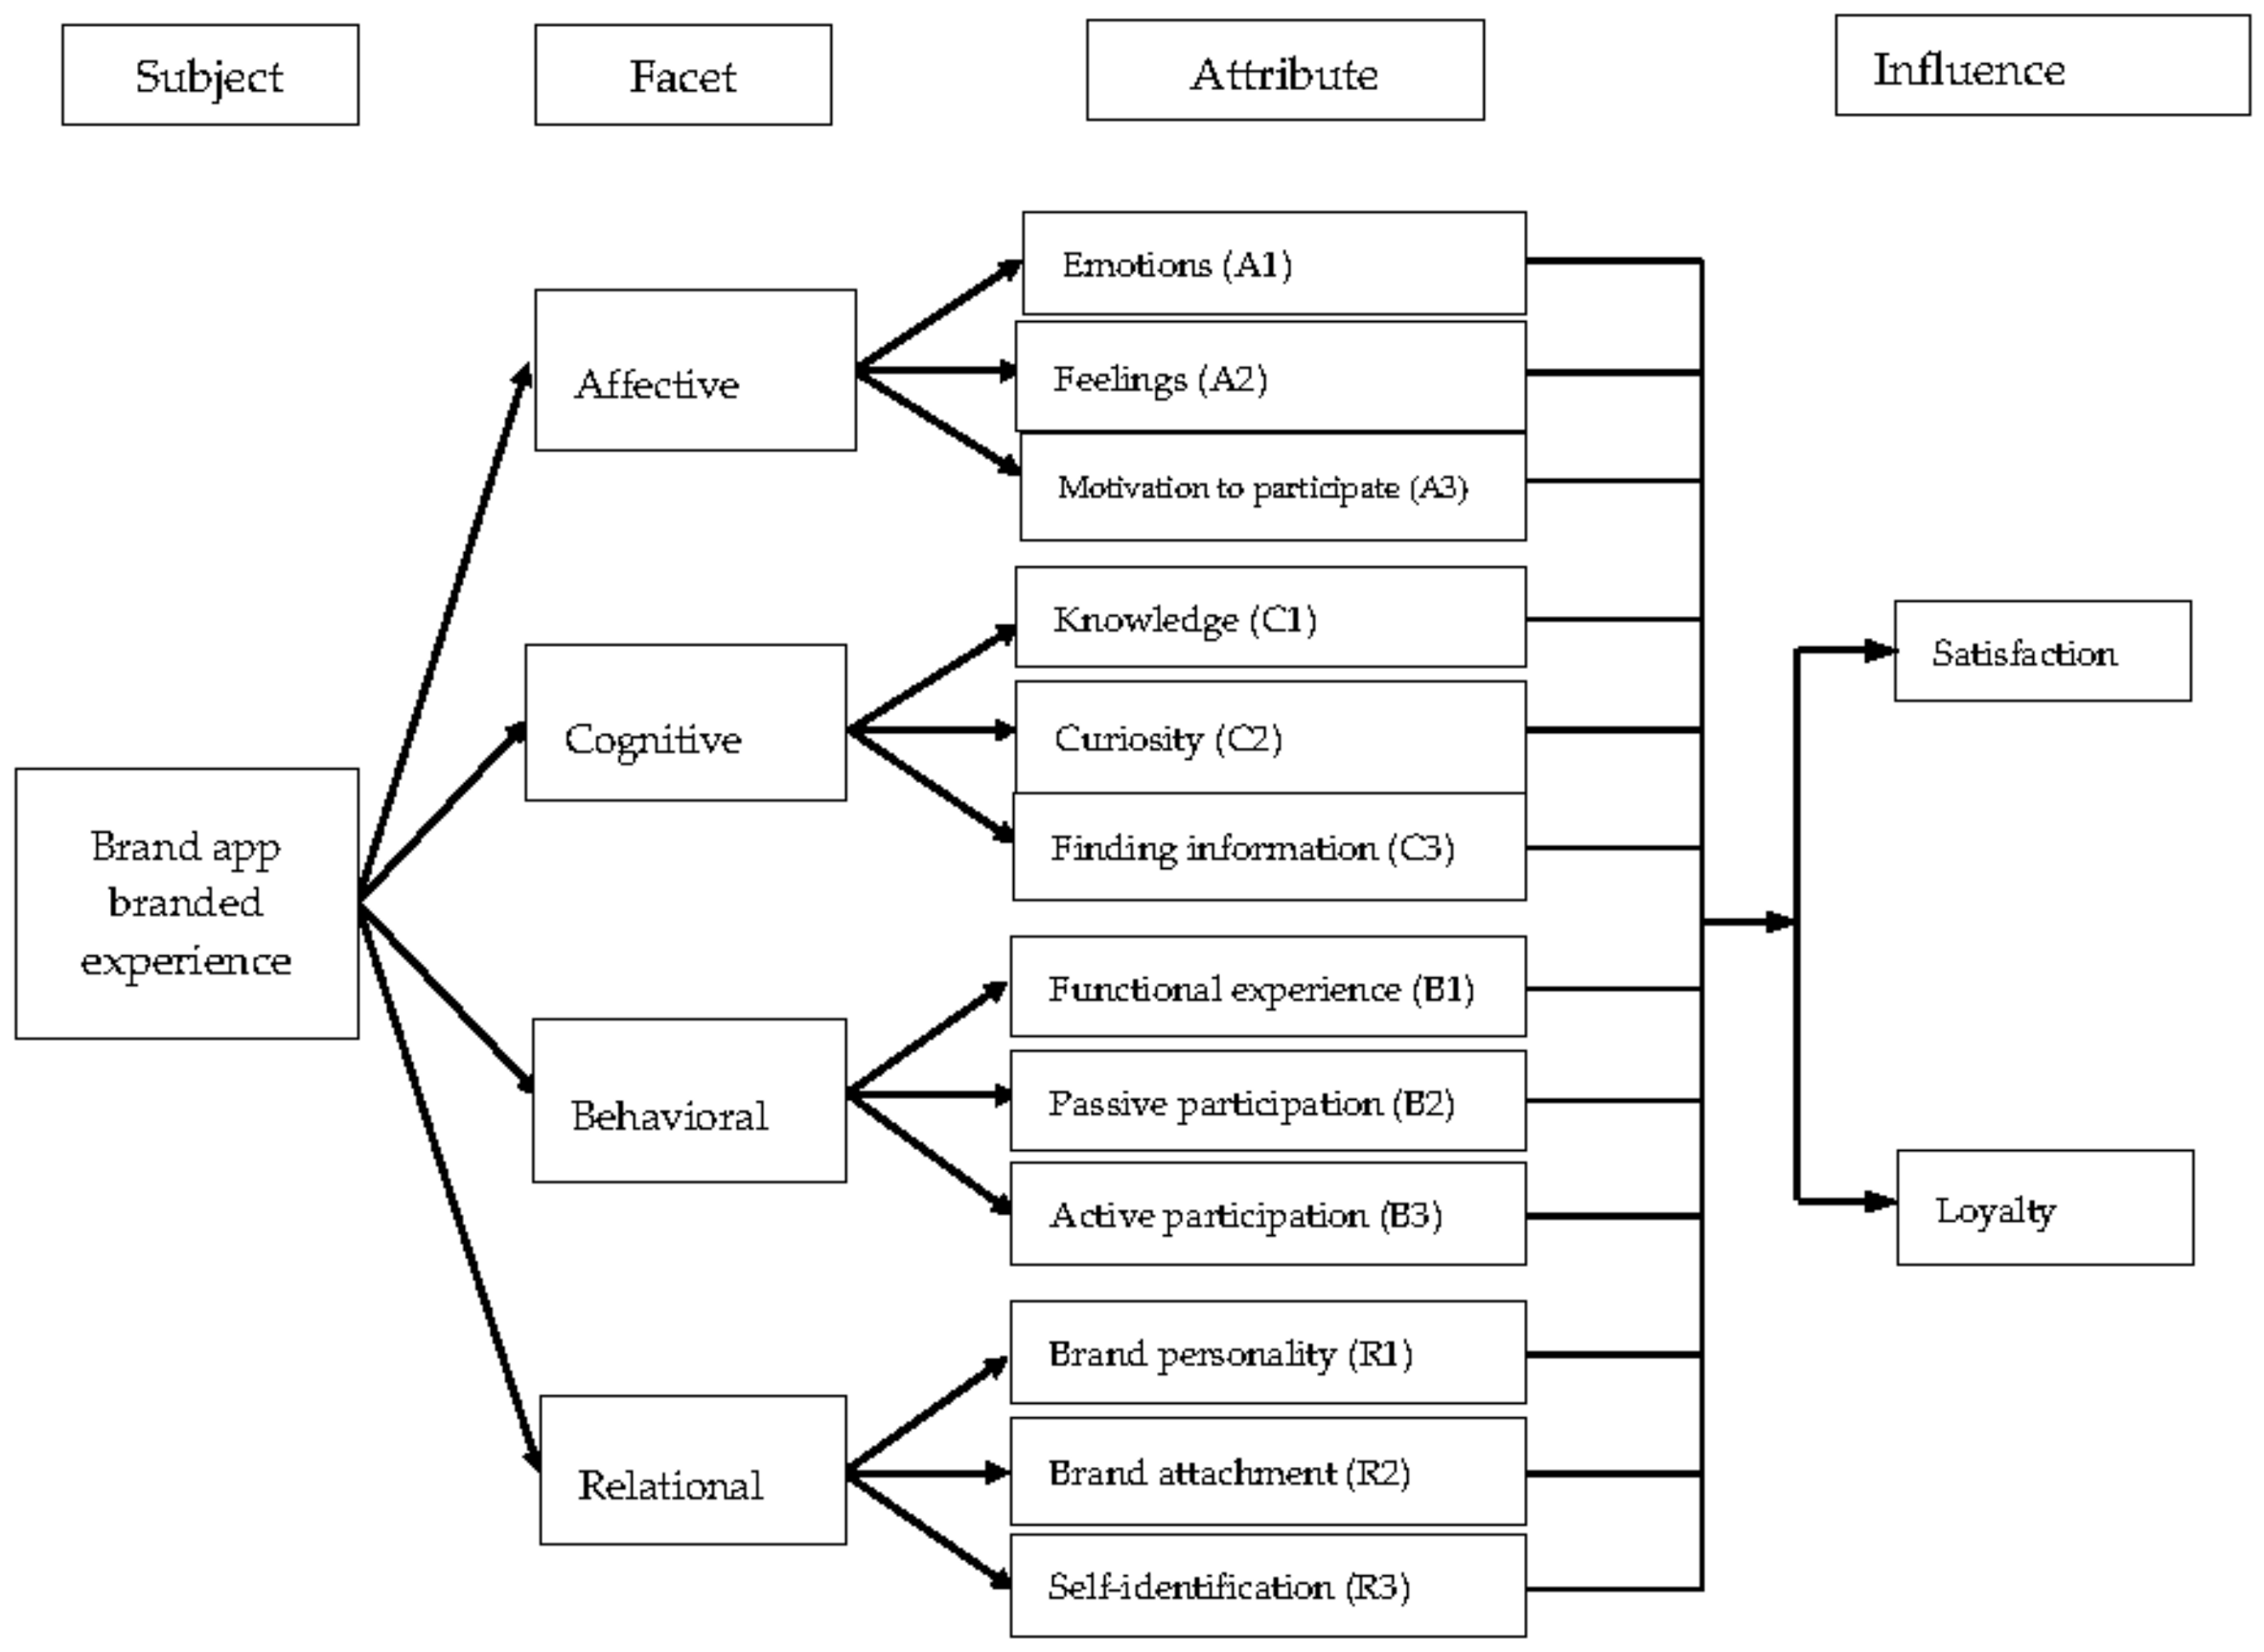
3.1. Model Building Concept

This research explored the brand experience hierarchy of the development of branded apps in the retail industry through the literature and determined the fitness of the hierarchy through six expert interviews. CFLPR was used to evaluate the weights of brand experience facets and attributes, so that customers’ feelings of using branded app brand experience could be appropriately measured. After obtaining the weights of various facets and attributes, a performance evaluation was performed for each attribute of the enterprise, and then the influence of each attribute on customer loyalty and satisfaction was analyzed and discussed. Lastly, specific management suggestions were put forward for the company.

3.2. Steps to Create an Analytic Model

Step 1: Establish brand experience hierarchical structure
This research was based on the four major facets of branded app brand experience developed by Kim and Yu [5] (see Table 1). Through literature discussion and integration of other scholars’ research results, 12 brand experience attributes were constructed (see Table 2). Combining Table 1 and Table 2, and then confirming that the content was suitable for the characteristics of the retail industry through expert interviews, the hierarchical structure of this research was eventually established (see Figure 1).
Step 2: Calculate relative weights
(A) Use triangular fuzzy number and fuzzy linguistic scale
A fuzzy number Z ˜ is a triangular fuzzy number when its membership function is expressed by Equation (1) [38].
μ z ˜ ( x ) = { ( x L ) / ( M L ) , L x M ( R x ) / ( R M ) , M x R 0 , o t h e r w i s e .
L and R in Equation (1) represent the left and right values of the fuzzy number Z ˜ , respectively, and M is the middle value (see Figure 2).
In this study, the nine-point fuzzy linguistic scale (as shown in Figure 3 and Table 3) developed by Büyüközkan [39] was used in the questionnaires distributed selectively to respondents.
(B) Establish symmetric pairwise comparison matrix
When a questionnaire was confirmed to be valid, the triangular fuzzy number given by the interviewee was filled in a pairwise comparison fuzzy linguistic preference relation symmetry matrix A ˜ i j through Equation (2). A ˜ i j = ( a ˜ i j ) , a ˜ i j [ ( 1 / 3 , 2 / 5 , 1 / 2 ) , ( 2 , 5 / 2 , 3 ) ] .
A ˜ i j = 1 ˜ a ˜ 12 a ˜ 1 n a ˜ 21 1 ˜ a ˜ 2 n a ˜ n 1 a ˜ n 2 1 ˜ = 1 ˜ a ˜ 12 a ˜ 1 n a ˜ 12 1 1 ˜ a ˜ 2 n a ˜ 1 n 1 a ˜ 2 n 1 1 ˜ .
a ˜ i j = { 1 ˜ , 3 ˜ , 5 ˜ , 7 ˜ , 9 ˜ , i   is   relatively   more   important   compared   to   j 1 ˜ , i = j i   and j   are   equally   important   ( i = j ) 1 ˜ 1 , 3 ˜ 1 , 5 ˜ 1 , 7 ˜ 1 , 9 ˜ 1 , i   is   relatively   unimportant   compared   to   j
(C) Matrix translation
According to the CFLPR equations deduced by Wang and Chen [34], the reciprocal fuzzy linguistic preference relation matrix P ˜ i j was translated from matrix A ˜ i j , using Equation (3).
P ˜ i j = g a ˜ i j = 1 2 1 + log 9 a ˜ i j .
Then, using Equations (4)–(9), a complete reciprocal fuzzy linguistic preference relation matrix was completed.
P i j L + P j i R = 1 , i , j , k 1 , , n ,
P i j M + P j i M = 1 , i , j , k 1 , , n ,
P i j R + P j i L = 1 , i , j , k 1 , , n ,
P j i L = j i + 1 2 P i i + 1 R P i + 1 i + 2 R P j 1 j R ,
P j i M = j i + 1 2 P i i + 1 M P i + 1 i + 2 M P j 1 j M ,
P j i R = j i + 1 2 P i i + 1 L P i + 1 i + 2 L P j 1 j L .
Here, L is the left number of the triangular fuzzy number, M is the middle number of the triangular fuzzy number, and R is the right number of the triangular fuzzy number.
Lastly, we obtained a relatively complete fuzzy linguistic preference relation matrix P ˜ i j   , P ˜ i j [0,1], P ˜ i j = P i j L , P i j M , P i j R .
(D) Coordinate panning
Through the conversion function of Equations (10)–(12), to ensure that each fuzzy linguistic preference relation value P ˜ i j was within the interval value [0,1], it could be obtained that the fuzzy linguistic preference relation matrix was all within a certain range to maintain the positive and reciprocal of addition consistent characteristics (c is the minimum value in the consistent fuzzy linguistic preference matrix).
f x L = x L + c 1 + 2 c ,   c c , 1 + c .
f x M = x M + c 1 + 2 c ,   c c , 1 + c .
f x R = x R + c 1 + 2 c , c c , 1 + c .
(E) Weight calculation
Then, the proposition raised by Wang [36] regarding CFLPR was adopted to examine the consistency between the data and content of matrix P ˜ i j   ; using Equations (13)–(16), weights of branded app brand experience facets and attributes given by respondents were calculated.
Equation (13) allowed calculating the average value of all the brand experience facets or attributes, which is then averaged through the judgments of multiple respondents.
P ˜ ¯ i j = k = 1 m P ˜ ¯ i j k m , i , j ,
where k stands for the m -th respondent, and m stands for the number of respondents.
Then, Equation (14) was used to calculate the average of P ˜ ¯ i , which is the average value of evaluation of the fuzzy linguistic preference of the i -th facet or attribute for brand experience.
P ˜ ¯ i = j = 1 n P ˜ ¯ i j n , i ,
where, using the average value of P ˜ ¯ i , Equation (15) allowed calculating the weights of fuzzy preference of the i -th facet or attribute for brand experience.
W ˜ i = P ˜ ¯ i j = 1 n P ˜ ¯ i ,
where W ˜ i is the weight of fuzzy preference at the facet level, and W ˜ i j is the weight of fuzzy preference at the attribute level.
Lastly, Equation (16) was used for defuzzification to gain the precise weight value.
D i = 1 3 w i L + w i M + w i R ,
where Di is the definite weight of the i -th brand experience facet which is defuzzified, and Dij is the definite weight of the brand experience attribute which is defuzzified.
Step 3: Brand experience performance evaluation
Attributes in the branded app brand experience were employed as items for performance evaluation (see Table 2), using a five-point scale. Respondents were asked to score the actual and expected branded app brand experience performance of the firm, respectively, whereby a higher score denoted a better evaluation. Dij is the weight of branded app brand experience attributes, ei is the actual performance of each attribute, gi is their expected performance for each attribute, and pi is the performance value of each attribute, obtained using Equation (17). In addition, dividing the gi by ei provides the rate of improvement for the performance of each attribute ui (see Equation (18)).
p i = D i j × e i i = 1 , 2 , 3 , , n .
u i = g i ÷ e i i = 1 , 2 , 3 , , n .
Step 4: Influence Degree Analysis for Loyalty and Satisfaction
According to the calculation equations proposed by Wang and Chen [40], the degree of influence of brand experience attributes of a branded app on loyalty relative to satisfaction was evaluated. The analysis mode establishment process is described below.
(A) Create a form
Using a nine-point fuzzy linguistic scale (see Table 3), the respondent was asked to subjectively evaluate the influence degree of each attribute on loyalty and satisfaction, and the evaluation preference value i b ˜ L S k was obtained, where k represents the k-th respondent, and i is the i-th attribute of the brand experience of the branded app. E is the respondent, E 1 , , m , and F is an brand experience attribute (see Figure 1), F 1 , , n . L is loyalty and S is satisfaction (see Table 4 and Table 5).
In this study n = 12, while m = 55 (7-ELEVEn) and 56 (FamilyMark).
(B) Form translation
Equation (19) was used to convert the interviewee’s fuzzy linguistic evaluation preference value from the interval value [ ( 1 / 3 , 2 / 5 , 1 / 2 ) , ( 2 , 5 / 2 , 3 ) ] to [0,1]. Then, the fuzzy linguistic preference value i P ˜ L S k of each respondent could be obtained.
i P ˜ L S k = g ( i b ˜ L S k ) = 1 2 ( 1 + log 9 i b ˜ L S k ) .
(C) Coordinate panning
Through the transfer function of Equations (20)–(22), it was ensured that the preference values of the fuzzy linguistic preference matrix fell within the interval [0,1] to maintain a positive value and the reciprocal of addition consistent characteristics (c is the minimum value in the consistent fuzzy linguistic preference matrix).
f i x ˜ L S k L = i x ˜ L S k L 1 + 2 c , c c , 1 + c .
f i x ˜ L S k M = i x ˜ L S k M 1 + 2 c , c c , 1 + c .
f i x ˜ L S k R = i x ˜ L S k R 1 + 2 c , c c , 1 + c .
(D) Get the average value
Equation (23) was used to integrate the average value of fuzzy linguistic preference of m respondents for each attribute i. We could obtain the total average value of the fuzzy linguistic preference for L relative to S. Here, the total average value was represented by X ˜ .
i q ˜ ¯ L S = 1 m i q L S 1 + i q L S 2 + + i q L S m
(E) Create another form
With the data generated by Equation (19), we used Equations (24)–(26) to obtain another relative fuzzy linguistic preference value of S relative to L for each brand experience attribute (as in Table 5).
i P L S k L + i P L S k R = 1 , i 1 , , n , k 1 , , m .
i P L S k M + i P L S k M = 1 , i 1 , , n , k 1 , , m .
i P L S k R + i P L S k L = 1 , i 1 , , n , k 1 , , m .
(F) Coordinate panning
Equations (20)–(23) were again used to additionally obtain the total average value of the fuzzy linguistic preference for S relative to L. Here, the total average value was represented by Y ˜ .
(G) Standardization
Next, X ˜ and Y ˜ were integrated to build a complete L and S pairwise comparison matrix. Equation (27) was used to standardize the average fuzzy linguistic preference rating of the two possible outcome in each attribute for L and S, and i λ ˜ L S was taken to represent the rating ranking of the two possible outcomes after standardization for L and S.
i λ ˜ L S = i q ˜ L S L = 1 t i q ˜ L S , L , S = 1 , 2 , , t .
(H) Get the weights of loyalty and satisfaction
Using i φ ˜ ¯ L S to represent the average weights of the possible influence of each attribute, we could then get the result weights of L and S in each brand experience attribute, as detailed in Equation (28).
i φ ˜ ¯ L S = 1 t S = 1 t i λ ˜ L S ,
where t represents the number of evaluation objects, t = 2 in this study.
Equation (29) was used to defuzzify i φ ˜ ¯ L S , and the weights of L and S could be obtained for the i-th brand experience attribute.
w i = 1 3 w i L + w i M + w i R .
(I) Obtain influence degree value
Equation (30) was used to multiply the average weights of each brand experience attribute by the average weights of the two possible influence levels; we could get the influence degree value Z u of the branded app’s brand experience of the interviewee on loyalty and satisfaction.
Z u = i = 1 n D i j w ¯ i ,
where Dij is the weight of the brand experience attribute, as detailed in Equation (16).

4. Empirical Analysis

4.1. Overview of Retailers’ Brands

Originally founded in the United States, 7-ELEVEn was first introduced to Taiwan in 1978 and ignited a revolution in Taiwan’s retail industry. By July 2020, the retail chain had a market share of 59.15% with 5915 stores across Taiwan. The convenience store’s app “OPENPOINT” is widely used among its membership customers; it allows them to accumulate and redeem membership points, top up their accounts, access discounted products, make mobile payments, and learn about events jointly hosted with cross-industry partners, among other functions. The other empirical object of this study, FamilyMart, is a Japanese retail chain brand. Following the business principle of “where you are part of the family” and embracing a technology-powered smart retail strategy, by July 2020, it became the second largest convenience store chain in Taiwan with 3671 stores, which equates to a market share of 36.71%. Its branded app “FamilyMart” allows users to accumulate credit points, redeem products, and make mobile payments through My FamiPay for products on discount.

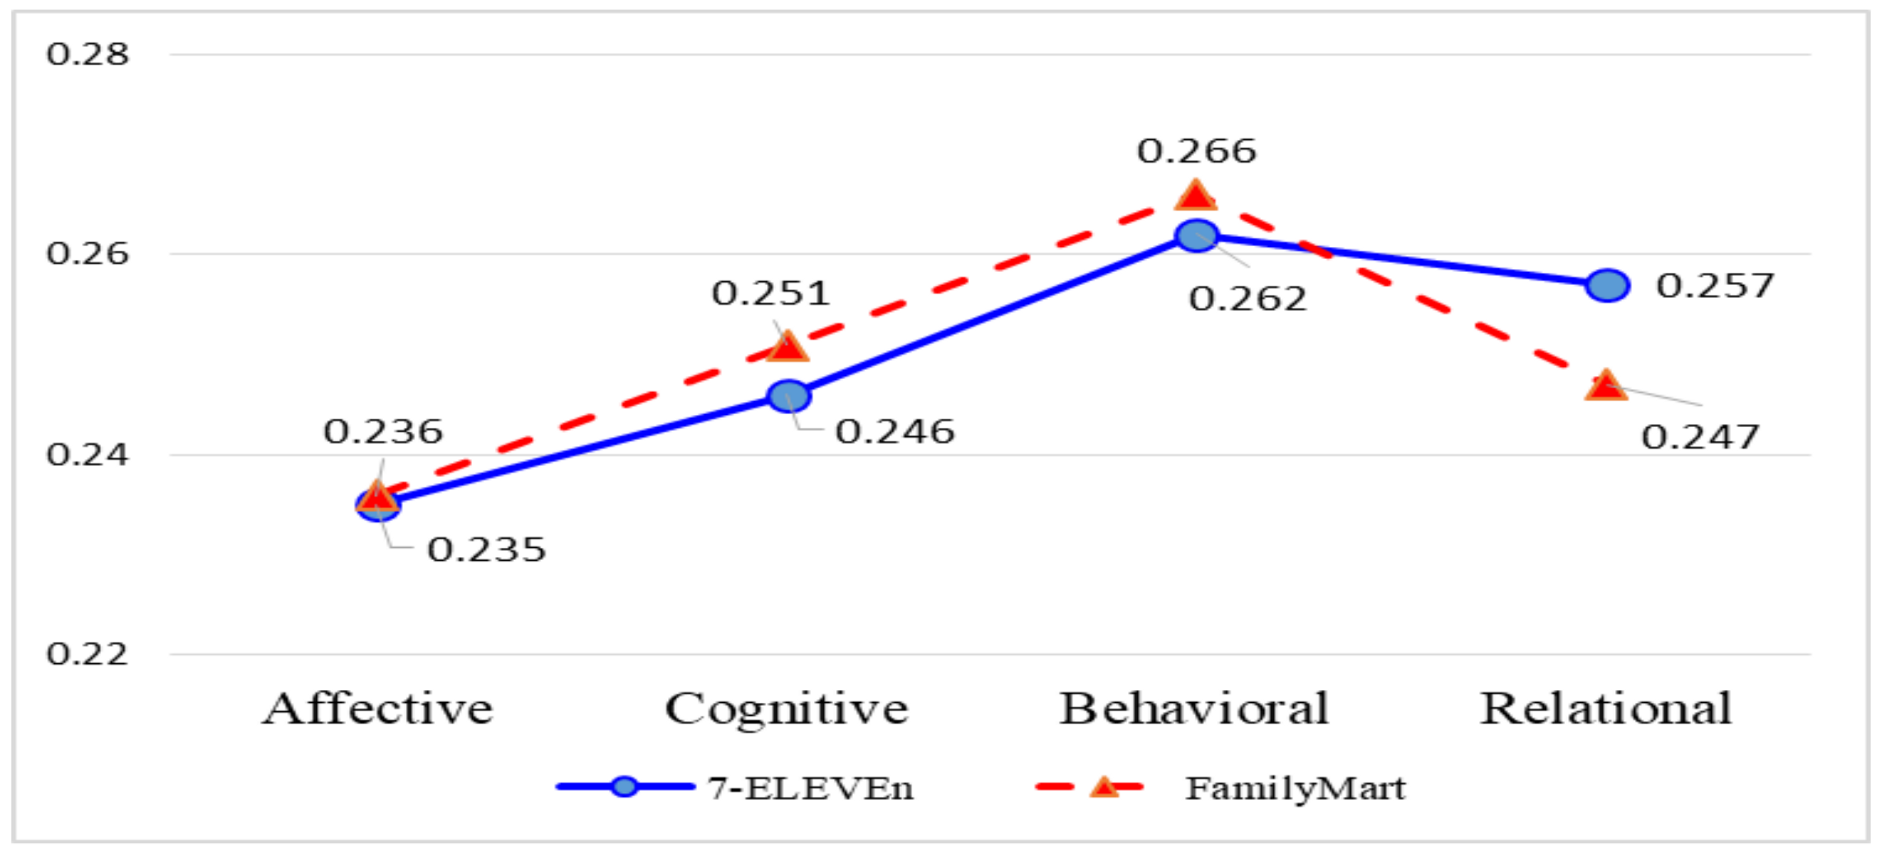
4.2. Survey and Analysis Results

For our empirical study, we first consulted three senior store managers from the aforementioned retail stores to pin down a hierarchical structure (see Figure 1), which, along with Table 1 and Table 2, formed the basis on which a questionnaire was developed. We selected active members of the two chain stores who used their branded apps 6–10 times every month and conducted 20–30 min in-depth interviews along with prompted questions and answers. The interviewees were asked to evaluate the relative importance and performance of each brand experience facet and attribute and rate the influence of each attribute in terms of customer loyalty and satisfaction according to their subjective judgment. A total of 60 questionnaires were handed out to the 7-ELEVEn respondents, among which 55 were valid and five were invalid; among the 60 questionnaires distributed to the FamilyMart respondents, 56 were valid and four were invalid. This study’s analysis was based on valid questionnaires. The weights of facets and attributes, which were calculated according to steps 1 and 2, are shown in Figure 4, Figure 5 and Figure 6. Table 6 displays the results of the performance evaluation of each branded app with regard to brand experience, measured against the formula provided in Step 3. Table 7 lays out the degrees, calculated according to Step 4, to which branded app-based brand experience attributes influenced customer loyalty and satisfaction.
As shown in Figure 4, for both stores, the weight of behavioral experience was the highest among all facets with values of 0.262 and 0.266 for 7-ELEVEn and FamilyMart, respectively. The affective experience had relatively low weights of 0.235 and 0.236 for 7-ELEVEn and FamilyMart, respectively. This indicates that, for respondents of both stores, using the branded app was more likely to encourage purchases or interactions with the brand but less likely to generate positive emotions and feelings toward the brand.
Figure 5a,b show the triangular fuzzy numbers of branded app-related brand experience facets, where a smaller area of the triangle denotes a higher consistency of respondents’ opinions. Although, for both retailers, the behavioral experience of the branded app was rated most favorably by respondents, the relatively large area of each triangle indicates that there is still room for improvement for the two stores when it comes to using branded apps to bolster consumers’ behavioral experience. Additionally, the partially overlapping behavioral and relational triangles of 7-ELEVEn suggest that, although its respondents gave the greatest prominence to behavioral experience, they did not view relational experience as a facet that could be overlooked. FamilyMart’s case is different because its behavioral triangle did not overlap with that of any other facet, indicating that its respondents viewed behavioral experience as more significant than other brand experience facets.
As shown in Figure 6, in terms of relative importance, the top three brand experience attributes of 7-ELEVEn’s branded app were “finding information (C3)” (0.0883), “functional experience (B1)” (0.0878), and “active participation (B3)” (0.0875), while those of FamilyMart were “functional experience (B1)” (0.0922), “passive participation (B2)” (0.0879), and “finding information (C3)” (0.0867). This result shows that the respondents of both stores, after trying the branded app for the first time, were likely to use it again for information regarding promotions and new products, as well as to spend on the brand or take part in in-app events.
As displayed in Table 6, for both retail stores, almost all 12 branded app-related brand experience attributes had a rate of improvement (ui) greater than 1, suggesting that all respondents expected better branded app experience. Specifically, the ui values of 7-ELEVEn’s “knowledge” (1.369), “feelings” (1.358), and “curiosity” (1.326) attributes and of FamilyMart’s “brand attachment” (1.123), “active participation” (1.114), and “feelings” (1.108) attributes were relatively high and, therefore, merit special attention. Furthermore, the ui value of FamilyMart’s “motivation to participate” (0.989) attribute was less than 1, meaning that respondents felt that the retailer’s performance in this regard exceeded their expectations. In terms of performance (pi), FamilyMart (5.968) outshone 7-ELEVEn (5.159) in the overall branded app performance (sum pi); however, in terms of the performance of individual attributes, “finding information” (0.518) was the most favorably rated for 7-ELEVEn, while “functional experience” (0.648) was the most favorably rated for FamilyMart. The performance of the “emotional” attribute (0.343/0.385) was the least desirable for both brands.
Table 7 shows the weights of the influence of each brand experience attribute on customer loyalty and satisfaction. The average weights of attribute influence on loyalty/satisfaction were 0.494/0.506 for 7-ELEVEn and 0.489/0.511 for FamilyMart; this suggests that the respondents unanimously agreed that the holistic brand experience derived from the use of branded apps affected customer satisfaction to a greater degree than it affected customer loyalty. Specifically, in terms of the influence on customer loyalty, “brand attachment” was the most weighted attribute for both 7-ELEVEn (0.517) and FamilyMart (0.499), indicating that all respondents believed that this attribute exerted the greatest impact on brand loyalty. Additionally, “active participation” was the second most weighted attribute for both 7-ELEVEn (0.510) and FamilyMart (0.498), suggesting that the respondents agreed that this attribute also had a significant influence on brand loyalty. Therefore, to ramp up customer loyalty to branded apps, businesses must work to enhance “brand attachment” and “active participation”.

5. Discussion

Figure 4 displays the trend of customers’ branded app-related brand experience preference, as well as the differences and similarities in this regard between the two brands in this study. Interestingly, although the two empirical objects are competitors, their customers’ brand experience brought about by the design and functions of their branded apps was similar. A close examination of brand experience attributes (see Figure 6), however, revealed some differences. Analyzing and comparing Figure 4, Figure 5 and Figure 6 can help businesses understand customers’ preferences with regard to their rivals, adjust their own appeal strategy, and improve their marketing competitiveness. Table 6 shows the improvements expected by customers in relation to branded apps, thus providing straightforward guidelines for enterprises to improve their branded app-generated brand experience. In 7-ELEVEn’s case, the “knowledge” attribute had a high rate of improvement of 1.369 but also had the least desirable performance among all 12 attributes; this indicates that respondents did not believe the app could encourage them to learn more about the brand. Table 6 can help improve the performance of branded apps, optimize customers’ brand experience, and enable branded apps to play an effective role in the communication of marketing messages. Strengthening customer loyalty is always a goal of companies. Table 7 sheds some light in this regard. It shows that, compared with other brand experience attributes, “brand attachment” enhanced customer loyalty to the greatest extent. This finding, together with the information shown in Table 6 regarding the rates of improvement and performance of the “brand attachment” attributes, can serve as a quick guide for enterprises to identify key aspects for improvement, efficiently allocate resources, and eventually achieve the goal of enhanced customer loyalty. Coursaris and Sung [41] discussed the relationship between providers and users of branded apps from the perspective of advertising marketing; they concluded that increasing the interactiveness of branded apps was an appealing marketing strategy for customers, as well as conducive to value cocreation between brands and their customers. This study’s findings may help enterprises gain insights into customers’ branded app-related brand experience preferences, promote brand–customer interactions, set up targeted strategic objectives for mobile device-based brand management, elevate brand value, and create new value for customers. Gill et al. [4] proposed that branded apps should be convenient, unique, socially valuable, intriguing, and entertaining and that good customer experience is the prerequisite for customer satisfaction and loyalty. Table 6 shows the rates of improvement and performance of branded app-generated brand experience attributes with regard to the empirical objects of this study. With these results and the data included in Table 7, businesses can upgrade their branded apps to create a user experience that better meets their customers’ expectations, significantly boosts customer satisfaction, and encourages customers to continually use their branded apps. Lee and Kang [21] argued that brand experience preludes and is positively related to customer loyalty. By analyzing the influence of 12 brand experience attributes on customer loyalty and satisfaction (see Table 7), this study can help marketers understand connections between brand experience attributes and customer loyalty, as well as assist businesses in creating effective strategies to address diminishing brand loyalty.
Several limitations of this study should be considered. First, the methodology of this research, like FAHP, assumes that brand experience attributes are not dependent on each other. Second, the statistical sample is limited to southern Taiwan, and future research can be extended to central and northern Taiwan. Third, branded app-based brand experience in this study is only limited to the retail industry. In future studies, the scope of research may be expanded to include other industries (e.g., department stores, fashion, and automobiles).

6. Conclusions

6.1. Academic Implications

Based on the holistic brand experience theory, this research put forward the attributes of branded app-related brand experience, combined loyalty and satisfaction influence evaluation, and created a research model with academic value. In addition, this research also optimized the methodology, based on fuzzy set theory, and used the symmetry matrix of CFLPR, in lieu of FAHP, to effectively reduce the number of comparisons and shorten the time to complete the questionnaire, thereby more accurately relating customers’ brand experience preference and the influence degree of related brand experience to loyalty and satisfaction.

6.2. Managerial Implications

This study can assist enterprises in understanding the differences in branded app experience preferences between consumer groups, gaining insights into the performance of their branded apps, promoting value co-creation between enterprises and customers in an era where service-dominant logic prevails, and flexibly adjusting their marketing campaigns and strategies. In particular, this study put forward the results of brand experience attributes to loyalty and satisfaction (see Table 7) and determined the key factors to improve loyalty. The results can assist companies in improving customer relationship management performance and addressing the issue of diminishing brand loyalty, thus contributing to the field of marketing science.

6.3. Suggestions

This study found that, to enhance customer loyalty, “brand attachment” must be strengthened, which conforms to the research findings of Pedeliento et al. [42] and Japutra et al. [43]. Kaufmann et al. [44] reported that hedonic elements have a positive impact on brand attachment and recommended that businesses integrate hedonic features, such as interactive games and prize quizzes, into their branded apps. They posited that this could strengthen brand attachment, encourage customers’ active participation for bolstered customer loyalty, and make customers willing to build a lasting and diverse relationship with the brand [45,46]. Furthermore, it is also advisable that enterprises apply the analytical model used in this study every 6–12 months to understand the changes in customers’ brand experience and monitor the performance of their branded apps. Doing so will help them adjust brand management strategies, reallocate resources, and maintain their competitive edge. It is also recommended that the concept of fuzzy quality function development be employed to build analytical models. Researchers may also further develop FMCDM tools for augmented brand experience enhancement strategies and integrate them with the brand experience attributes model in this study to build an associate matrix. From there, researchers can explore the connection between attributes and strategies and work out management strategies for branded app-generated brand experience tailored to the needs of the retail industry.

Author Contributions

Conceptualization, T.-H.H.; data curation, C.-H.C.; formal analysis, Y.-W.Y.; funding acquisition, T.-H.H. and C.-H.C.; investigation, Y.-W.Y.; methodology, T.-H.H.; project administration, T.-H.H.; software, Y.-W.Y.; validation, C.-H.C.; writing—original draft, C.-H.C. and Y.-W.Y.; writing—review and editing, T.-H.H. and C.-H.C. All authors have read and agreed to the published version of the manuscript.

Funding

This research was supported by the Ministry of Science and Technology, Taiwan, R.O.C. (MOST 107-2410-H- 992-015-MY2).

Institutional Review Board Statement

Not applicable.

Informed Consent Statement

Not applicable.

Data Availability Statement

Not applicable.

Acknowledgments

The authors appreciate the support from the National Kaohsiung University of Science and Technology, Taiwan and the Ministry of Sciences and Technology, Taiwan.

Conflicts of Interest

The authors declare no conflict of interest.

References

  1. Kim, S.J.; Wang, R.J.-H.; Malthouse, E.C. The Effects of Adopting and Using a Brand’s Mobile Application on Customers’ Subsequent Purchase Behavior. J. Interact. Mark. 2015, 31, 28–41. [Google Scholar] [CrossRef]
  2. Kang, J.W.; Namkung, Y. The role of personalization on continuance intention in food service mobile apps A privacy calculus perspective. Int. J. Contemp. Hosp. Manag. 2019, 31, 734–752. [Google Scholar] [CrossRef]
  3. Stocchi, L.; Guerini, C.; Michaelidou, N. When are Apps Worth Paying for? How Marketers can Analyze the Market Performance of Mobile Apps. J. Advert. Res. 2017, 57, 260–271. [Google Scholar] [CrossRef] [Green Version]
  4. Gill, M.; Sridhar, S.; Grewal, R. Return on Engagement Initiatives: A Study of a Business-to-Business Mobile App. J. Mark. 2017, 81, 45–66. [Google Scholar] [CrossRef]
  5. Kim, J.; Yu, E.A. The holistic brand experience of branded mobile applications affects brand loyalty. Soc. Behav. Pers. 2016, 44, 77–88. [Google Scholar] [CrossRef]
  6. Alnawas, L.; Aburub, F. The effect of benefits generated from interacting with branded mobile apps on consumer satisfaction and purchase intentions. J. Retail. Consum. Serv. 2016, 31, 313–322. [Google Scholar] [CrossRef]
  7. Peng, K.F.; Chen, Y.; Wen, K.W. Brand relationship, consumption values and branded app adoption. Ind. Manag. Data Syst. 2014, 114, 1131–1143. [Google Scholar] [CrossRef]
  8. Herrera-Viedma, E.; Herrera, F.; Chiclana, F.; Luque, M. Some issues on consistency of fuzzy preference relations. Eur. J. Oper. Res. 2004, 154, 98–109. [Google Scholar] [CrossRef]
  9. Bottani, E.; Rizzi, A. Strategic Management of Logistics Service: A Fuzzy QFD Approach. Int. J. Prod. Econ. 2006, 103, 585–599. [Google Scholar] [CrossRef]
  10. Dinçer, H.; Yüksel, S.; Martínez, L. Interval type 2-based hybrid fuzzy evaluation of financial services in E7 economies with DEMATEL-ANP and MOORA methods. Appl. Soft Comput. 2019, 79, 186–202. [Google Scholar] [CrossRef]
  11. Filketu, S.; Dvivedi, A.; Abebe, B.B. Decision-making on job satisfaction improvement programs using fuzzy QFD model: A case study in Ethiopia. Total. Qual. Manag. Bus. Excell. 2019, 30, 1068–1091. [Google Scholar] [CrossRef]
  12. Hsu, T.H.; Lin, L.Z. QFD with Fuzzy and Entropy Weight for Evaluating Retail Customer Values. Total. Qual. Manag. Bus. Excell. 2006, 17, 935–958. [Google Scholar] [CrossRef]
  13. Tang, J.W.; Hsu, T.H. Utilizing the Hierarchy Structural Fuzzy Analytical Network Process Model to Evaluate Critical Elements of Marketing Strategic Alliance Development in Mobile Telecommunication Industry. Group Decis. Negot. 2018, 27, 251–284. [Google Scholar] [CrossRef]
  14. Tzeng, G.H.; Shen, K.Y. New Concepts and Trends of Hybrid Multiple Criteria Decision Making; CRC Press: Boca Raton, FL, USA, 2017. [Google Scholar]
  15. Khan, I.; Rahman, Z. Retail brand experience: Scale development and validation. J. Prod. Brand. Manag. 2016, 25, 435–451. [Google Scholar] [CrossRef]
  16. Newman, C.L.; Wachter, K.; White, A. Bricks or clicks Understanding consumer usage of retail mobile apps. J. Serv. Mark. 2017, 32, 211–222. [Google Scholar] [CrossRef]
  17. Bellman, S.; Potter, R.F.; Treleaven-Hassard, S.; Robinson, J.A.; Varan, D. The effectiveness of branded mobile phone Apps. J. Interact. Mark. 2011, 25, 191–200. [Google Scholar] [CrossRef]
  18. Cao, L.; Liu, X.; Cao, W. The Effects of Search-Related and Purchase-Related Mobile App Additions on Retailers’ Shareholder Wealth: The Roles of Firm Size, Product Category, and Customer Segment. J. Retail. 2018, 94, 343–351. [Google Scholar] [CrossRef]
  19. Stocchi, L.; Michaelidou, N.; Micevski, M. Drivers and outcomes of branded mobile app usage intention. J. Prod. Brand. Manag. 2019, 28, 28–49. [Google Scholar] [CrossRef] [Green Version]
  20. Sahin, A.; Zehir, C.; Kitapçı, H. The effects of brand experiences, trust and satisfaction on building brand loyalty; an empirical research on global brands. Procedia Soc. Behav. Sci. 2011, 24, 1288–1301. [Google Scholar] [CrossRef] [Green Version]
  21. Lee, H.J.; Kang, M.S. The effect of brand experience on brand relationship quality. Acad. Mark. Stud. J. 2012, 16, 87–98. [Google Scholar]
  22. Ambler, T.; Bhattacharya, C.B.; Edell, J.; Keller, K.L.; Lemon, K.N.; Mittal, V. Relating brand and customer perspectives on marketing management. J. Serv. Res. 2002, 5, 13–25. [Google Scholar] [CrossRef] [Green Version]
  23. Nadzri, W.N.M.; Musa, R.; Muda, M.; Hassan, F. The Antecedents of Brand Experience within the National Automotive Industry. J. Econ. Financ. 2016, 37, 317–323. [Google Scholar] [CrossRef] [Green Version]
  24. Brakus, J.J.; Schmitt, B.H.; Zarantonello, L. Brand experience: What is it? How is it measured? Does it affect loyalty? J. Market. 2009, 73, 52–68. [Google Scholar] [CrossRef]
  25. Nysveen, H.; Pedersen, P.E.; Skard, S. Brand experiences in service organizations: Exploring the individual effects of brand experience dimensions. J. Brand. Manag. 2013, 20, 404–423. [Google Scholar] [CrossRef]
  26. Nyheim, P.; Xu, S.; Zhang, L.; Mattila, A.S. Predictors of avoidance towards personalization of restaurant smartphone advertising: A study from the millennials’ perspective. J. Hosp. Tour. Technol. 2015, 6, 145–159. [Google Scholar] [CrossRef]
  27. Huang, C.C. The impacts of brand experiences on brand loyalty: Mediators of brand love and trust. Manag. Decis. 2017, 55, 915–934. [Google Scholar] [CrossRef]
  28. Van der Westhuizen, L.M. Brand loyalty: Exploring self-brand connection and brand experience. J. Prod. Brand. Manag. 2018, 27, 172–184. [Google Scholar] [CrossRef] [Green Version]
  29. Paksoy, T.; Pehlivan, N.Y.; Kahraman, C. Organizational strategy development in distribution channel management using fuzzy AHP and hierarchical fuzzy TOPSIS. Expert Syst. Appl. 2011, 39, 2822–2841. [Google Scholar] [CrossRef]
  30. Hu, S.K.; Lu, M.T.; Tzeng, G.H. Improving mobile commerce adoption using a new hybrid fuzzy MADM model. Int. J. Fuzzy Syst. 2015, 17, 399–413. [Google Scholar] [CrossRef]
  31. Wang, C.N.; Nguyen, N.A.T.; Dang, T.T.; Lu, C.M. A Compromised Decision-Making Approach to Third-Party Logistics Selection in Sustainable Supply Chain Using Fuzzy AHP and Fuzzy VIKOR Methods. Mathematics 2021, 9, 886. [Google Scholar]
  32. Lin, L.Z.; Hsu, T.H. Designing a model of FANP in brand image decision-making. Appl. Soft Comput. 2011, 11, 561–573. [Google Scholar] [CrossRef]
  33. Xu, Z.; Chen, J. Some Models for Deriving the Priority Weights from Interval Fuzzy Preference Relations. Eur. J. Oper. Res. 2008, 184, 266–280. [Google Scholar] [CrossRef]
  34. Wang, T.C.; Chen, Y.H. Applying Fuzzy Linguistic Preference Relations to the Improvement of Consistency of Fuzzy AHP. Inf. Sci. 2008, 178, 3755–3765. [Google Scholar] [CrossRef]
  35. Pandey, A.; Kumar, A. A note on “applying fuzzy linguistic Preference relations to the improvement of consistency of fuzzy AHP”. Inf. Sci. 2016, 346–347, 1–5. [Google Scholar] [CrossRef]
  36. Wang, Z.J. Comments on “A note on “Applying fuzzy linguistic preference relations to the improvement of consistency of fuzzy AHP””. Inf. Sci. 2016, 372, 539–545. [Google Scholar] [CrossRef]
  37. Tang, J.W.; Hsu, T.H. A fuzzy preference relations model for evaluating key supplier relationships in TFT-LCD TV panel manufacturing industry. Manag. Decis. 2015, 53, 1858–1882. [Google Scholar] [CrossRef]
  38. Van Laarhoven, P.J.M.; Pedrycz, W. A fuzzy extension of Saaty’s priority theory. Fuzzy Sets Syst. 1983, 11, 199–227. [Google Scholar] [CrossRef]
  39. Büyüközkan, G. Determining the mobile commerce user requirements using an analytic Approach. Comput. Stand. Interfaces 2009, 31, 144–152. [Google Scholar] [CrossRef]
  40. Wang, T.C.; Chen, Y.H. Applying Consistent Fuzzy Preference Relations to Partnership Selection. Omega 2007, 35, 384–388. [Google Scholar] [CrossRef]
  41. Coursaris, C.K.; Sung, J. Antecedents and consequents of a mobile website’s interactivity. New Media Soc. 2012, 14, 1128–1146. [Google Scholar] [CrossRef]
  42. Pedeliento, G.; Andreini, D.; Bergamaschi, M.; Jarl, S. Brand and product attachment in an industrial context: The effects on brand loyalty. Ind. Mark. Manag. 2016, 53, 194–206. [Google Scholar] [CrossRef]
  43. Japutra, A.; Ekinci, Y.; Simkin, L. Positive and negative behaviors resulting from brand attachment: The moderating effects of attachment styles. Eur. J. Mark. 2018, 52, 1185–1202. [Google Scholar] [CrossRef] [Green Version]
  44. Kaufmann, H.R.; Petrovici, D.A.; Filho, C.G.; Ayres, A. Identifying moderators of brand attachment for driving customer purchase intention of original vs counterfeits of luxury brands. J. Bus. Res. 2016, 69, 5735–5747. [Google Scholar] [CrossRef]
  45. Park, C.W.; Maclnnis, D.J. The Ties That Bind: Measuring the Strength of Consumers’ Emotional Attachments to Brands. J. Consum. Psychol. 2005, 15, 77–91. [Google Scholar]
  46. Park, C.W.; Maclnnis, D.J.; Priester, J.; Eisingerich, A.B.; Lacobucci, D. Brand Attachment and Brand Attitude Strength: Conceptual and Empirical Differentiation of Two Critical Brand Equity Drivers. J. Market. 2010, 74, 1–17. [Google Scholar] [CrossRef] [Green Version]
Figure 1. Hierarchical architecture diagram of this research.
Symmetry 13 01151 g001
Figure 2. Triangular fuzzy number membership functions.
Symmetry 13 01151 g002
Figure 3. Membership functions of fuzzy linguistic scale.
Symmetry 13 01151 g003
Figure 4. Branded app brand experience facet weights (Di).
Symmetry 13 01151 g004
Figure 5. (a) 7-ELEVEn branded app brand experience facet triangular fuzzy number. (b) FamilyMart branded app brand experience facet triangular fuzzy number.
Symmetry 13 01151 g005
Figure 6. Branded app brand experience attribute weights (Dij).
Symmetry 13 01151 g006
Table 1. Brand experience facets of branded apps.
FacetDefinitionReference
AffectiveInner feelings toward a brand; views and attitude towards an event; subjective emotional experience[24]
CognitiveProcess of using concepts, perceptions, judgment, and imagination to acquire brand-related knowledge[24]
BehavioralBehavioral response prompted by a brand that invigorates customers or makes them display a specific behavioral pattern[24]
RelationalFormation of a certain relationship or connection with a brand[25]
Table 2. Brand experience attributes of branded apps.
FacetAttributeAttribute DescriptionReference
AffectiveEmotionsUsing this app makes me feel happy, excited, pleasant, etc.[24]
FeelingsThe app builds an emotional bond between me and the brand.[24]
Motivation to participateThe app often makes me want to participate in buying, information-collecting, and credit-accumulating activities.[25]
CognitiveKnowledgeThe app makes me want to know more about the brand.[24]
CuriosityThis app arouses my curiosity.[24]
Finding informationThe app prompts me to actively search for information regarding promotions and new products.[24]
BehavioralFunctional experienceI want to use the functions (e.g., mobile shopping and information on new products) of the app again.[24]
Passive participationWhen receiving coupons or updated information on products through the app, I will spend on the brand.[25]
Active participationI actively participate in in-app events (e.g., limited-time offers).[24]
RelationalBrand personalityThe app displays a brand personality that is compatible with mine.[26]
Brand attachmentI believe that using this app will lead me to develop a strong affection and psychological attachment toward the brand.[7]
Self-identificationWhen using the app, I identify myself as a member of the brand community.[25]
Table 3. Fuzzy linguistic scale.
Linguistic VariableTriangular
Fuzzy Number
Code
Demonstrated importance (DI)(2,5/2,3) 9 ˜
Very strong importance (VSI)(3/2,2,5/2) 7 ˜
Strong importance (SI)(1,3/2,2) 5 ˜
Moderate importance (MI)(1/2,1,3/2) 3 ˜
Equal importance (EI)(1,1,1) 1 ˜
Moderate unimportance (MUI)(2/3,1,2) 3 ˜ 1
Strong unimportance (SUI)(1/2,2/3,1) 5 ˜ 1
Very strong unimportance (VSUI)(2/5,1/2,2/3) 7 ˜ 1
Demonstrated unimportance (DUI)(1/3,2/5,1/2) 9 ˜ 1
Table 4. Influence degree evaluation form (L relative to S).
E 1 E m
S S
F 1 L 1 b L S 1 1 b L S m
F n L n b L S 1 n b L S m
Table 5. Influence degree evaluation form (S relative to L).
E 1 E m
L L
F 1 S 1 b L S 1 1 b L S m
F n S n b L S 1 n b L S m
Table 6. Performance of branded app brand experience.
Attribute7-ELEVEnFamilyMart
uipiuipi
Emotions (A1)1.2790.3431.1060.385
Feelings (A2)1.3580.3481.1080.402
Motivation to participate (A3)1.2160.4500.9890.563
Knowledge (C1)1.3690.3741.0910.492
Curiosity (C2)1.3260.3751.0940.437
Finding information (C3)1.1420.5181.0580.568
Functional experience (B1)1.1950.4951.0100.648
Passive participation (B2)1.1450.4961.0540.546
Active participation (B3)1.2200.4381.1140.523
Brand personality (R1)1.1140.4471.1070.499
Brand attachment (R2)1.1660.4281.1230.476
Self-identification (R3)1.1820.4471.0810.429
Sum pi 5.159 5.968
Table 7. Influence degree for loyalty and satisfaction.
Attribute7-ELEVEnFamilyMart
LSLS
Emotions (A1)0.4820.5180.4760.524
Feelings (A2)0.4860.5140.4910.509
Motivation to participate (A3)0.4910.5090.4900.510
Knowledge (C1)0.4830.5170.4860.514
Curiosity (C2)0.4850.5150.4800.520
Finding information (C3)0.4910.5090.4880.512
Functional experience (B1)0.4780.5220.4860.514
Passive participation (B2)0.4810.5190.4880.512
Active participation(B3)0.5100.4900.4980.501
Brand personality (R1)0.5170.4830.4890.511
Brand attachment (R2)0.5170.4830.4990.502
Self-identification (R3)0.5030.4970.4950.505
Influence degree value Z u :0.4940.5060.4890.511
Note: L represents loyalty and S represents satisfaction.
Publisher’s Note: MDPI stays neutral with regard to jurisdictional claims in published maps and institutional affiliations.

