Article

Safety Warning Model of Coal Face Based on FCM Fuzzy Clustering and GA-BP Neural Network

School of Economics and Management, University of Science & Technology Beijing, Beijing 100083, China
Symmetry 2021, 13(6), 1082; https://doi.org/10.3390/sym13061082
Submission received: 14 May 2021 / Revised: 10 June 2021 / Accepted: 14 June 2021 / Published: 17 June 2021

Abstract

:
Risk and security are two symmetric descriptions of the uncertainty of the same system. If the risk early warning is carried out in time, the security capability of the system can be improved. A safety early warning model based on fuzzy c-means clustering (FCM) and back-propagation neural network was established, and a genetic algorithm was introduced to optimize the connection weight and other properties of the neural network, so as to construct the safety early warning system of coal mining face. The system was applied in a coal face in Shandong, China, with 46 groups of data as samples. Firstly, the original data were clustered by FCM, the input space was fuzzy divided, and the samples were clustered into three categories. Then, the clustered data was used as the input of the neural network for training and prediction. The back-propagation neural network and genetic algorithm optimization neural network were trained and verified many times. The results show that the early warning model can realize the prediction and early warning of the safety condition of the working face, and the performance of the neural network model optimized by genetic algorithm is better than the traditional back-propagation artificial neural network model, with higher prediction accuracy and convergence speed. The established early warning model and method can provide reference and basis for the prediction, early warning and risk management of coal mine production safety, so as to discover the hidden danger of working face accident as soon as possible, eliminate the hidden danger in time and reduce the accident probability to the maximum extent.

1. Introduction

In recent years, although the safety situation of coal mines in China has improved, serious accidents still occur from time to time. China’s coal mine mortality per million tons is now about 0.156, down from previous years, whereas the mortality per million tons in Australia, the United States and other coal-producing developed countries ranges from 0.03 to 0.04. Obviously, there is still a huge gap between them [1,2].
Coal mining has narrow and changeable working face space with much equipment, loud noise, concentrated personnel and a complex environment. Additionally, there are many uncertain risk factors, and mine accidents occur frequently. According to the statistics of The State Bureau of Safe Production Supervision and Administration of China, 45% of all coal mine accidents were attributed to coal mining faces or accidents induced by them [3].
Safety early warning system is an important means to prevent and control the occurrence of hidden dangers of coal mine accidents, which has been paid close attention by scholars. From the late 1990s, some scholars started researching coal mine safety warnings. According to Lei’s research, accidents from hidden dangers were derived from hazardous and harmful factors, while inherent hazardous and harmful factors were the essential attributes of hazard sources [4]. Safety early warning was to collect data of all kinds of accident hidden dangers, evaluate, analyze and monitor safety production activities, and issue different early warning signals at different stages [5]. In the process of coal mining, if the hidden dangers are eliminated, the hazard sources can be controlled, and the occurrence of accidents can be avoided or reduced. The coal mine safety early warning is mainly carried out by hidden trouble control, major hazard identification and safety evaluation, safety monitoring index early warning, and so on. From the perspective of coal mine hidden danger management, some scholars have carried out research on hidden danger classification and investigation management, such as Tan Zhang-lu Tan Zhanglu et al. who designed a closed-loop management system for safety early warning and inspection in two links of risk source management and hidden danger management [6], and Wang applied an LEC method to study hidden security classification of closed loop management [7]. Most of these studies regarded the hidden danger data as static data and take the historical hidden danger data as the research basis. It could provide some reference for the investigation of hidden danger, but it didn’t conform to the characteristics of the dynamic change of hidden danger [8], and it was difficult to provide real-time warning information or change trend of hidden danger. The research on major hazard sources focused on the analysis and identification of hazard sources and the construction of risk assessment models. For example, Chen et al. established a risk assessment model, which took geographical environment, technical equipment, personal quality, safety training and management as variables [9]. Luo et al. carried out quantitative risk assessment on gas explosion risk [10]. Zhang and Sui et al. proposed measures to prevent and control coal mine water hazard sources [11,12]. These studies established one kind of mine disaster, such as gas or a flood risk assessment model, can be one kind of prevention and control of hazards occur, but accident factors caused by coal mining area are very complicated, and can include several categories of hazards, and also people’s unsafe behavior and unsafe state related factors [13]. In order to comprehensively identify the hazard source and objectively evaluate the mine safety situation, attention should be paid to the human, machine, environment and pipe, etc. aspects. As for the research on the early warning of safety monitoring indicators, the early warning model was mainly established based on the safety monitoring indicators of gas or other harmful gases concentration, hydrological parameters and roof pressure. For example, Li established the Elman neural network risk identification and early warning model of gas explosion disaster [14], Wu et al. established a mathematical evaluation system of floor water inrush risk based on variable weight model and unascertained measure theory [15], Dou et al. established a multi-information normalized early-warning mechanical model of coal-rock impact damage [16], and Zheng, Qiao and Man established a remote monitoring and early-warning technology of mine hoist [17]. These research warning indicators were relatively single, and have their own limitations [18] in terms of application scope, evaluation accuracy, and objectivity of evaluation, etc., and the failure to effectively analyze nonlinear systems [17] would lead to large warning errors. Through integration technology, several algorithms were fused together to establish an early warning model, which could play a role of promoting strengths and circumventing weaknesses [18]. Therefore, some scholars have carried out research on the comprehensive early warning model of various indicators and established the integrated muti-algorithm early warning model. This includes the application of artificial neural network, fuzzy comprehensive evaluation method, expert system, rough set, support vector machine (SVM), data mining and other algorithms. Meng and Zhao comprehensively adopted an FCM fuzzy clustering algorithm, rough set and RBF neural network to establish data mining and data fusion to construct a coal mine safety early warning system [19]. Xin and Sun, Wen, Wang and Cai, Wang et al., Chen et al., Liu et al. respectively, established different safety warning models by applying principal component analysis, neural network algorithm, extension theory and a support vector machine algorithm [20,21,22,23,24]. Zhang, Jiang and Guo, Jia and Wei established a coal mine safety early warning system by using association rule data mining [25,26]. These studies not only give full play to the intelligent advantages of computers, but also avoid the one-sidedness of data indicators, increasing the rationality of the index system [5,26]. However, some comprehensive warning model algorithms were too complex to be operated easily in practical application. The principles of simplicity, applicability and strong operability need to be fully considered, and appropriate methods and models should be selected through comparison according to the target achieved by the research object, actual conditions and the environment [27].
As an important subsystem of coal mine production, the coal mining production system can also adopt the ideas and methods applicable to coal mine safety early warning model, including safety monitoring and early warning of single hazard source index and intelligent safety early warning. Early warning of the working face safety monitoring system with single hazard source index was based on the monitoring data of roof pressure, hydrogeology, coal seam spontaneous combustion, gas, etc. For example, Fan, Mao and Qi realized early warning of roof disaster [28]. Liu et al. studied the early warning index of monitoring coal seam floor [29]. In addition, Shi et al. established an evaluation method for the threat degree of spontaneous combustion of the working face under the condition of coal seam group mining in close distance, so as to realize the advance warning of the threat of spontaneous combustion fire faced by the working face in close distance coal seam group mining [30]. Due to the fuzziness, randomness, suddenness, non-linearity and dynamic characteristics of the coal face safety system [31], it is difficult to guarantee the accuracy of the early warning system established solely by the safety monitoring system. Therefore, some scholars have carried out intelligent safety early warning represented by artificial neural networks in recent years. For example, Lu and Kang studied the principal component analysis combined with back-propagation neural network (BP) prediction model for the prediction of gas emission in mining face, Hao and Zhang studied the prediction and early warning method of coal and gas outburst with Hadoop platform, and established the BP neural network model to extract gas characteristic parameters early warning model [32,33]. Zhao and Ma established the BP neural network prediction model of particle swarm optimization for the prediction of dust concentration in fully mechanized mining face [34]. These intelligent safety early warning systems based on BP neural network solve the problems of non-linearity and fuzziness of danger source and accident hidden danger of coal working face, but the single index of major danger source of coal working face is taken as the research object, and all kinds of danger source and accident hidden danger indexes of coal working face are not considered comprehensively. As a production system, the safety state of a coal mine is affected by personnel, equipment, environment, management, information and other factors. If one factor appears unsafe, it may affect the safety of other factors and cause accidents [31]. Therefore, it is not possible to fully reflect the safety situation of coal face by studying only a single hazard source or ignoring the interaction between the hazard sources.
Therefore, it is necessary to design a set of intelligent model of coal face safety early warning, which covers all the warning indicators of human, machine, environment and management, so as to improve the ability of coal face risk pre-control and eliminate hidden dangers, reduce or avoid the occurrence of accidents, and reduce the death rate of coal mine accidents. Through literature review, the warning index is the basis of safety evaluation, construction of early warning model, the selection and design in the model, model quality affects the effect of application, a model can realize the original function, which is to think it is a good model, good model with simplicity, accuracy and explain the universality and operability of the three necessary conditions for [
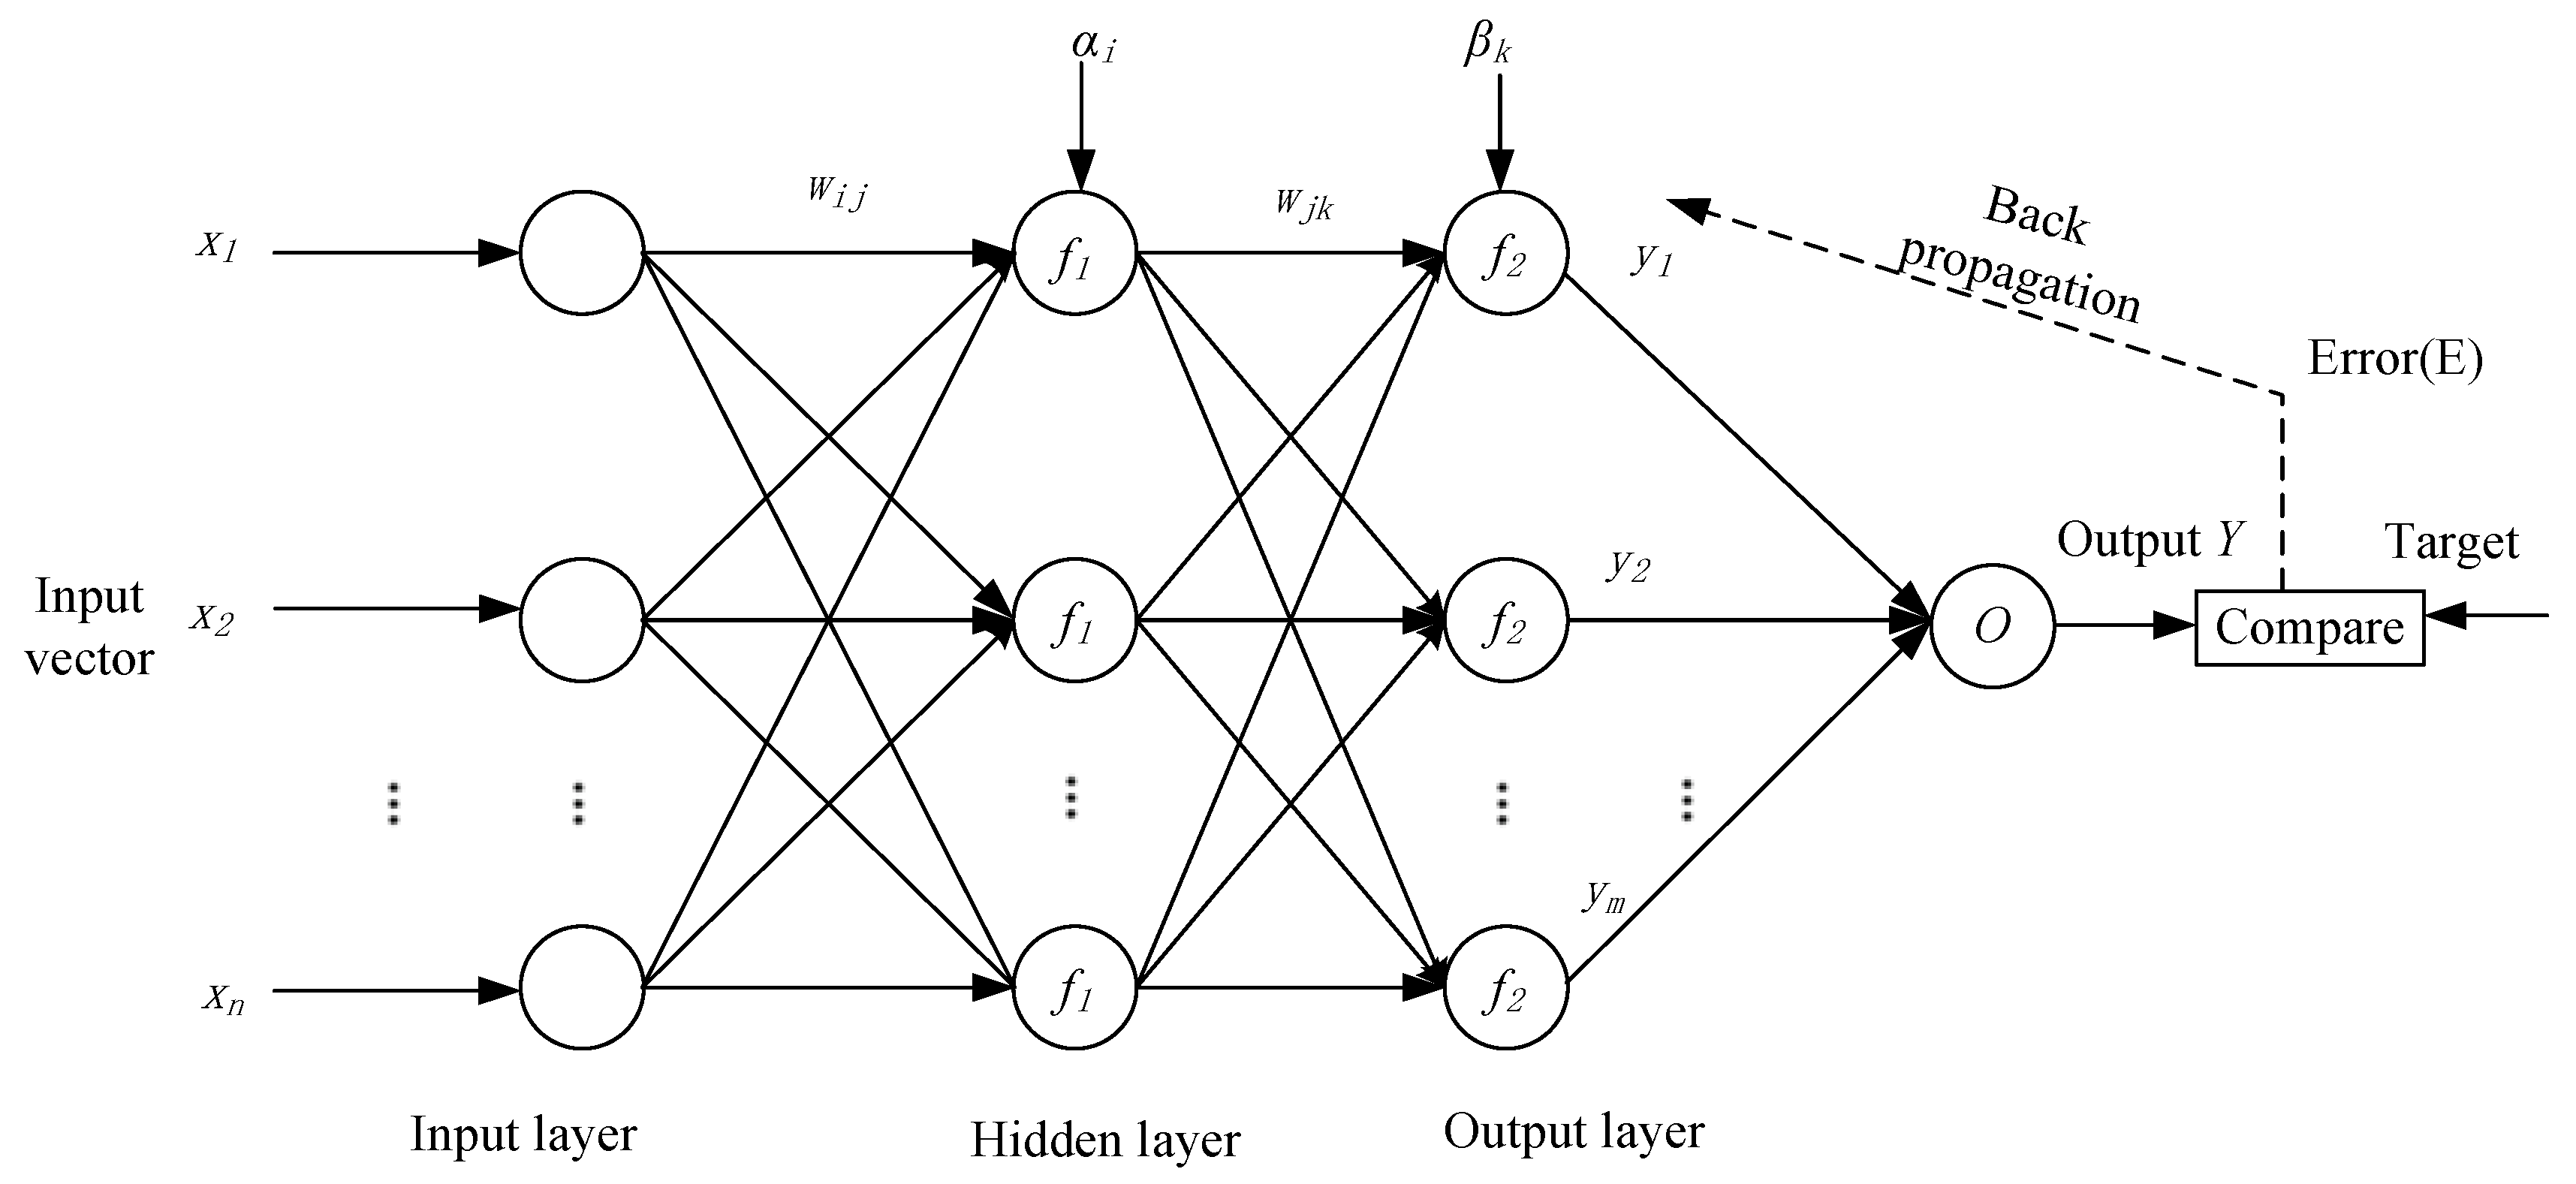
35]. Therefore, when designing the coal face safety warning model in this study, the applicability of the theories and methods used should be considered first, and the practicability of the warning model should be paid attention to, rather than blindly pursuing novel or complex theoretical algorithms. The hidden dangers such as roof pressure, flood, fire, gas and dust of coal face are dynamic, uncertain and nonlinear, which are difficult to describe by an accurate mathematical early warning model. The BP neural network is one of the widely used neural network models. As for the complex enterprise operation system, it solves the defects of the traditional model, such as the difficulty to deal with highly nonlinear model, poor fault tolerance, lack of time variability in the early warning line and early warning area, and lack of self-learning ability, and shows a good prediction effect [36].
BP neural network can arbitrarily approach a highly nonlinear function and has the ability of self-organization and self-learning. Moreover, BP neural network has strong nonlinear fault tolerance and allows strong noise in data, so it has great advantages in prediction and early warning [37]. However, when BP neural network is trained by gradient descent method, it may produce local minimum problem, and there is also the sensitivity problem of the initial weight of the network, that is, any slight change in the initial weight will affect the convergence speed and precision of the network, and even the network vibration [38,39,40]. A genetic algorithm (GA) has strong global search ability, which can quickly and effectively find the global optimal solution in the complex, multi-peak and non-differentiable large vector space, and has the characteristics of efficient, parallel and global search [41]. A genetic algorithm is used to overcome the above defects of BP neural network.
Based on the comprehensive analysis of the production practice and the characteristics of safety hidden dangers of coal working face, this paper establishes a full warning index system based on personnel behavior, equipment, environment, management and other factors, and integrates the advantages of genetic algorithm and BP neural network to construct a safety early warning model of coal working face.
Fuzzy C-means (FCM) is an algorithm that uses membership degree to determine that each data point belongs to a certain degree of clustering [41]. It converges the target clustering function through multiple iterations. With a FCM algorithm to cluster the input data, the network structure and initial parameter values can be determined to ensure uniform distribution of membership functions, so as to improve the convergence speed of the neural network. Therefore, FCM algorithm was introduced to process the hidden danger data of working face in fuzzy discretization and optimize the sample data space, so as to improve the operation efficiency and precision of the neural model.
The structure of the paper is roughly as follows: First, the characteristics of safe production of coal mining face are studied to develop a comprehensive early-warning index system composed of personnel behavior factors, environmental factors and management factors; Second, FCM fuzzy clustering is applied to fuzzy discretization of hidden danger data of the working face, and sample data state space is optimized to build an early warning model of coal mining face based on genetic algorithm and BP neural network; Finally, the effectiveness of the early warning model is verified by taking the concrete coal mining face as an example.

2. Research on Early Warning Index and Model of Coal Mining Working Face

2.1. Early Warning Indexes

There are many risk factors that affect the safety of coal mining face and selecting the early warning index system is the premise of establishing the early warning model.
From the perspective of three kinds of hazard sources, it can reflect the factors and root causes of the existence of danger comprehensively. The first type of hazard source is energy and material, e.g., gas content, gas concentration, roof pressure, mine water inflow, etc. The second category of hazard sources are physical faults, physical environmental factors, etc., which primarily refers to the energy suppression measures for the first category of dangerous substances, e.g., roof support, gas drainage, equipment protection and other faults, as well as personnel operational errors. The third category of hazard primarily refers to organizational factors of safety management, formulation and implementation of safety management system, safety education training, safety input, miners’ educational level, age structure, etc. [40]. The early warning indicators can be summarized in four factors: personnel, equipment, environment, management, and each factor contains the corresponding index. Besides, according to Coal Mine Safety Regulations issued by the State Administration of Work Safety, the early warning indicators were established, as listed in Table 1.

2.2. FCM Clustering Algorithm

FCM (Fuzzy c-means) algorithm (Algorithm 1) is a multivariate technology, which adopts a fuzzy mathematical method to classify objective things according to certain similarity between objective things and build fuzzy similarity relations [42,43,44].
Set X = {x1, x2, …, xn} as a sample of N observation in Rn, and Rn is n-dimensional Euclidean space. If i is any integer, 1 i n , supposed sample Xi = {xi1, xi2, …, xiq}, Xi∈Rn, xij is the j-th feature of Xi.
Fuzzy clustering of data set X is to divide X into c homogeneous categories, and make Uk (k = 1, 2, …, c) be the fuzzy set to represent each category. The FCM algorithms can be expressed by Equation (1).
U c = { U c × n G c n | μ i j [ 0 , 1 ] ; i = 1 c μ i j = 1 ; 0 j = 1 n μ i j n ; i = 1 c j = 1 n μ i j = n }
In Equation (1), Gc×n is a real c × n matrix, and µij is the membership degree of sample Xi to fuzzy set Ui.
The value function (or objective function) of FCM is the generalized least-squared errors functional
J ( U , c 1 , , c c ) = i = 1 c J i = i = 1 c j n u i j m d i j 2
In Equation (2), ci is the clustering center of fuzzy group I, uij is the degree of membership of xi in the cluster j, dij represents the Euclidean distance between the i-th cluster center and the j-th data point of the sample, and
d i j = c i x i j
μ i j = ( k = 1 c ( d i j d k j ) 2 m 1 ) 1
Here, c is the cluster number given by FCM algorithm. m is a weight exponent, indicating the degree of fuzziness of clustering results, 1 ≤ m ≤ ∞, which is a flexible parameter of a control algorithm. If m is too large or too small, the fuzzy clustering effect is poor [44]. It has been proved that when m is between 1.5 and 2.5, the algorithm works best, usually m = 2 [45].
The criterion of clustering algorithm is to make the objective function J (U, c1, …, cc) reached the minimum value [31]. Lagrange multiplier method is applied to construct a new objective function, to make J (U, c1, …, cc) to obtain a minimum.
The key to the fuzzy clustering algorithm lies in the given initial cluster category number c. After initializing the membership matrix U, the clustering center vector and membership matrix are updated repeatedly through Equations (1) and (2) to obtain J (U, c1, …, cc) minimum conditions.
Algorithm 1 FCM Algorithm
Initialization: given c, n, m; sets the iteration threshold for the cycle conditions, expressed in ε.
Step 1: computer clustering centers ci, i = 1, …, c;
Step 2: computer the new membership matrix U;
Step 3: computer the value function J(U, c1, … , cc). If J(U, c1, … , cc) < ε, or the change in the value of the twice applied value function is smaller than the change in the conditions ε, then stop, and output membership matrix U and clustering center c; otherwise return to perform the first step.

2.3. BP Neural Network Model

BP neural network has strong self-organization, self-learning ability and strong fault tolerance, so it is applicable to solve the safety warning problem of coal mining face, which is affected by bad environment and has non-linear, uncertain and dynamic safety hidden danger.

2.3.1. Principle of BP Neural Network

The basic structure of BP neural network includes input layer, hidden layer and output layer, as shown in Figure 1.
The BP algorithm is guided by teachers and based on a gradient descent method, which is suitable for a kind of learning of multi-layer neural network, and the learning process is divided into two stages [31]. In the forward propagation, the signal is input from the input layer, processed layer by layer through the hidden layer, then transmitted to the output layer. If the output value is the same as the expected value, the training is completed [46]. Otherwise, it turns to the error back-propagation stage. In this process, the error signal between the actual output and the expected output is calculated in reverse according to the original connection path. By modifying the weights of neurons in each layer, the error signal is transmitted to the input layer successively for calculation, and then goes through the forward propagation process again. After repeated application of these two processes, the learning process is end when the final output of the modified network is close to the expected value [47,48,49,50].
Set the network input layer as X = {x1, x2, … xj, … xn}, the hidden layer contains q neurons, and the output of the hidden layer is B = {b1, b2, … bj, … bq}, the output layer is Y = {y1, y2, … yk, … ym}; f1 is the hidden layer transfer function, f2 is the output layer transfer function; the hidden layer threshold is αj, the threshold of the output layer is βk; the weight from the input layer to the hidden layer is wij (1 ≤ in, 1 ≤ jq), and the weight from the hidden layer to the output layer is wjk (1 ≤ jq, 1 ≤ km).
When the signal is in the forward propagation, the output yk can be obtained, bj is the j-th neuron in the hidden layer, expressed as:
b j = f 1 ( i = 1 n w i j x i α j )   ( i = 1 ,   2 ,   ,   n ;   j = 1 ,   2 ,   ,   q )
y k = f 2 ( i = 1 n w j k f 1 ( i = 1 n w i j α i ) β k )
In the stage of error back-propagation, the total sample error is calculated first, and the weight and threshold of the output layer are subsequently adjusted to reduce the total sample error.
Assuming that there are p sample inputs, the actual output of each sample is yk, and the expected output is tk, the output error in the k-th input mode is expressed as:
E k = 1 2 j = 1 q ( y k t k ) 2
The total error of the p training samples is expressed as:
E = 1 2 k = 1 p E k = 1 2 k = 1 p j = 1 q ( y k t k ) 2
Following the above derivation process, the equivalent error is generated by backward propagation from the output layer to the input layer, and the network is repeatedly adjusted to converge to the target.
It is well known that each hidden neuron in the feed forward ANN draws a simple hypersurface in the input space. Each output neuron then combines them to distinguish regions, constructing a final region corresponding to the class. Therefore, the hiding layer provides global separation of the input space, which can be performed in a variety of ways due to fuzzy boundaries between related classes, hidden neuronal symmetry, etc.

2.3.2. Safety Warning BP Neural Network Model

The input layer nodes are directly connected with the input vector, and the input number equals to the index number of the early-warning index system of coal mining, i.e., the number of neurons in the first layer is the number of characteristic parameters, so there exist a total of 25 input nodes.
The output of the output layer is the safe state of the coal mining face. According to the general classification principle of coal mine, the safety state is divided into five levels of danger, relatively dangerous, general safety, relatively safe and safe. Accordingly, the output layer is a node, which is the safety state.
The number of neurons in the hidden layer significantly affects the convergence speed and prediction accuracy of the network. The number of cells in the hidden layer of the network can be calcualted by empirical formula, which is expressed as n 1 = n + m 2 + a , where n and m denote the input and output the number of neurons, respectively, and a is an integer between the interval [1,10]. Thus, the number of hidden layer nodes in the network is calculated as 14. The hidden layer node function selects Sigmoid function, and the initial weight takes random value of interval (−1, 1).
The neural network architecture is illustrated in Figure 2.

2.4. Genetic Algorithm Model

2.4.1. Genetic Algorithm

A genetic algorithm (GA) refers to an adaptive global optimization probability search algorithm that simulates the genetic and evolutionary processes of organisms in the natural environment [51]. Genetic algorithm includes five core elements, namely parameter coding, initial population setting, fitness function design, genetic manipulation and control parameter setting. The genetic operation includes selection operation, crossover operation and mutation operation. According to certain rules by parameter coding, the parameters of optimization problem are transferred to chromosome genes. The initial test group is the initial group data that represents the initial search point, which should have a certain scale and randomness. Fitness is calculated according to the value of chromosome gene, while the probability of chromosome crossing is determined by the value of fitness. If the probability of chromosome crossing is large, the genetic opportunity is large. After chromosome crossing, the mutation is performed, and the mutation operation changes the genetic value of an individual or some genetic values according to a certain small probability to avoid premature convergence of the algorithm. The population after mutation is the offspring, which, as the parent generation of the next generation, performs the same operation, and thus circulates until the optimal solution [52]. The individual with the highest fitness in the population is the optimal solution of the parameters to be optimized.

2.4.2. GA-BP Neural Network Model Design

The initial weight and threshold of BP neural network are optimized by genetic algorithm [53,54]. Here’s the approach: First, the global search performance of genetic algorithm is used to find the region where the optimal solution to the problem lies, and the initial weight and threshold of the neural network are optimized. Second, the optimal initial weight in the global scope is given to BP neural network. Third, by taking advantage of the strong local search ability of BP neural network, the initial weight of neural network is further optimized to find the optimal solution [55,56]. The main process includes to determine the connection structure of BP neural network, the weight and threshold of BP neural network, and to predict BP neural network [57,58,59,60].
The length of chromosome encoding of GA is determined by the number of parameters required by BP neural network. The error feedback value obtained from BP neural network training was used as the fitness value of the population individuals for optimization, and the corresponding connection and threshold values in the optimal individual values obtained by genetic algorithm were assigned to the corresponding neurons to achieve the actual neural network prediction [61].
In the genetic algorithm, the first is to solve the problem of the variable appropriate combination and coding. Its encoding can be in binary or decimal form. For multivariable problems, we usually arrange the variables in a certain way to form a multivariable coding string [49]. Symmetric coding theory will be used to improve the performance of genetic algorithm to solve such problems, improve the quality of solutions and solving speed.
As is known to all, prematurity often appears in the practical application of genetic algorithms, which limits the search performance of genetic algorithms. To overcome this problem, the performance of the genetic algorithm can be improved by improving the genetic algorithm operator or introducing special individuals. For example, the symmetric harmonic genetic algorithm is adopted, which selectively puts symmetrical harmonic individuals according to the change of each adaptive value in the genetic process, so as to maintain the diversity of the population.
The main operating steps are as follows:
(1) Population initialization
First, the number of layers of the network and the number of nodes in the input, output and hidden layers are determined. Each individual is a binary string composed of input layer and hidden layer connection weight, hidden layer and output layer connection weight, hidden layer threshold and output layer weight. Binary encoding is used for each weight and threshold, and the encoding of ownership value and threshold is connected as an individual encoding.
If the number of input nodes is n, the number of output nodes is m, and the number of hidden layer nodes is q, the chromosome length is expressed as:
l = ( n + 1 ) × q + ( q + 1 ) × m
By substituting n = 25, q = 14, and m = 1 into Equation (9), l = 379 is obtained, where n × q = 350 are the weights between the input neuron and the hidden layer neuron, m × q = 14 are the weights between the hidden layer neuron and the output layer neuron, the threshold of hidden layer neurons is 14, and the threshold of output neurons is 1.
(2) Fitness function
The performance index of BP network takes the sum of squares of errors as the output of the target function, the smaller the sum of squares of errors, the better it will be. However, in the genetic algorithm, the larger the fitness value, the better it will be. Thus, the reciprocal of the objective function is taken as the fitness function, which is expressed as:
F = 1 E
E is shown in Equation (8).
(3) Genetic operations
The selection operator selects individuals according to the fitness of the population. Individuals with high fitness are more likely to be selected and those with low fitness are more likely to be eliminated. After the selection of individuals in the probability of crossover operations, the generation of new sub-individuals into the population; Then the mutation operation is performed to generate new offspring populations [62,63].
The selection operator adopts the proportional selection method, and the probability of each individual being selected is proportional to its fitness value. The individual selection probability can be obtained from the following formula.
p k = F k k = 1 n F k
where Fk denotes the fitness of the k-th individual, and F k = 1 E k ; Ek is expressed in Equation (7).
Set the probability pc crossover operation on the selected individuals X A t and X B t , then the new individuals X A t + 1 and X B t + 1 generated after crossover operation.
The new individuals are inserted into the population and the evaluation function of the new individuals is calculated.
(1) Cycle operation process (2) and (3) until the error is reached, or the requirements of evolutionary algebra are met. Subsequently, the connection weight and threshold of BP neural network optimized by genetic algorithm are yielded.
(2) Taking the obtained initial value as the initial weight, BP neural network is applied to train the network. If the network output reaches the maximum number of training or meets the error requirements, the optimal solution is output, and the operation is completed. Otherwise, genetic manipulation will continue.

3. Application Cases

The coal mining face of a mine in China’s Shandong province was taken as a practical case study, the working face is briefly introduced as follows:
The working face was arranged along the 3-coal floor with a minable area of 35,224.05 m2, the coal strata were generally monoclinal structures inclined in the Northeast direction. The average fault drop is 0.5 m, and the working face was arranged along the bottom, and the fault would affect the mining of the working face. The sandstone aquifer of the coal roof is a direct water-filled aquifer, composed of siltstone, medium and coarse sandstone, and its water content is uneven and poor. The gas content and emission amount are very small, and the carbon dioxide emission amount is 2.20 m3/t/coal dust explosion index is 37.45%, which is explosive. The working face is located between the goaf area and the unexploited area. The upper roof is prone to collapse after upper stratification mining. Within 100 m above the coal seam, there is no hard-rock layer with a thickness of more than 10 m.

3.1. Data Preparation and Preprocessing

The sample data were selected from the monthly safety assessment report of the coal mining face of the mine, and 46 groups of data were collected in March, June, September, and December each year from 2007 to 2017 and from March and June 2018 (as shown in Table 2).
Taking characteristic data as input, FCM was used to preprocess the measured characteristic data to form new sample data. Subsequently, to compare the operation results of the two algorithms, BP neural network and GA-BP neural network were used for training and test operation, respectively.
MATLAB 7.0 software was used to implement the fuzzy neural network algorithm based on FCM.

3.2. FCM Clustering

3.2.1. Fuzzy Clustering Preprocessing of Characteristic Data

Deviation standardized characteristic data were used to eliminate the dimensional effect and the effect of the variable’s own variation size and numerical size, as shown below.
x k = x k min ( x k ) max ( x k ) min ( x k )
Here, xk is the raw data, x’k processed data, min(xk) is the minimum value of the vector, and max(xk) is the maximum value of the vector.
After deviation standardization, the observed values of various variables will be in the range of 0~1, and the standardized data are pure quantities without units.

3.2.2. FCM Classification

Set the fuzzy degree parameter m = 2, the maximum number of clustering cmax = 3, and the maximum number of iterations tmax = 100. According to the above FCM operation steps, the optimal class vector is obtained as listed in Table 3. Table 4 shows the FCM classification results, and Figure 3 shows the scatter distribution of data in the eigenvalues U11 (x-axis) and U12 (y-axis) after FCM clustering.

3.3. Model Validation

3.3.1. Training Sample Data, Test Samples and Network Output

Before neural network training, input samples and ideal output training samples were determined. According to the FCM classification results, 10 groups of data in September 2008, June 2009, September and December 2009, March 2010, June 2010, September and December 2011, March 2011 and June 2011 were selected as samples. The input and output data of training samples are listed in Table 5. December 2014, March 2015 and June 2015 were selected as the input and output data of the test sample, as listed in Table 6.
Training samples and test sample data have been normalized, and the normalized values are all in the interval [0,1]. Map minmax function in MATLAB function library is used for normalization.
Set the output warning level. The five warning levels of danger, relatively dangerous, general safety, relatively safe and safe represent codes 00001, 00010, 00100, 01000 and 10000, respectively. The expected output is given according to the historical safety risk assessment report of the mine.

3.3.2. Application of BP Neural Network Early Warning Model

As mentioned above, the BP neural network model has a structure of 25-14-1, and its setting parameters are listed in Table 7.
After training, testing and simulation of BP neural network, the performance curve of simulation and prediction data error is shown in Figure 4, and the simulation results of BP neural network prediction data are shown in Figure 5.

3.3.3. Application of GA-BP Neural Network Early Warning Model

Following the above steps, GA-BP neural network was developed. The number of neurons in the input layer was the number of safety management indicators. Here, the input layer was 25 neurons, the hidden danger layer was 14 neurons, the excitation function was Sigmoid type, the training function was TRAINLM, the learning rate was 0.3, and the momentum factor was 0.9.
The parameter settings of the genetic algorithm are listed in Table 8.
The error performance curve obtained through training is shown in Figure 6. The simulation results of GA-BP neural network prediction data are shown in Figure 7.
The early warning index data of coal mining face in March 2007 were input into the early warning model, and the early warning results were output as listed in Table 9.
In accordance with the principle of maximum membership, the corresponding safety level is 00001, and the production safety level of this mine was at a lower level in March 2012.

4. Result Discussion

The practical application results of a fully mechanized mining face in Shandong, China, show the feasibility of the early warning model. Combined with the output data and charts, the feasibility of artificial neural network early warning model, the effectiveness of BP neural network optimized by genetic algorithm, and the rationality of FCM clustering algorithm are further discussed.

4.1. Feasibility of the Warning Model

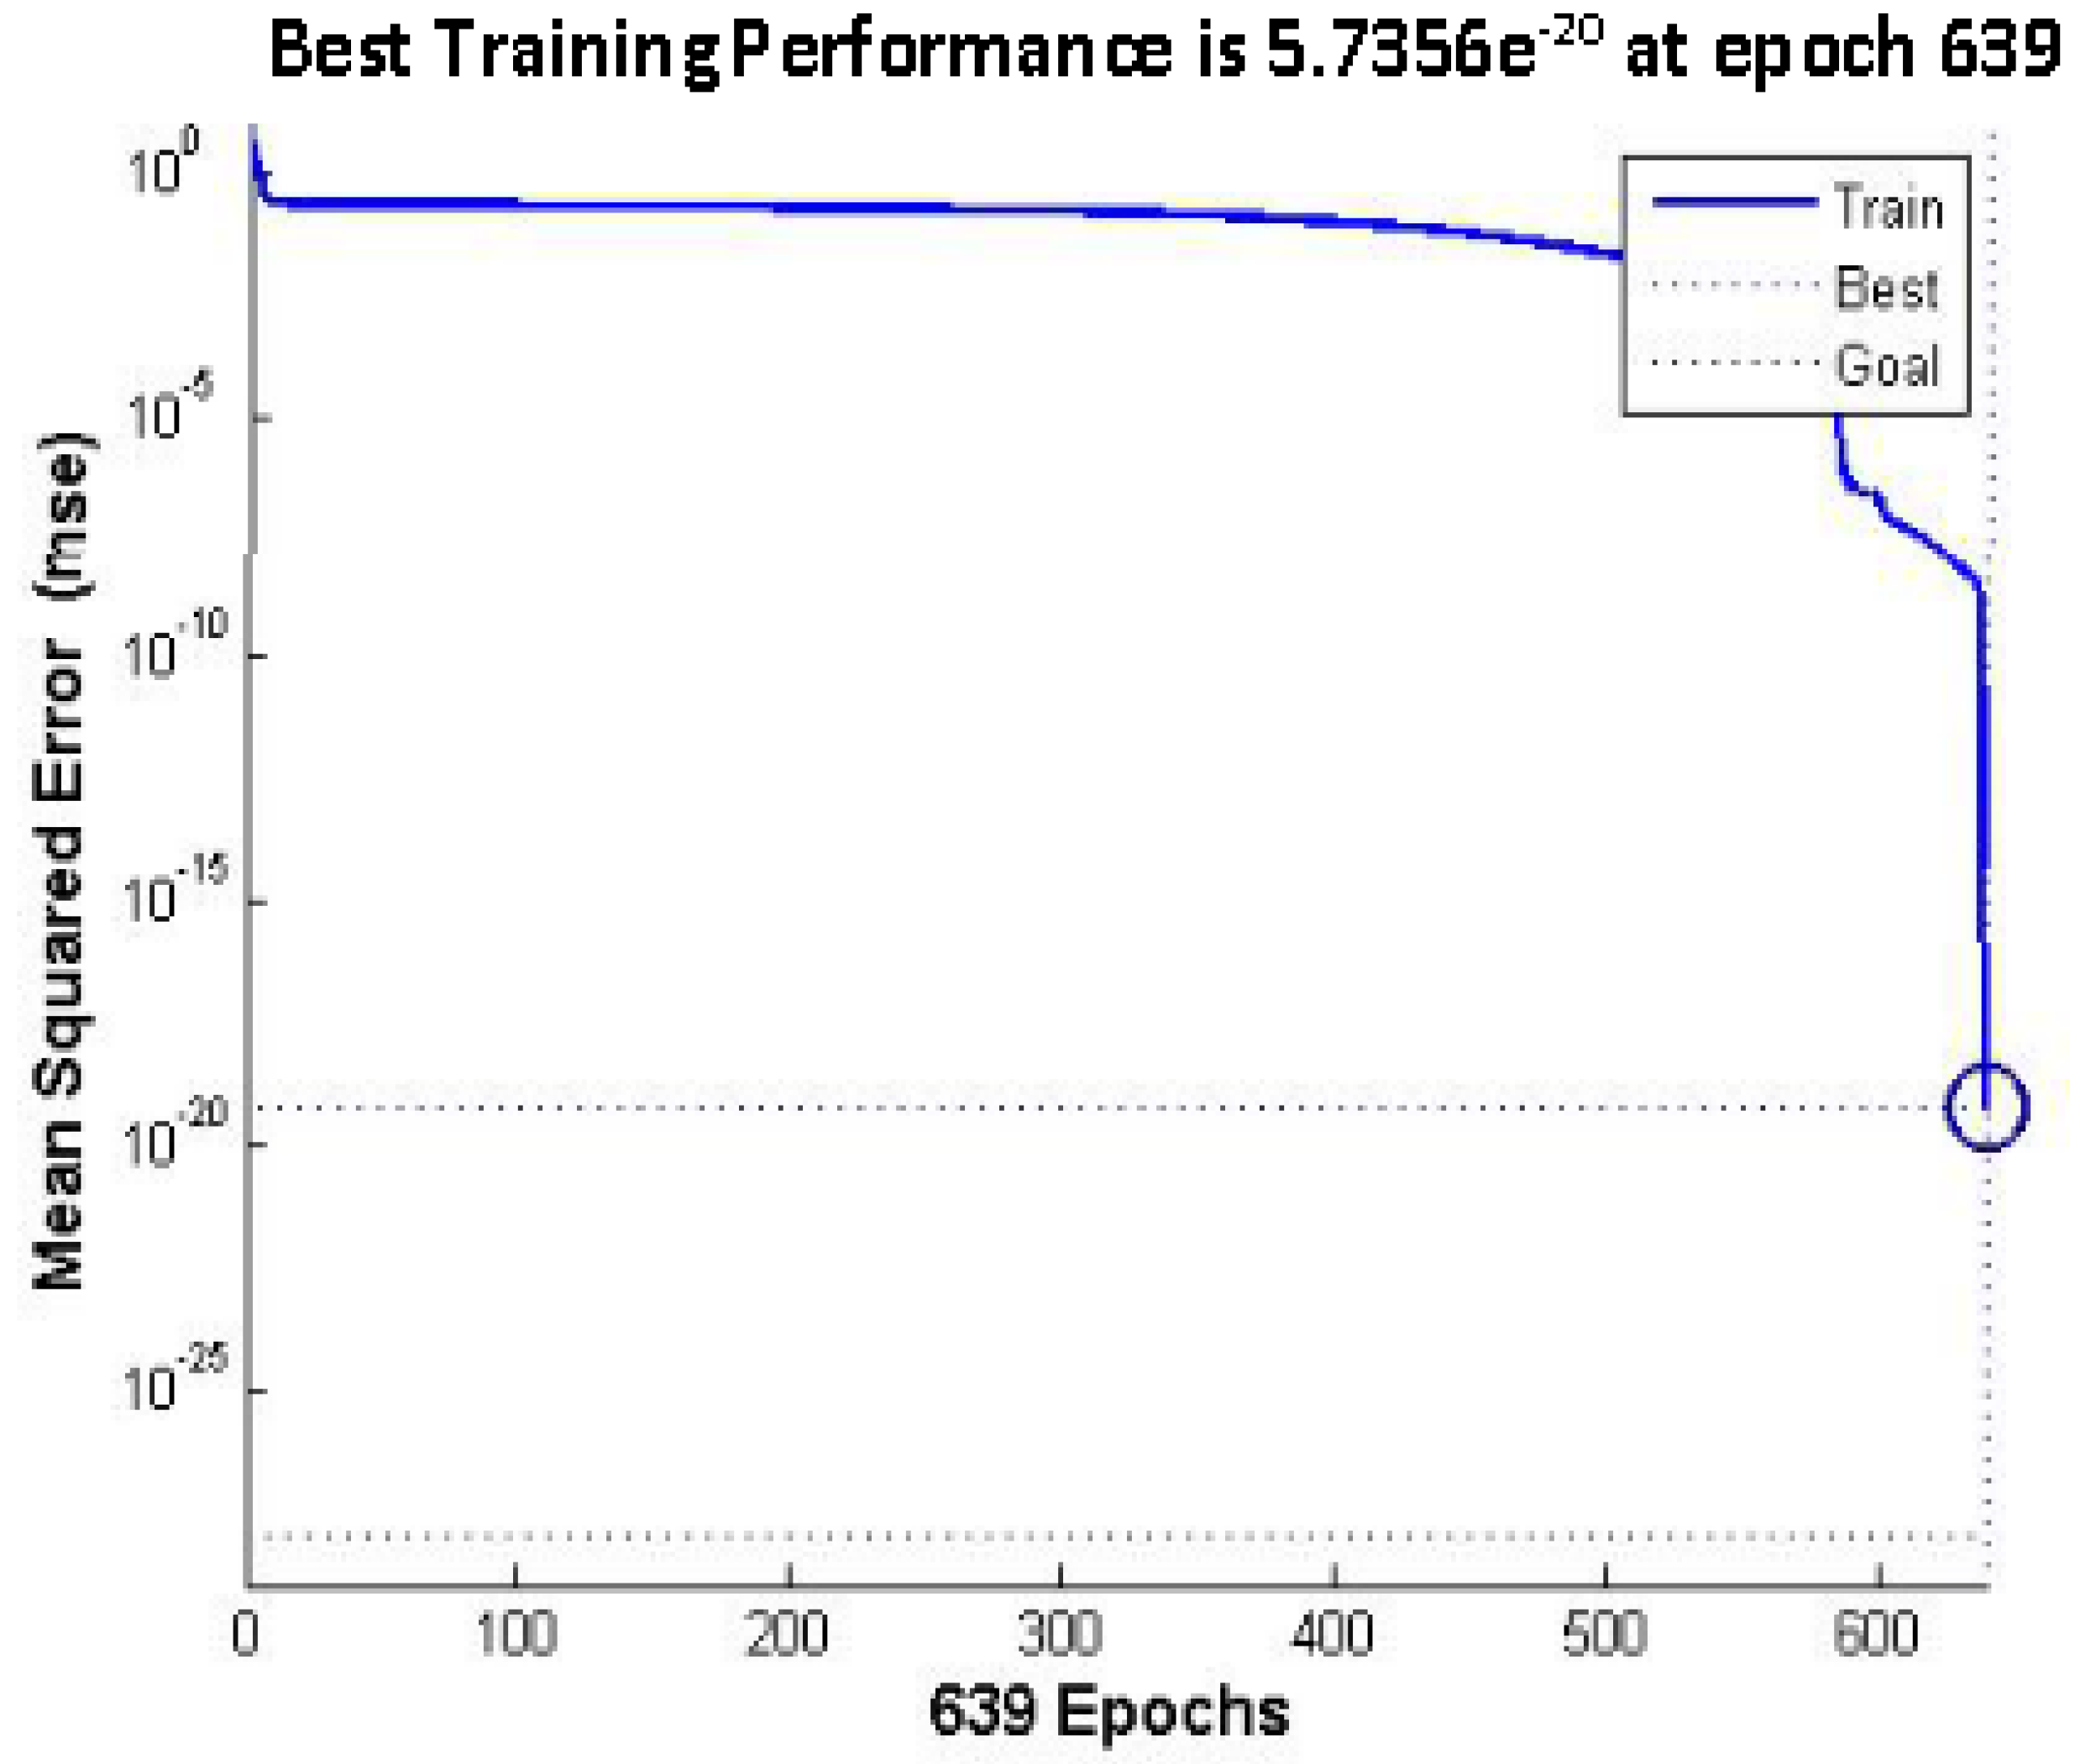
Figure 4 is analyzed to illustrate the prediction feasibility of the BP neural network early warning model.
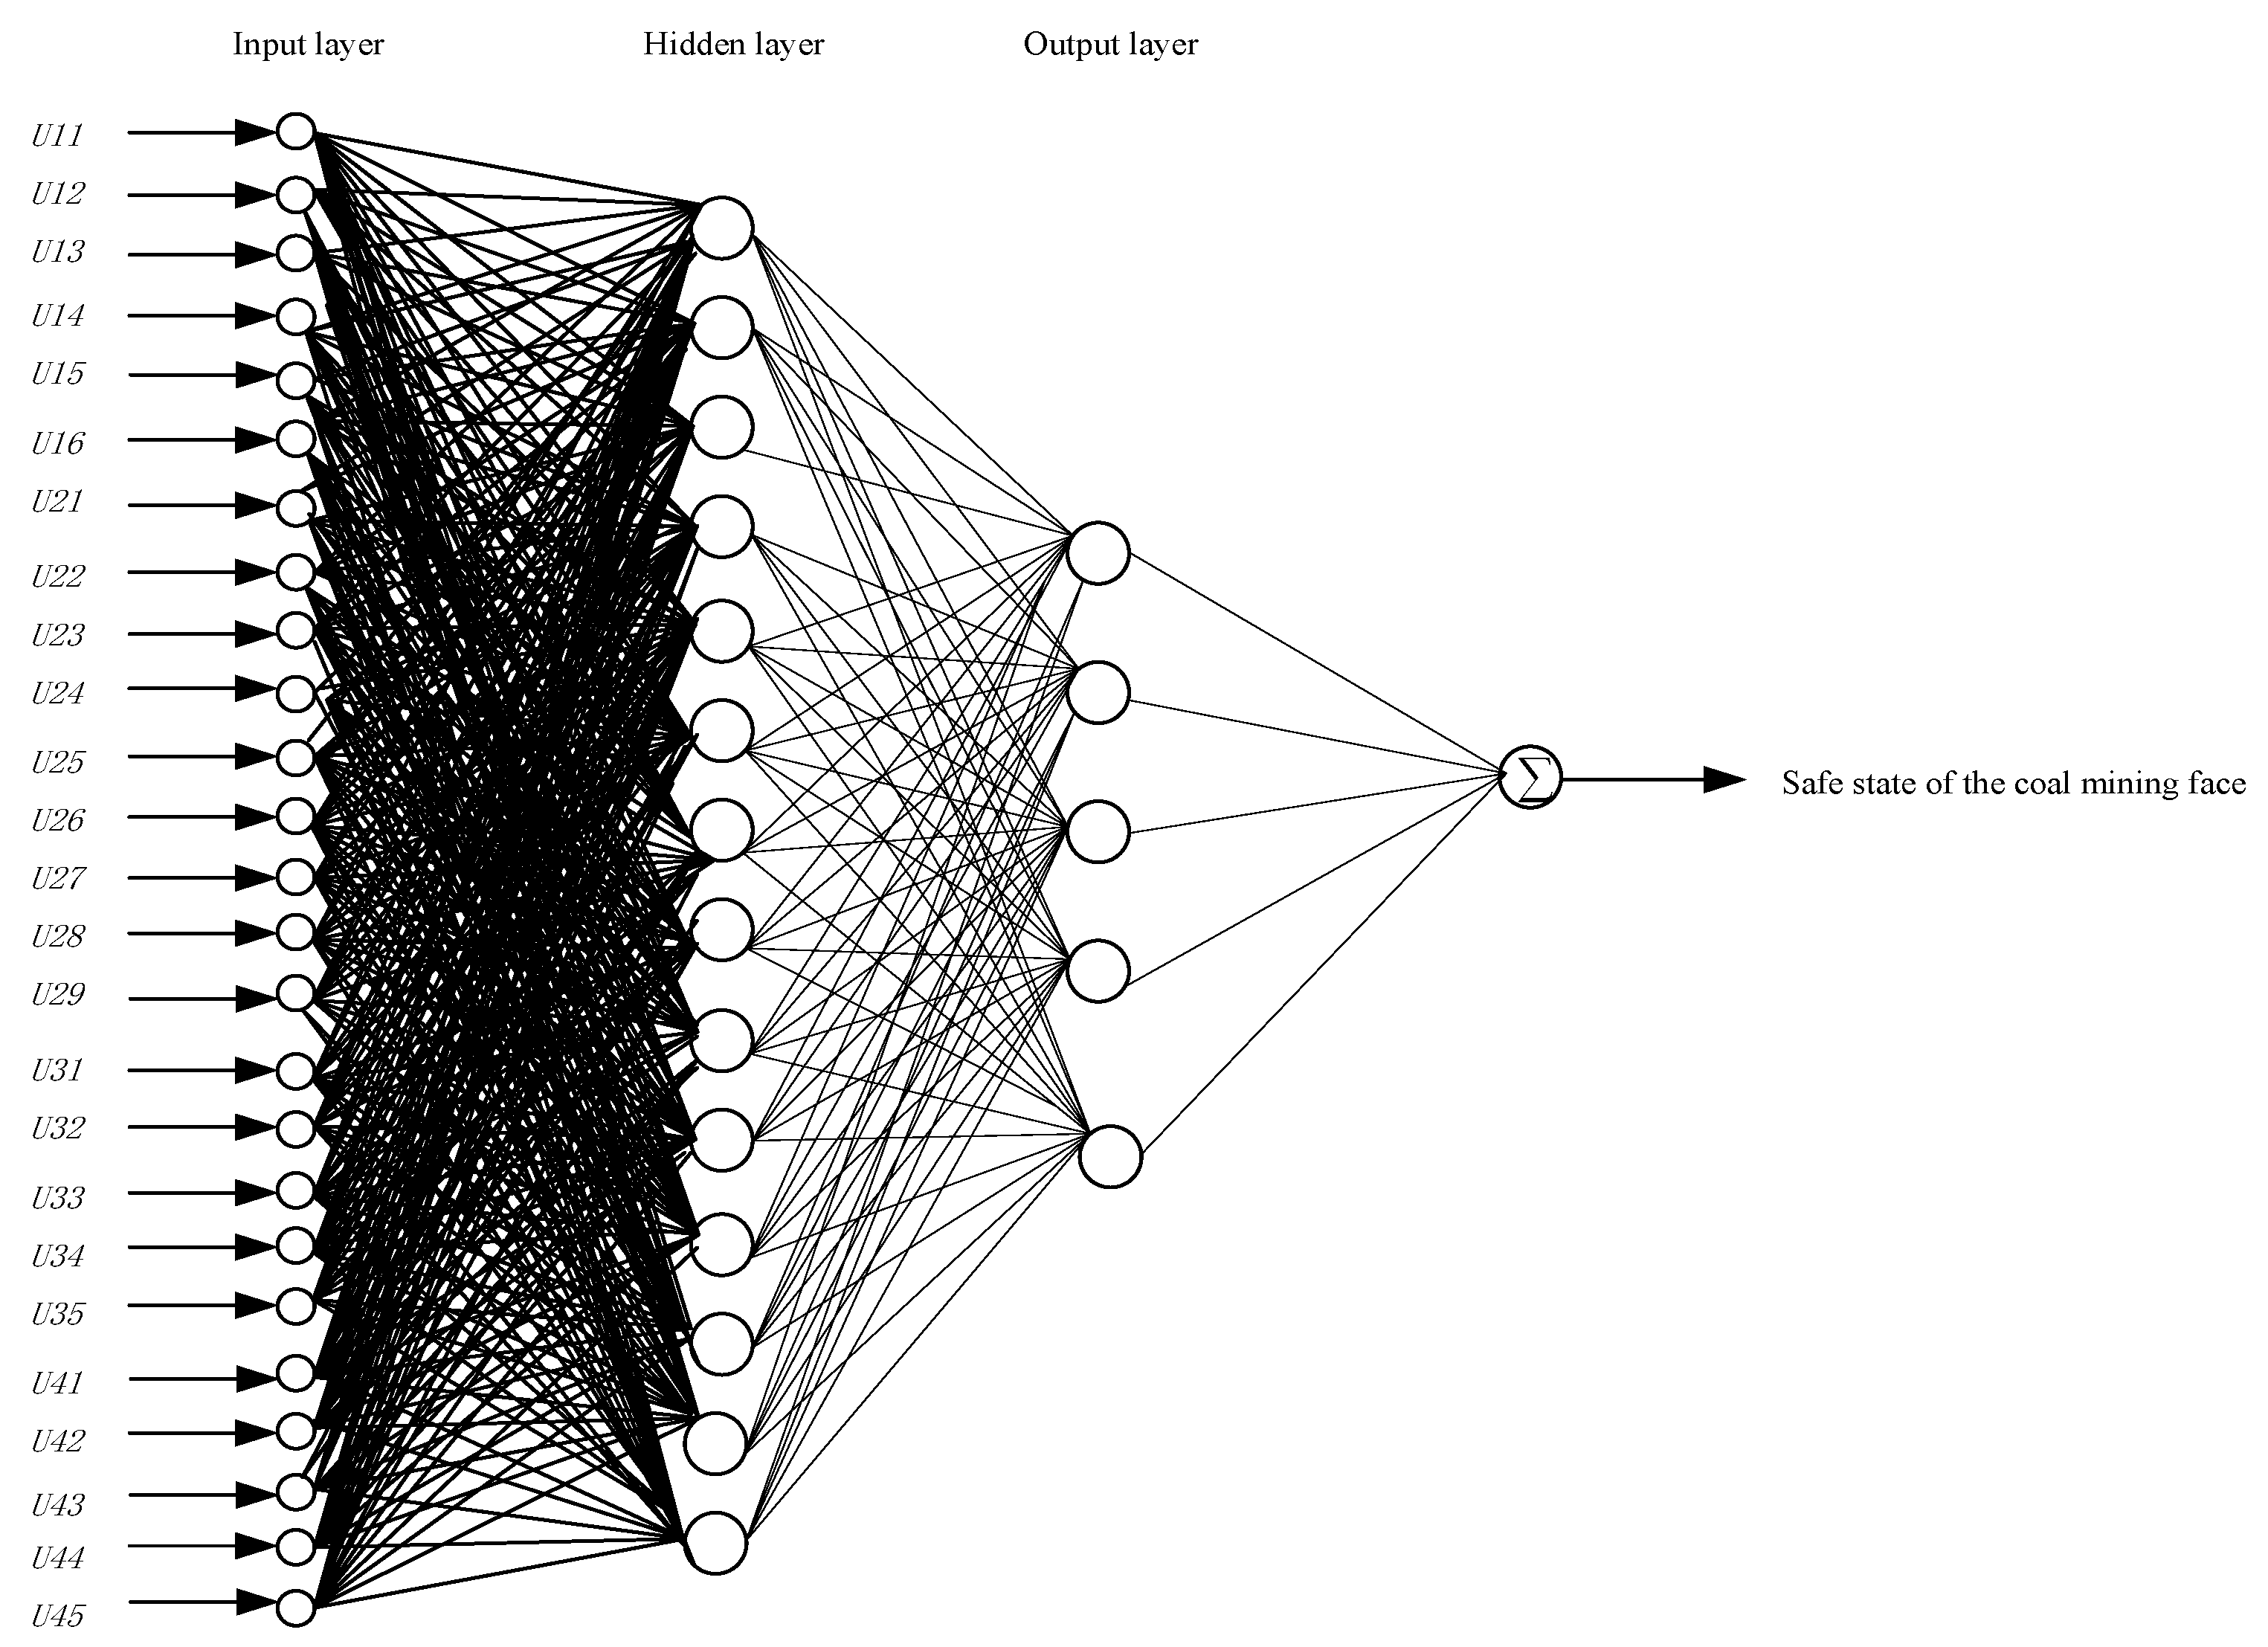
In the full-index early warning model of the mine, the input layer of the neural network contains 25 neurons, the output layer contains one neuron, and the neurons of the hidden layer are finally confirmed to be 14. The function of the hidden layer and the incentive function of the output layer are S-shaped functions, the training function is trainlm, and the learning rate is 0.001.
The sample input network is repeatedly trained until the error is less than 0.00001.
Figure 4 is the output error performance curve, which shows that the training times of BP neural network reaching the error limit are 639, and the root mean square error is 5.7356 × 10⁻²⁰. 
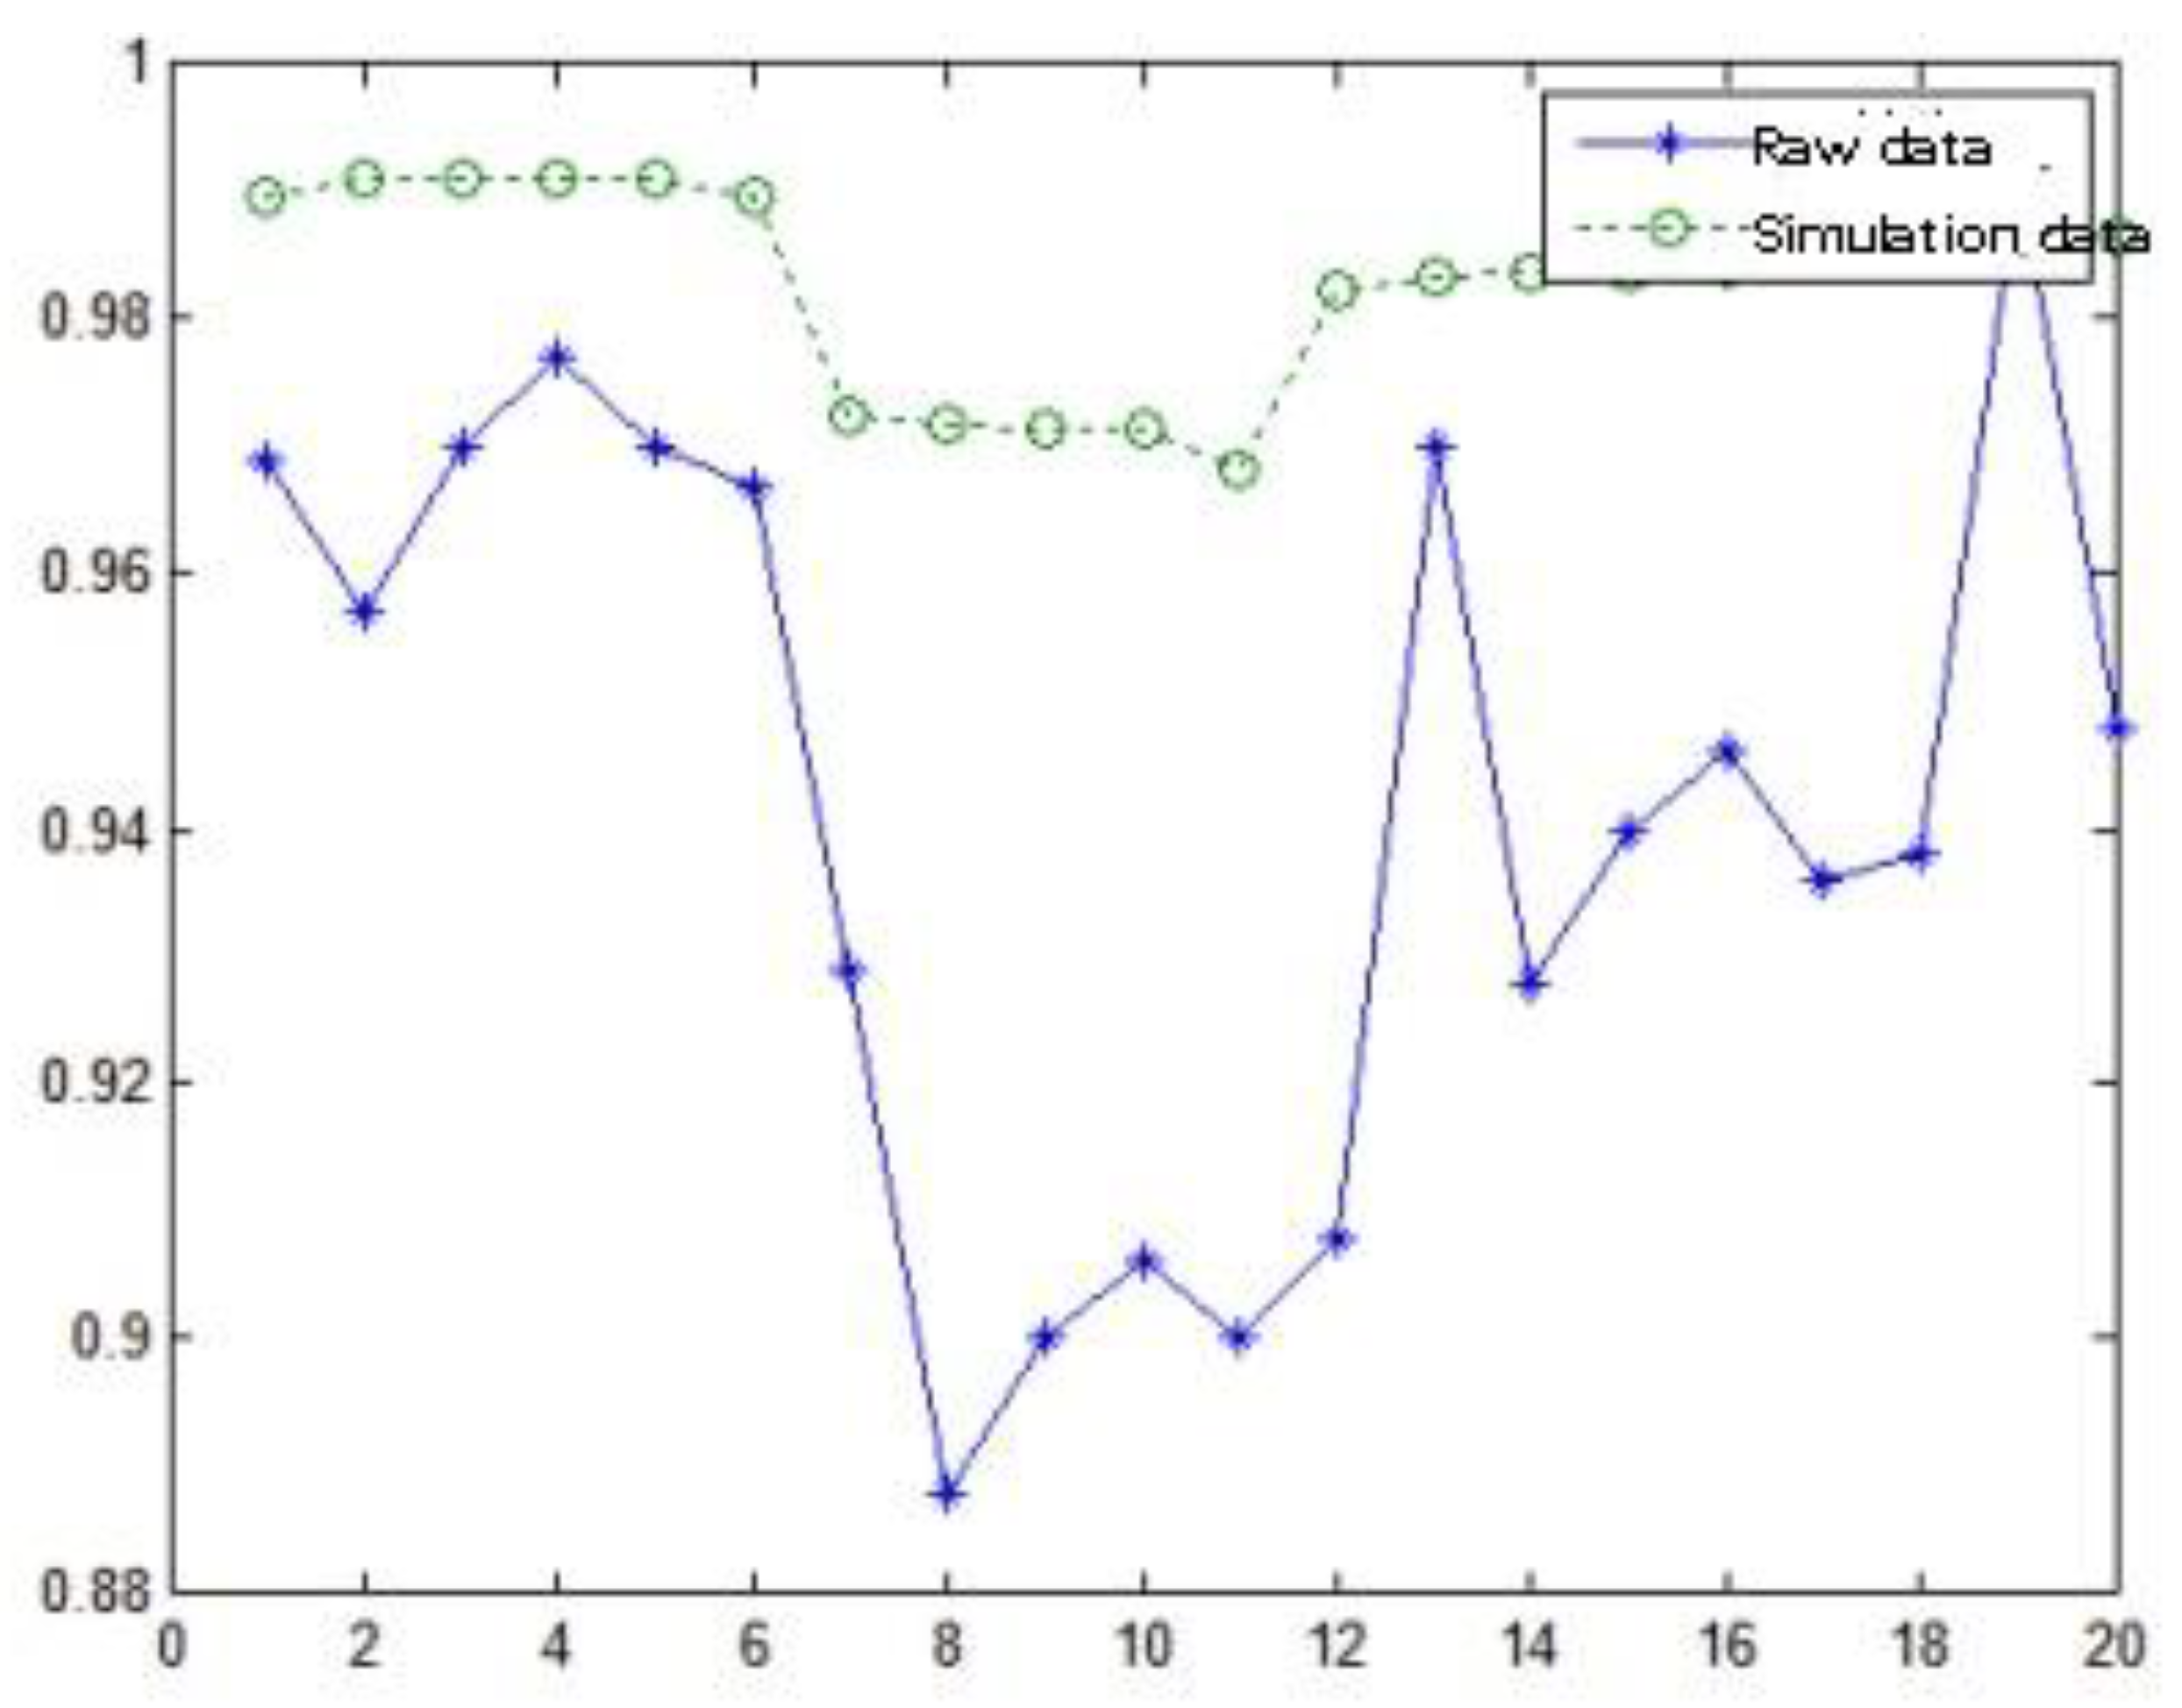
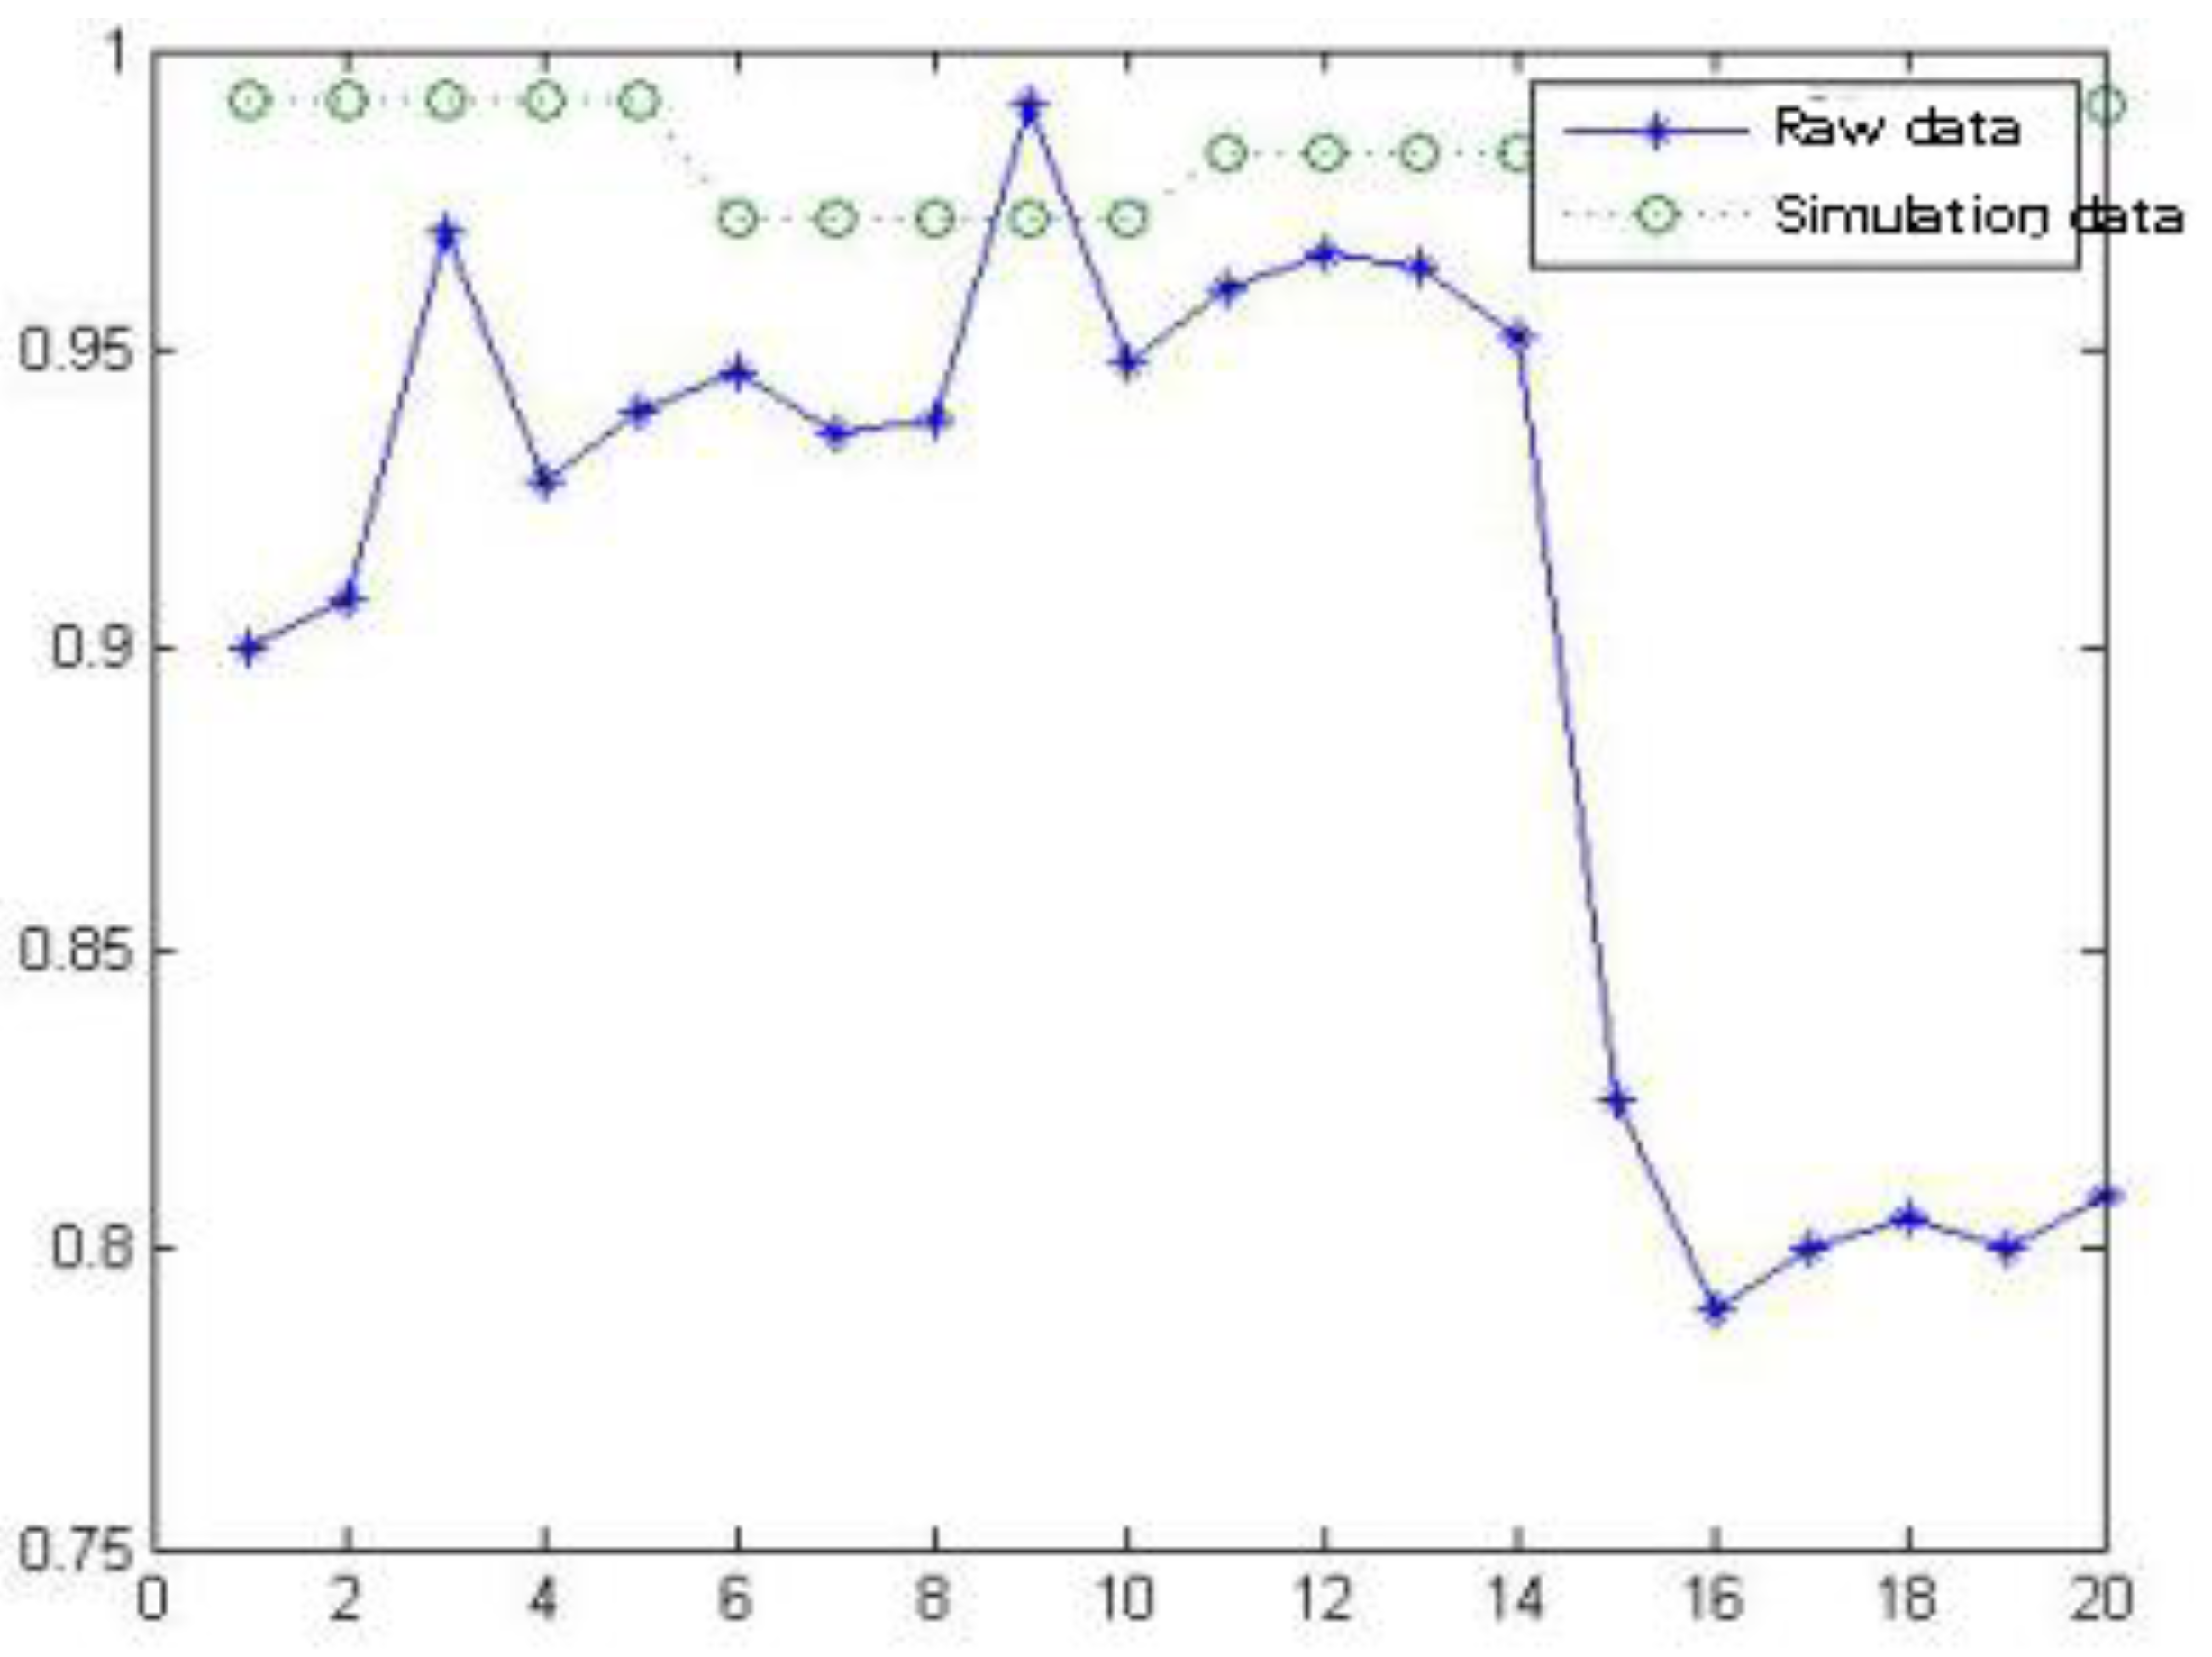
Figure 5 is the curve of the simulation results of the predicted data, which shows that the actual data curve is significantly different from the predicted curve, but the variation trend of the curve is basically the same.
The result analysis in Figure 4 and Figure 5 shows that the BP neural network model can achieve the expected error performance index and predict the index value, but the relative error is relatively large.
Figure 6 and 
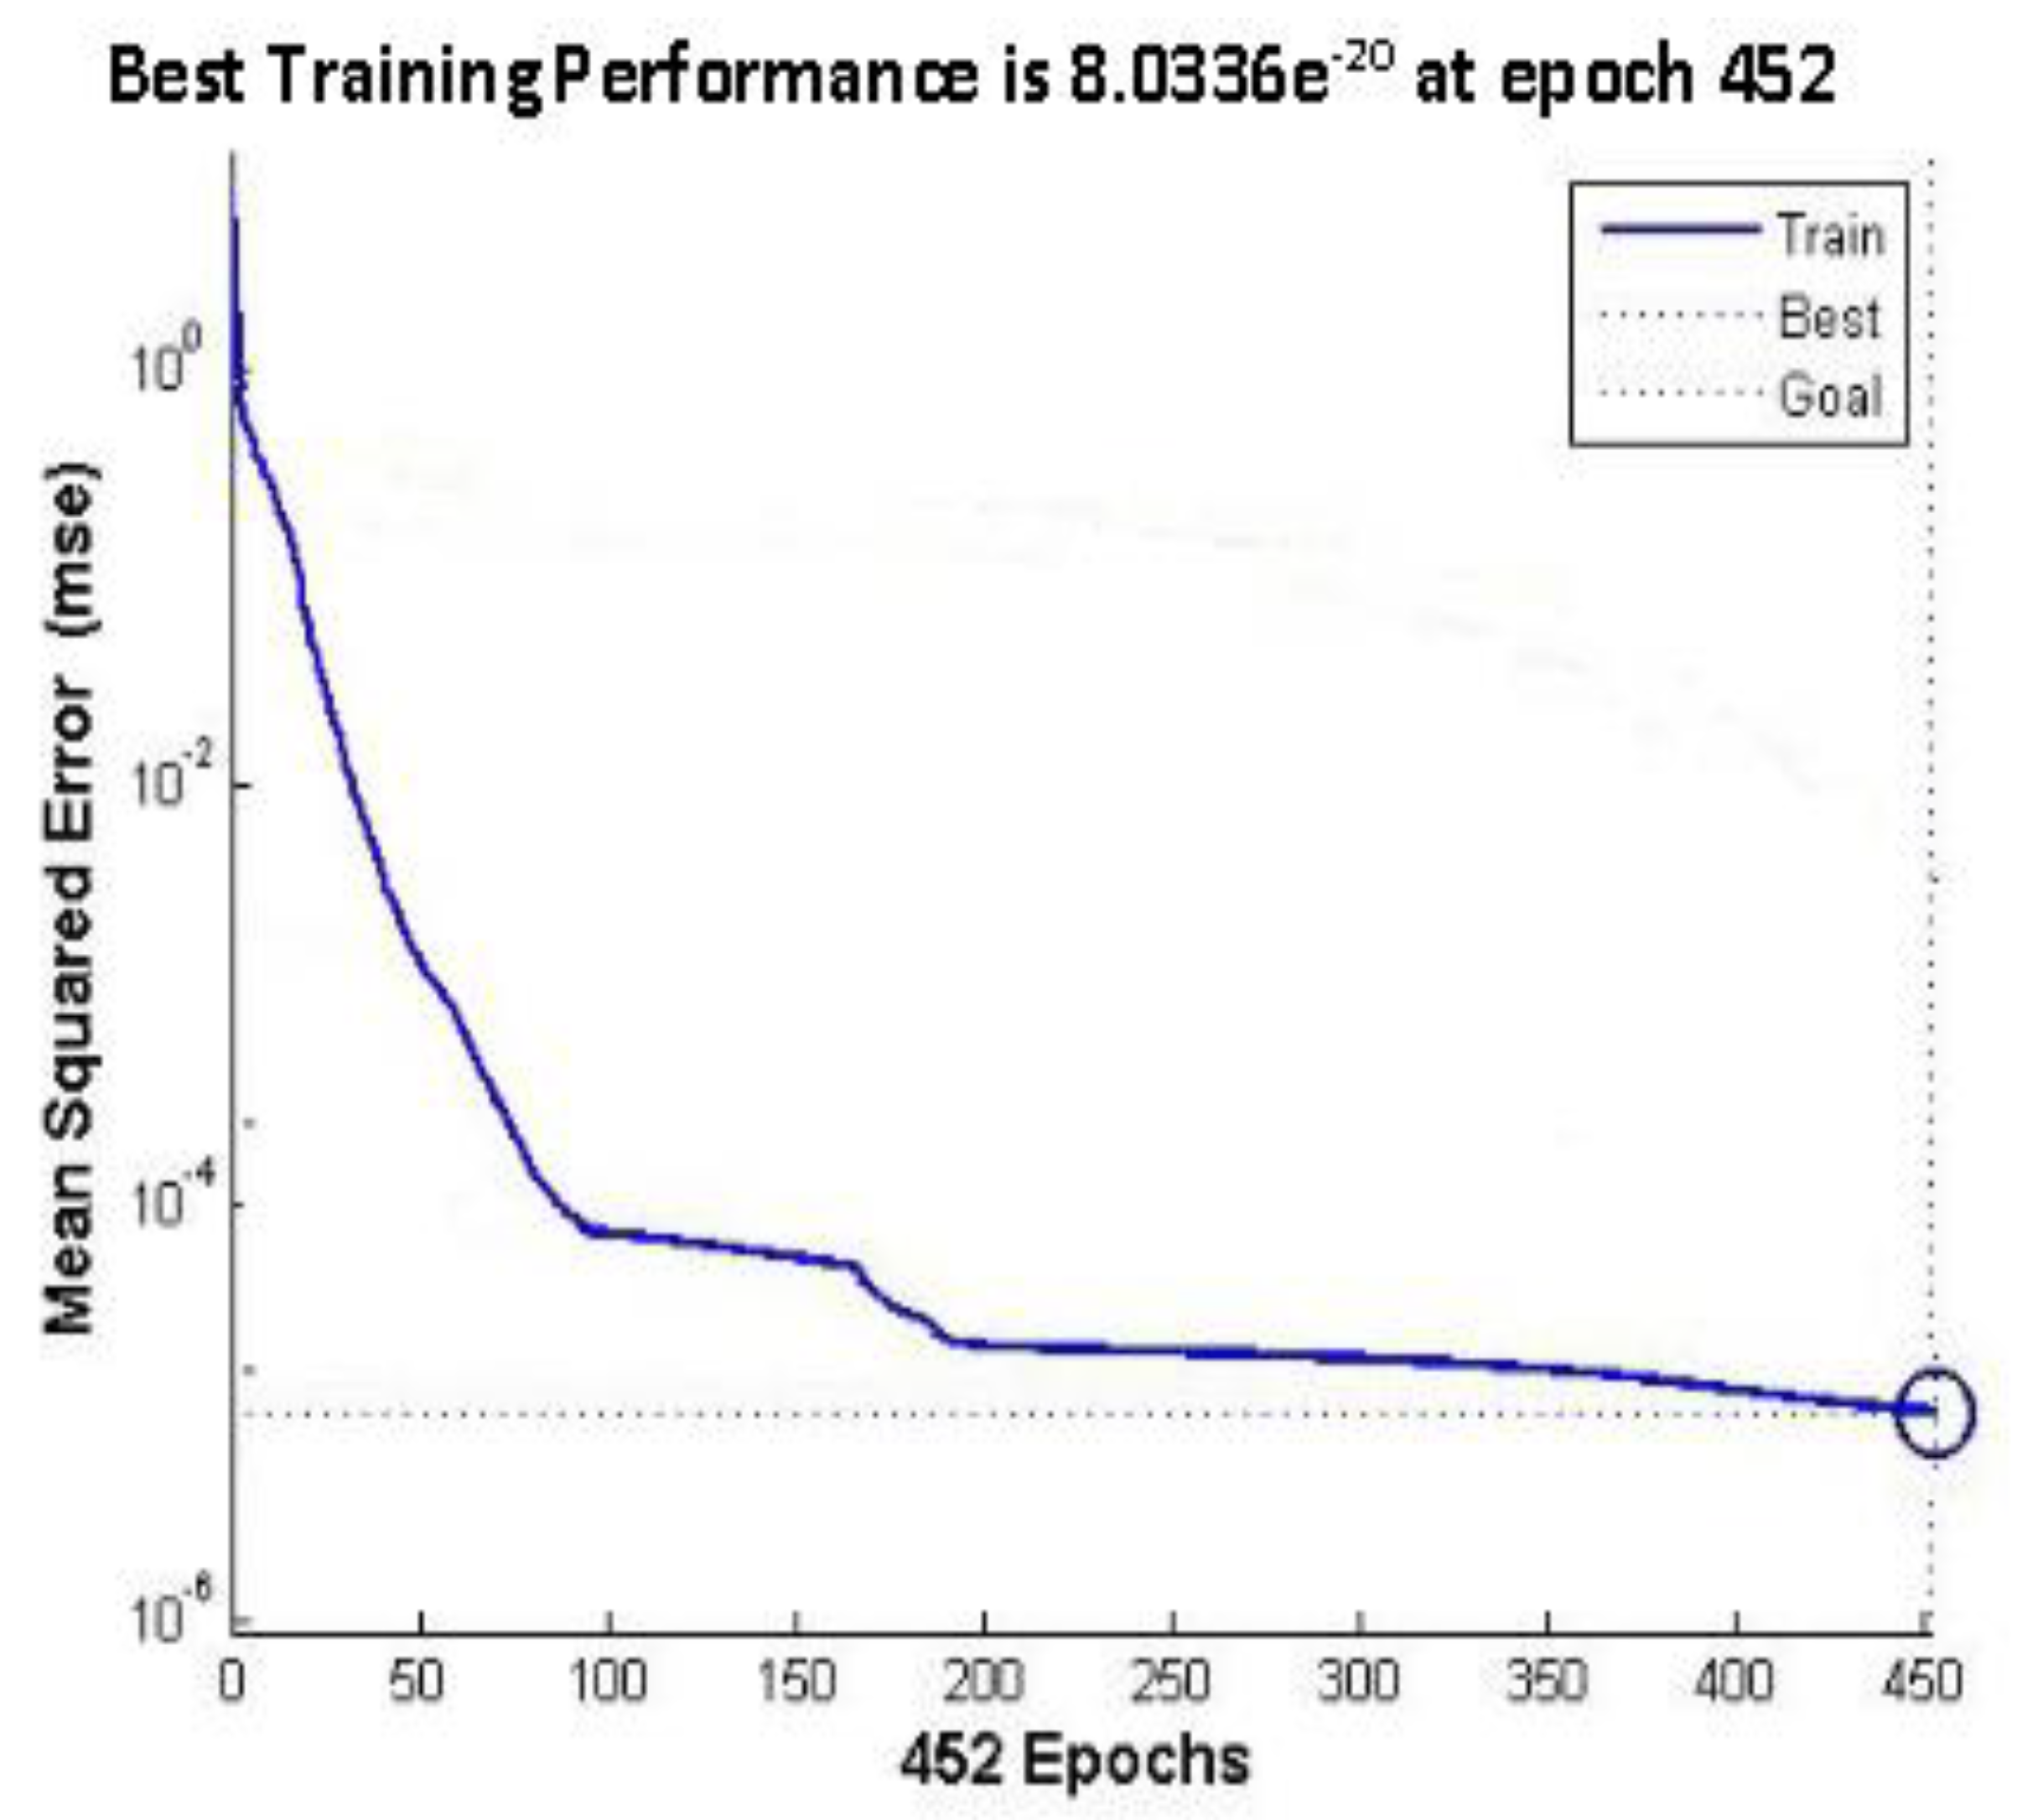
Figure 7 are analyzed to illustrate the feasibility of GA-BP neural network early warning model prediction.
The population size was set as 50, the genetic algebra was set as 100, the mutation probability was set as 0.3, the same BP neural network model was adopted, and the same training samples were used.
Figure 6 is the output error performance curve of GA-BP neural network, showing that the error limit is reached after 452 times of training. Figure 7 is the curve of the simulation results of the predicted data. Similarly, the actual data curve is significantly different from the predicted curve, and the variation trend of the curve is roughly the same.
The result analysis in Figure 6 and Figure 7 shows that the GA-BP neural network model can achieve the expected error performance index, and can predict the index value, but the relative error is relatively large.
Within the relative error range of ±6%, the prediction hit rates of the two models shown in Figure 4 and Figure 5 are all below 50%. The fitting degree between the prediction curves of the two models and the real curves also shows that the prediction errors of the two models are relatively large, and the output results are not very ideal.
(1) The sample selected is not large enough.
Although the samples from 2007 to 2017 were selected, only 46 sets of data were collected in the third month of each quarter, so the sample size was too small.
(2) Quality of selected sample data.
The sample data is collected by questionnaire, which is sent to the personnel responsible for mining safety, mechanical and electrical, production, transportation, one and three prevention, and finally collected and sorted by the deputy general manager of mine mechanical and electrical.
Survey to the mine safety record in some data or missing, missing some data in the survey, the hard to avoid appear strong subjectivity, optional the gender is big, and the early stage of the quantitative and qualitative index of the existence very big subjectivity, some data can’t reflect objective safety state, and the sample data from the correlation between strong, also affect the quality of the output.
In order to overcome these defects in future research and application, the sample size should be large enough, the weight of each index should be calculated, and the unqualified indexes should be eliminated to ensure the quality of application effect.

4.2. Validity of Optimizing BP Neural Network Performance with Genetic Algorithm

Figure 4, Figure 5, Figure 6 and Figure 7 were compared to verify the effectiveness of genetic algorithm in optimizing BP neural network performance.
In the same performance goals, and the same training samples, Figure 4 reflects the traditional BP neural network training mature iteration number is 639, Figure 6 reflects the genetic algorithm to optimize the BP neural network training after mature iteration number is 452, a 1.4 -fold increased convergence speed, shows that GA-BP faster convergence than BP neural network to the requirements of accuracy,
It shows that genetic algorithm can improve the performance index of BP neural network.
In terms of output error performance index, the total output error of GA-BP training samples is 5.85 × 10⁻⁶ and the average output error is 2.81 × 10⁻¹⁰, while the total output error of BP neural network training samples is 8.18 × 10⁻⁶ and the average output error is 3.92 × 10⁻¹⁰, and the average output error of the latter is 1.39 times of the former.
The curve of simulation results of prediction data shows that the errors shown in Figure 5 and Figure 7 are relatively large, but the overall fluctuation of GA-BP algorithm error represented in Figure 7 is smaller than that of BP algorithm, and the overall prediction effect of GA-BP algorithm is more ideal.
Through comparative analysis, it is shown that the introduction of genetic algorithm to optimize the initial connection weights and thresholds of the neural network makes the BP neural network converge faster, reach the mature state and enter the prediction stage faster, which indicates the feasibility and effectiveness of the optimization of the BP neural network by genetic algorithm.
Table 9 is analyzed to illustrate the effectiveness of GA-BP neural network in predicting and warning the safety conditions of coal face.
The operation results of the forecast data in March 2007 in the warning model show that the safety condition of the coal face in that month is not good, and the safety level is low.
After consulting the actual safety records of the mine in March 2007, it is found that the safety personnel allocation rate, coal dust control, roof control and flood control safety evaluation are all below 0.7, and the safety input ratio is below 0.7.
According to the geological data of the coal working face of the mine, “explosion index is 37.45%, which is explosive”, and the integrity rate of coal dust prevention and control in that month is 0.559. According to the Coal Mine Safety Regulations, the coal dust concentration of the coal working face shall not be higher than 10 mg/m3, and the dust removal rate of the dust prevention effect shall not be less than 90%, that is, the integrity rate reaches more than 0.9.
In March 2007, the coal dust concentration in this mine was seriously out of standard, and there was a risk of coal dust explosion. The prediction results of the early warning model were consistent with the actual safety conditions of coal mining face, which indicated the effectiveness of the prediction and early warning of GA-BP neural network.

4.3. Rationality of Application of FCM Clustering Algorithm

The results of Table 3 and Table 4 and 
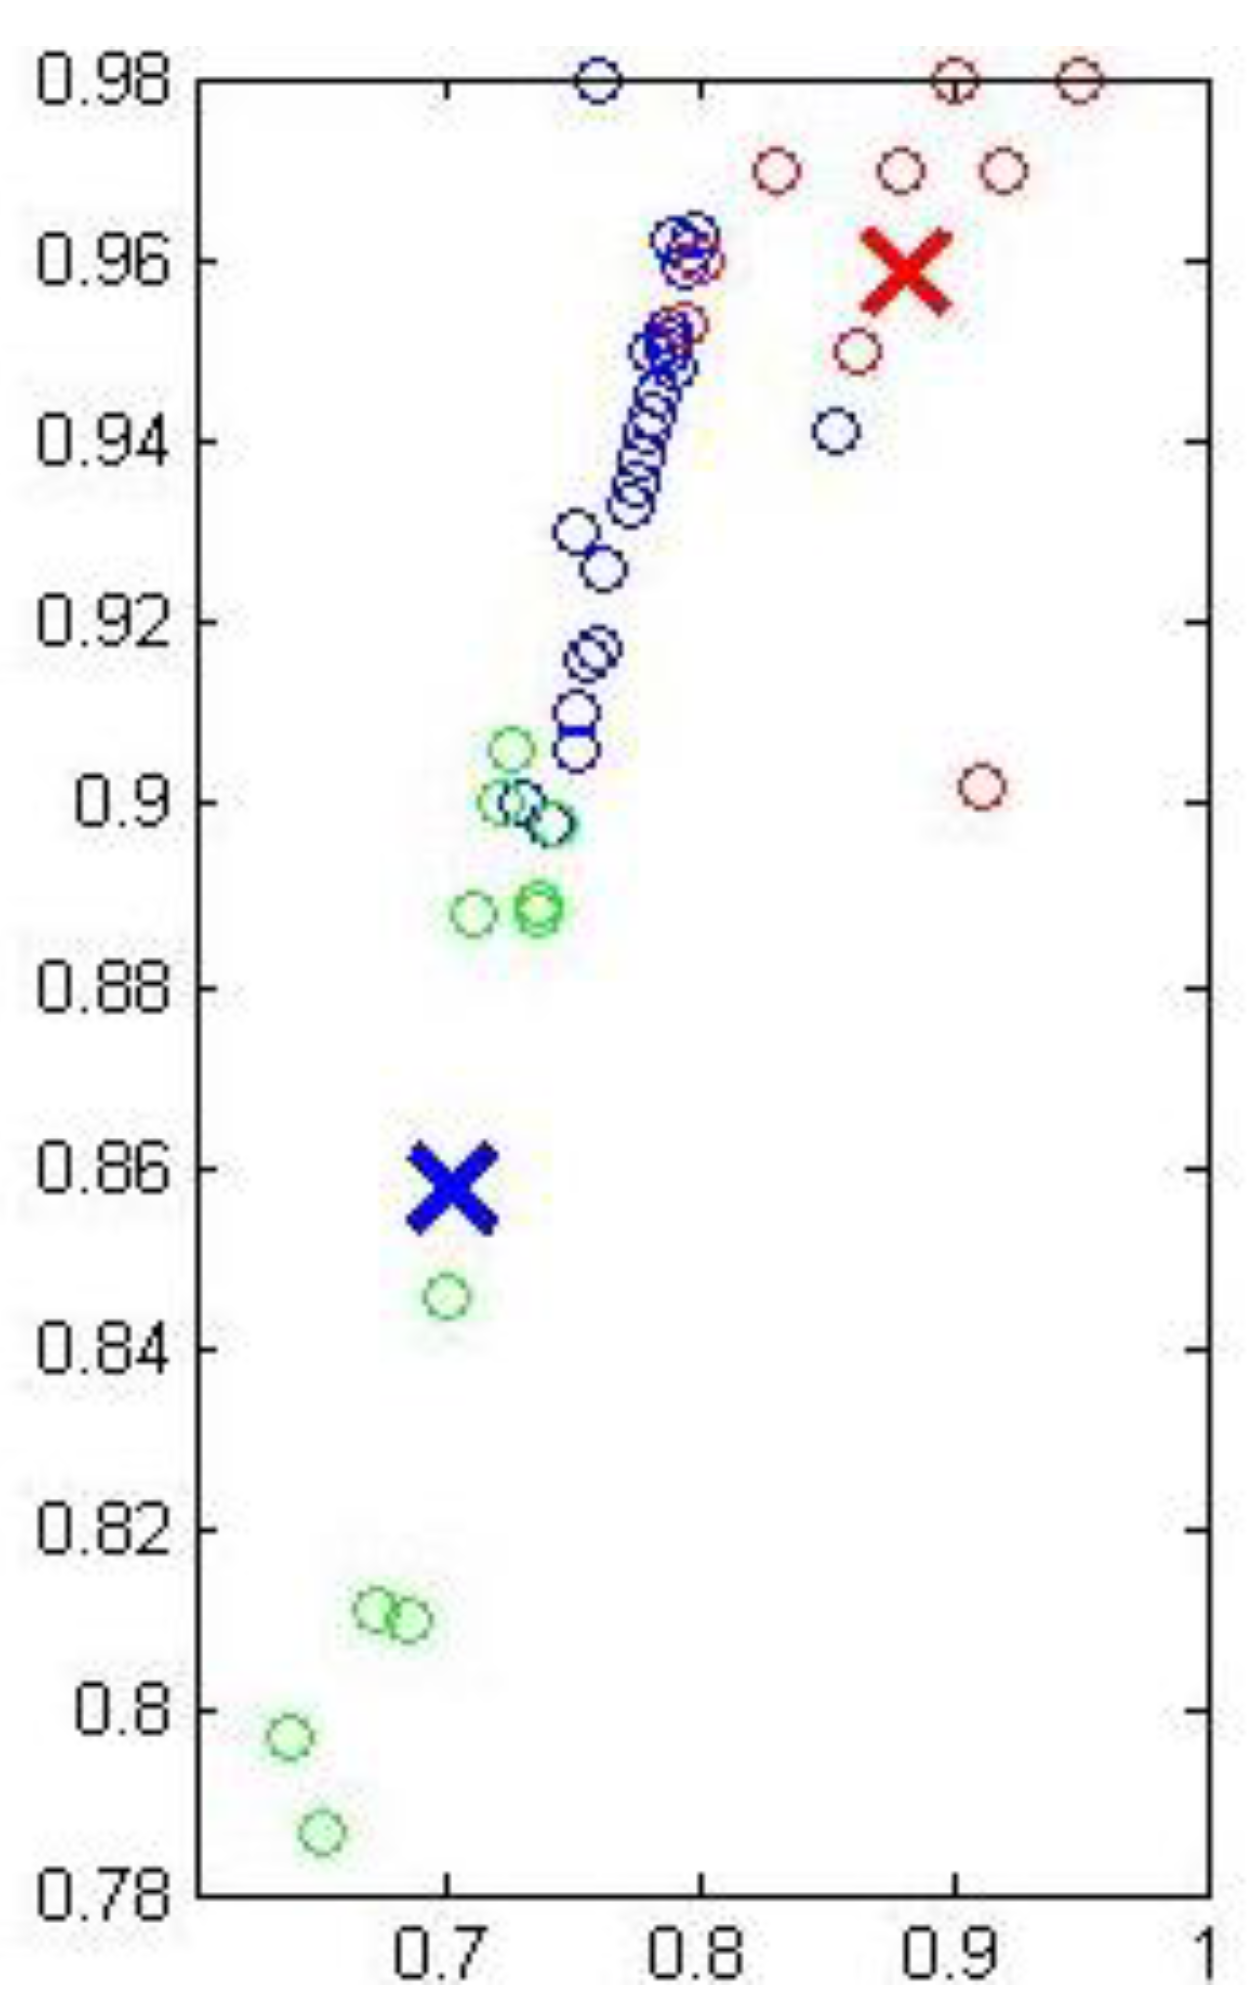
Figure 3 were analyzed to illustrate the rationality of FCM clustering algorithm.
The FCM clustering algorithm discretized the original sample data in order to optimize the sample space and improve the operation efficiency of the neural network.
Table 3 is the optimal central vector of FCM clustering operation for sample data. Table 4 is the result of FCM clustering, which shows that the sample data is divided into three sets after clustering. Figure 4 shows the fuzzy set of samples after clustering more intuitively.
The FCM clustering samples were used for neural network training and testing with MATLAB. Due to the elimination of some interference samples, the efficiency of selecting training samples and testing samples in the neural network system was improved, thus effectively reducing the training time of BP neural network.

4.4. The Possibility of Application in Intelligent Coal Mine

At present, intelligent mining has become the focus of construction in China. The classification and grading evaluation index system and evaluation method of intelligent coal mines can evaluate the type of mine intelligent construction conditions and the level of mine intelligent construction. The evaluation results also reflect the shortcomings of mine intelligent construction and provide guidance for the subsequent intelligent upgrading and transformation of coal mines [64]. The safety early warning model constructed above can evaluate the safety condition of the coal working face by classifying the hidden danger index of the coal working face and by using the fuzzy clustering algorithm and GA-BP neural network operation. Therefore, the model can provide help for the intelligent mining of coal mine.

5. Conclusions

The quality of the early warning indicators is the key to the operation effect of the early warning model. “The early warning elements should include all the dangerous states that may lead to accidents. In order to achieve no omission and alarm leakage, it is necessary to carry out repeated investigation of dangerous elements for six major specialties (coal mining, excavation, transportation, ventilation, electromechanical, water prevention and control) and three analysis objects (personnel, process and device) in coal mine” [65]. Compared with previous researches on safety warning indicators and warning models of coal mining face.
The whole warning index system of “human, machine, environment and pipe” and other dangerous elements established in this paper makes the analysis and evaluation of the safety state of coal face more comprehensive and systematic.
On the basis of the security warning index, a security warning model combining the advantages of genetic algorithm and BP neural network was established, and FCM clustering algorithm was used to optimize the network sample space, thus improving the network learning speed.
Taking a fully mechanized mining face in a mine as an example, the results of the early warning are verified to be consistent with the reality, which indicates that the effectiveness of improving the weight and threshold of BP neural network system by genetic algorithm can make up for the deficiency of BP neural network falling into local optimum, improve the intelligent search ability of the network, and improve the accuracy of the prediction results.
The BP neural network optimized by genetic algorithm has the advantages of the two, improves the stability of the model, and provides a method for the system with uncertainty, fuzziness and complexity, which is suitable for the safety early warning system of coal face.
Due to “coal mine safety production relative risk exists obvious spatial distribution and the provinces there is a big difference interval,” [66] the coal mining face in different areas of the early warning index of different kinds of each index is different on the contribution rate of safety early warning effect, this article does not consider the weight of each index, and it is also a need to further research content. The application of this model in large industrial environment will be the focus of future research.

Funding

This research received no external funding.

Institutional Review Board Statement

Not applicable.

Informed Consent Statement

Not applicable.

Data Availability Statement

The data used to support the study was provided under license from a mine in Shandong province, China, which is not publicly available because of the interest of the mine owner.

Conflicts of Interest

The author declares no conflict of interest.

References

  1. Tan, Z.L.; Shan, F. Research on the temporal and spatial rules of coal mine safety accidents in China in recent ten years. China Coal 2017, 43, 102–107. [Google Scholar] [CrossRef]
  2. Wang, L.K.; Li, X.C.; Li, A.J. Current situation analysis and improvement measures of coal mine safety production in China. China Coal 2016, 42, 96–100. [Google Scholar] [CrossRef]
  3. Chong, T.; Song, Y.; Che, H. Application of set pair analysis method on occupational hazard of coal mining. Saf. Sci. 2017, 92, 10–16. [Google Scholar] [CrossRef]
  4. Lei, C.Q. Differentiation of basic concepts in the field of production safety and research on dual prevention mechanism. Chin. J. Work. Saf. Sci. Technol. 2017, 13, 17–23. [Google Scholar]
  5. Ding, B.C.; Wang, Y.W. Coal mine enterprise safety early warning management system. Liaoning Tech. Univ. 2010, 12, 121–123. [Google Scholar]
  6. Tan, Z.L.; Ren, C.; Wang, Z. Research and design of closed-loop management system for coal mine safety warning and inspection. China Coal 2015, 41, 75–78. [Google Scholar] [CrossRef]
  7. Wang, L.K.; Nie, B.S.; Cai, H.J.; Peng, B.; Li, A. Dynamic classification closed-loop management method and application of coal mine safety hidden danger. Chin. Work. Saf. Sci. Technol. 2017, 13, 126–131. [Google Scholar]
  8. Ma, M.H.; Wang, X.H.; Xu, X.H.; Luo, Y.; Yang, L. Research on Accident Hidden Risk Warning Method Based on Data Mining Technology. J. Work. Saf. Sci. Technol. 2017, 13, 11–19. [Google Scholar]
  9. Chen, J.; Ma, L.; Wang, C.; Zhang, H.; Ha, M. Comprehensive evaluation model for coal mine safety based on uncertain random variables. Saf. Sci. 2014, 68, 146–152. [Google Scholar] [CrossRef]
  10. Luo, X.R.; Li, M.K.; Li, Y.W.; Zhen, D. Risk assessment of major gas hazard sources in coal mining face. J. Heilongjiang Univ. Sci. Technol. 2016, 26, 612–616. [Google Scholar] [CrossRef]
  11. Zhang, R. Research on Identification and Prevention of Hazard Sources of Coal Mine Water Disaster. Energy Energy Conserv. 2017, 5, 8–9. [Google Scholar] [CrossRef]
  12. Sui, W.H.; Wang, D.D.; Sun, Y.J.; Yang, W.F.; Xu, Z.M.; Feng, L. Hydrogeological structure and mining-induced response of mine. J. Eng. Geol. 2019, 27, 24–31. [Google Scholar] [CrossRef]
  13. Shen, Q. Discussion on identification method of coal mine hazard sources. Energy Technol. Manag. 2019, 44, 154–155, 157. [Google Scholar]
  14. Li, R.Q. Research on Risk Pattern Recognition and Early Warning of Coal Mine Gas Explosive Disaster; Central South University: Hunan, China, 2013. [Google Scholar]
  15. Wu, Q.; Zhao, D.; Wang, Y.; Shen, J.; Mu, W.; Liu, H. Method for assessing coal-floor water-inrush risk based on the variable-weight model and unascertained measure theory. Hydrogeol. J. 2017, 25, 1–15. [Google Scholar] [CrossRef]
  16. Dou, L.M.; Jiang, Y.D.; Cao, A.Y.; Liu, H.S.; Gong, S.Y.; Cai, W.; Zhu, G.A. Monitoring and warning technology of “stress field—vibration wave field” under static and static loading of coal mine impact. Chin. J. Rock Mech. Eng. 2017, 36, 803–811. [Google Scholar] [CrossRef]
  17. Zheng, H.Q.; Qiao, T.Z.; Man, Z. Research on remote monitoring and early warning technology of mine hoist based on GPRS and neural network. Coal Mine Mach. 2014, 35, 197–199. [Google Scholar] [CrossRef]
  18. Liu, N.P. Research on Early Warning of Coal Mine Safety Production Risk; Chongqing Li University: Chongqing, China, 2012. [Google Scholar]
  19. Meng, F.R.; Zhao, F. Construction of coal mine safety early warning systPem system. Microcomput. Inf. 2008, 24, 60–61. [Google Scholar]
  20. Xin, S.B.; Sun, C. Research on early warning analysis of coal mine safety production based on principal component analysis. China Coal 2010, 36, 105–108. [Google Scholar] [CrossRef]
  21. Wen, L.; Wang, H.B.; Cai, W.F. Safety early warning of coal mine emergency management based on factor analysis and BP neural network. Sci. Technol. Ind. 2013, 13, 145–148. [Google Scholar]
  22. Wang, F.; Yang, X.; Li, W.S.; Song, A.F.; Tong, F.M. Study on coal mine safety evaluation based on information entropy-fuzzy neural network. Saf. Coal Mines 2014, 45, 213–216. [Google Scholar] [CrossRef]
  23. Chen, X.G.; Gao, X.X.; Wang, C.Q.; Bian, X.F.; Yang, Y. Coal mine safety dynamic early warning model based on extension theory. J. Jiamusi Univ. 2015, 684–687. [Google Scholar]
  24. Liu, M.; Wang, X.Q.; Zhu, J. Prediction of gas emission based on RS-SVM. J. Liaoning Univ. Technol. 2018, 55–59. [Google Scholar] [CrossRef]
  25. Zhang, Z.B.; Jiang, Y.N.; Guo, Z.G. Research on the application of association rule mining technology in coal mine safety early warning system. Ind. Mine Autom. 2009, 35, 24–26. [Google Scholar]
  26. Jia, H.J.; Wei, C. Application of Apriori algorithm in coal mine safety early warning system. Comput. Digit. Eng. 2015, 43, 1519–1522. [Google Scholar]
  27. Ding, B.C. Research on Coal Mine Safety Early Warning Model and Its Application; Liaoning Technical University: Liaoning, China, 2010. [Google Scholar]
  28. Fan, Z.; Mao, D.; Qi, Q.G. Study on the early warning index of stope roof disaster with two column shield stope. J. Min. Saf. Eng. 2017, 34, 91–95. [Google Scholar] [CrossRef]
  29. Liu, D.M.; Yin, S.X.; Lian, H.Q.; Zhao, D.Y. Study on quantitative warning criterion and warning system of water inrush from coal mine floor. Coal Eng. 2019, 51, 16–20. [Google Scholar]
  30. Shi, J.L.; Yang, B.; He, M.X.; Zhang, H.L.; Sun, W.L. Method for evaluating the threat degree of spontaneous combustion fire in working face. Saf. Coal Mines 2017, 48, 175–178. [Google Scholar] [CrossRef]
  31. Sun, J.Q. Study on Safety Hidden Danger Evaluation Method of Mine Fully Mechanized Mining Face; Shandong University of Science and Technology: Qingdao, China, 2004. [Google Scholar]
  32. Lu, G.B.; Kang, J.K.; Bai, G.; Liu, J.; Xie, L.N. Application of PCA-BP in predicting gas emission amount of stope face. J. Liaoning Tech. Univ. 2015, 34, 1329–1334. [Google Scholar]
  33. Hao, T.X.; Zhang, C.L. Research on prediction and early warning method of gas outburst based on Hadoop platform. China Saf. Sci. J. 2017, 27, 61–66. [Google Scholar] [CrossRef]
  34. Zhao, G.Y.; Ma, F. Particle Swarm Optimization for Dust Concentration Prediction Based on BP neural network. Meas. Control. Technol. 2018, 25–28. [Google Scholar] [CrossRef]
  35. Qi, L.L.; Zhang, H.X. On model—Its concept, classification and evaluation criteria. Stud. Philos. Sci. Technol. 2018, 20–25. [Google Scholar]
  36. Zhao, L.M.; Lei, L.; Liu, Y.J. The Early-warning Model Based on BP Artificial Neural Networks for Enterprises. Northwest A F Univ. 2004, 35, 96–100. [Google Scholar]
  37. Liu, Q.; Yuan, W.; Wang, B.; Peng, L. Prediction of gold concentrate grade based on GA-BP neural network. J. Northeast. Univ. (Nat. Sci.) 2015, 36, 237–240. [Google Scholar]
  38. Anuar, S.; Selamat, A.; Sallehuddin, R. Hybrid Artificial Neural Network with Artificial Bee Colony Algorithm for Crime Classification. In Computational Intelligence in Information Systems; Springer International Publishing: Cham, Switzerland, 2015. [Google Scholar]
  39. Sun, L.F.; Zhou, J.B.; Lin, W.J.; Hou, Z.H.L. Research on crisis warning of network public opinion based on BP neural network and genetic algorithm. J. Inf. 2014, 33, 18–24. [Google Scholar]
  40. Wang, X.K.; Lin, H.; Wang, X.X. Soft measurement model of ring’s dimensions for vertical hot ring rolling process using neural networks optimized by genetic algorithm. J. Cent. South Univ. 2017, 24, 17–29. [Google Scholar] [CrossRef]
  41. Bonis, T.; Oudot, S. A fuzzy clustering algorithm for the mode seeking framework. Pattern Recognit. Lett. 2018, 102, 37–43. [Google Scholar] [CrossRef] [Green Version]
  42. Qu, F.H. Fuzzy Clustering Algorithm and Its Application; National Defense Industry Press: Beijing, China, 2011. [Google Scholar]
  43. Zhang, T. Optimized fuzzy clustering algorithms for brain MRI image segmentation based on local gaussian probability and anisotropic weight models. Int. J. Pattern Recognit. Artif. Intell. 2018, 32, 1857005.1–1857005.23. [Google Scholar] [CrossRef]
  44. Gosain, A.; Dahiya, S. Performance analysis of various fuzzy clustering algorithms: A review. Procedia Comput. Sci. 2016, 100–111. [Google Scholar] [CrossRef] [Green Version]
  45. Ma, K.W.; Mei, Y.; Li, D.B. Prediction of artificial neural network in mine monitoring data. Coal Mine Saf. 2010, 88–90. [Google Scholar] [CrossRef]
  46. Yang, M.; Qing, X.X.; Wang, B. Neural network optimization method based on improved genetic algorithm. Comput. Simul. 2009, 26, 198–201. [Google Scholar] [CrossRef]
  47. Chen, Y.; Zheng, W.; Li, W.; Huang, Y. Large group activity security risk assessment and risk early warning based on random forest algorithm. Pattern Recognit. Lett. 2021, 1–5. [Google Scholar] [CrossRef]
  48. Wang, N.; Sun, X.; Zhao, Q.; Yang, Y.; Wang, P. Leachability and adverse effects of coal fly ash: A review. J. Hazard. Mater. 2020, 122725. [Google Scholar] [CrossRef] [PubMed]
  49. Han, X.; Chen, N.; Yan, J.; Liu, J.; Liu, M.; Karellas, S. Thermodynamic analysis and life cycle assessment of supercritical pulverized coal-fired power plant integrated with no.0 feedwater pre-heater under partial loads. J. Clean. Prod. 2019, 233(OCT.1), 1106–1122. [Google Scholar] [CrossRef]
  50. Yang, B.B.; Yuan, J.H.; Ye, Z.Y. Risk assessment of coal mining above confined aquifer based on maximizing deviation in a GIS environment. Arab. J. Geosci. 2018, 11, 299–308. [Google Scholar] [CrossRef]
  51. Friedrich, T.; Kötzing, T.; Krejca, M.S.; Sutton, A.M. The compact genetic algorithm is efficient under extreme Gaussian noise. IEEE Trans. Evol. Comput. 2017, 21, 477–490. [Google Scholar] [CrossRef]
  52. Mu, G.; Liu, X.; Hu, S.; Deng, X. Research on dynamic hazard assessment of coal and rock bursting in mining of working face in Daanshan Coalmine. J. Nat. Disasters 2015, 24, 152–157. [Google Scholar] [CrossRef]
  53. Chao, R.; Ning, A.; Jw, A.; Lian, L.; Bh, D.; Ds, E. Optimal parameters selection for BP neural network based on particle swarm optimization: A case study of wind speed forecasting. Knowl. Based Syst. 2014, 56, 226–239. [Google Scholar]
  54. Li, Z.; Sun, B.; Xin, Y.; Zhu, H.A. computational method for optimizing experimental environments for phellinus igniariusvia genetic algorithm and BP neural network. Biomed Res. Int. 2016, 1–6. [Google Scholar] [CrossRef] [Green Version]
  55. Garcia, R.; Souza, L.P.D.L.B.; Celso, D.C.L.A.; Jacob, B.P. A rank-based constraint handling technique for engi-neering design optimization problems solved by genetic algorithms. Comput. Struct. 2017, 187, 77–87. [Google Scholar] [CrossRef]
  56. Ghazanfari, M.; Alizadeh, S.; Fathian, M.; Koulouriotis, D.E. Comparing simulated annealing and genetic algorithm in learning FCM. Appl. Math. Comput. 2007, 192, 56–68. [Google Scholar] [CrossRef]
  57. Mehrabi, M.; Sharifpur, M.; Meyer, J.P. Application of the FCM-based neuro-fuzzy inference system and genetic algorithm-polynomial neural network approaches to modelling the thermal conductivity of alumina–water nanofluids. Int. Commun. Heat Mass Transf. 2012, 39, 971–977. [Google Scholar] [CrossRef] [Green Version]
  58. Hou, C.C.; Simos, T.E.; Famelis, I.T. Neural network solution of pantograph type differential equations. Math. Methods Appl. Sci. 2020, 43, 3369–3374. [Google Scholar] [CrossRef]
  59. Fang, J.; Liu, C.; Simos, T.E.; Famelis, I.T. Neural network solution of single-delay differential equations. Mediterr. J. Math. 2020, 17, 30–35. [Google Scholar] [CrossRef]
  60. Phu, N.D.; Hung, N.N. Some solving methods for a fuzzy multi-point boundary value problem. Soft Comput. 2020, 24, 483–499. [Google Scholar] [CrossRef]
  61. Mirrashid, M. Earthquake magnitude prediction by adaptive neuro-fuzzy inference system (ANFIS) based on fuzzy C-means algorithm. Nat. Hazards 2014, 74, 1577–1593. [Google Scholar] [CrossRef]
  62. Islam, B.U.; Baharudin, Z.; Raza, M.Q.; Nallagownden, P. Optimization of neural network architecture using genetic algorithm for load forecasting. In Proceedings of the 5th International Conference on Intelligent and Advanced Systems (ICIAS), Kuala Lumpur, Malaysia, 3–5 June 2014; pp. 1–6. [Google Scholar] [CrossRef]
  63. Jha, M.K.; Sahoo, S. Efficacy of neural network and genetic algorithm techniques in simulating spatio-temporal fluctuations of groundwater. Hydrol. Process. 2015, 29, 671–691. [Google Scholar] [CrossRef]
  64. Wang, G.F.; Pang, Y.H.; Liu, F.; Liu, J.Z.H.; Fan, J.D.; Wu, Q.Y.; Meng, X.J.; Xu, Y.J.; Ren, H.W.; Du, Y.B.; et al. Intelligent coal mine classification and grading evaluation index system. Coal Sci. Technol. 2020, 48, 1–13. [Google Scholar] [CrossRef]
  65. Li, S.B.; Li, D.C.; Guo, X.Z. Research and practice of coal mine safety early warning pre-control management. China Coal. 2013, 39, 105–107. [Google Scholar] [CrossRef]
  66. Zhang, Y.H.; Gao, X.; Wang, W.; Cha, X.J. Spatial and temporal differentiation characteristics and influencing factors of coal mine accidents in China. J. Geo-Inf. Sci. 2018, 20, 311–320. [Google Scholar]
Figure 1. BP neural network structure.
Symmetry 13 01082 g001
Figure 2. A three-layer network architecture.
Symmetry 13 01082 g002
Figure 3. FCM clustering result diagram.
Symmetry 13 01082 g003
Figure 4. Error performance curve in BP algorithm.
Symmetry 13 01082 g004
Figure 5. Simulation results of BP prediction data.
Symmetry 13 01082 g005
Figure 6. GA-BP algorithm error performance curve.
Symmetry 13 01082 g006
Figure 7. Simulation results of GA-BP neural network prediction data.
Symmetry 13 01082 g007
Table 1. Safety warning index of coal mining face.
First Class Index The Index The Second Level Index
Human factor (U1)1Ratio of safety management personnel (U11)
2Ratio of safety supervision personnel (U12)
3Ratio of technical personnel (U13)
4Education degree of worker culture in coal mining area (U14)
5The average working age of coal mining workers (U15)
6Monthly safety training (U16)
Equipment factors (U2)7Mechanization level of coal mining (U21)
8The completion rate of supporting equipment (U22)
9Circular completion rate (U23)
10Completion rate of dust prevention equipment (U24)
11Completion rate of firefighting equipment (U25)
12The completion rate of drainage equipment (U26)
13Completion rate of electromechanical equipment (U27)
14Completion rate of transportation equipment (U28)
15Degree of automation of safety monitoring equipment (U29)
Environmental factors (U3)16Prevention and control of coal dust (U31)
17Prevention and management of roof panel (U32)
18Prevention and management of gas (U33)
19Fire prevention and management (U34)
20Flood prevention and management (U35)
Management factors (U4)21Proportion of security funds (U41)
22Improve the implementation of safety management system (U42)
23Improvement of emergency response mechanism (U43)
24Degree of safety inspection implementation (U44)
25Hidden trouble investigation and rectification pass rate (U45)
Table 2. Sample data.
The Sample NumberThe Sample TimeU11U12U13U14U15U16U21U22U23U24U25U26U27
12007/30.6710.8110.8396.9907.7360.7270.7460.8850.8580.8400.9040.8390.876
22007/60.6850.8100.8567.1307.8910.7420.7610.9030.8750.8570.9220.8560.894
32007/90.7000.8460.8757.2918.0690.7580.7780.9240.8940.8760.9430.8750.914
42007/120.6510.7870.8146.7817.5040.7050.7230.8590.8320.8150.8770.8140.850
52008/30.6380.7970.7976.6447.3520.8860.7090.8420.8150.7980.8590.7970.833
62008/60.7350.8880.9197.6568.4720.7960.8170.9700.9390.9200.9900.9190.960
72008/90.8530.9410.9748.8819.8280.9240.9470.9790.9950.9750.8610.9740.950
82008/120.7360.8890.9197.6628.4800.7970.8170.9710.9400.9200.9910.9190.960
92009/30.7430.8980.9297.7398.5640.8050.8250.9800.9490.9300.9690.9290.970
102009/60.7870.9510.9848.1999.0730.8530.8751.0000.9490.9850.9610.8920.932
452018/30.9201.0000.9508.50011.9001.0000.9500.9950.9920.9750.9900.9900.987
462018/60.9500.9800.9508.20012.2001.0000.9600.9960.9910.9800.9960.9900.990
The Sample NumberThe Sample TimeU28U29U31U32U33U34U35U41U42U43U44U45
12007/30.8950.7460.5590.6520.8850.8390.6710.6060.6990.8390.8950.839
22007/60.9130.7610.5700.6650.9030.8560.6850.6180.7130.8560.9130.856
32007/90.9330.7780.5830.6810.9240.8750.7000.6320.7290.8750.9330.875
42007/120.8680.7230.5420.6330.8590.8140.6510.5880.6780.8140.8680.814
52008/30.8500.7090.5320.6200.8420.7970.6380.5760.6640.7970.8500.797
62008/60.9800.8170.6120.7150.9700.9190.7350.6630.7660.9190.9800.919
72008/90.9700.9470.7100.7570.9410.8910.7130.6440.7430.8910.9510.891
82008/120.9810.8170.6130.7150.9710.9190.7360.6640.7660.9190.9810.919
92009/30.9910.8250.6190.7220.9800.9290.7430.6710.7740.9290.9910.929
102009/60.9510.8750.6560.7650.9150.9840.7870.7110.8200.9840.9500.984
452018/30.9900.9500.9100.9300.9900.9900.9750.9000.9500.9501.0001.000
462018/60.9910.9600.9100.9500.9900.9900.9700.9000.9500.9501.0001.000
Table 3. Optimal class center vector.
Characteristic ValueClustering Center
v1v2v3
U110.43370.61380.1246
U120.75900.87880.1614
U130.81810.67150.2362
U140.45860.56740.1256
U150.32690.63160.0945
U160.23980.87570.2398
U210.55190.55190.7019
U220.77860.87860.3025
U230.69460.85980.2541
U240.81610.78990.2357
U250.73380.86820.3403
U260.52060.83200.2333
U270.63520.83170.2905
U280.72130.88730.3342
U290.58860.77590.1683
U310.33480.77120.0881
U320.41630.77040.1153
U330.55490.88680.3054
U340.82480.81080.2340
U350.44030.83330.1170
U410.39340.55320.1072
U420.48530.76560.1387
U430.13870.60400.2327
U440.70530.54390.3602
U450.82680.82730.2353
Table 4. FCM clustering results.
SampleClustering Results
1, 2, 3, 4, 5, 6, 8, 9, 25, 26, 27I
38, 39, 40, 41, 42, 43, 44, 45, 46II
7, 10, 11, 12, 13, 15, 16, 18, 19, 21, 22, 25, 26, 29, 30, 32, 33, 35, 36, 37III
Table 5. Training sample data.
The Input Sample Data
The Sample NumberThe Sample TimeU11U12U13U14U15U16U21U22U23U24
12008/90.02280.03230.03590.89690.63000.03050.03300.03650.03820.0360
22009/60.01560.03500.03900.89620.77100.02140.02600.03410.03480.0391
32009/90.01550.03510.03890.89610.83200.02670.02590.04080.03480.0390
42009/120.01560.03510.03910.89610.70200.02720.02600.04090.03490.0392
52010/30.01570.03520.03900.89610.91300.02370.02610.04090.03490.0391
62010/60.01560.03510.03900.89601.00000.02330.02590.03640.03480.0391
72010/90.01570.03510.03900.89610.97400.04310.02600.03640.03500.0391
82010/120.01560.03510.03890.89610.96000.05330.02590.03630.03480.0390
92011/30.01560.03510.03900.89611.00000.03340.02600.03630.03490.0391
102011/60.01570.03510.03890.89611.00000.00000.02600.03630.03490.0391
The Sample NumberThe Sample TimeU25U26U27U28U29U31U32U33U34U35
12008/90.02360.03590.03330.03550.03300.00720.01230.03230.02690.0075
22009/60.03620.02800.03280.03500.02600.17150.01290.03080.03900.0156
32009/90.03630.02800.03270.03510.02590.16910.01290.03070.03890.0155
42009/120.03630.02810.03280.03510.02600.35200.01310.03090.03910.0156
52010/30.03640.02810.03280.03520.02610.37130.01300.03090.03900.0157
62010/60.03630.02800.03270.03510.02590.32300.01300.03090.03900.0156
72010/90.03640.02810.03280.03520.02600.13570.01310.03090.03900.0157
82010/120.03620.02790.03270.03510.02590.35710.01300.03080.03890.0156
92011/30.03630.02810.03280.03510.02600.32110.01310.03090.03900.0156
102011/60.03630.02800.03280.03510.02600.00000.01310.03090.03890.0157
The Sample NumberThe Sample TimeU41U42U43U44U45
12008/90.00000.01080.02690.03340.0269
22009/60.00650.01950.03900.03490.0390
32009/90.00650.01940.03890.03490.0389
42009/120.00650.01960.03910.03500.0391
52010/30.00660.01950.03900.03500.0390
62010/60.00650.01950.03900.03500.0390
72010/90.00650.01950.03900.03500.0390
82010/120.00650.01950.03890.03490.0389
92011/30.00650.01950.03900.03500.0390
102011/60.00650.01950.03890.03500.0389
Expected outputs
2008/92009/62009/92009/122010/32010/62010/92010/122011/32011/6
00010001000010000100010000100010000100001000010000
Table 6. Test sample data.
The Input Sample Data
The Sample NumberThe Sample TimeU11U12U13U14U15U16U21U22U23U24
12014/120.00000.02260.02520.94970.97500.02470.01890.03020.02520.0233
22015/30.01050.03010.03011.00000.97680.03600.03010.03250.03010.0279
32016/60.01050.03020.03021.00000.97120.02570.03020.03250.03020.0279
The Sample NumberThe Sample TimeU25U26U27U28U29U31U32U33U34U35
12014/120.02910.02520.02590.02640.01260.00000.00630.02640.02640.0138
22015/30.03420.03090.03130.03250.01980.01050.01980.03130.03010.0244
32016/60.03430.03090.03140.03250.01970.01050.01970.03140.03020.0244
The sample numberThe Sample timeU41U42U43U44U45
12014/120.00130.00630.02260.02390.0226
22015/30.00000.01270.02550.03010.0313
32016/60.014
Expected outputs
2014/122015/32016/6
000100100001000
Table 7. BP neural network operation basic parameters table.
ParameterValue
Input layer node number25
The node of hidden layer number14
Learning rate0.001
Training functiontrainlm
The performance target value0.00001
The output layer node1
Maximum number of training steps2000
Hidden layer1
Table 8. Table of basic parameters and operation mode of genetic algorithm.
ParameterValue
Initial population number50
Genetic algebra100
Crossover probability0.3
Mutation probabilitytrainlm
EncodingReal coding
Selection OperationFitness scaling
Crossover operationArithmetic intersection
Mutation operationUniform variation
Table 9. Early warning result output table.
Early Warning Result
0.32360.40200.21310.20470.8593
Publisher’s Note: MDPI stays neutral with regard to jurisdictional claims in published maps and institutional affiliations.

