Article

Optimization Models for Efficient (t, r) Broadcast Domination in Graphs

by
Poompol Buathong
1 and
Tipaluck Krityakierne
1,2,*
1
Department of Mathematics, Faculty of Science, Mahidol University, Bangkok 10400, Thailand
2
Centre of Excellence in Mathematics, CHE, Bangkok 10400, Thailand
*
Author to whom correspondence should be addressed.
Symmetry 2021, 13(6), 1028; https://doi.org/10.3390/sym13061028
Submission received: 16 May 2021 / Revised: 1 June 2021 / Accepted: 3 June 2021 / Published: 8 June 2021
(This article belongs to the Special Issue Modelling and Simulation of Natural Phenomena of Current Interest)

Abstract

:
Known to be NP-complete, domination number problems in graphs and networks arise in many real-life applications, ranging from the design of wireless sensor networks and biological networks to social networks. Initially introduced by Blessing et al., the ( t , r ) broadcast domination number is a generalization of the distance domination number. While some theoretical approaches have been addressed for small values of t , r in the literature; in this work, we propose an approach from an optimization point of view. First, the ( t , r ) broadcast domination number is formulated and solved using linear programming. The efficient broadcast, whose wasted signals are minimized, is then found by a genetic algorithm modified for a binary encoding. The developed method is illustrated with several grid graphs: regular, slant, and king’s grid graphs. The obtained computational results show that the method is able to find the exact ( t , r ) broadcast domination number, and locate an efficient broadcasting configuration for larger values of t , r than what can be provided from a theoretical basis. The proposed optimization approach thus helps overcome the limitations of existing theoretical approaches in graph theory.

1. Introduction

Consider a connected graph G = V ( G ) , E ( G ) with a vertex set V ( G ) and an edge set E ( G ) . A dominating set of the graph G is defined as a subset of vertices D V ( G ) such that every vertex v V ( G ) \ D is adjacent to at least one vertex in D. The domination number of the graph G, denoted by γ ( G ) , is the minimum size of dominating sets. A variant of broadcast domination depending on two integer parameters t and r was introduced by Blessing et al. [1]. This class of domination is called the ( t , r ) broadcast domination. We denote the distance between any two vertices u , v V ( G ) by d ( u , v ) . For example, d ( u , v ) can be defined as the number of edges in a shortest path connecting u and v. Let us now state required definitions:
Definition 1.
A vertex v V ( G ) is called a broadcasting vertex or tower of transmission t if it broadcasts a transmission of strength t d ( u , v ) to its neighbor vertex u with d ( u , v ) < t .
Definition 2.
Given a set of broadcasting towers S V ( G ) of transmission strength t, the reception at any vertex u V ( G ) , denoted by r ( u ) , is the sum of transmissions that vertex u receives from all broadcasting neighbors v S with d ( u , v ) < t , i.e., r ( u ) = v S max ( t d ( v , u ) , 0 ) .
Definition 3.
We say that a subset of broadcasting towers S V ( G ) of transmission strength t is a ( t , r ) broadcast dominating set of the graph G if every vertex u V ( G ) receives the reception at least r, i.e., r ( u ) r , u V ( G ) .
Definition 4.
A minimum ( t , r ) broadcast dominating set is a ( t , r ) broadcast dominating set of smallest size for a given graph G. The ( t , r ) broadcast domination number of the graph G, denoted by γ ( t , r ) , is the size of a minimum ( t , r ) broadcast dominating set.
Over the last decade, there have been a few theoretical studies on the ( t , r ) broadcast domination problems. This includes, for example, the work by Blessing et al. [1] that provided the exact ( t , r ) broadcast domination numbers for small grid graphs, and identified upper bounds of the ( t , r ) broadcast domination numbers for large grid graphs. Crepeau et al. [2] studied the ( t , r ) broadcast domination numbers for finite 2-D grid, 3-D tower, slant and lattice graph types. Some studies have also extended the ( t , r ) broadcast domination to infinite graphs such as the infinite Z 2 grid [3,4] and a triangular lattice [5]. While a linear programming model has been applied to obtain some domination parameters, e.g., strong domination, restrained domination and strong restrained domination [6], weighted total domination [7], double roman domination [8], none of these work have applied the method to solve the ( t , r ) broadcast domination number.
Through mathematical optimization, our contribution is therefore identifying the ( t , r ) broadcast domination numbers for larger-scale graphs for which no solutions are known within the theoretical framework. We apply our proposed method to solve three types of finite grid graphs, namely, regular, slant and king’s grid graphs with various values of t and r. The difference between these graphs is mainly the diagonal edges as shown in Figure 1. In addition, an efficient broadcasting configuration will also be specified using a modified genetic algorithm for a binary encoding.
The remainder of this paper is structured as follows. Section 2 presents a mathematical model for the ( t , r ) broadcast domination number problems. A description of an efficient broadcast and the optimization framework used to find an efficient broadcasting configuration are detailed in Section 3. Numerical experiments and results including some corrections to Blessing et al.’s results presented in [1] are discussed in Section 4. Finally, Section 5 gives the limitation of the research work and the future directions.

2. Linear Programming for the ( t , r ) Broadcast Domination Number

Consider an m × n grid graph. Assigning an index to every vertex i = 1 , 2 , , m n in the graph, we define v i as a binary decision variable: v i = 1 if the vertex i is chosen to place a broadcasting tower of transmission t, and zero otherwise. Let R be an m n × m n reception matrix whose row i column j element R i j is a reception strength at vertex i obtained from a broadcasting tower of transmission strength t located at vertex j.
A linear programming model for the ( t , r ) broadcast domination number can be formulated as follows:
γ ( t , r ) : = minimize i = 1 m n v i
subject to : R v 1 v 2 v m n r r r
v i { 0 , 1 } i = 1 , 2 , , m n .
The objective (1) is to minimize the number of required broadcasting towers. Constraint (2) ensures that every vertex receives adequate reception of strength at least r (as defined in Definition 3). The optimal value to this linear programming problem is precisely the ( t , r ) broadcast domination number defined in Definition 4.

3. Optimization Modelling for an Efficient Broadcast

Given a graph G = V ( G ) , E ( G ) and a subset of broadcasting towers S V ( G ) , we define O ( S ) to be an “overlapping” set containing those vertices v V ( G ) which receive signals from more than one broadcasting towers.
An efficient broadcast, as defined in [2,5], can be any ( t , r ) broadcast dominating set that minimizes total wasted signals at those vertices v O ( S ) , and not necessarily a minimum ( t , r ) broadcast dominating set. That is, the number of broadcasting towers of an efficient broadcast does not need to be γ ( t , r ) . In this work, we are interested in finding an efficient broadcasting configuration when the number of broadcasting towers is also the ( t , r ) broadcast domination number, γ ( t , r ) . This class of efficient broadcasting configurations is very well applicable, e.g., if the expense for installing one more tower dominates that of the waste at those vertices whose signal strength exceeds the level r by a small amount.
For this reason, we shall restrict our focus to the class of minimum ( t , r ) broadcast dominating sets of the graph G denoted by B γ ( t , r ) .
Definition 5.
Consider a graph G = ( V ( G ) , E ( G ) ) . We say that a configuration of broadcasting towers S V ( G ) is in the class B γ ( t , r ) if it satisfies two properties:
(1)
S is a ( t , r ) broadcast dominating set of G.
(2)
The number of broadcasting towers of S is γ ( t , r ) .
We now define a class of γ ( t , r ) efficient broadcasts.
Definition 6.
A minimum ( t , r ) broadcast dominating set of a graph G is said to be a γ ( t , r ) efficient broadcast, denoted by S γ ( t , r ) * , if
S γ ( t , r ) * arg min S B γ ( t , r ) v O ( S ) ( r ( v ) r ) .
Here, we search for an efficient broadcast among those configurations in the class B γ ( t , r ) . To find a γ ( t , r ) efficient broadcasting configuration S γ ( t , r ) * , we convert the problem in (4) into an equivalent unconstrained minimization problem with the objective function
f ( S ) = v O ( S ) max ( r ( v ) r , 0 ) + M v V ( G ) max r r ( v ) , 0 + M | # S γ ( t , r ) | , subject to S S
where the feasible set S contains all possible broadcast configurations without any restriction (with any number of towers), M is a sufficiently large positive number and # S denotes the number of towers in the configuration S.
The first term in (5) is the summation of wasted signals at those vertices in the overlapping set O ( S ) whose reception exceeds the required level r. As our feasible region is B γ ( t , r ) , the second and third terms ensure that a configuration S possess properties 1 and 2 of Definition 5, respectively. Any violation is subjected to the penalty cost M. Note that if the last term, which forces the number of broadcasting towers in a configuration S to be exactly equal to γ ( t , r ) , is removed, the objective function can be used to find an efficient broadcast considered in [2,5].

4. Numerical Experiments and Results

In this section, we present the results of our studies on the linear programming problem for the ( t , r ) broadcast domination number, followed by results of the γ ( t , r ) efficient broadcast via a genetic algorithm modified for binary encoding.

4.1. Finding a ( t , r ) Broadcast Domination Number

To solve the problem of ( t , r ) broadcast domination number as detailed in Section 2, we define the distance between any two vertices, computed as part of the reception coefficient matrix R in (3), as the number of edges in a shortest path connecting them.
First, we consider those problems studied in Blessing et al. [1] where the values of ( t , r ) are fixed to ( 2 , 2 ) and ( 3 , 1 ) , and only a grid graph of varying sizes m × n , 1 m , n 10 are considered. We use the notation G m × n for an m × n regular grid graph. Note that the results of ( t , r ) broadcast domination numbers in [1] were obtained by solving a dynamic programming algorithm coded in SAGE.
The compared results of G m × n for ( t , r ) equal to ( 2 , 2 ) and ( 3 , 1 ) are given in Table 1 and Table 2, respectively. The left panel presents the results from Blessing et al. [1], and the right one illustrates our results obtained by solving the formulated LP model. Since swapping the two numbers m , n simply means rotating a symmetric grid graph, we only provide results in the lower triangular table. This leads to finding ( t , r ) broadcast domination numbers for 55 different grid-size problems.
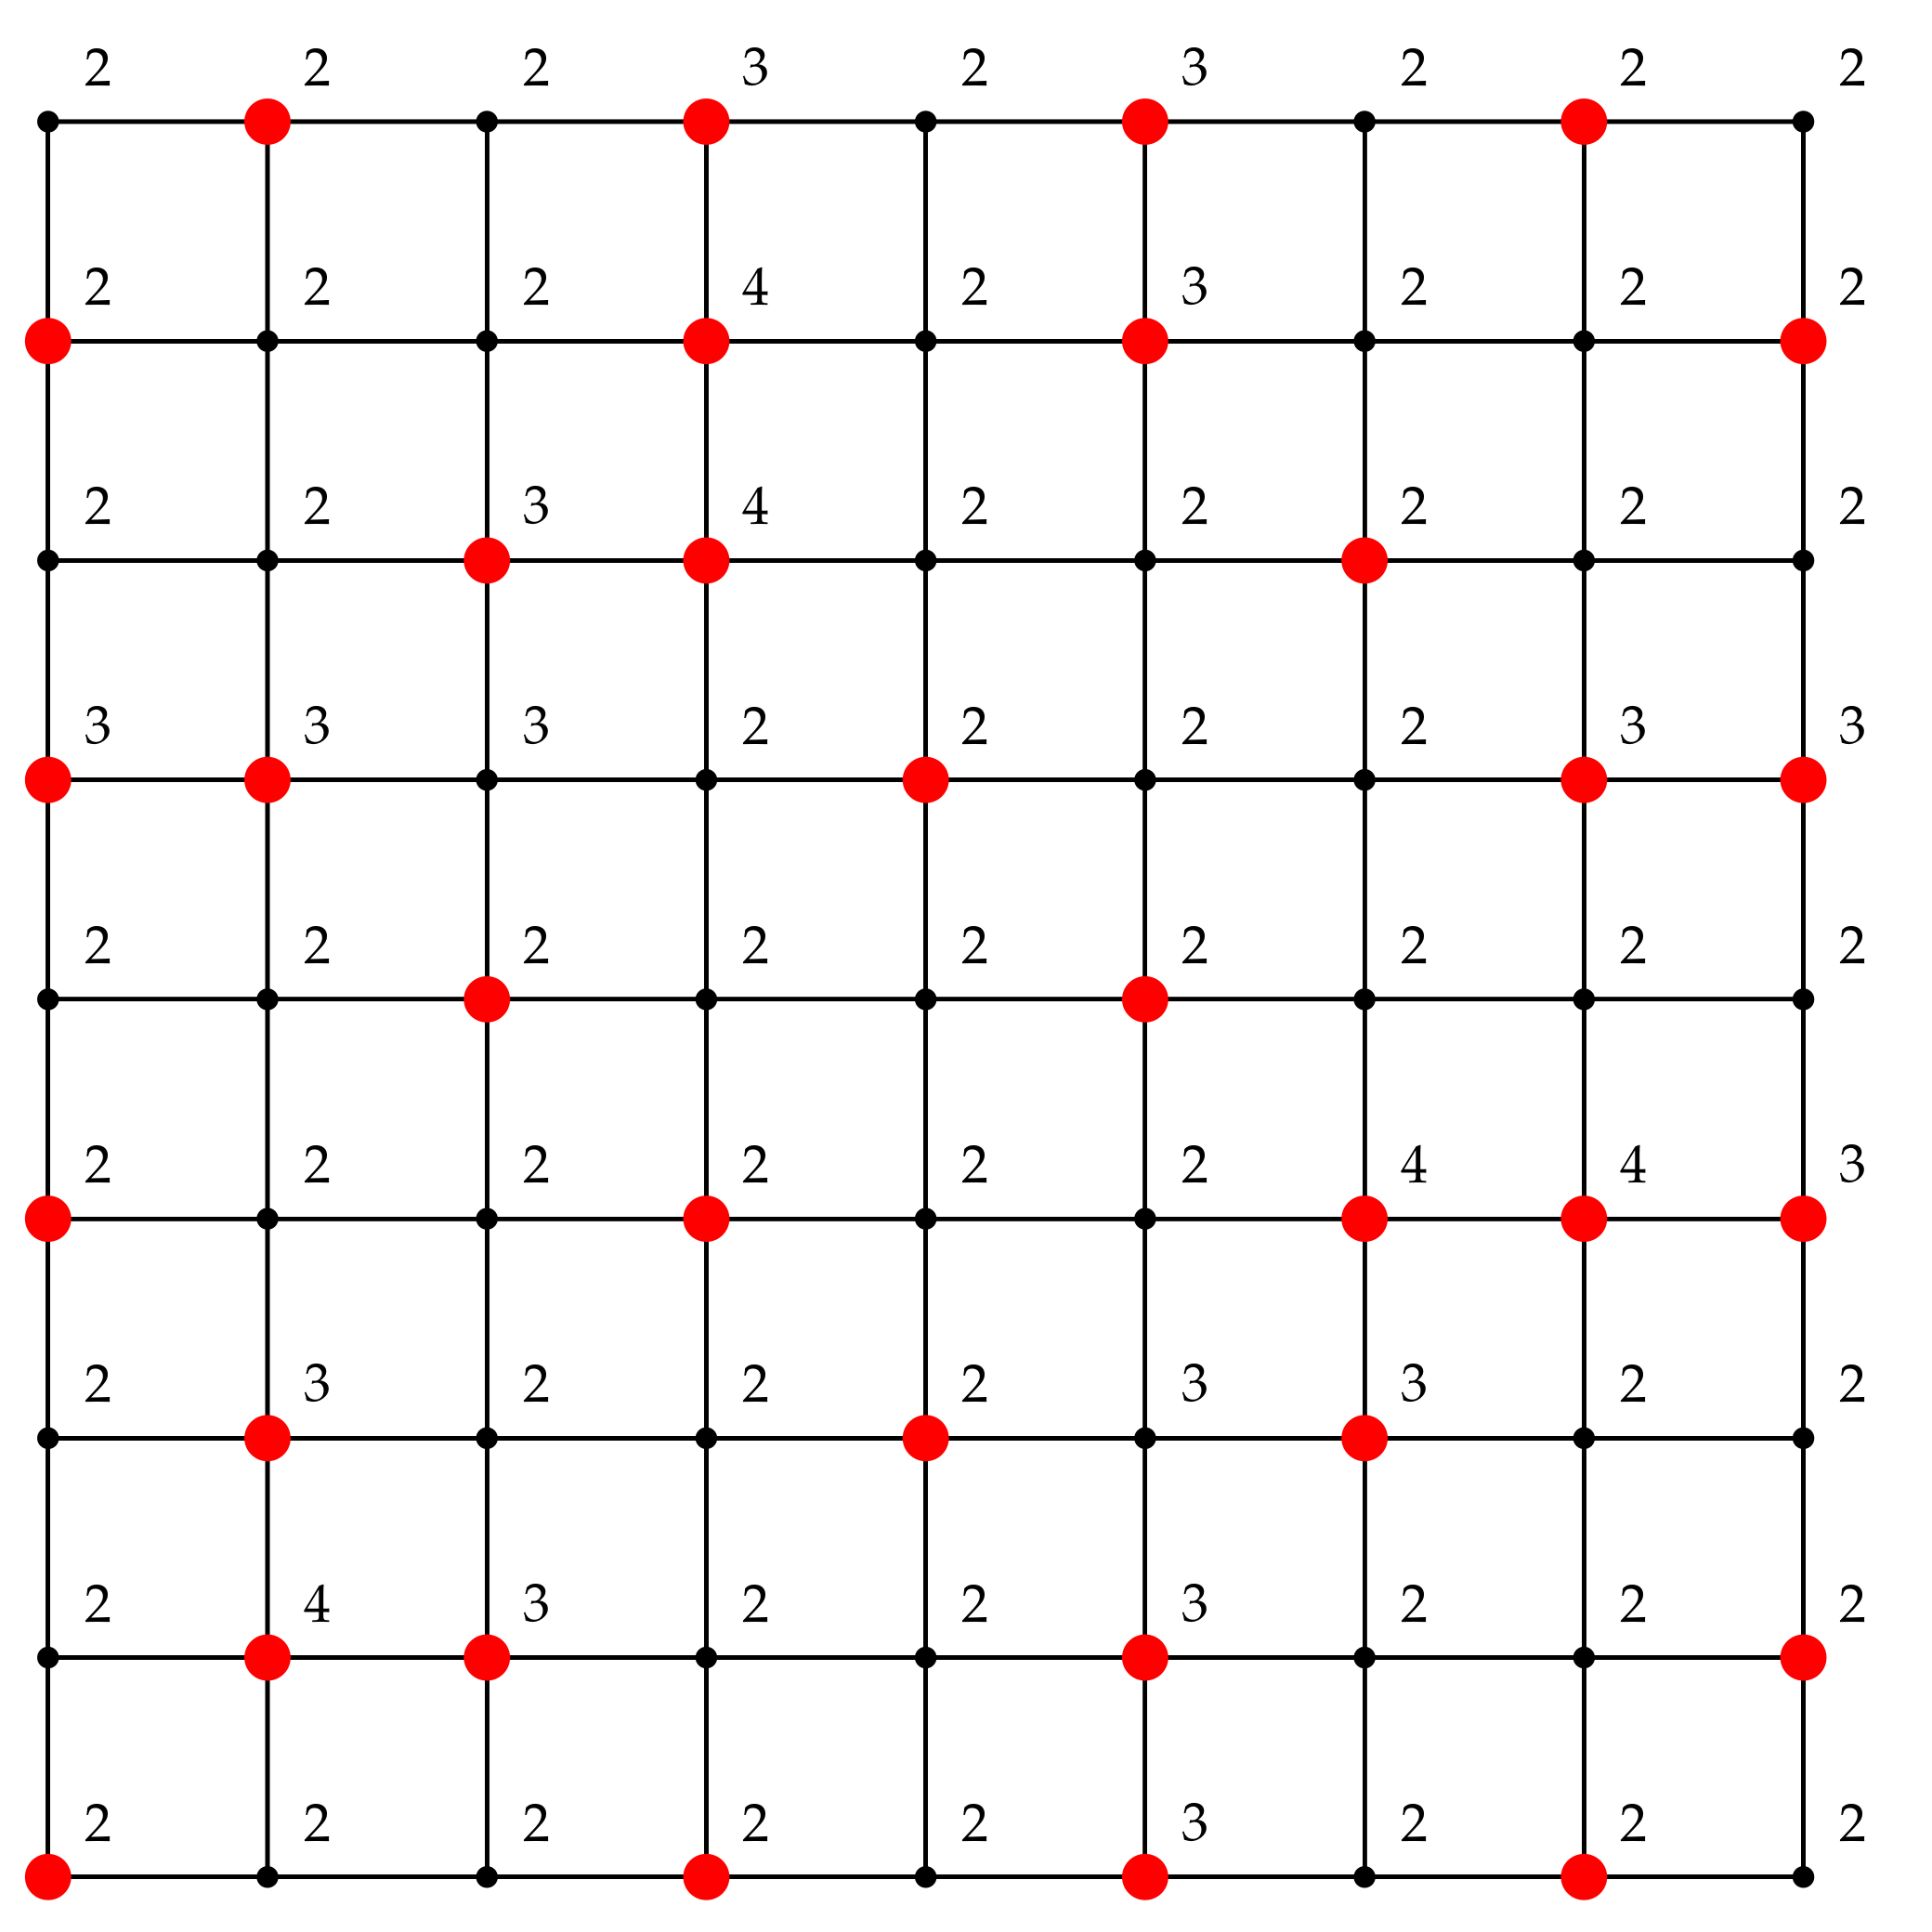
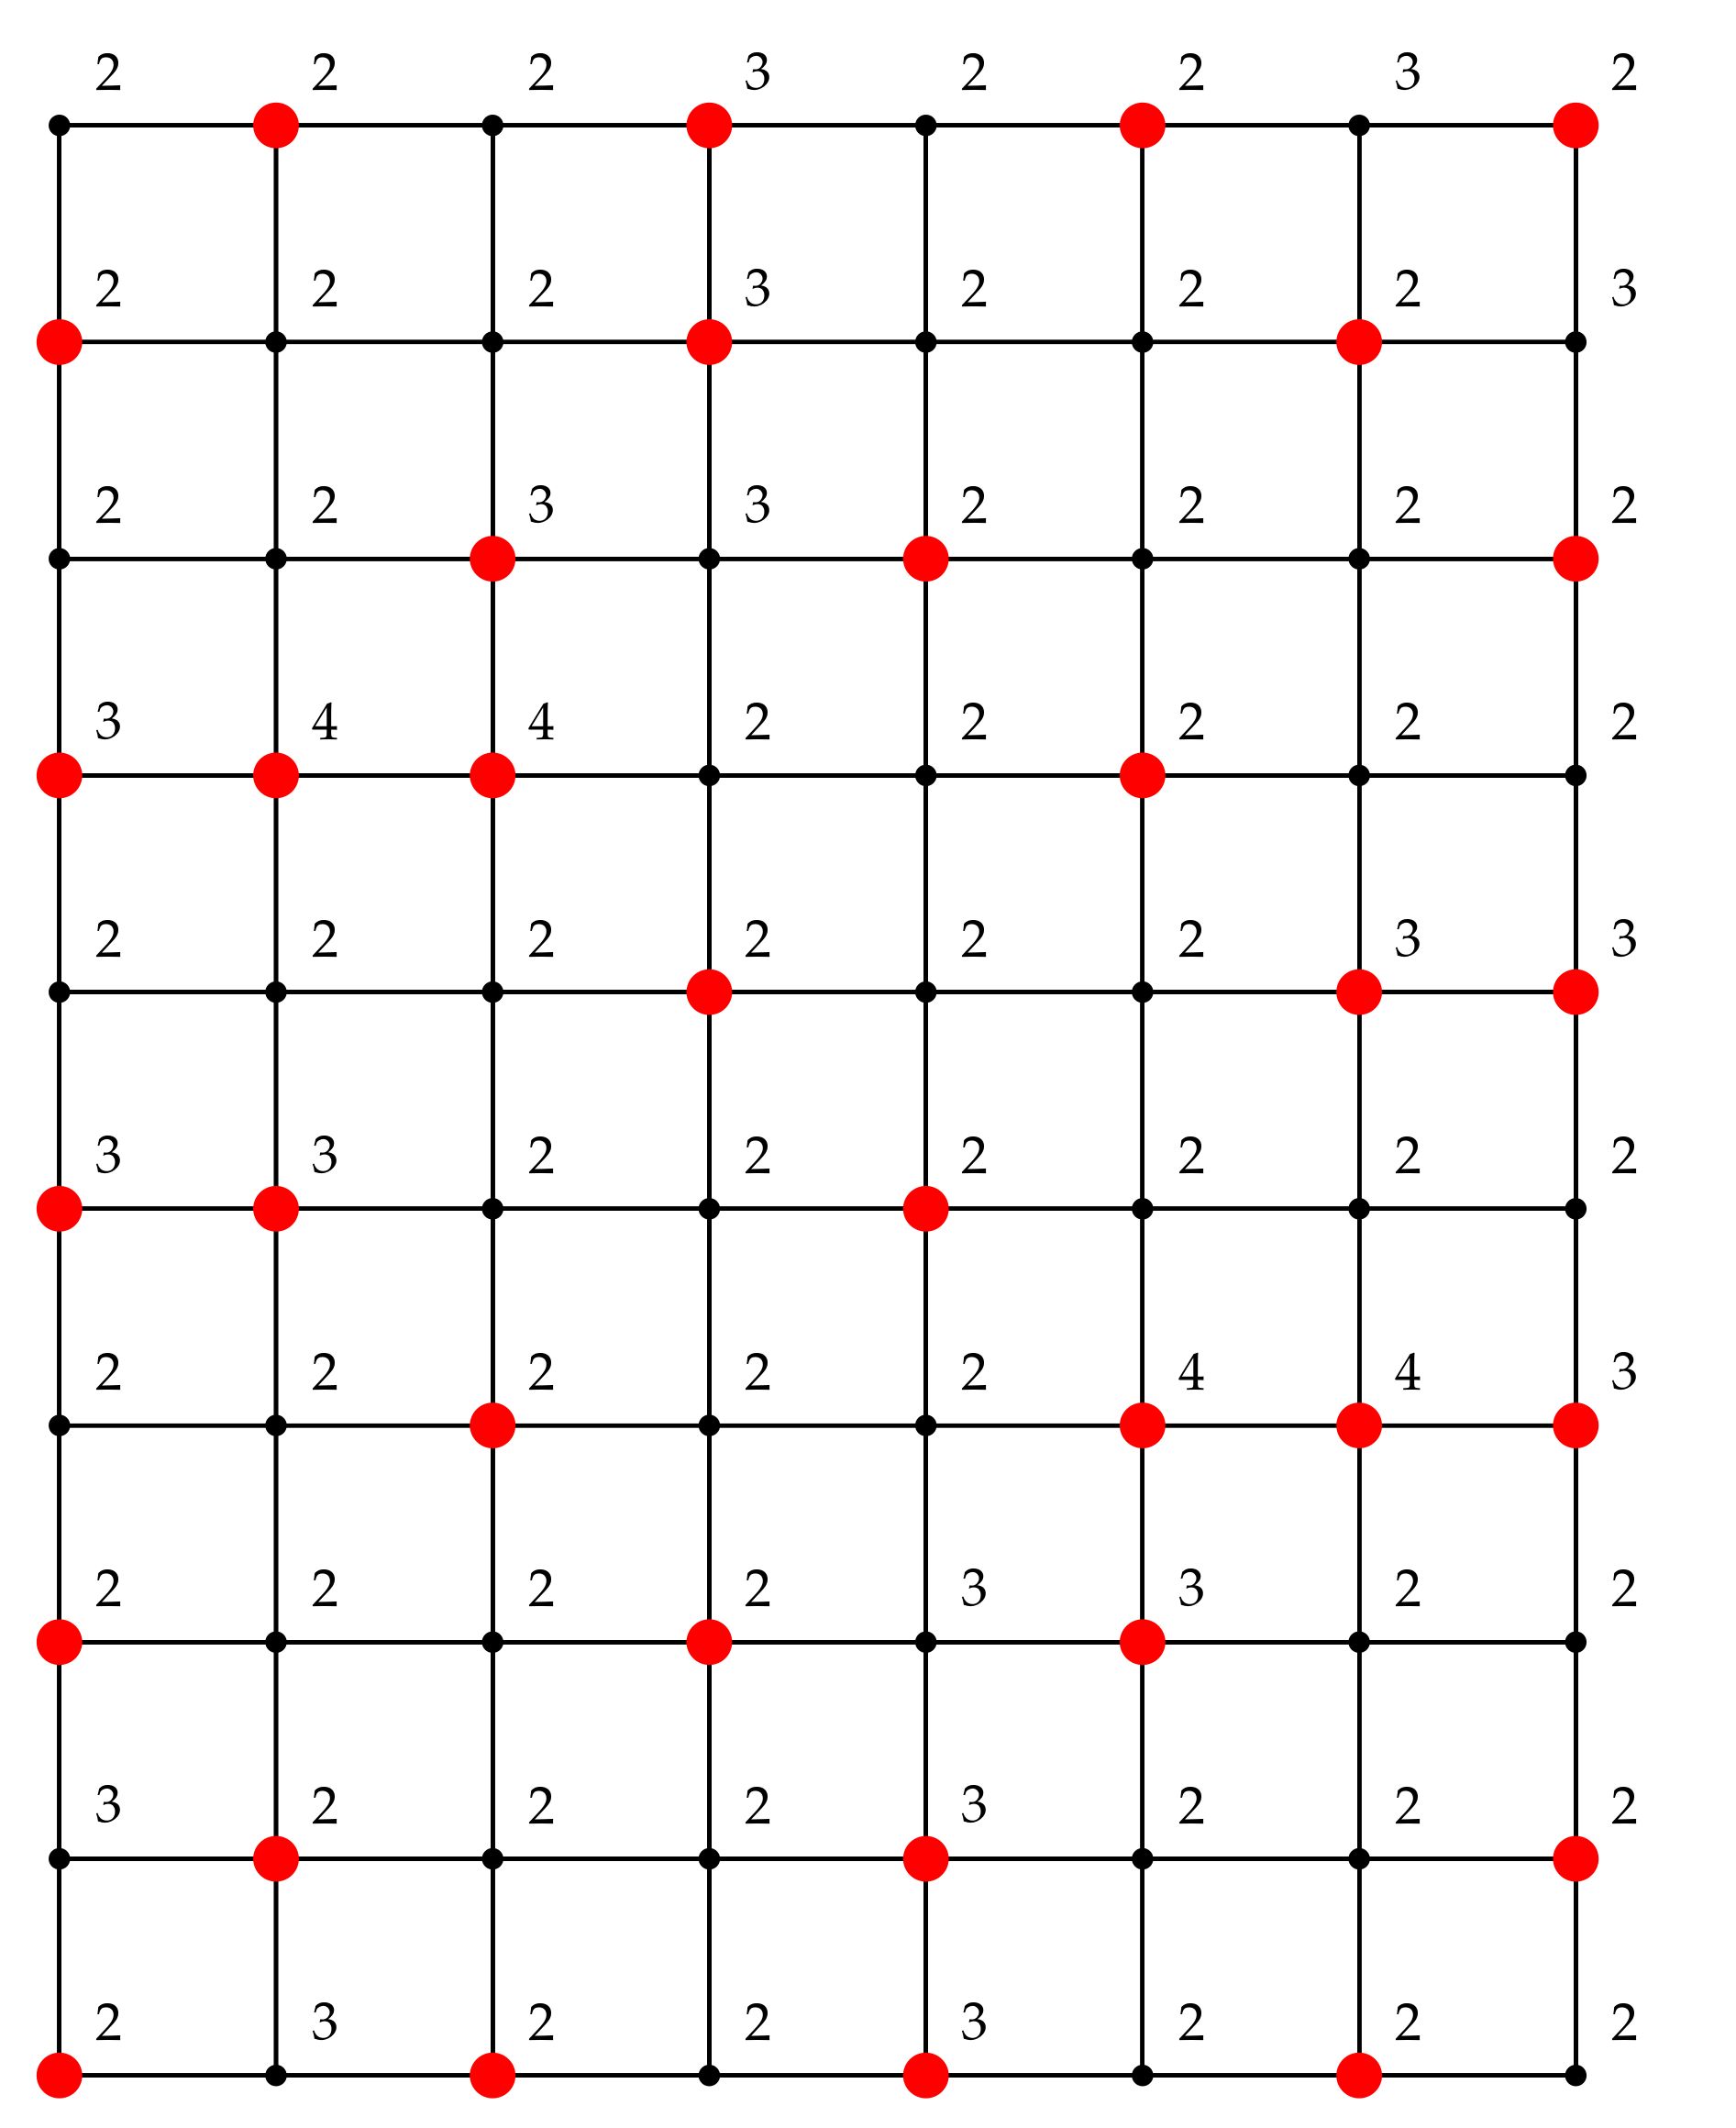
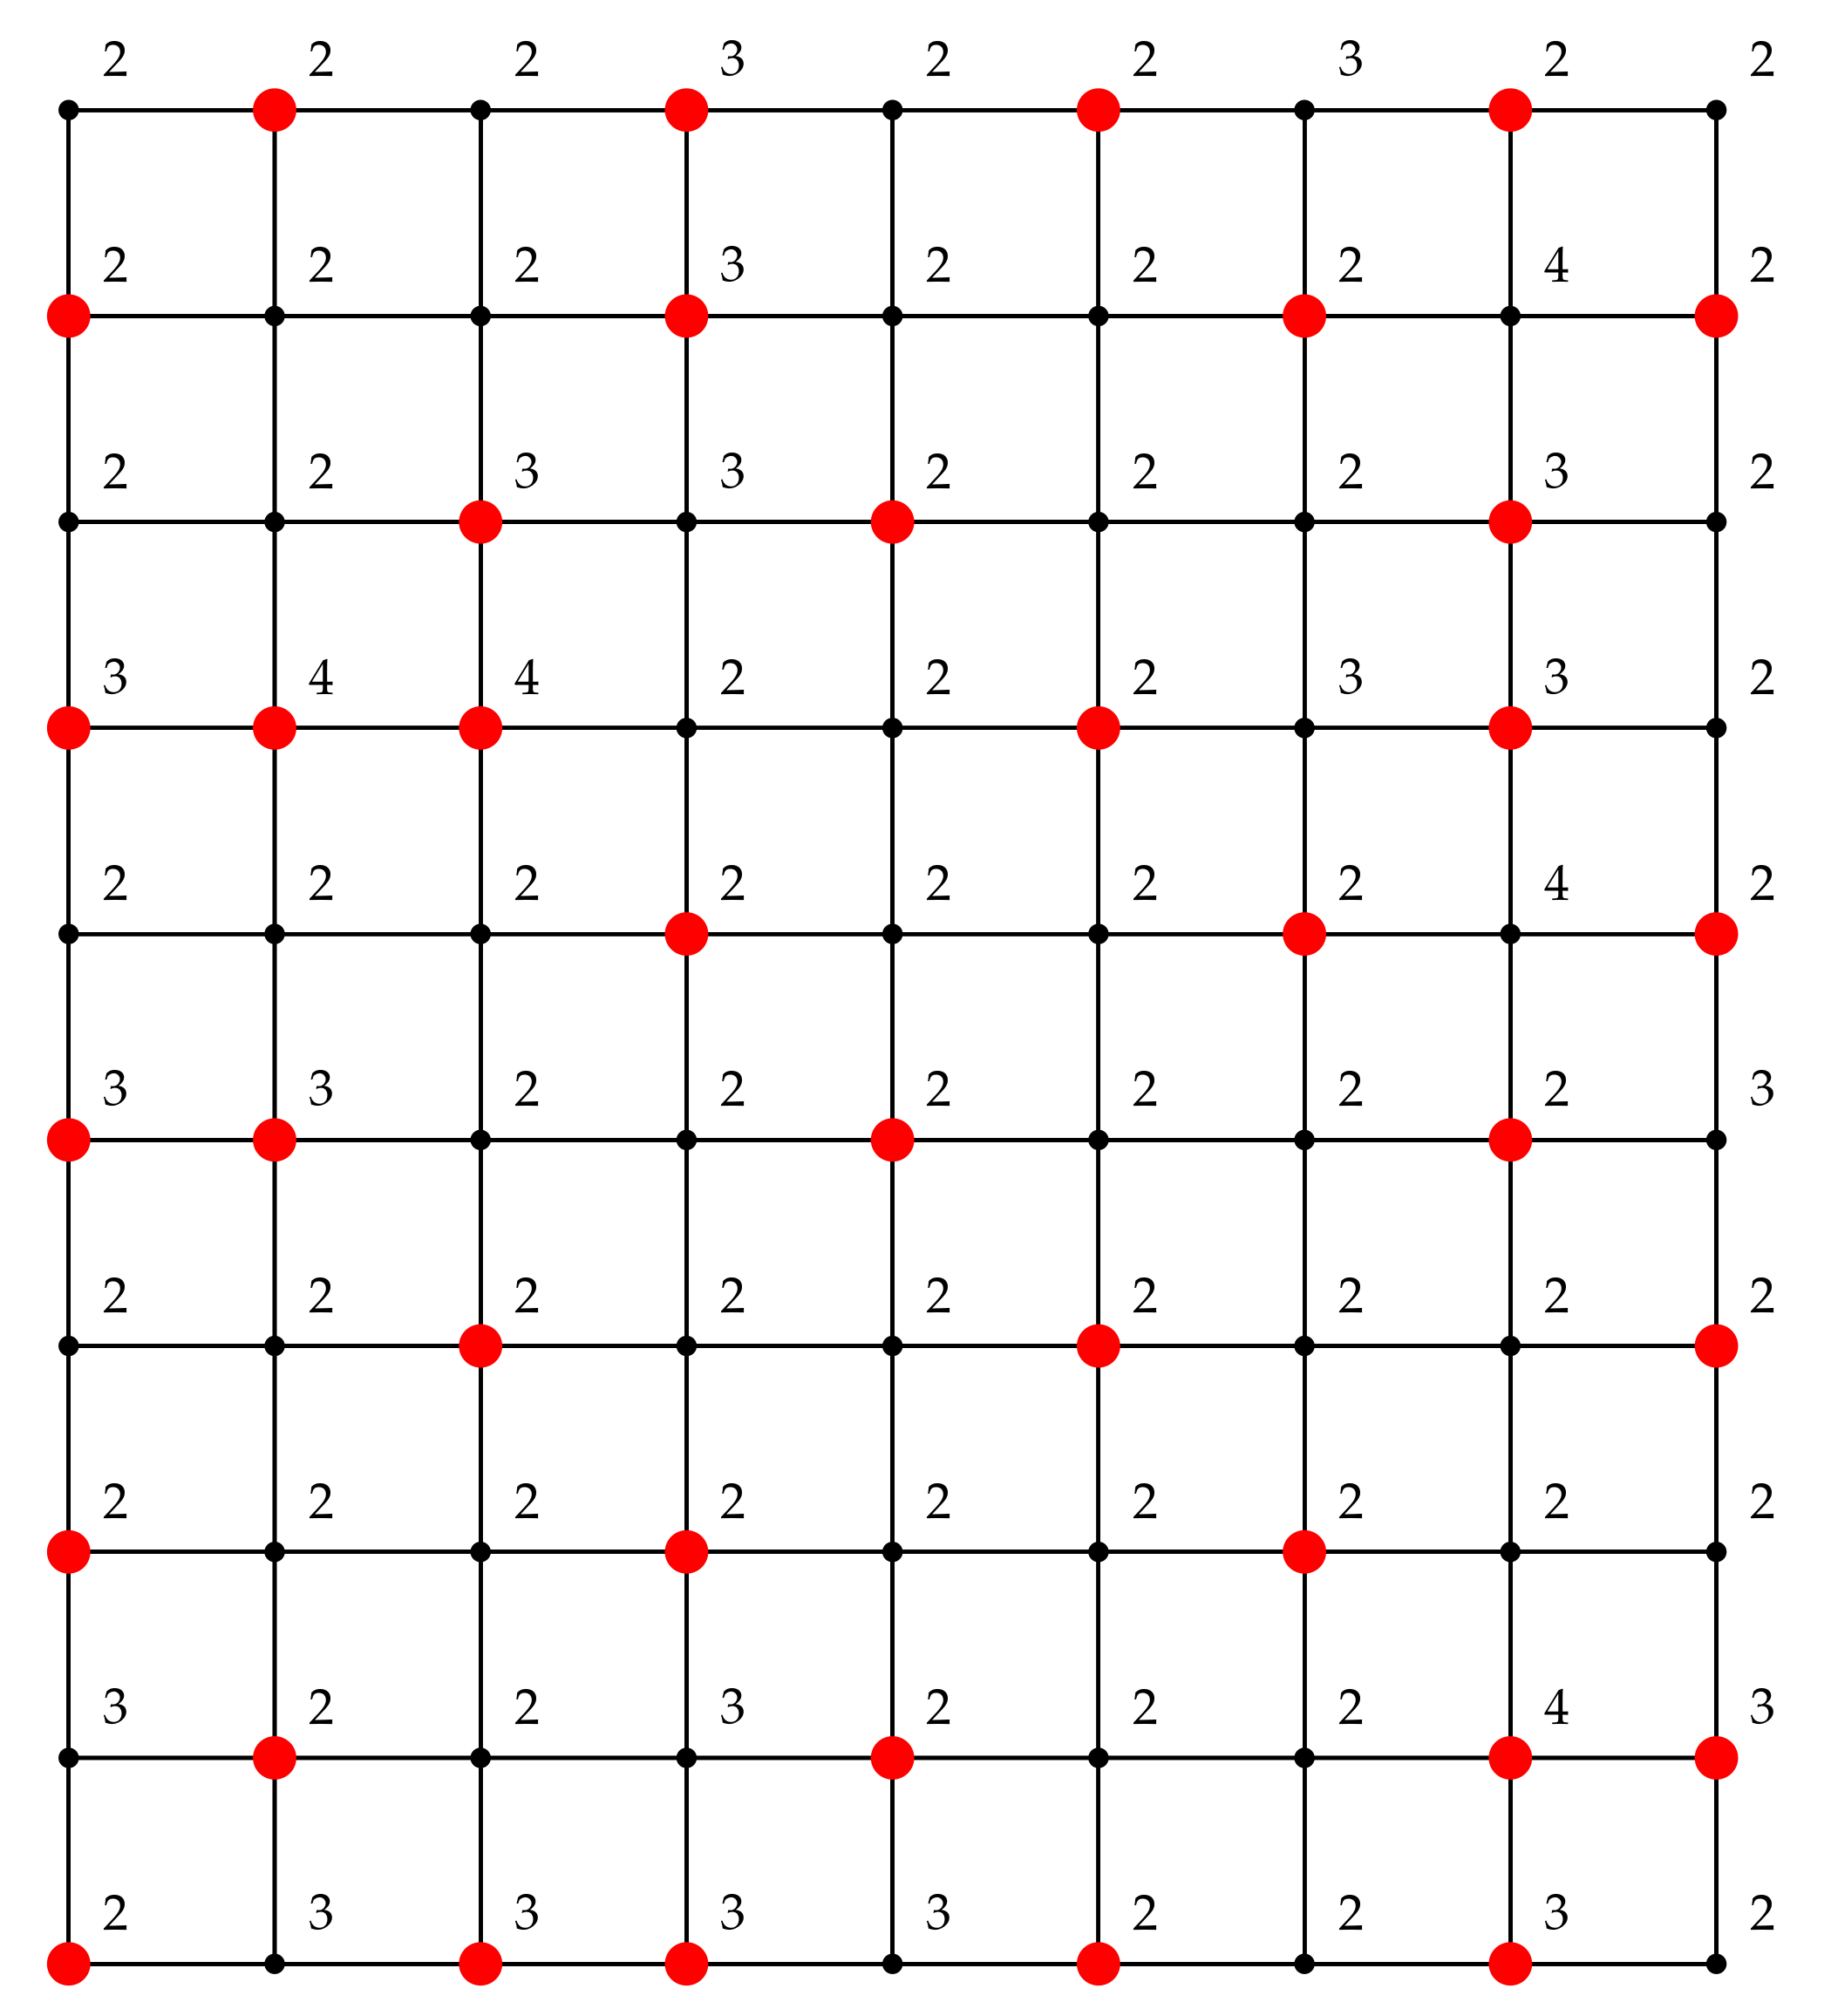
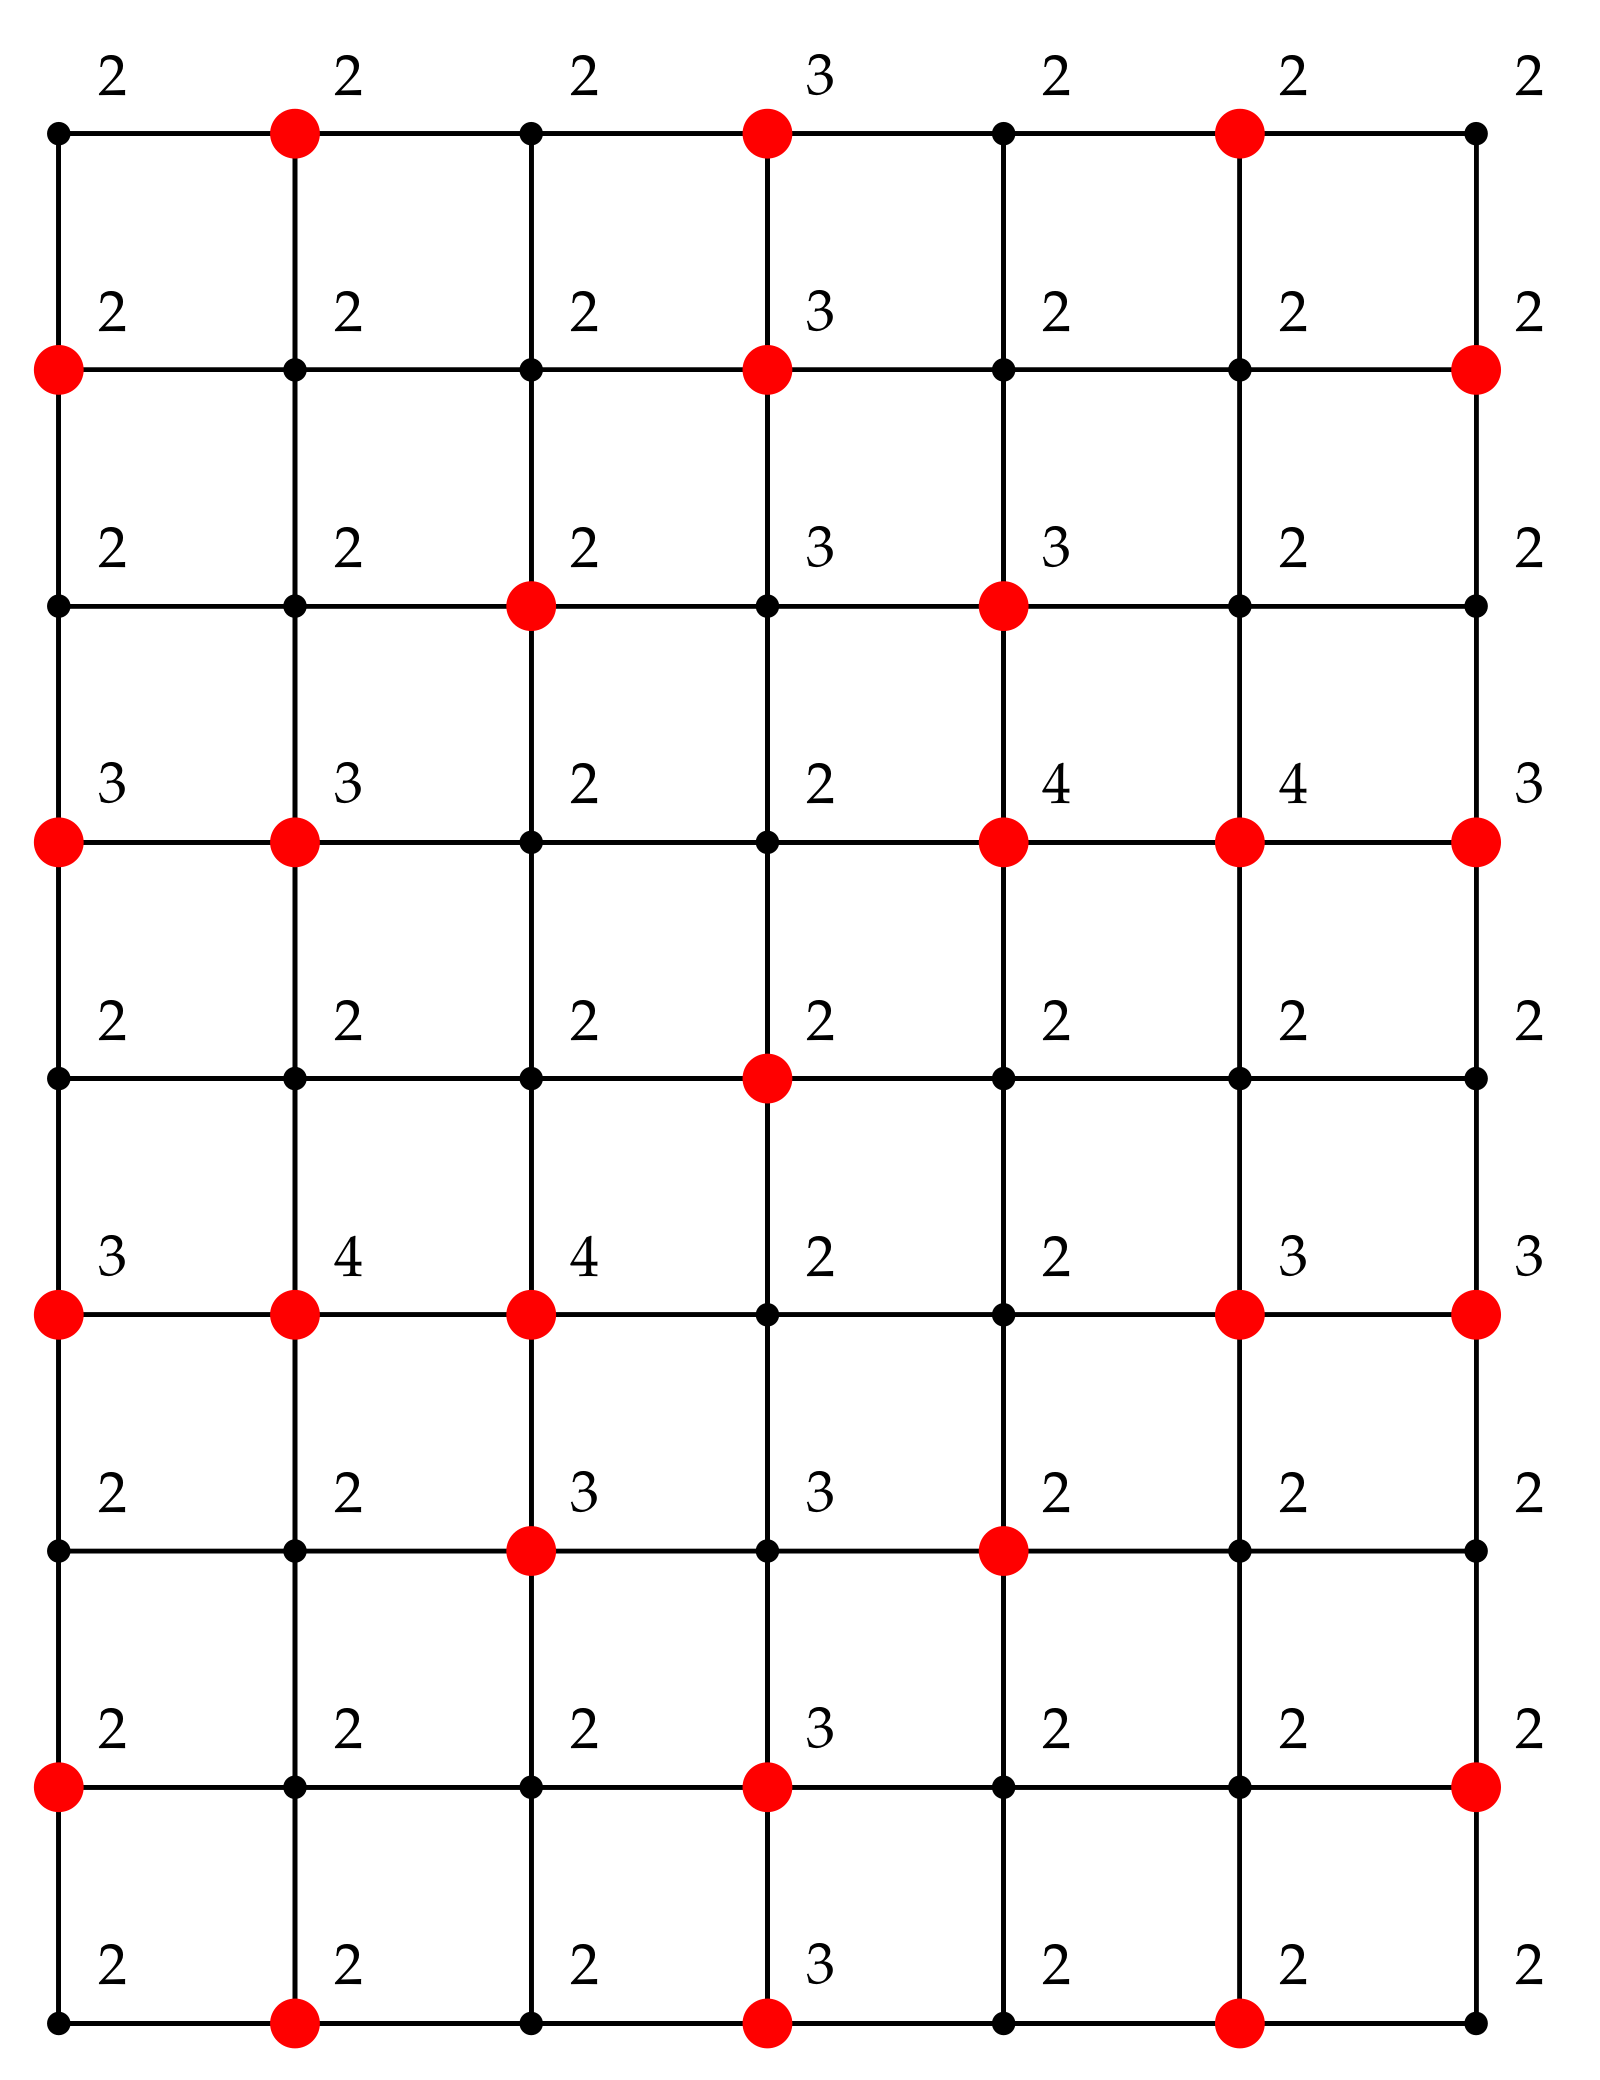
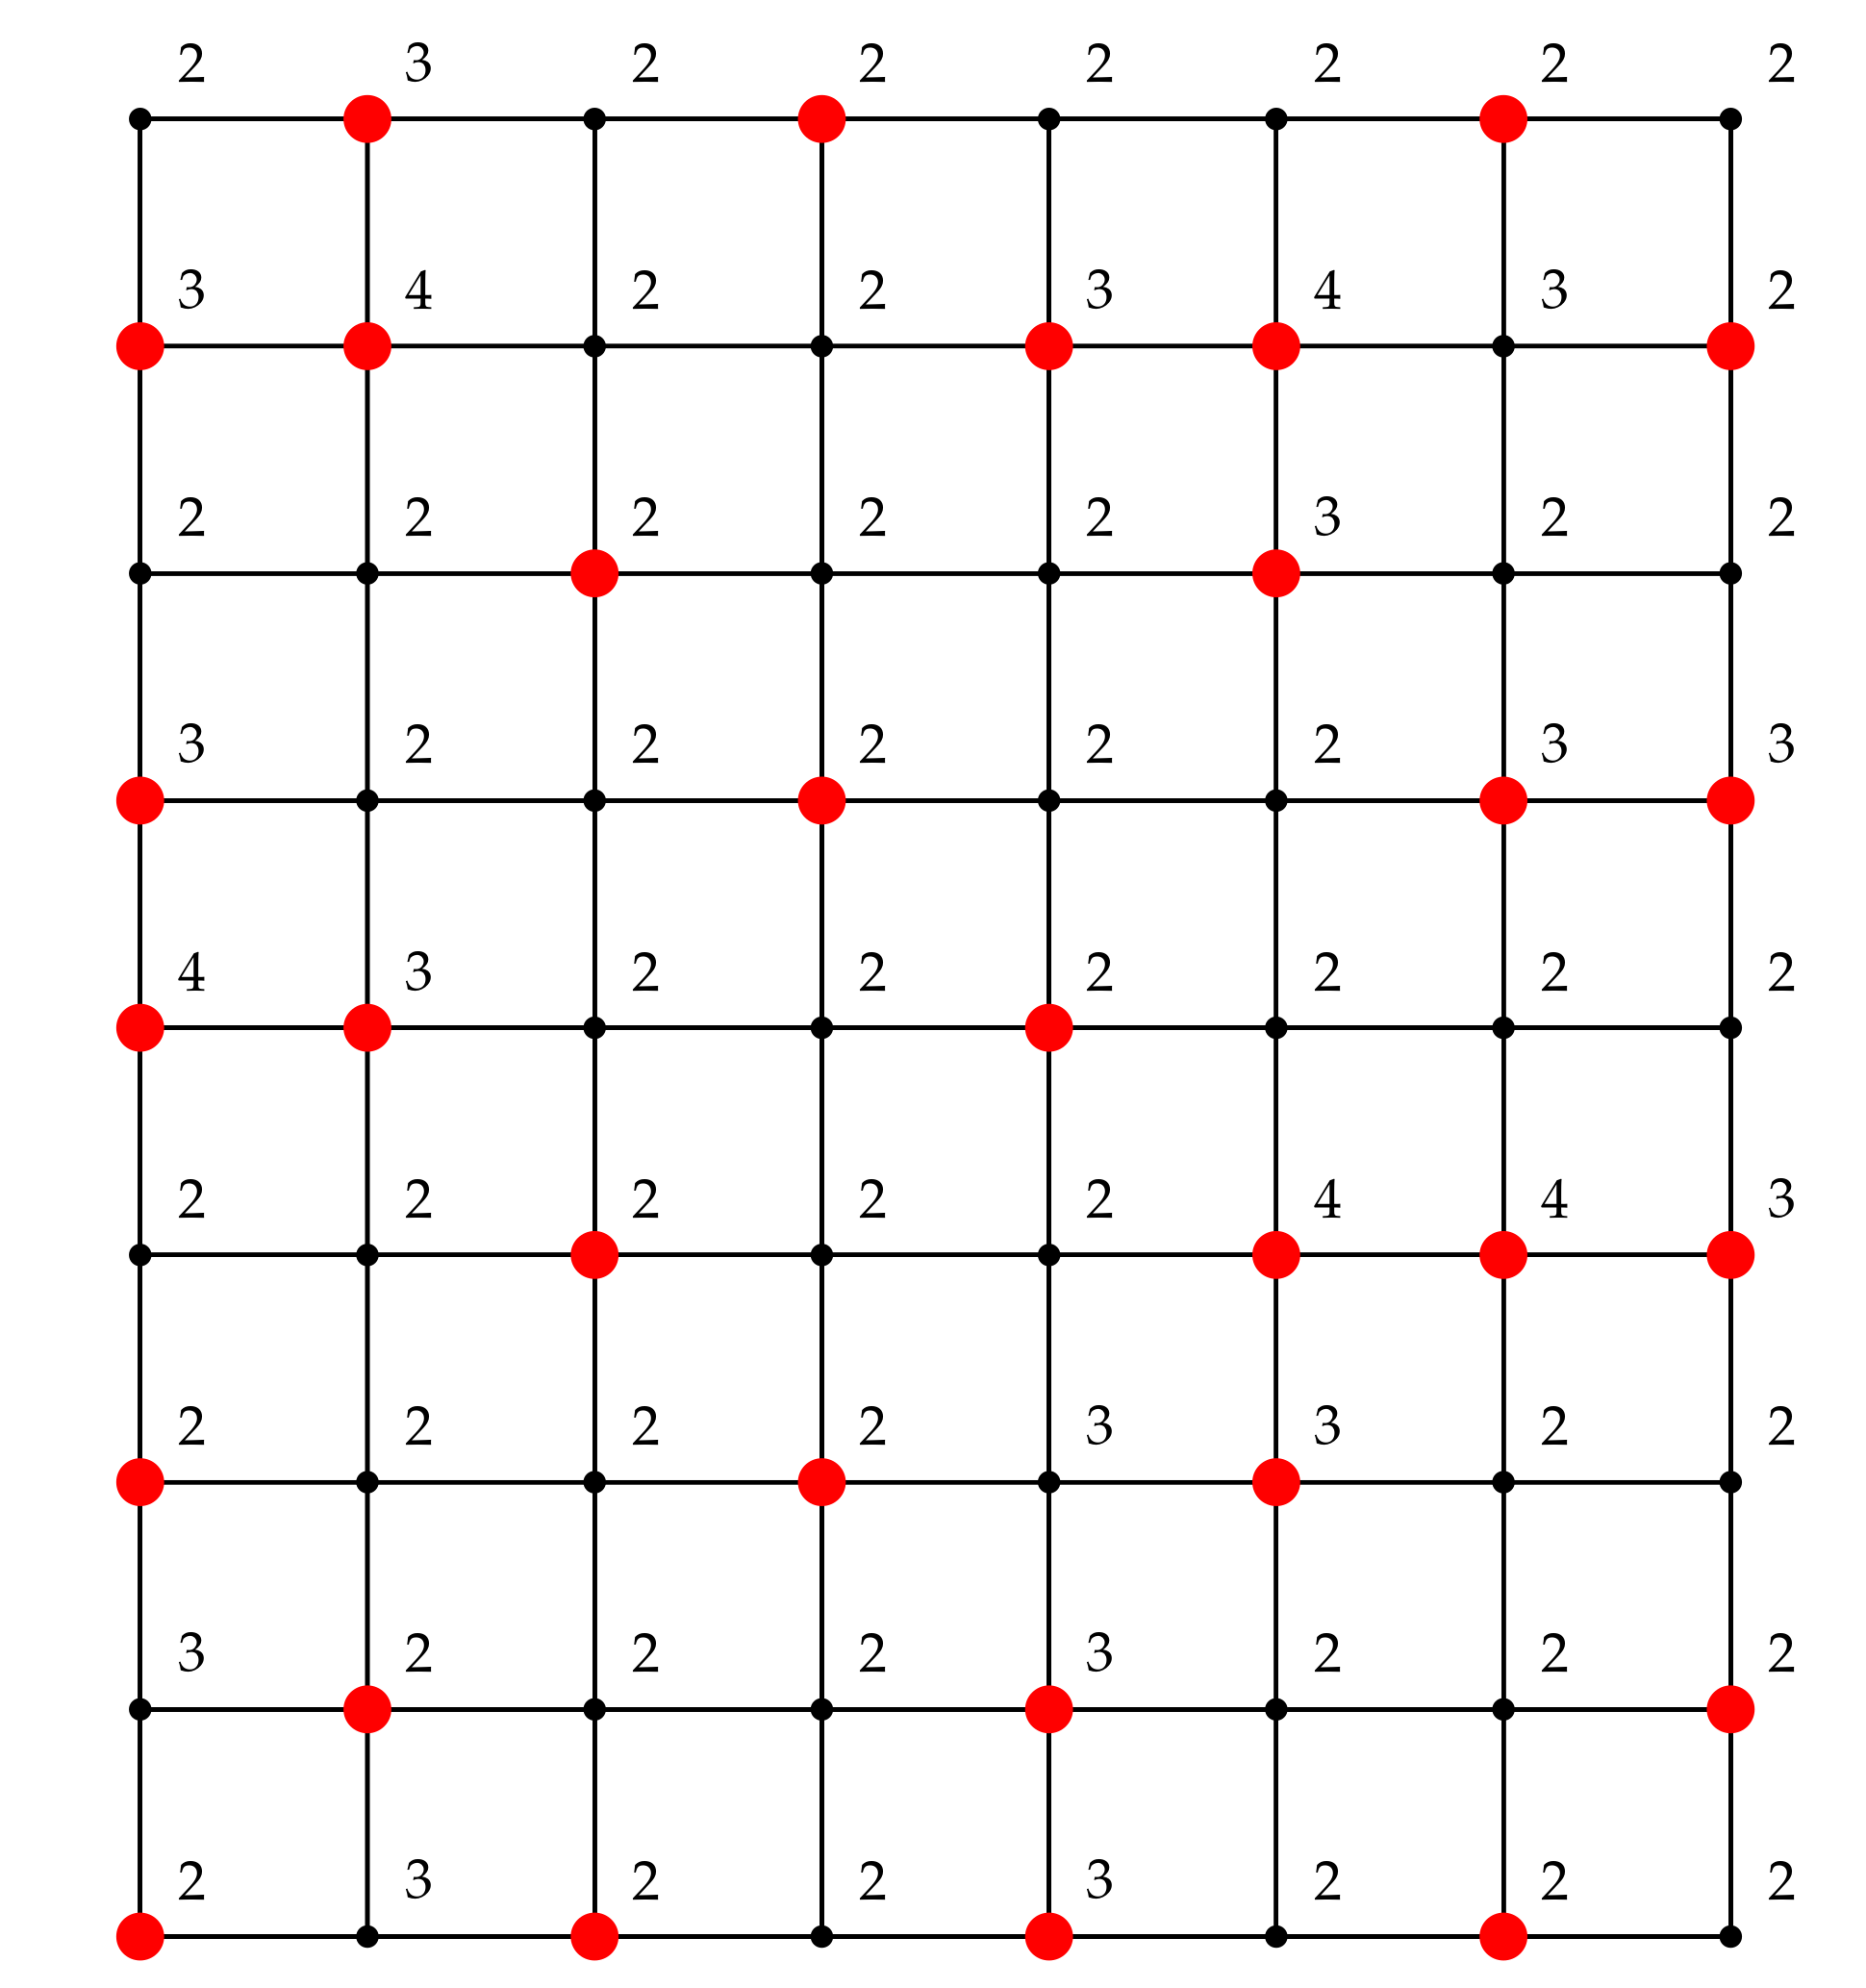
Compared to our results, we found inconsistencies in their reporting (6 boldface values in Table 1, and 2 values in Table 2). For example, in Table 1, the ( 2 , 2 ) broadcast domination number of G 8 × 7 was reported as 25 in [1], but our results show that using only 24 broadcasting towers is sufficient as illustrated in Figure 2. The other five domination numbers found by [1] in Table 1 are also of higher values than ours. Verification examples, similar to Figure 2, that our optimal solutions are indeed the domination numbers are given in Appendix A for all these other cases.
On the other hand, the two boldface numbers in Table 2 indicate that the domination numbers found by Blessing et al. are smaller than ours. For example, for the G 8 × 2 , the ( 3 , 1 ) broadcast domination number was reported as 2 in [1], while our optimal solution from the LP was found to be 3. In this case, we carried out the exhaustive verification to confirm that all 16 2 = 120 possible configurations with 2 broadcasting towers on 16 vertices fail to be a broadcast dominating set for the G 8 × 2 graph. Thus, our optimal solution is actually the broadcast domination number. However, let us note that we could not perform exhaustive verification for the ( 3 , 1 ) broadcast domination number of G 10 × 10 graph whose value was found to be 10 in [1], smaller than ours by 1 tower. This is because the size of all possible configurations with 10 broadcasting towers on 100 vertices of the G 10 × 10 graph is 100 10 > 10 13 exceeding our computational abilities.
As the proposed LP approach is applicable to any graph types, we provide additional results for ( t , r ) broadcast domination numbers on other graph types not considered in [1], namely, slant and king’s grid graphs. For the sake of convenience, the notations S m × n and K m × n will be used to denote m × n slant and king’s grid graphs, respectively. Furthermore, since the LP approach is applicable to larger t , r values than the settings considered in [1], we shall also vary the t , r values from 1 to 10. A summary of problems we solved is given in Table 3.
Here, we present two cases from each graph type: G 5 × 4 and G 10 × 5 , S 5 × 4 and S 10 × 10 , K 5 × 4 and K 12 × 5 . The broadcast domination numbers for these graphs are provided in Table 4, Table 5 and Table 6. Results for other cases can be found in Appendix B. Note that different from Table 1 and Table 2, a number in these tables is a ( t , r ) broadcast domination number for a fixed graph size. A dash symbol (-) in the table indicates an infeasible situation as the reception parameter r is too large for the given transmission parameter t. Considering the three graph types of same size: G 5 × 4 , S 5 × 4 and K 5 × 4 , which correspond to panel (a) of each table, we can observe that a king’s grid graph requires fewest number of broadcasting towers followed by slant and grid graphs. This makes intuitive sense because additional diagonal edges allow signals to transmit to more neighbor vertices.

4.2. Locating an Efficient Broadcast

Having found γ ( t , r ) , the minimum size of a ( t , r ) broadcast dominating set, we now identify a γ ( t , r ) efficient broadcasting configuration S γ ( t , r ) * , as defined in Definition 6.
For a computational purpose, we consider an equivalent unconstrained binary optimization problem to the problem in (5). To that end, we define a binary vector v { 0 , 1 } m n where each component v i corresponds to the vertex i of the graph G: v i = 1 if the vertex i is selected as a broadcasting tower of transmission t, and zero otherwise. We subsequently define a relation between a configuration S which is our decision variable in the original problem, and a binary vector v { 0 , 1 } m n by
S : = { i | v i = 1 } ,
and consider the equivalent problem with a binary vector input v instead. Once the optimal solution v * to the latter is found, we can convert the solution back to the optimal configuration S * by using the predefined relation in (6).
To solve the unconstrained binary optimization problem, we apply the genetic algorithm (GA) with a binary input. To speed up the convergence and leverage the available information, we supply an optimal configuration, a solution of the LP problem in (1)–(3) (which is guaranteed to be in B γ ( t , r ) ), to the initial population of the GA algorithm. The GA parameters which are the population size and the maximum number of iterations are set to 1000 and 3000, respectively. The algorithm stops when the optimal solution (efficient broadcasting configuration) is found. To determine the sufficiently large penalty M > 0 used in (5), recall that our goal is to minimize the wasted signals. We thus consider the worst-case scenario, i.e., when all vertices are used as broadcasting towers, and set M as the resulting wasted signals.
We demonstrate our approach on three problems for each graph type, resulting in 9 problems in total. The details of these problems are presented in Table 7. Columns 2–3 of the table give specific parameter values of the graph size ( m , n ) , the transmission t, and the required reception strength r. Column 4 corresponds to the broadcast domination number which was found by solving the LP problem in Section 4.1.
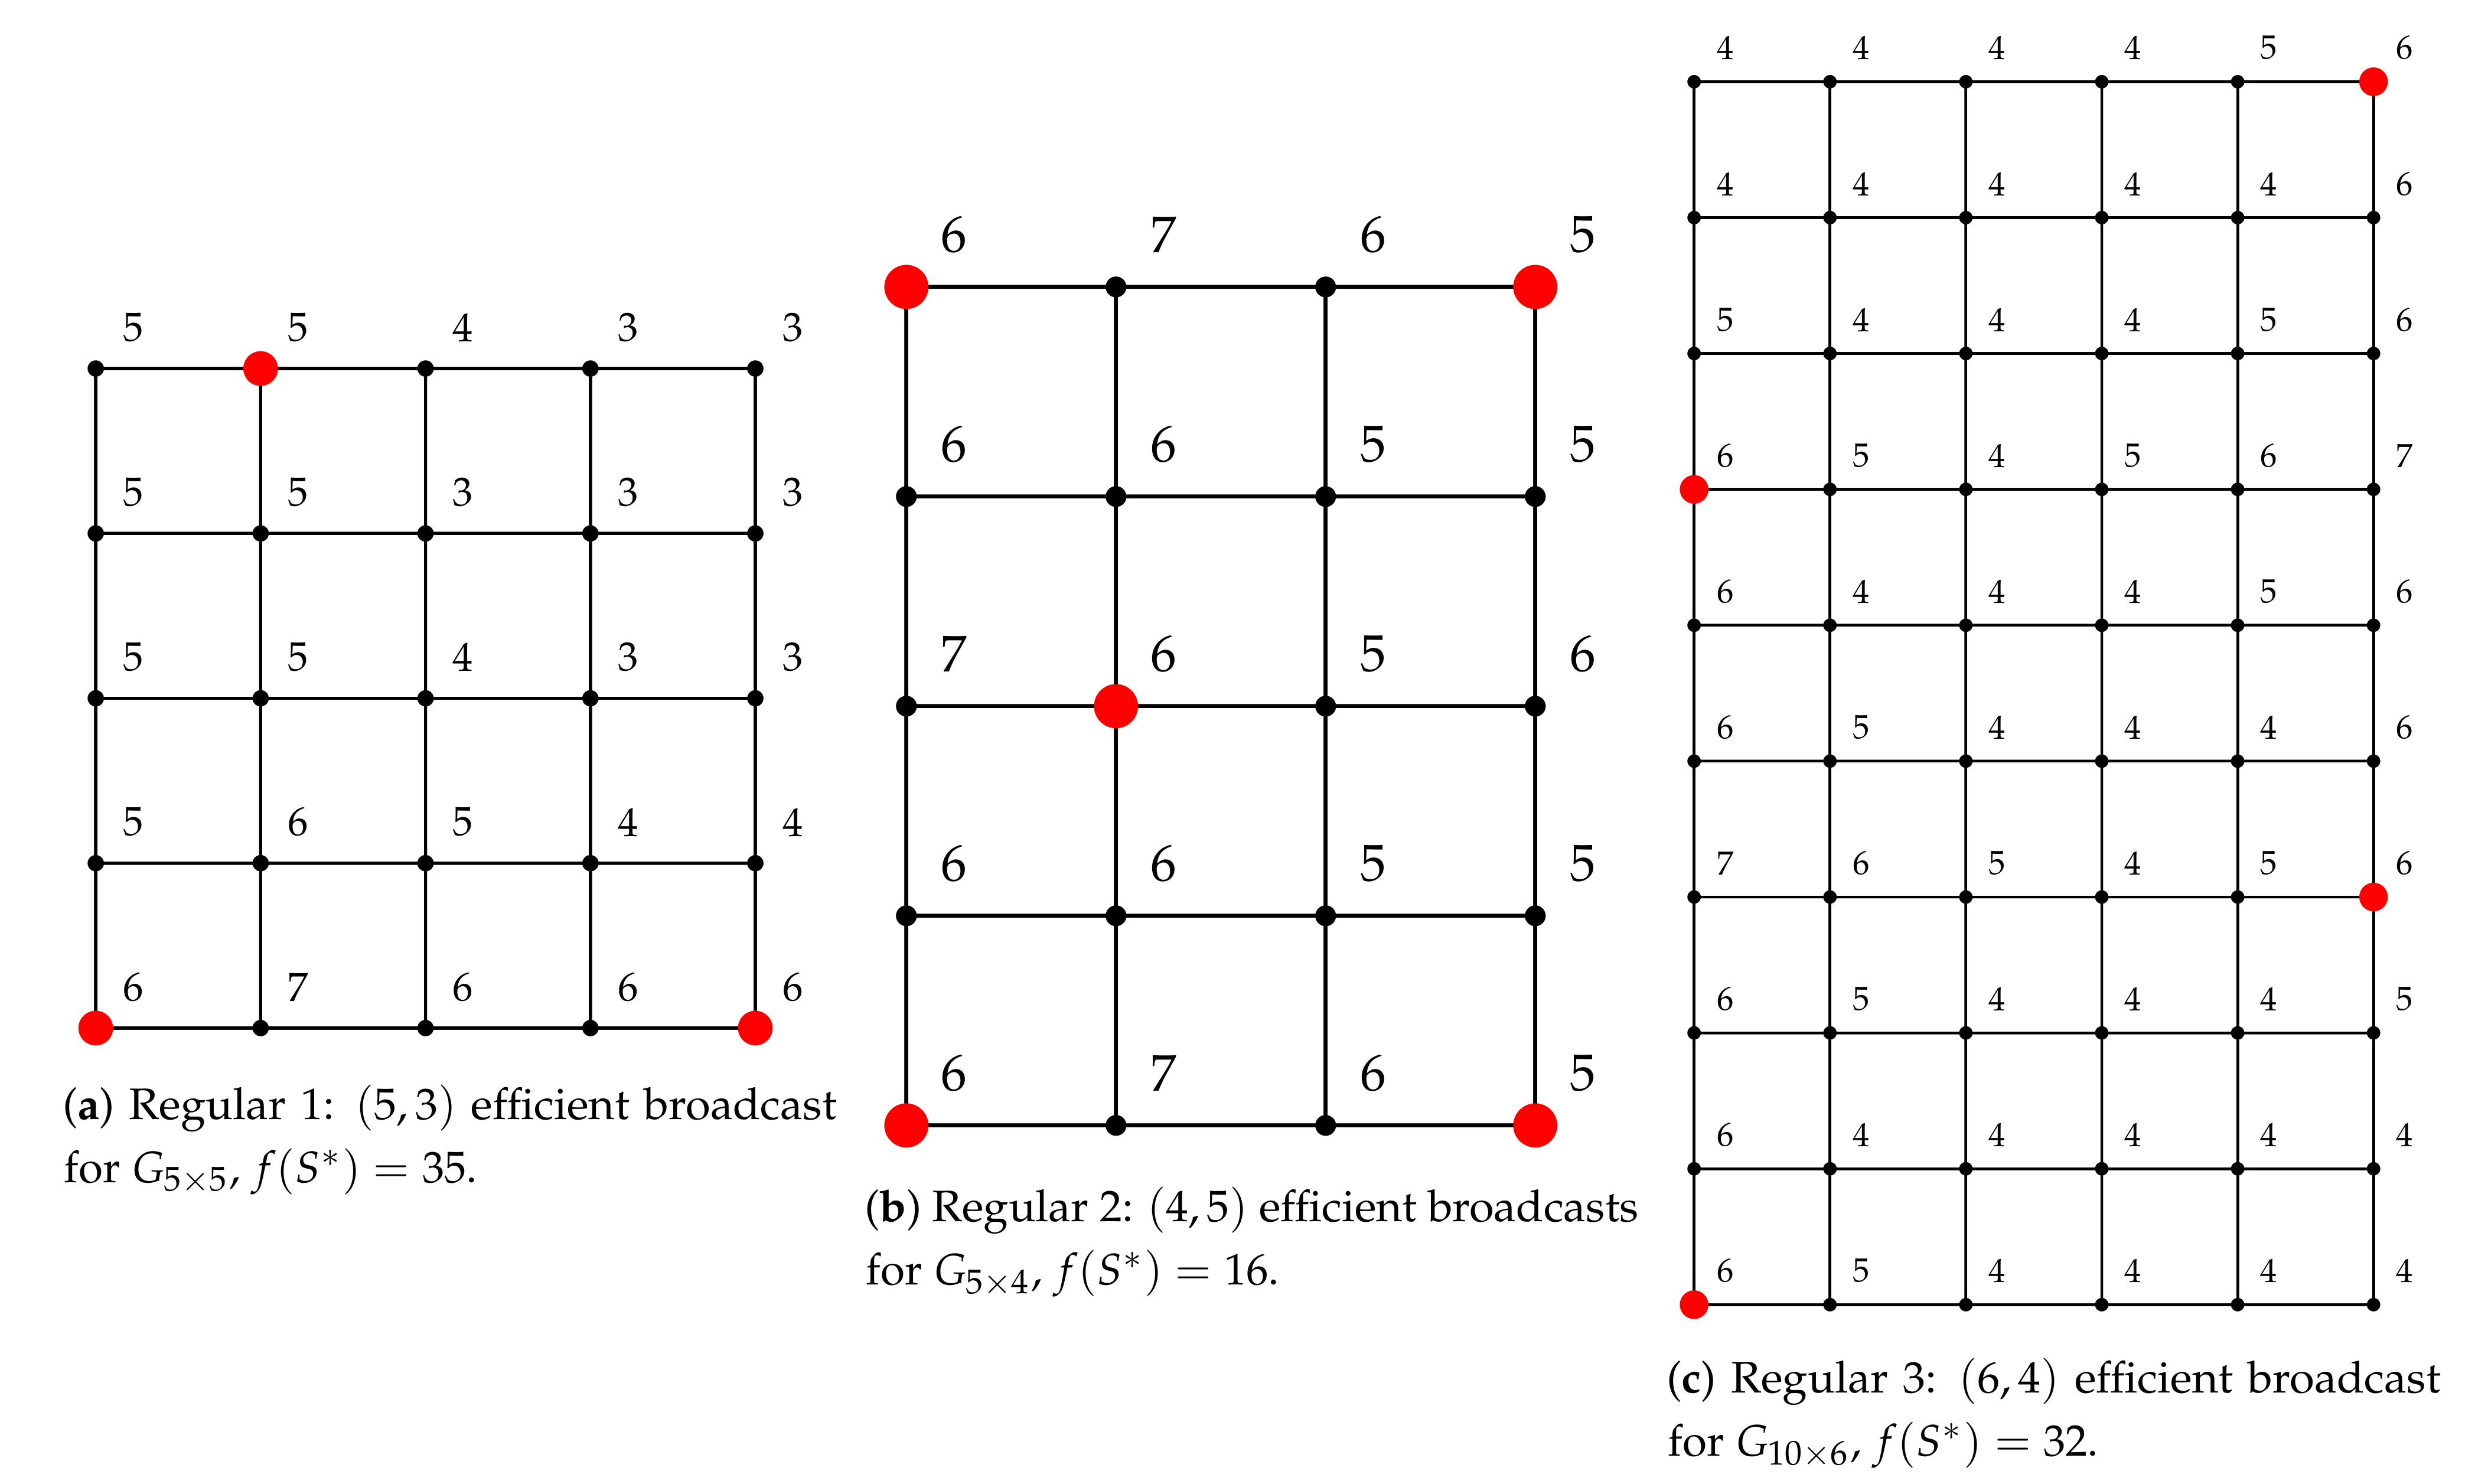
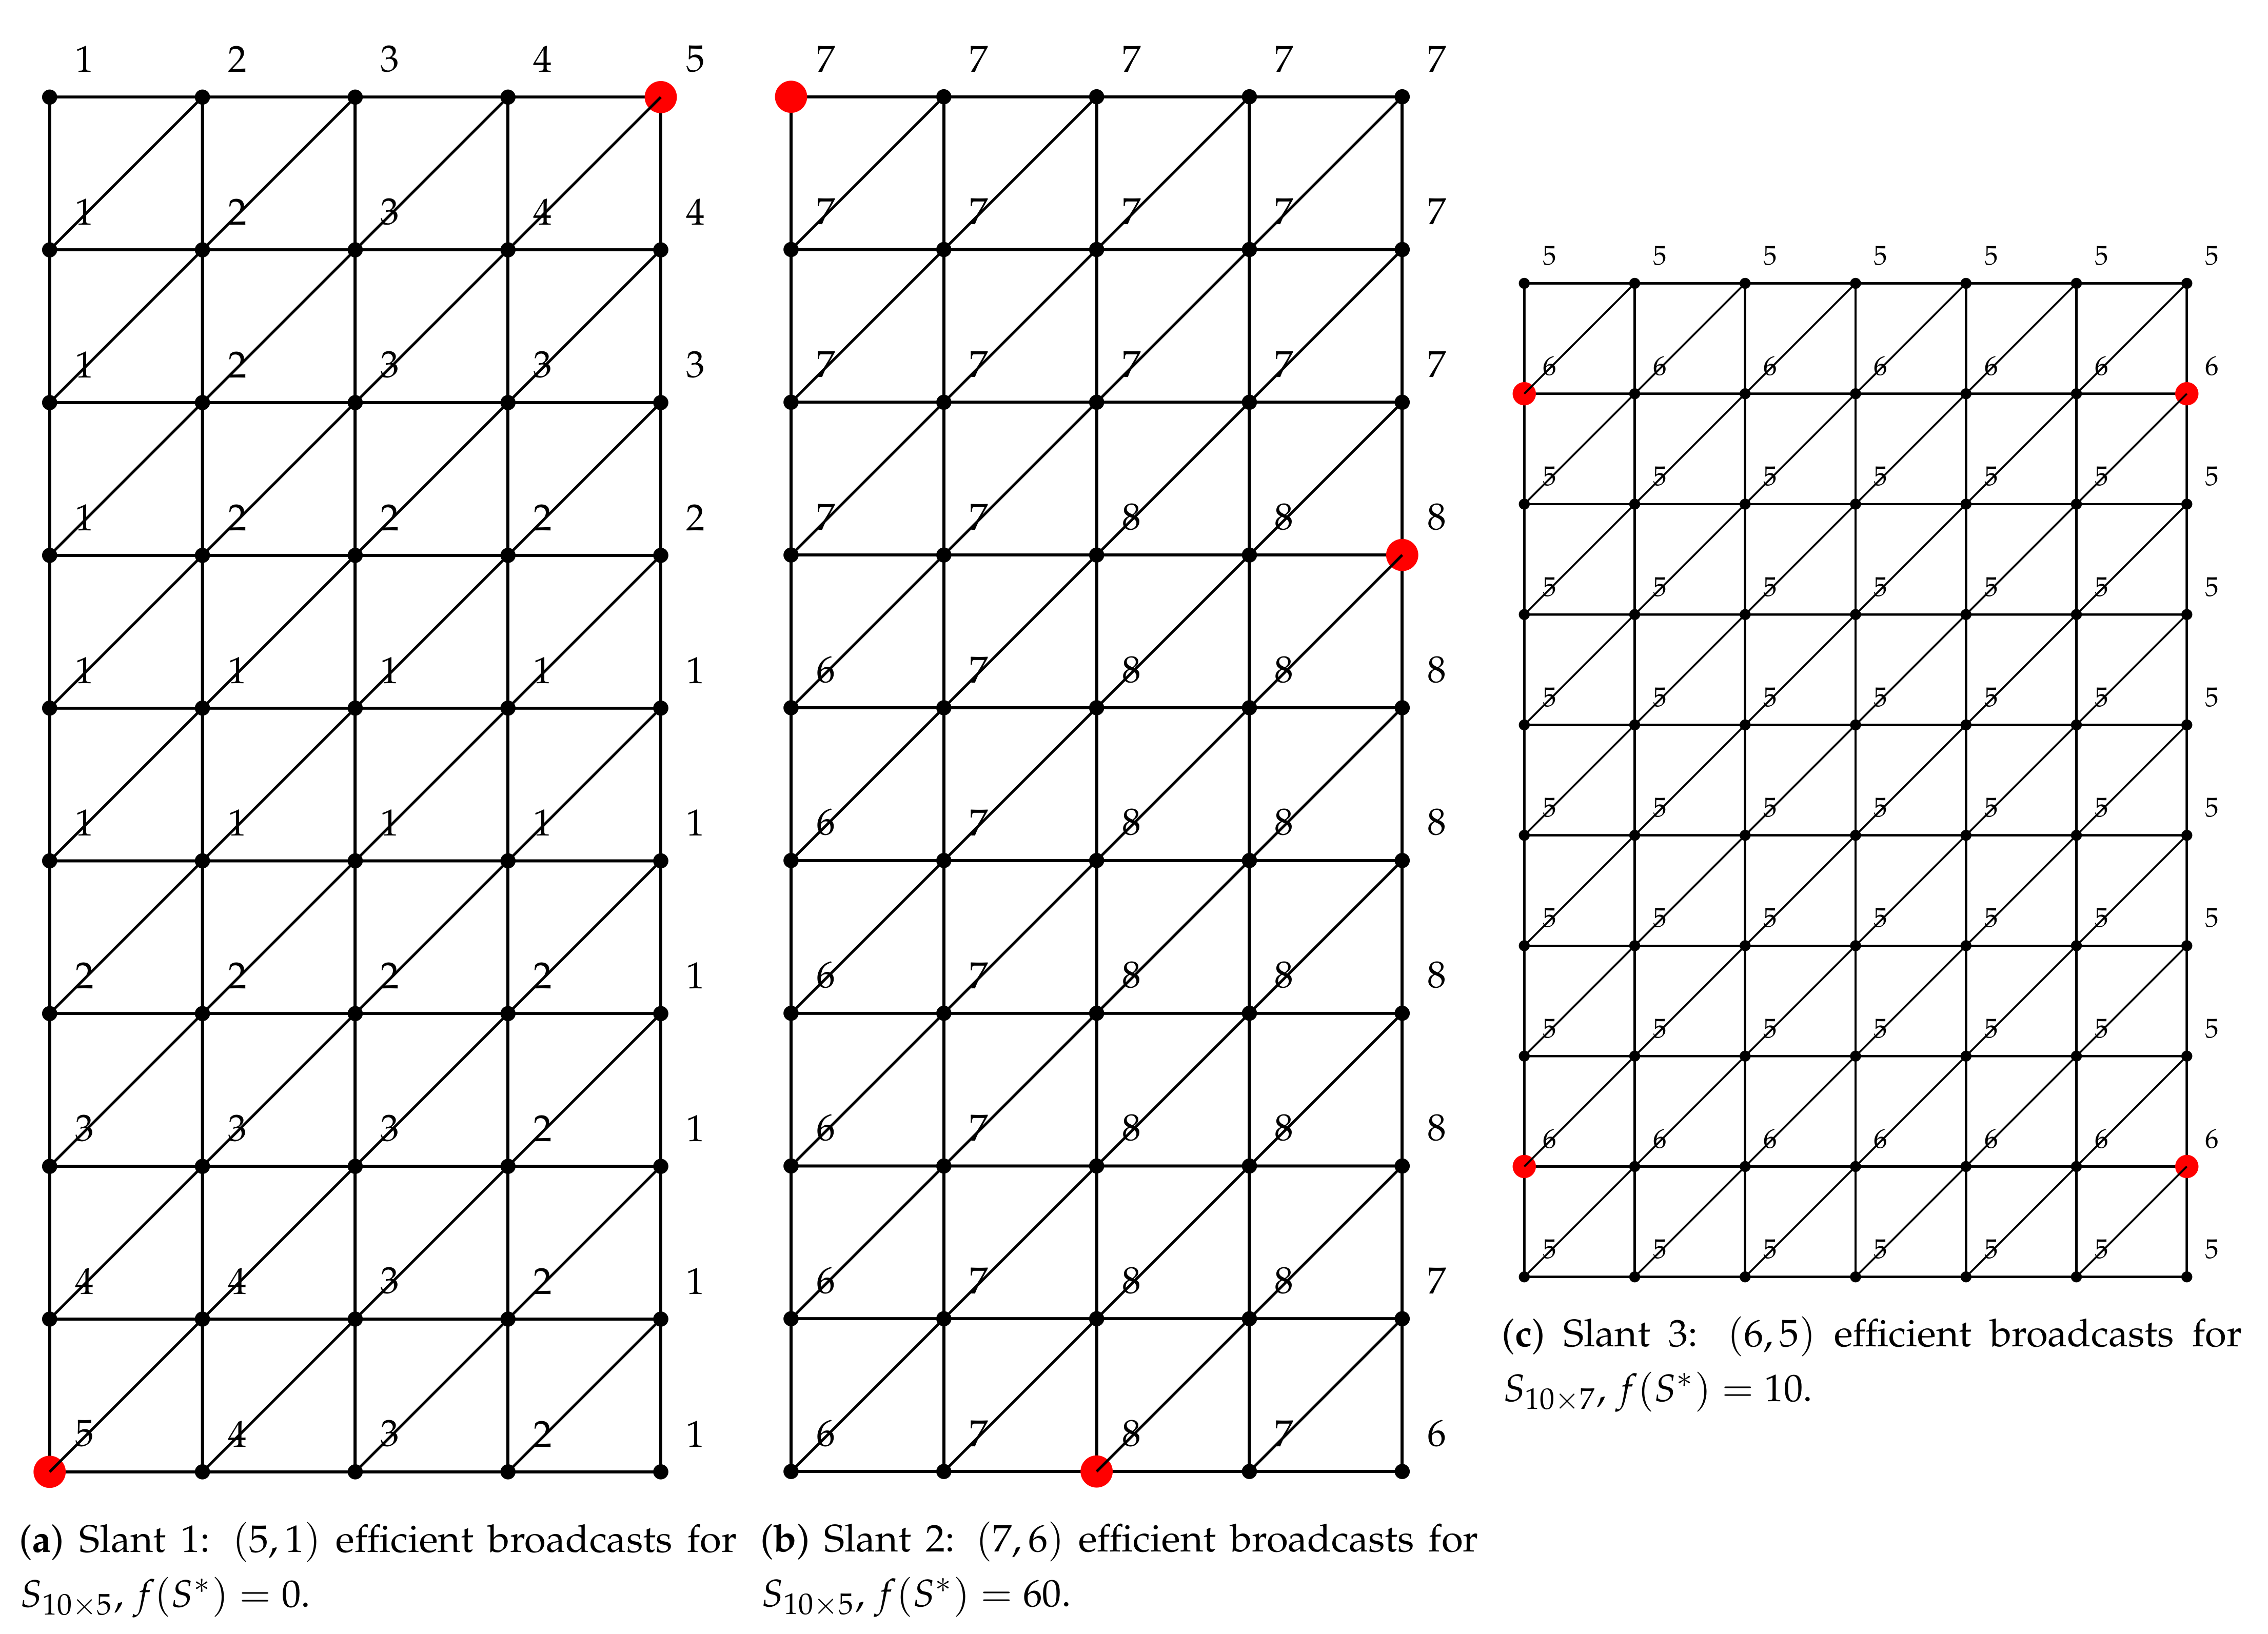
Each experiment is repeated for 20 replications with different initial population. Examples of an optimal configuration of the efficient broadcast found by solving minimization problem in (5) with the stated values of M for the regular, slant and king’s grid graphs are illustrated in Figure 3, Figure 4 and Figure 5. The caption below each sub-figure provides also the optimal objective function value f S * . Note that it is possible to have multiple optimal configurations with the same objective function value.
To validate our obtained results, we carried out a computationally expensive exhaustive search to get an efficient broadcasting configuration S exact , and calculate the value of f ( S exact ) according to (5). Numerical results revealed that the GA algorithm could attain the same minimum value of f ( S exact ) for all problems, implying that the proposed approach could efficiently locate the exact efficient broadcast.
5. Conclusions

From an optimization perspective, we formulated and solved a problem of finding the ( t , r ) broadcast domination number via a linear programming model. We also implemented a meta-heuristic genetic algorithm to locate an efficient broadcasting configuration that minimizes overall wasted signals in a graph network. To validate our models, three types of grid graphs, namely regular, slant and king’s grid graphs with different sizes were considered. Some corrections of the results presented in [1] were also made according to our obtained results. Numerical results showed that optimization approaches we developed to find the exact ( t , r ) broadcast domination number as well as efficient broadcasting configurations are very efficient, and can be used to obtain optimal solutions for problems with larger values of t , r than what can be provided on a theoretical basis.
By modifying a reception matrix R appropriately, the proposed model can also be applied to solve other graph types as well as real-world applications, for example, the problem of installing mobile transmission towers. Using other heuristic or surrogate-based optimization methods to find a large-scale broadcast domination number might also be worth investigating when solving linear programming with the simplex method becomes infeasible, e.g., problems with larger graph sizes, or problems with small t, but relatively large r.

Author Contributions

Conceptualization, P.B. and T.K.; methodology, P.B. and T.K.; software, P.B.; validation, P.B. and T.K.; formal analysis, P.B. and T.K.; investigation, P.B. and T.K.; resources, T.K.; data curation, P.B. and T.K.; writing—original draft preparation, P.B. and T.K.; writing—review and editing, P.B. and T.K.; visualization, P.B. and T.K. All authors have read and agreed to the published version of the manuscript.

Funding

We would like to acknowledge the support of Faculty of Science, Mahidol University for providing the facilities and equipment for this research.

Institutional Review Board Statement

Not applicable.

Informed Consent Statement

Not applicable.

Acknowledgments

P.B. would like to acknowledge financial support from the Development and Promotion of Science and Technology Talents Project (DPST) for his Ph.D. study. T.K. would like to thank Preechaya Sanyatit for insightful discussions during the initial phase of this work.

Conflicts of Interest

The authors declare no conflict of interest.

Appendix A. Correction to Blessing et al.’s Results

We provide examples of optimal configurations for those ( t , r ) broadcast domination numbers given in Table 1 of Section 4.1, which are not consistent with the results reported in [1].
Figure A1. Example of the ( 2 , 2 ) broadcast dominating set with 27 broadcasting towers for G 9 × 7 .
Symmetry 13 01028 g0a1
Figure A2. Example of the ( 2 , 2 ) broadcast dominating set with 31 broadcasting towers for G 9 × 8 .
Symmetry 13 01028 g0a2
Figure A3. Example of the ( 2 , 2 ) broadcast dominating set with 34 broadcasting towers for G 9 × 9 .
Symmetry 13 01028 g0a3
Figure A4. Example of the ( 2 , 2 ) broadcast dominating set with 34 broadcasting towers for G 10 × 8 .
Symmetry 13 01028 g0a4
Figure A5. Example of the ( 2 , 2 ) broadcast dominating set with 38 broadcasting towers for G 10 × 9 .
Symmetry 13 01028 g0a5

Appendix B. Additional (t, r) Broadcast Domination Matrices

In this section, we present additional results on the ( t , r ) broadcast domination number for the other cases of the three graph types: regular, slant and king’s grid graphs listed in Table 3 of Section 4.1.
Table A1. The ( t , r ) broadcast domination matrices for regular grids: (a) G 5 × 5 , (b) G 8 × 5 , (c) G 10 × 2 , (d) G 10 × 4 , (e) G 10 × 6 and (f) G 12 × 5 .
(a) G 5 × 5 (b) G 8 × 5
t/rr1r2r3r4r5r6r7r8r9r10t/rr1r2r3r4r5r6r7r8r9r10
t125---------t140---------
t27111721------t211182634------
t34478111215161921t3571013161822242731
t4234467881011t4345781011131416
t51233445567t52344567889
t61122334445t62223445567
t71112223334t71222334445
t81111222233t81122233344
t91111122222t91112222333
t101111112222t101111222223
(c) G 10 × 2 (d) G 10 × 4
t/rr1r2r3r4r5r6r7r8r9r10t/rr1r2r3r4r5r6r7r8r9r10
t120---------t140---------
t26101420------t210192634------
t334681012131618-t3571013161822252832
t4234466881010t4345781011121416
t52233445667t523445678910
t62222334455t62233445667
t71222233344t72222334455
t81122223333t81222233344
t91112222233t91122223333
t101111222222t101112222233
(e) G 10 × 6 (f) G 12 × 5
t/rr1r2r3r4r5r6r7r8r9r10t/rr1r2r3r4r5r6r7r8r9r10
t160---------t160---------
t216273749------t216263850------
t37101418222631343944t37101418222631353944
t44679121315171921t44679121315172022
t534467810101213t534567810111213
t62344456788t62334566789
t72233444566t72223445566
t82222334445t82222334455
t91222233344t91222233344
t101122223333t101122222333
Table A2. The ( t , r ) broadcast domination matrices for slant grids: (a) S 7 × 6 , (b) S 8 × 5 , (c) S 10 × 2 , (d) S 10 × 5 , (e) S 12 × 5 and (f) S 15 × 8 .
(a) S 7 × 6 (b) S 8 × 5
t/rr1r2r3r4r5r6r7r8r9r10t/rr1r2r3r4r5r6r7r8r9r10
t142---------t140---------
t28142128------t28142027------
t346811131618212427t346810131518202326
t424467810111214t423467810111214
t52234566789t52234456788
t62223344566t62223344556
t71222233444t71222233444
t81122223333t81122223333
t91112222233t91112222233
t101111222223t101111222223
(c) S 10 × 2 (d) S 10 × 5
t/rr1r2r3r4r5r6r7r8r9r10t/rr1r2r3r4r5r6r7r8r9r10
t120---------t150---------
t2481115------t210172533------
t33457810121315-t346912151822252832
t422345678910t4345781012131517
t52223445567t522345678910
t61222334445t62223445567
t71122223344t72222334445
t81112222333t81222233344
t91111222233t91122222333
t101111122222t101112222233
(e) S 12 × 5 (f) S 15 × 8
t/rr1r2r3r4r5r6r7r8r9r10t/rr1r2r3r4r5r6r7r8r9r10
t160---------t1120---------
t211203039------t221365472------
t3581114182125283236t39141925313844505663
t43468101213151719t4671012151821242730
t5234567891011t5456891113141618
t62233455677t63345689101112
t72222344456t72334566789
t82222233444t82223445566
t91222223334t92222334455
t101122222333t102222233444
Table A3. The ( t , r ) broadcast domination matrices for king’s grid graphs: (a) K 6 × 5 , (b) K 8 × 5 , (c) K 10 × 5 , (d) K 10 × 6 , (e) K 10 × 7 and (f) K 10 × 10 .
(a) K 6 × 5 (b) K 8 × 5
t/rr1r2r3r4r5r6r7r8r9r10t/rr1r2r3r4r5r6r7r8r9r10
t130---------t140---------
t248141823-----t2612172230-----
t3246781012141618t32468101215172022
t41223456688t4224466881010
t51122233445t51223445667
t61112222333t61122233444
t71111222223t71112222333
t81111122222t81111222223
t91111112222t91111122222
t101111111222t101111112222
(c) K 10 × 5 (d) K 10 × 6
r1r2r3r4r5r6r7r8r9r10t/rr1r2r3r4r5r6r7r8r9r10
t150---------t160---------
t2815212736-----t2816243242-----
t325810121518202326t346912151820232628
t4224467891012t424468810121314
t52224446668t52244466888
t61222344456t61223444566
t71122233444t71122233444
t81112222333t81112222333
t91111222223t91111222223
t101111122222t101111122222
(e) K 10 × 7 (f) K 10 × 10
t/rr1r2r3r4r5r6r7r8r9r10t/rr1r2r3r4r5r6r7r8r9r10
t170---------t1100---------
t21220283648-----t21628395064-----
t3461012161922252832t3491318222630343944
t4245781012131516t44468101214161820
t522446678910t54446788101212
t61223445667t61234456788
t71122233444t71122334445
t81112222333t81112223334
t91111222223t91111222233
t101111122222t101111122222

References

  1. Blessing, D.; Johnson, K.; Mauretour, C.; Insko, E. On (t, r) broadcast domination numbers of grids. Discret. Appl. Math. 2015, 187, 19–40. [Google Scholar] [CrossRef]
  2. Crepeau, N.; Harris, P.E.; Hays, S.; Loving, M.; Rennie, J.; Kirby, G.R.; Vasquez, A. On (t,r) broadcast domination of certain grid graphs. arXiv 2019, arXiv:1908.06189. [Google Scholar]
  3. Drews, B.F.; Harris, P.E.; Randolph, T.W. Optimal (t, r) broadcasts on the infinite grid. Discret. Appl. Math. 2019, 255, 183–197. [Google Scholar] [CrossRef] [Green Version]
  4. Herrman, R.; van Hintum, P. The (t, r) broadcast domination number of some regular graphs. Discret. Appl. Math. 2021, 289, 270–280. [Google Scholar] [CrossRef]
  5. Harris, P.E.; Luque, D.K.; Flores, C.R.; Sepulveda, N. Efficient (t, r) broadcast dominating sets of the triangular lattice. Discret. Appl. Math. 2020, 277, 180–192. [Google Scholar] [CrossRef]
  6. Duraisamy, P.; Esakkimuthu, S. Linear programming approach for various domination parameters. Discret. Math. Algorithms Appl. 2020, 2050096. [Google Scholar] [CrossRef]
  7. Ma, Y.; Cai, Q.; Yao, S. Integer linear programming models for the weighted total domination problem. Appl. Math. Comput. 2019, 358, 146–150. [Google Scholar] [CrossRef]
  8. Cai, Q.; Fan, N.; Shi, Y.; Yao, S. Integer linear programming formulations for double roman domination problem. Optim. Methods Softw. 2019, 1–22. [Google Scholar] [CrossRef]
Figure 1. Types of graphs considered in this work.
Symmetry 13 01028 g001
Figure 2. Example of the ( 2 , 2 ) broadcast dominating set with 24 broadcasting towers for G 8 × 7 . The numbers in the graph represent r ( u ) , the sum of transmissions from all broadcasting neighbors.
Symmetry 13 01028 g002
Figure 3. Examples of efficient broadcasting configuration for regular grid types. The numbers on the vertex represents r(u), the sum of transmissions from all broadcasting neighbors..
Symmetry 13 01028 g003
Figure 4. Examples of efficient broadcasting configuration for slant types. The numbers on the vertex represents r(u), the sum of transmissions from all broadcasting neighbors.
Symmetry 13 01028 g004
Figure 5. Examples of efficient broadcasting configurations for king’s grid types. The numbers on the vertex represents r(u), the sum of transmissions from all broadcasting neighbors.
Symmetry 13 01028 g005
Table 1. Results for the ( 2 , 2 ) broadcast domination numbers of G 8 × 7 , G 9 × 7 , G 9 × 8 , G 9 × 9 , G 10 × 8 and G 10 × 9 .
Blessing et al.’s ResultsOur Results
m/nn1n2n3n4n5n6n7n8n9n10m/nn1n2n3n4n5n6n7n8n9n10
m11 m11
m222 m222
m3234 m3234
m43468 m43468
m53571011 m53571011
m6468121416 m6468121416
m7471013161921 m7471013161921
m858111518222528 m858111518222428
m95912172024283235 m95912172024273134
m106101419222730353942m106101419222730343842
Table 2. Results for the ( 3 , 1 ) broadcast domination numbers of G 8 × 2 and G 10 × 10 .
Blessing et al.’s ResultsOur Results
m/nn1n2n3n4n5n6n7n8n9n10m/nn1n2n3n4n5n6n7n8n9n10
m11 m11
m211 m211
m3111 m3111
m41223 m41223
m512234 m512234
m6222444 m6222444
m72234466 m72234466
m822345678 m823345678
m9233566789 m9233566789
m10234567891010m10234567891011
Table 3. A summary of additional problems considered for ( t , r ) broadcast domination numbers.
TypesProblems
Regular G 5 × 4 , G 5 × 5 , G 8 × 5 , G 10 × 2 , G 10 × 4 , G 10 × 5 , G 10 × 6 , G 12 × 5
Slant S 5 × 4 , S 7 × 6 , S 8 × 5 , S 10 × 2 , S 10 × 5 , S 10 × 10 , S 12 × 5 , S 15 × 8
King K 5 × 4 , K 6 × 5 , K 8 × 5 , K 10 × 5 , K 10 × 6 , K 10 × 7 , K 10 × 10 , K 12 × 5
Table 4. The ( t , r ) broadcast domination numbers for regular grid types: (a) G 5 × 4 and (b) G 10 × 5 .
(a) G 5 × 4 (b) G 10 × 5
t/rr1r2r3r4r5r6r7r8r9r10t/rr1r2r3r4r5r6r7r8r9r10
t120---------t150---------
t26101418------t213223242------
t3345791012141518t3681216192226303338
t42334567799t44568101213151719
t51223344556t5234567891011
t61122233444t62234456678
t71112222333t72223344556
t81111222223t81222233444
t91111122222t91122223334
t101111112222t101112222333
Table 5. The ( t , r ) broadcast domination numbers for slant types: (a) S 5 × 4 and (b) S 10 × 10 .
(a) S 5 × 4 (b) S 10 × 10
t/rr1r2r3r4r5r6r7r8r9r10t/rr1r2r3r4r5r6r7r8r9r10
t120---------t1100---------
t2481115------t218304661------
t3245681011131416t38111622273238434854
t42234456788t456811131618212426
t51222334455t544568911121415
t61122233344t633446678910
t71112222333t72234456678
t81111222223t82223344556
t91111122222t92222334445
t101111112222t101222223334
Table 6. The ( t , r ) broadcast domination numbers for king’s grid types: (a) K 5 × 4 and (b) K 12 × 5 .
(a) K 5 × 4 (b) K 12 × 5
t/rr1r2r3r4r5r6r7r8r9r10t/rr1r2r3r4r5r6r7r8r9r10
t120---------t160---------
t247101218-----t2816253242-----
t31245689101213t336912141820242730
t41122344556t423467810111214
t51112223344t52224456678
t61111222233t62222444466
t71111122222t71222234444
t81111112222t81122223344
t91111111222t91112222333
t101111111122t101111222223
Table 7. Descriptions of problems considered in Section 4.2.
Problem ( m , n ) ( t , r ) γ ( t , r )
Regular 1(5, 5)(5, 3)3
Regular 2(5, 4)(4, 5)5
Regular 3(10, 6)(6, 4)4
Slant 1(10, 5)(5, 1)2
Slant 2(10, 5)(7, 6)3
Slant 3(10, 7)(6, 5)4
King 1(10, 5)(4, 2)2
King 2(7, 6)(6, 8)3
King 3(12, 5)(6, 6)4
Publisher’s Note: MDPI stays neutral with regard to jurisdictional claims in published maps and institutional affiliations.