Article

Applying Ateb–Gabor Filters to Biometric Imaging Problems

by
Mariia Nazarkevych
1,
Natalia Kryvinska
2,* and
Yaroslav Voznyi
1
1
Department of Publishing Information Technologies, Lviv Polytechnic National University, 12 Bandera Str., 79000 Lviv, Ukraine
2
Faculty of Management, Comenius University in Bratislava, Odbojárov 10, 820 05 Bratislava, Slovakia
*
Author to whom correspondence should be addressed.
Symmetry 2021, 13(4), 717; https://doi.org/10.3390/sym13040717
Submission received: 21 March 2021 / Revised: 12 April 2021 / Accepted: 13 April 2021 / Published: 19 April 2021
(This article belongs to the Special Issue Safe and Reliable AI for Smart Sustainable Cities)

Abstract

:
This article presents a new method of image filtering based on a new kind of image processing transformation, particularly the wavelet-Ateb–Gabor transformation, that is a wider basis for Gabor functions. Ateb functions are symmetric functions. The developed type of filtering makes it possible to perform image transformation and to obtain better biometric image recognition results than traditional filters allow. These results are possible due to the construction of various forms and sizes of the curves of the developed functions. Further, the wavelet transformation of Gabor filtering is investigated, and the time spent by the system on the operation is substantiated. The filtration is based on the images taken from NIST Special Database 302, that is publicly available. The reliability of the proposed method of wavelet-Ateb–Gabor filtering is proved by calculating and comparing the values of peak signal-to-noise ratio (PSNR) and mean square error (MSE) between two biometric images, one of which is filtered by the developed filtration method, and the other by the Gabor filter. The time characteristics of this filtering process are studied as well.

1. Introduction

The field of biometric identification systems (BISs) is developing quickly [1]. These systems attract special attention due to their high reliability and recent significant price reductions, and are often used for real-time recognition tasks [2].
Biometric security systems are gradually displacing traditional security systems based on the entry of passwords, PIN codes, which are personal identification numbers, and printed IDs. Systems of this kind are an identification technology with various means of protection and are used to compare the obtained physiological or behavioral characteristics of a particular person.
The development of biometrics is the result of the wide usage of embedded miniature sensors in small personal devices such as smartphones, deployment of biometric data in various data systems and large-scale identification, and study of usage of biometric features in wearable devices [3].
It is a common knowledge, that almost every security biometric system implicitly imposes a certain type of restriction on its users. Such systems require the creation of a certain type of environment during data collection. It is also important to allocate enough memory to store the collected information. However, cheaper biometric sensors and the rapid development of smartphones, smart watches, and various other devices provide wider opportunities for researchers. Thus, today, we observe a revolution in devices with biometric logins.
Such devices store the personal information of the owner of the device or person who has the right to use this device. These devices that enable biometric authentication are equipped with biometric sensors and are able to constantly check the owner of the certain biometric data. Therefore, these attributes of the individuals can be used as a biometric signature of the person.
In [4], biometric images are viewed from different angles and different orientations. They are filtered by the Gabor function. The system is invariant for the rotation of the face of the profile in one or different lanes. Based on that fact, we can claim that Gabor filtration is promising.
In [5], it is established a secure and reliable algorithm for distinguishing fingerprints from counterfeits, using circular Gabor Wavelet to segment the textures of captured images. The samples are subjected to extraction functions using a circular Gabor wavelet algorithm designed for segmentation.
The enhancement of the biometric images is extremely essential during the deployment of automated fingerprint identification systems. In [6], an authentication method based on a new lighting compensation scheme when scanning fingerprints was developed. The proposed compensation scheme involves a new method of light decomposition and compensation of external lighting. Such approach enables the scholars to decently improve the image quality. The results of the experiments show that the image quality after applying the adaptive higher-order singular value decomposition on a tensor of wavelet subbands of a fingerprint (AHTWF) method is higher than the quality of the original images. The AHTWF method is recommended to apply to fingerprint images that have ridge and concavity structures, and also contain a lot of blurred areas. As the outputs of the fingerprint scanning can often be of the low quality, the AHTWF method is proposed to highly improve the higher accuracy of fingerprint classification.
Multimodal biometrics is mainly used for certification and identity verification. Many biometric data are used for human authentication. Biometric recognition involves three vital phases, which include preprocessing, trait detection, and classification. Thus, preprocessing included using filters and image cropping, texture overlay, and shape creation [7].
Today, the security of personal information is very important. A huge amount of personal data and files are stored on servers with closed access. Access to private information is provided only to authorized users. Biometrics plays a big role in security. Nowadays, specialists have begun to study the images of finger veins very actively. The great advantage of vein patterns on the fingers is that they cannot be copied or stolen. The use of basic fingers for authenticity is widely used in Japan as a database at airports, identity authentication, prisons, etc. The main attention is paid to the comparative study of existing methods of pattern recognition of veins, the technique of creating features [8].
A method based on the Gabor filter is introduced to extract fingerprint functions actively from images without pre-processing. The proposed method is more efficient than conventional methods for a small fingerprint recognition system. The results of experiments claim that the recognition coefficient of the k-nearest classifier of neighbors using the proposed functions based on the Gabor filter is 97.2% [9].
Improving image prints is an important step in pre-processing in fingerprint recognition programs. In [10], they proposed a new filter design method to improve the fingerprint image, mainly the traditional Gabor filter (TGF). Its parameter selection scheme does not depend on the image. The advantages are based on maintaining the structure of the fingerprint image and achieving a sequence of image enhancement.
In [10], the Log-Gabor method is developed. It is used to solve the issue of improving fingerprint recognition and widen the usage of common Gabor filter. The presented method is important for the reliability of identification and other issues related to the fingerprint recognition.
The Gabor filter can be divided into a band-pass filter and a low-pass filter. The orientation aspect is introduced to implement the quicker Gabor filter processing. The division into a band-pass filter and a low-pass filter enables to significantly reduce the computational complexity, by 1:2.8 times. Thus, the filter execution time decreases by (1:1.46), memory space lessens, and biometric image quality significantly improves compared to a traditional Gabor filter [11].
The works of Shelupanov [12] and Bidyuk [13] are devoted to the problem of biometric identification in which special attention is paid to the control and security of the system. The work [14], where new approach to the protection of information systems is studied, deserves a special attention.
In the works of [15], they considered attacks on biometric protection systems. A study [16] showed that biometric protection depends on many factors that will shape security policy. Among foreign researchers, it is worth noting the works of Vacca [17], Nixon [18], and Nanavati [19].
The main contribution of this paper can be summarized as follows:
  • The symmetry of Ateb–Gabor functions enables us to create a great variety and amount of filters, that differ in form and size. All of them supplement Gabor function.
  • The basis of wavelet-Ateb–Gabor functions allows us to create a large number of different filters that will effectively convert images into a skeleton and provide fast and reliable image identification, including fingerprints images.
  • This filtering method can provide universal filtering, thus reducing the time spent on pre-processing images. This will reduce the pre-processing time of the images by applying the filter shape that will be most desirable.

2. Filtering of Biometric Images

2.1. Fingerprint Filtering

Biometric systems have good performance with good input quality. However, their performance deteriorates sharply when poor quality input enters the system [20]. Examples of bad data can be noisy scans with low resolution fingerprints. Therefore, it will be promising to develop methods to improve the quality of such data so that the biometric content of protection could work faster and with fewer errors [21].
However, on the raw image due to noise, the print lines may be distorted, creating recognition errors [22]. To implement this, the image will be enhanced by applying filtering to reduce its noise. The existing Gabor filter based on Ateb-functions is effective for filtering [23].
Random noise is manifested in the form of chaotic granularities or extraneous points in the image. This noise is most noticeable in dark areas of the image, as the signal-to-noise ratio will be much lower than in bright areas. The difficulty of finding exact solutions gives rise to different variants of approximate methods.
Filtration of digital images is based on the implementation of the physical process of absorption and reflection of light. The essence of the method is as follows. The original image is represented as a surface, each point of which corresponds to a pixel in the image. At these points, the reflection coefficients are calculated based on their proximity to the points that are black in the binary image of the print. For all points of the surface, this coefficient and the value of the intensity of the reflected light are determined.

2.2. Wavelet Transformation of the Gabor Function

Let us consider the Fourier transformation of the simplified complex Gabor filter:
ψ ( ζ , υ , ζ 0 , υ 0 , θ , σ , β ) = 1 π σ β e 1 2 [ ( ( ζ ζ 0 ) cos θ + ( υ υ 0 ) sin θ ) 2 σ 2 2 σ 2 + ( ( ζ ζ 0 ) sin θ + ( υ υ 0 ) cos θ ) 2 β 2 2 β 2 ] ,
where ζ , υ are the spatial frequencies along the x and y axes, σ is the standard deviation of the Gaussian nucleus, θ is the filter orientation angle, β is the filter phase. The center of the filter is located at the point ( ξ = ξ 0 ,   υ = υ 0 ) of the raster frequency plane. σ and β are scale parameters of elliptical Gaussians along the x and y axes [24].
Since these calculations are of great computational complexity, there are performed several simplifications. The parameters σ, β can be arbitrarily restricted β/σ = 2. Also:
ζ 0 = ω 0   cos θ , ν 0 = ω 0   sin θ ,
where frequency ω 0 = ζ 0 2 + ν 0 2 .
Figure 1 shows the surface of the Gabor function ψ ( ζ , υ , ζ 0 , υ 0 , θ , σ , β ) for different values of σ . When parameter σ increases, the function becomes more convex. Therefore, when we apply this function for filtration, a bigger σ means a significant change in the brightness of colors in the image. The surfaces of the Gabor function with larger parameters σ, in particular σ = 6, 7, 8, 9, 10 are given in Appendix A Figure A1.

2.3. Ateb-Functions as a New Tool to Develop Filtering

In the 1960s, Rosenberg first defined Ateb-functions as the inversion of incomplete Beta-functions [25] In particular, the entry Ateb is a reverse permutation of the letters of the word Beta. Rosenberg, using Ateb-functions, wrote an analytical solution of differential equations with power nonlinearity to describe oscillatory motion.
Somewhat later, Senyk [26] generalized and investigated the functional properties of Ateb-functions. The introduced periodic and hyperbolic Ateb-functions are used to construct solutions of systems of nonlinear differential equations.
The solution of these equations was built using periodic symmetrical Ateb-functions. Senyk used solutions of Ateb-functions in the study of stationary oscillations in essentially nonlinear systems that interact with the energy source. In particular, periodic Ateb-functions were used to construct resonant modes.
In the 1970s, a student of Senyk—A.M. Vozny [27]—for the first time decomposed hyperbolic and periodic Ateb-functions into Taylor series in the vicinity of the initial value of the argument ω = 0 at n = 1. Vozny used Ateb-functions to study the motion of an object with constant mass under the action of frontal resistance forces proportional to the nonlinear velocity, the dynamic part of the problem was solved, which is reduced to minimizing the integral.

2.4. Models of the Periodic Symmetrical Ateb-Functions

Let n, m be parameters defined by the relations:
n = 2 Q ˙ 1 + 1 2 Q ¨ 1 + 1 ,   m = 2 Q ˙ 2 + 1 2 Q ¨ 2 + 1 ,   ( Q ˙ 1 ,   Q ¨ 1 ,   Q ˙ 2 ,   Q ¨ 2 = 0 , 1 , 2 , )
Let us consider the expression:
ω = 1 2 1 1 u 1 t n n + 1 ( 1 t ) m m + 1 d t
Substituting variables of the form t = 1 u ¯ m + 1 from formula (3) we obtain the ratio:
ω = m + 1 2 1 1 u 1 ( 1 u ¯ m + 1 ) n n + 1 d u ¯
The dependence u on ω for the integral (4) is a function n and m and is called the Cos(ω) of the Ateb-function and is denoted by:
u = c a ( m , n , ω )
If n = m = 1, then we obtain u = Cos(ω).
It was also proved in [27] that the Ateb-functions introduced in this way are periodic with period Π (m, n) where [28]:
Π ( m , n ) = Γ ( 1 n + 1 ) Γ ( 1 m + 1 ) Γ ( 1 n + 1 + 1 m + 1 ) .
In (6) Γ(1/(n + 1)), Γ(1/(m + 1)) is a gamma function.
Therefore, if necessary, the calculation of functions is sufficient for the argument ω that varies on the segment:
0 ω 1 2 Π ( m , n )
Using the properties of periodicity, you can continue a series of calculations. Thus, it is easy to obtain the value of the entire period of the Ateb-function.

3. Wavelet Transformation of the Ateb–Gabor Function

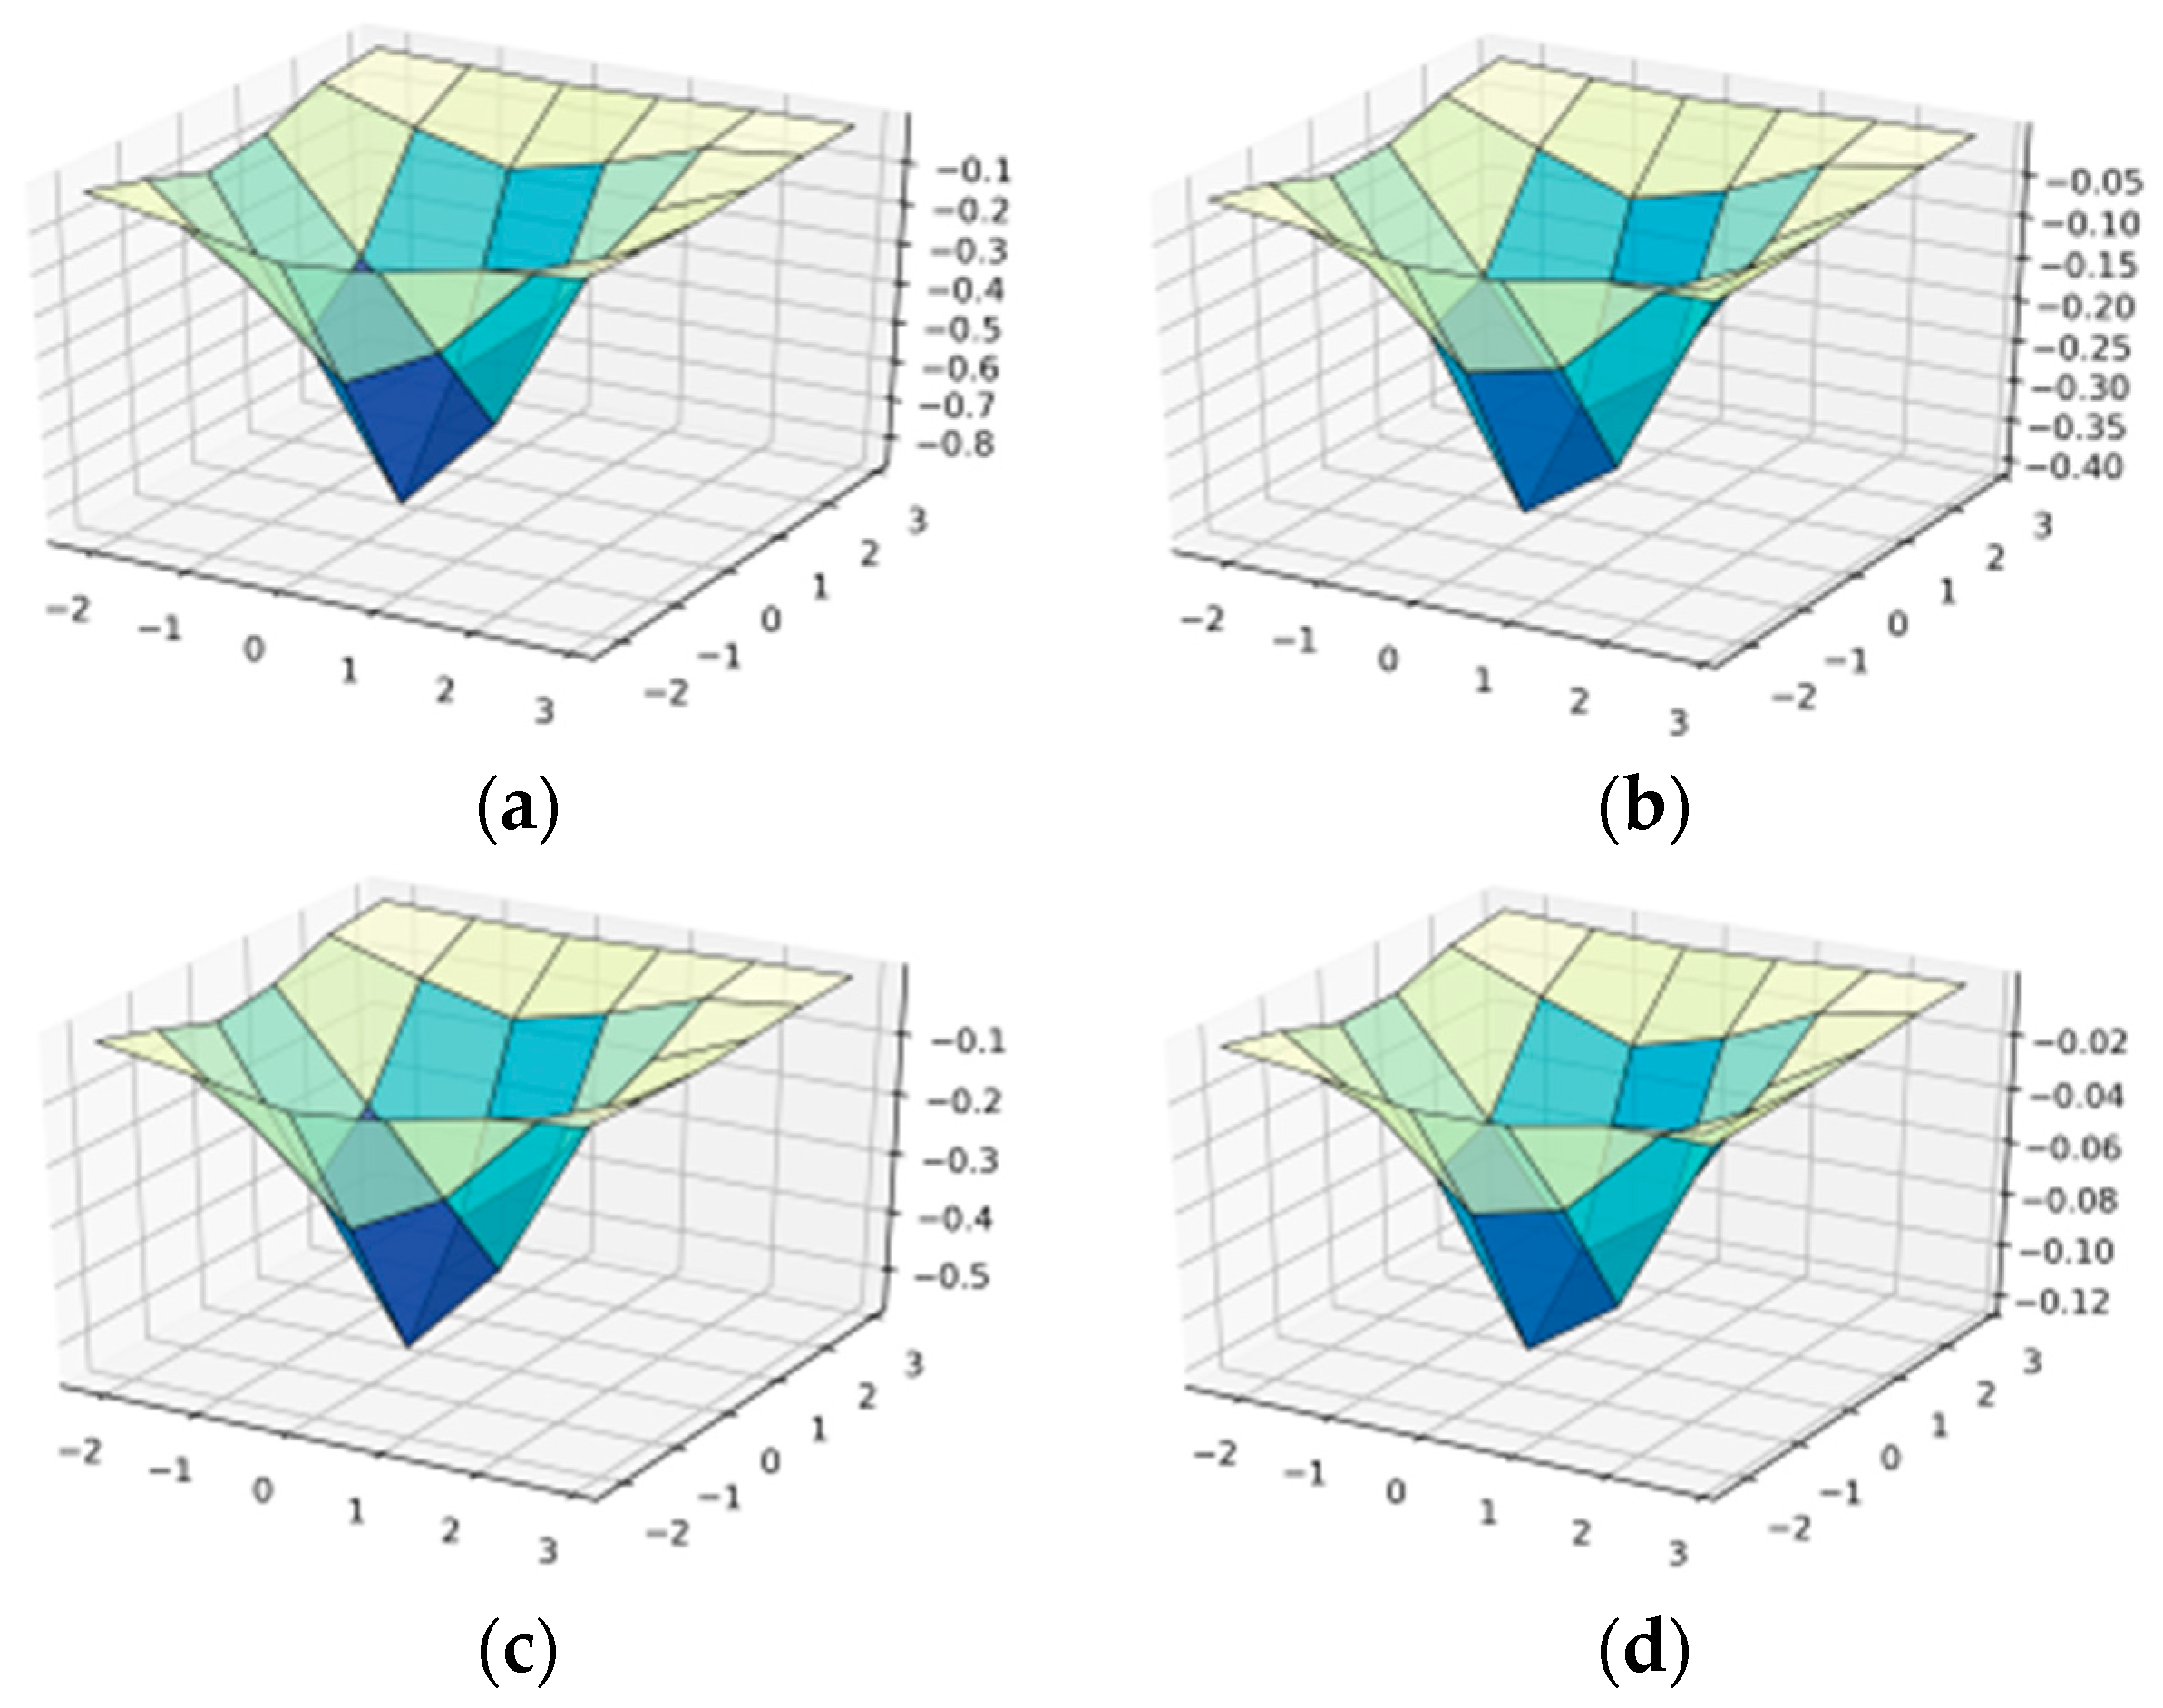
3.1. New Type of Filtering

We have proposed a new type of filtering, which is built by developing a new method of transforming the wavelet-Ateb–Gabor, which will allow the use of a wider range of filtration sets and better filter biometric images. A new method for classifying fingerprint images by types of papillary patterns based on the usage of the Ateb–Gabor filter, which is implemented by wavelet transforms, is proposed. The functional scheme of identification is shown in Figure 2.
The functional identification scheme allows you to reduce the time spent on computing Ateb–Gabor functions and on image filtering and reduce computational costs. We can influence the decision of results by time and frequency. This is used in Fourier transforms.

3.2. Mathematical Model of Wavelet Transform Ateb–Gabor Function
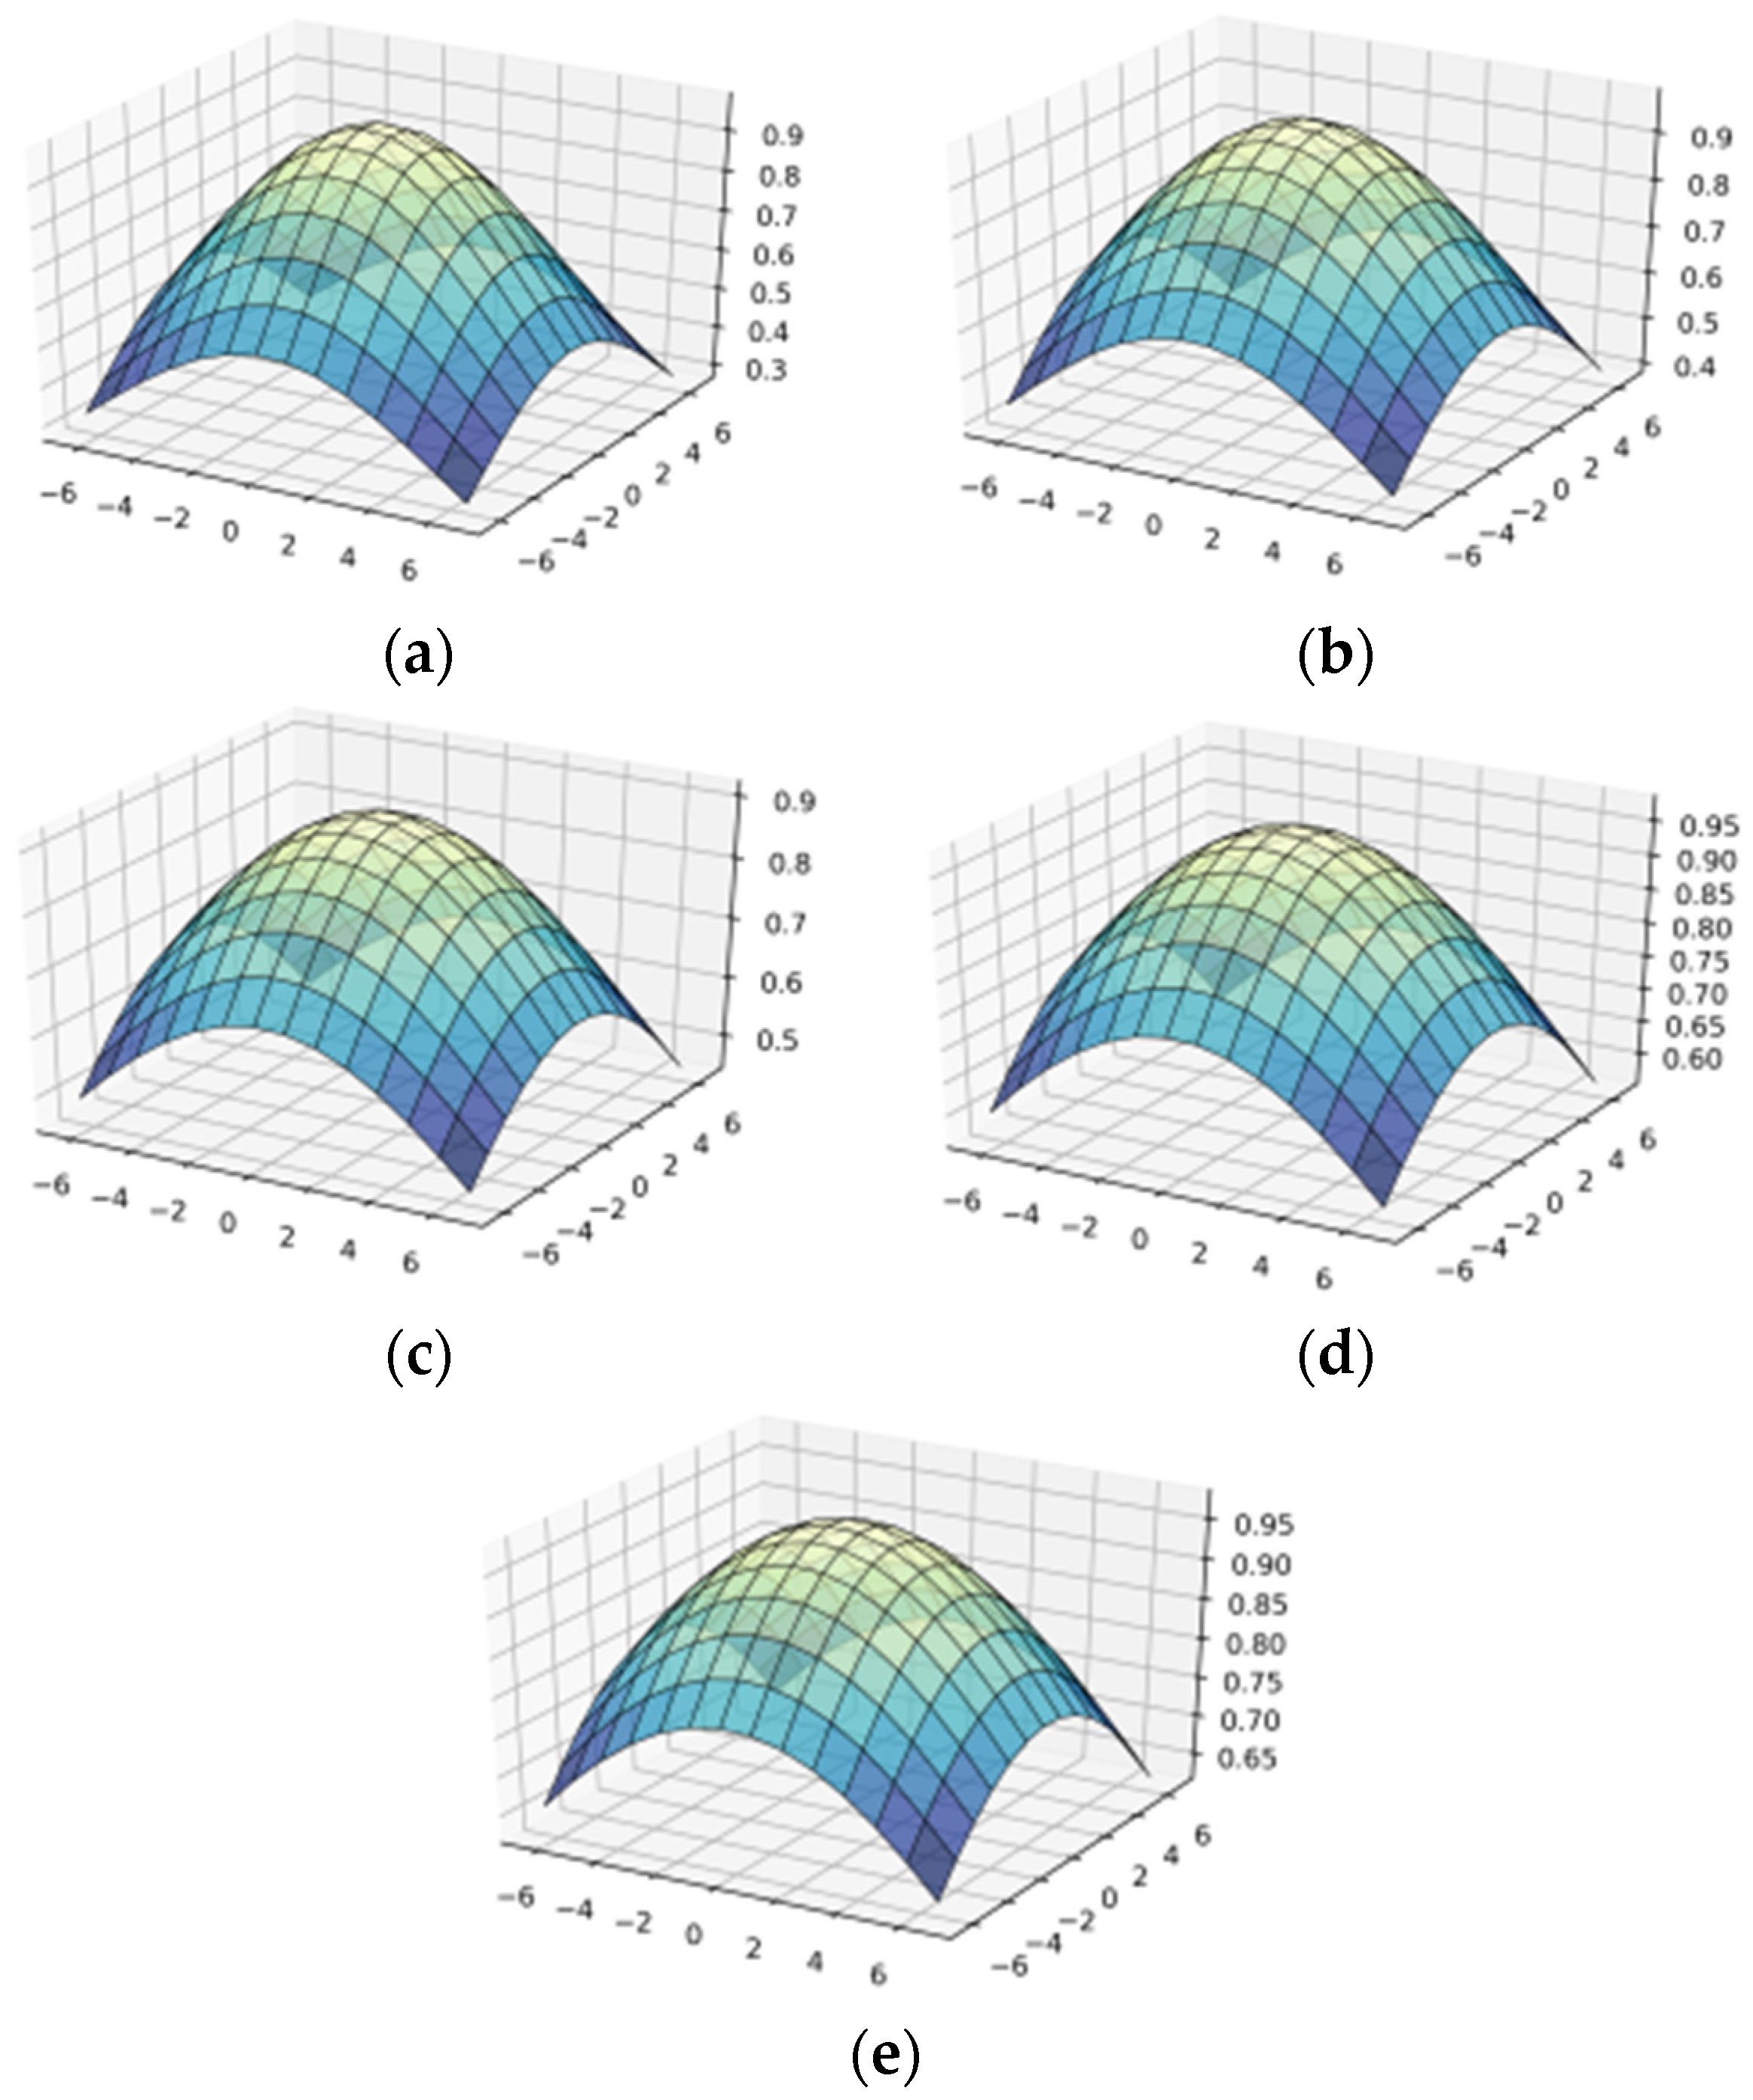
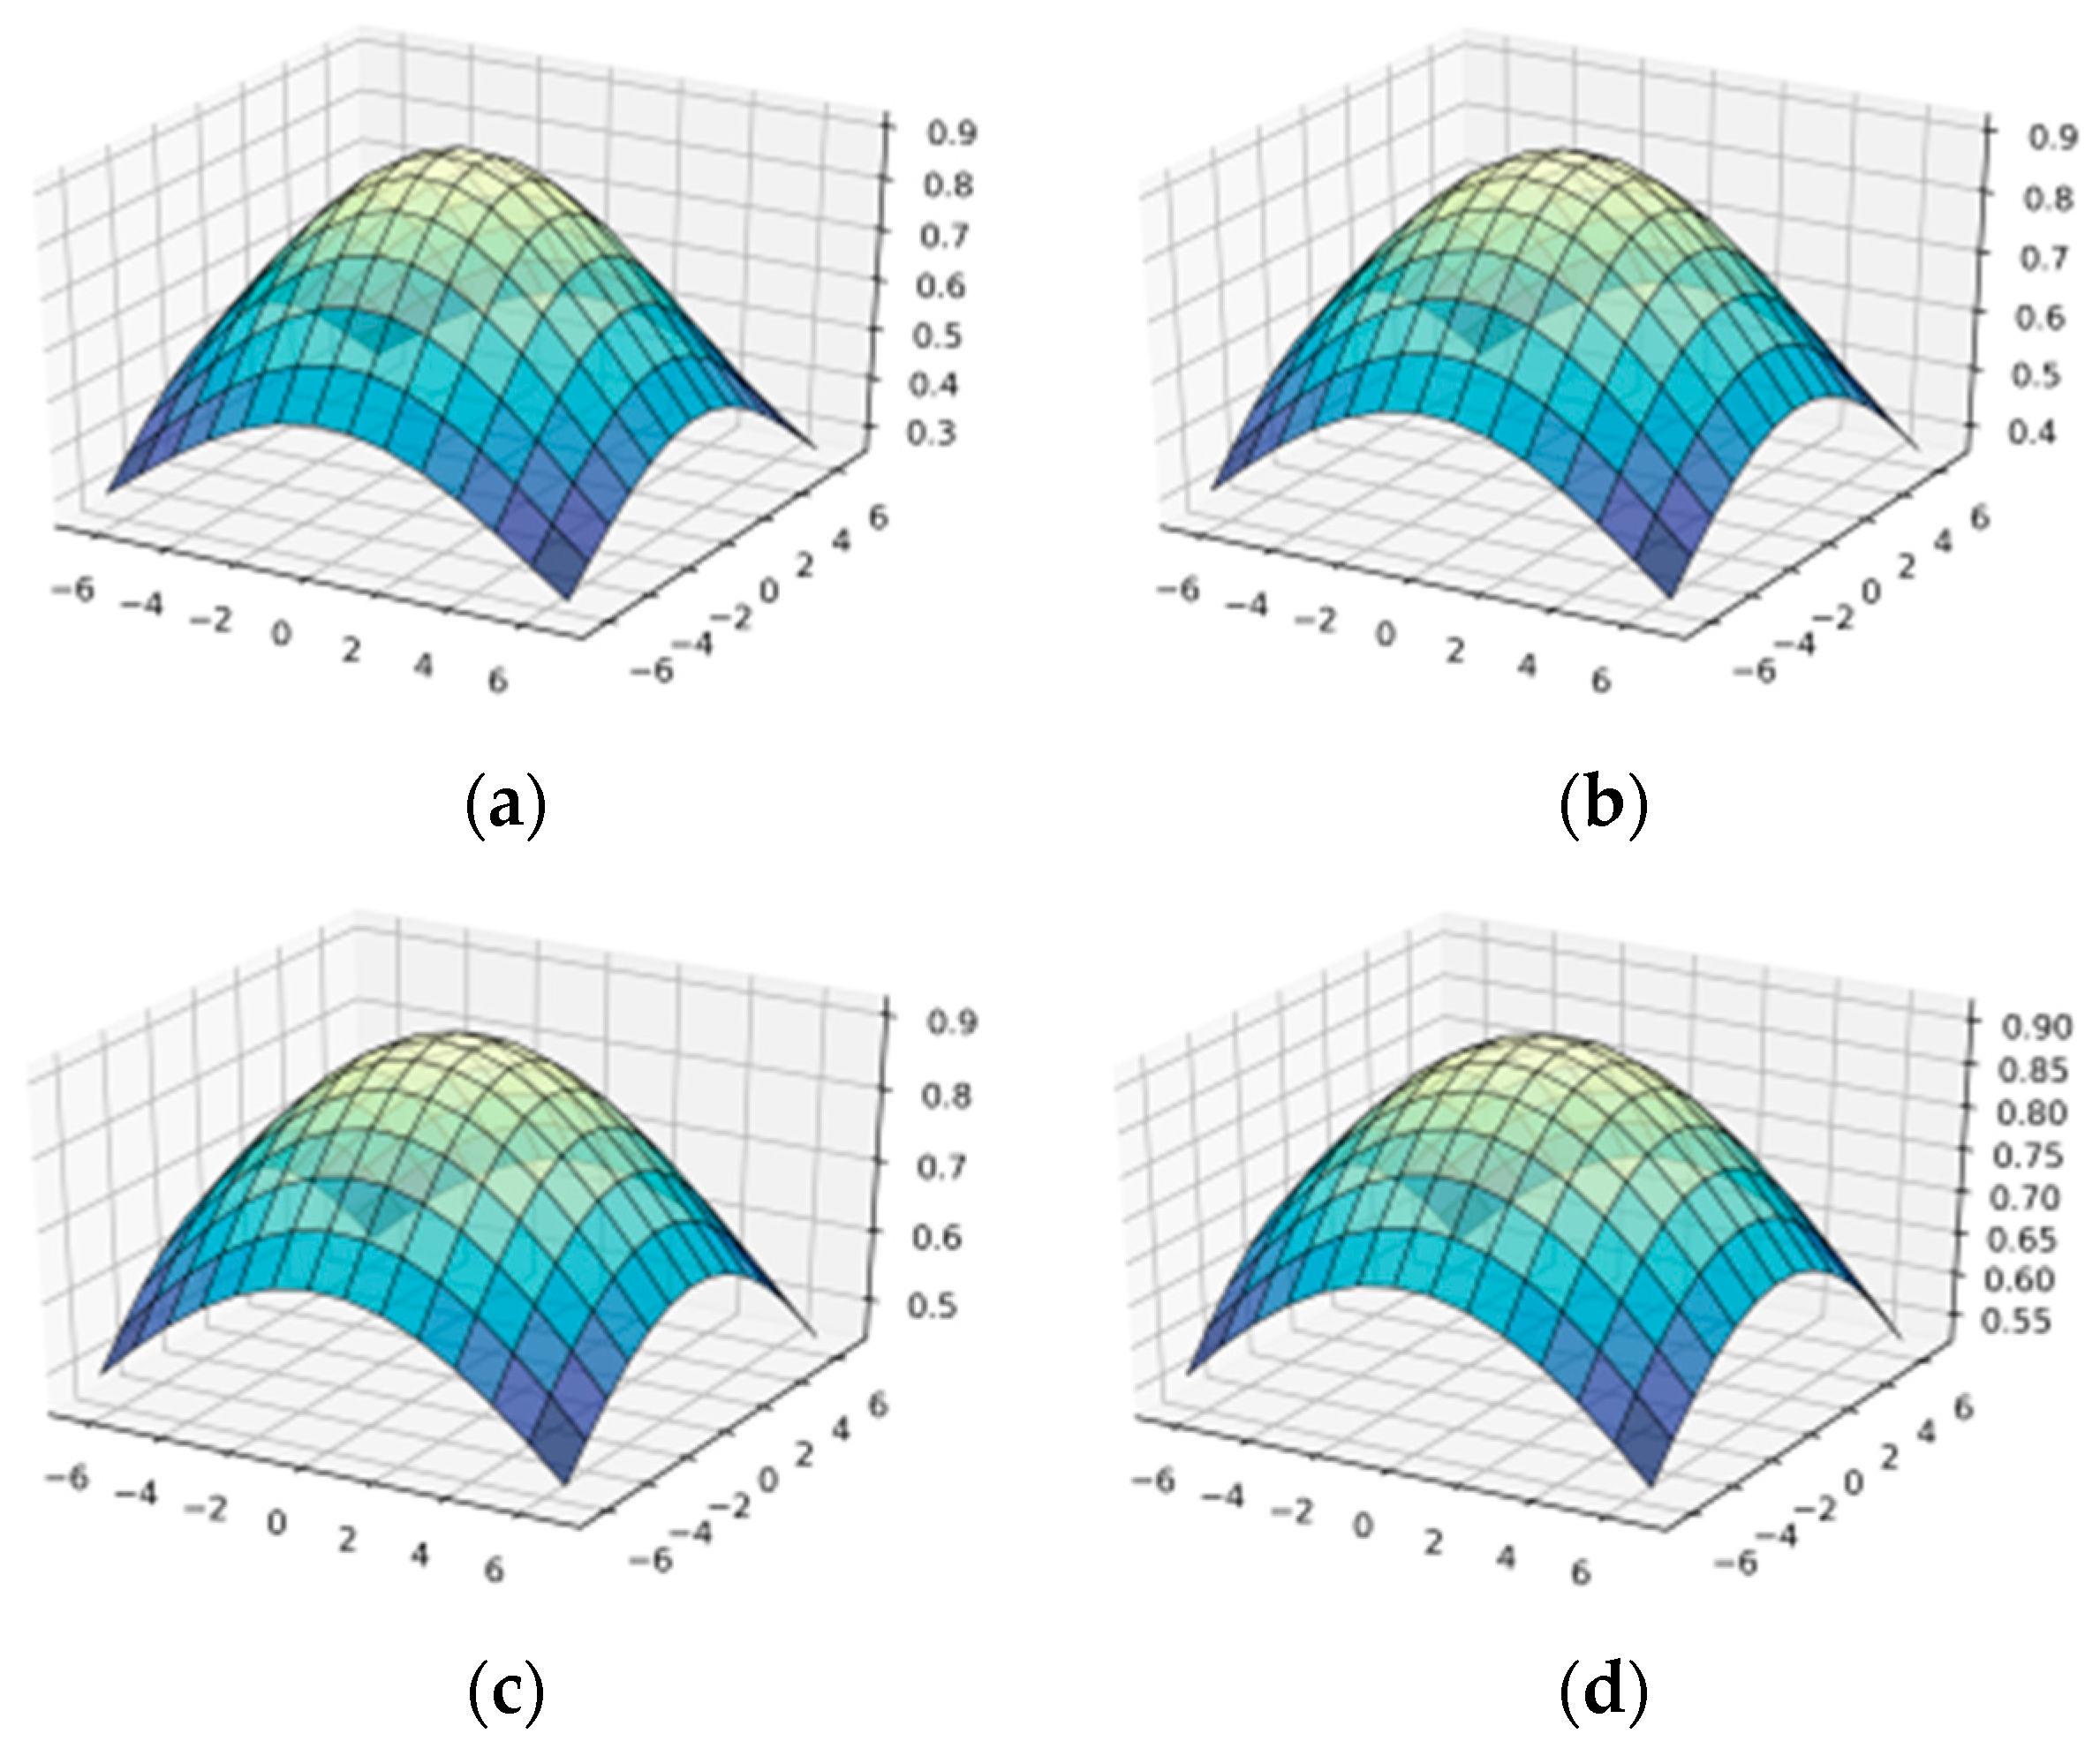
The wavelet transform of the function f(t) will look like:
W ( a , b ) = 1 | a | f ( t ) ψ ( t b a ) d t ,
where ψ ( t b a ) —is a complex conjugation of the function ψ ( t ) the parameter bR corresponds to the time shift, and is called shift parameter, and the parameter a specifies the scaling and is a stretch parameter.
ψ ( t ) = ( 1 t 2 ) e t 2 / 2 ,
Wavelet functions are characterized by independent frequency and time values. Therefore it is possible to simulate processes in time and frequency domains with their help. The best filters for image preprocessing are Haar wavelets, Daubechies, WAVE, MHAT, which are described in [29]. When solving classification problems, it is possible to change the shape of the wavelet transformation by introducing a discrete wavelet transformation [30].
W ψ ( a , b ) = 1 | a | i = 0 N 1 f ( t ) ψ ( i b a ) ,
Using (7) and (8) we define ψ a , b ( t ) as:
ψ a , b ( t ) = 1 a ψ ( t b a ) = ( 1 ( t b ) 2 a 2 ) · e ( t b ) 2 2 a 2 a ,
The function f (m, n, t), which is an Ateb–Gabor, has the form:
f ( m , n , t ) = e t 2 2 σ 2 C a ( m , n , 2 Π , θ , t ) ,
where Ca(m, n, 2Π, θ, t) is an Ateb function, e t 2 2 σ 2 is the deviation of the Gaussian nucleus, which determines the amplitude of the function, σ —is standart deviation of the outer Gaussian function.
The integral transformation of the wavelet function Ateb–Gabor A T E B G ( a , b , m , n , θ , σ , t ) according to (7) and (10) can be calculated as:
A T E B G ( a , b , m , n , θ , σ , t ) = 1 | a | e t 2 2 σ 2 C a ( m , n , 2 Π , θ , t ) ψ ( t b a ) d t
After some transformations, we get:
A T E B G ( a , b , m , n , θ , σ , t ) = 4 σ 2 t e t 2 2 σ 2 C a ( m , n , 2 Π , θ , t ) + 2 m + 1 e t 2 2 σ 2 S a n ( n , m , 2 Π , θ , t ) d t .

3.3. Wavelet-Ateb–Gabor Function A T E B G ( a , b , m , n , θ , σ , t ) with Different Parameters σ

As a result of visualization of formulas (1) and (12), the surfaces of the wavelet transform Ateb–Gabor function A T E B G ( a , b , m , n , θ , σ , t ) with different parameters were constructed (Figure 2, Figure 3, Figure 4 and Figure 5 and Appendix A Figure A2), which helped in the future to conduct better filtration.
Figure 3 shows the surface of the wavelet-Ateb–Gabor function A T E B G ( a , b , m , n , θ , σ , t ) with the parameters m = 1 ,   n = 1 . When we increase parameter σ, the function becomes more convex, so the filtering effect will be applied to a larger area of the image. The greater σ (as seen in Figure 2), the larger the more significant change in brightness in the image can be observed. The plots for σ = 6, 7, 8, 9, 10 are given in Appendix A Figure A2.

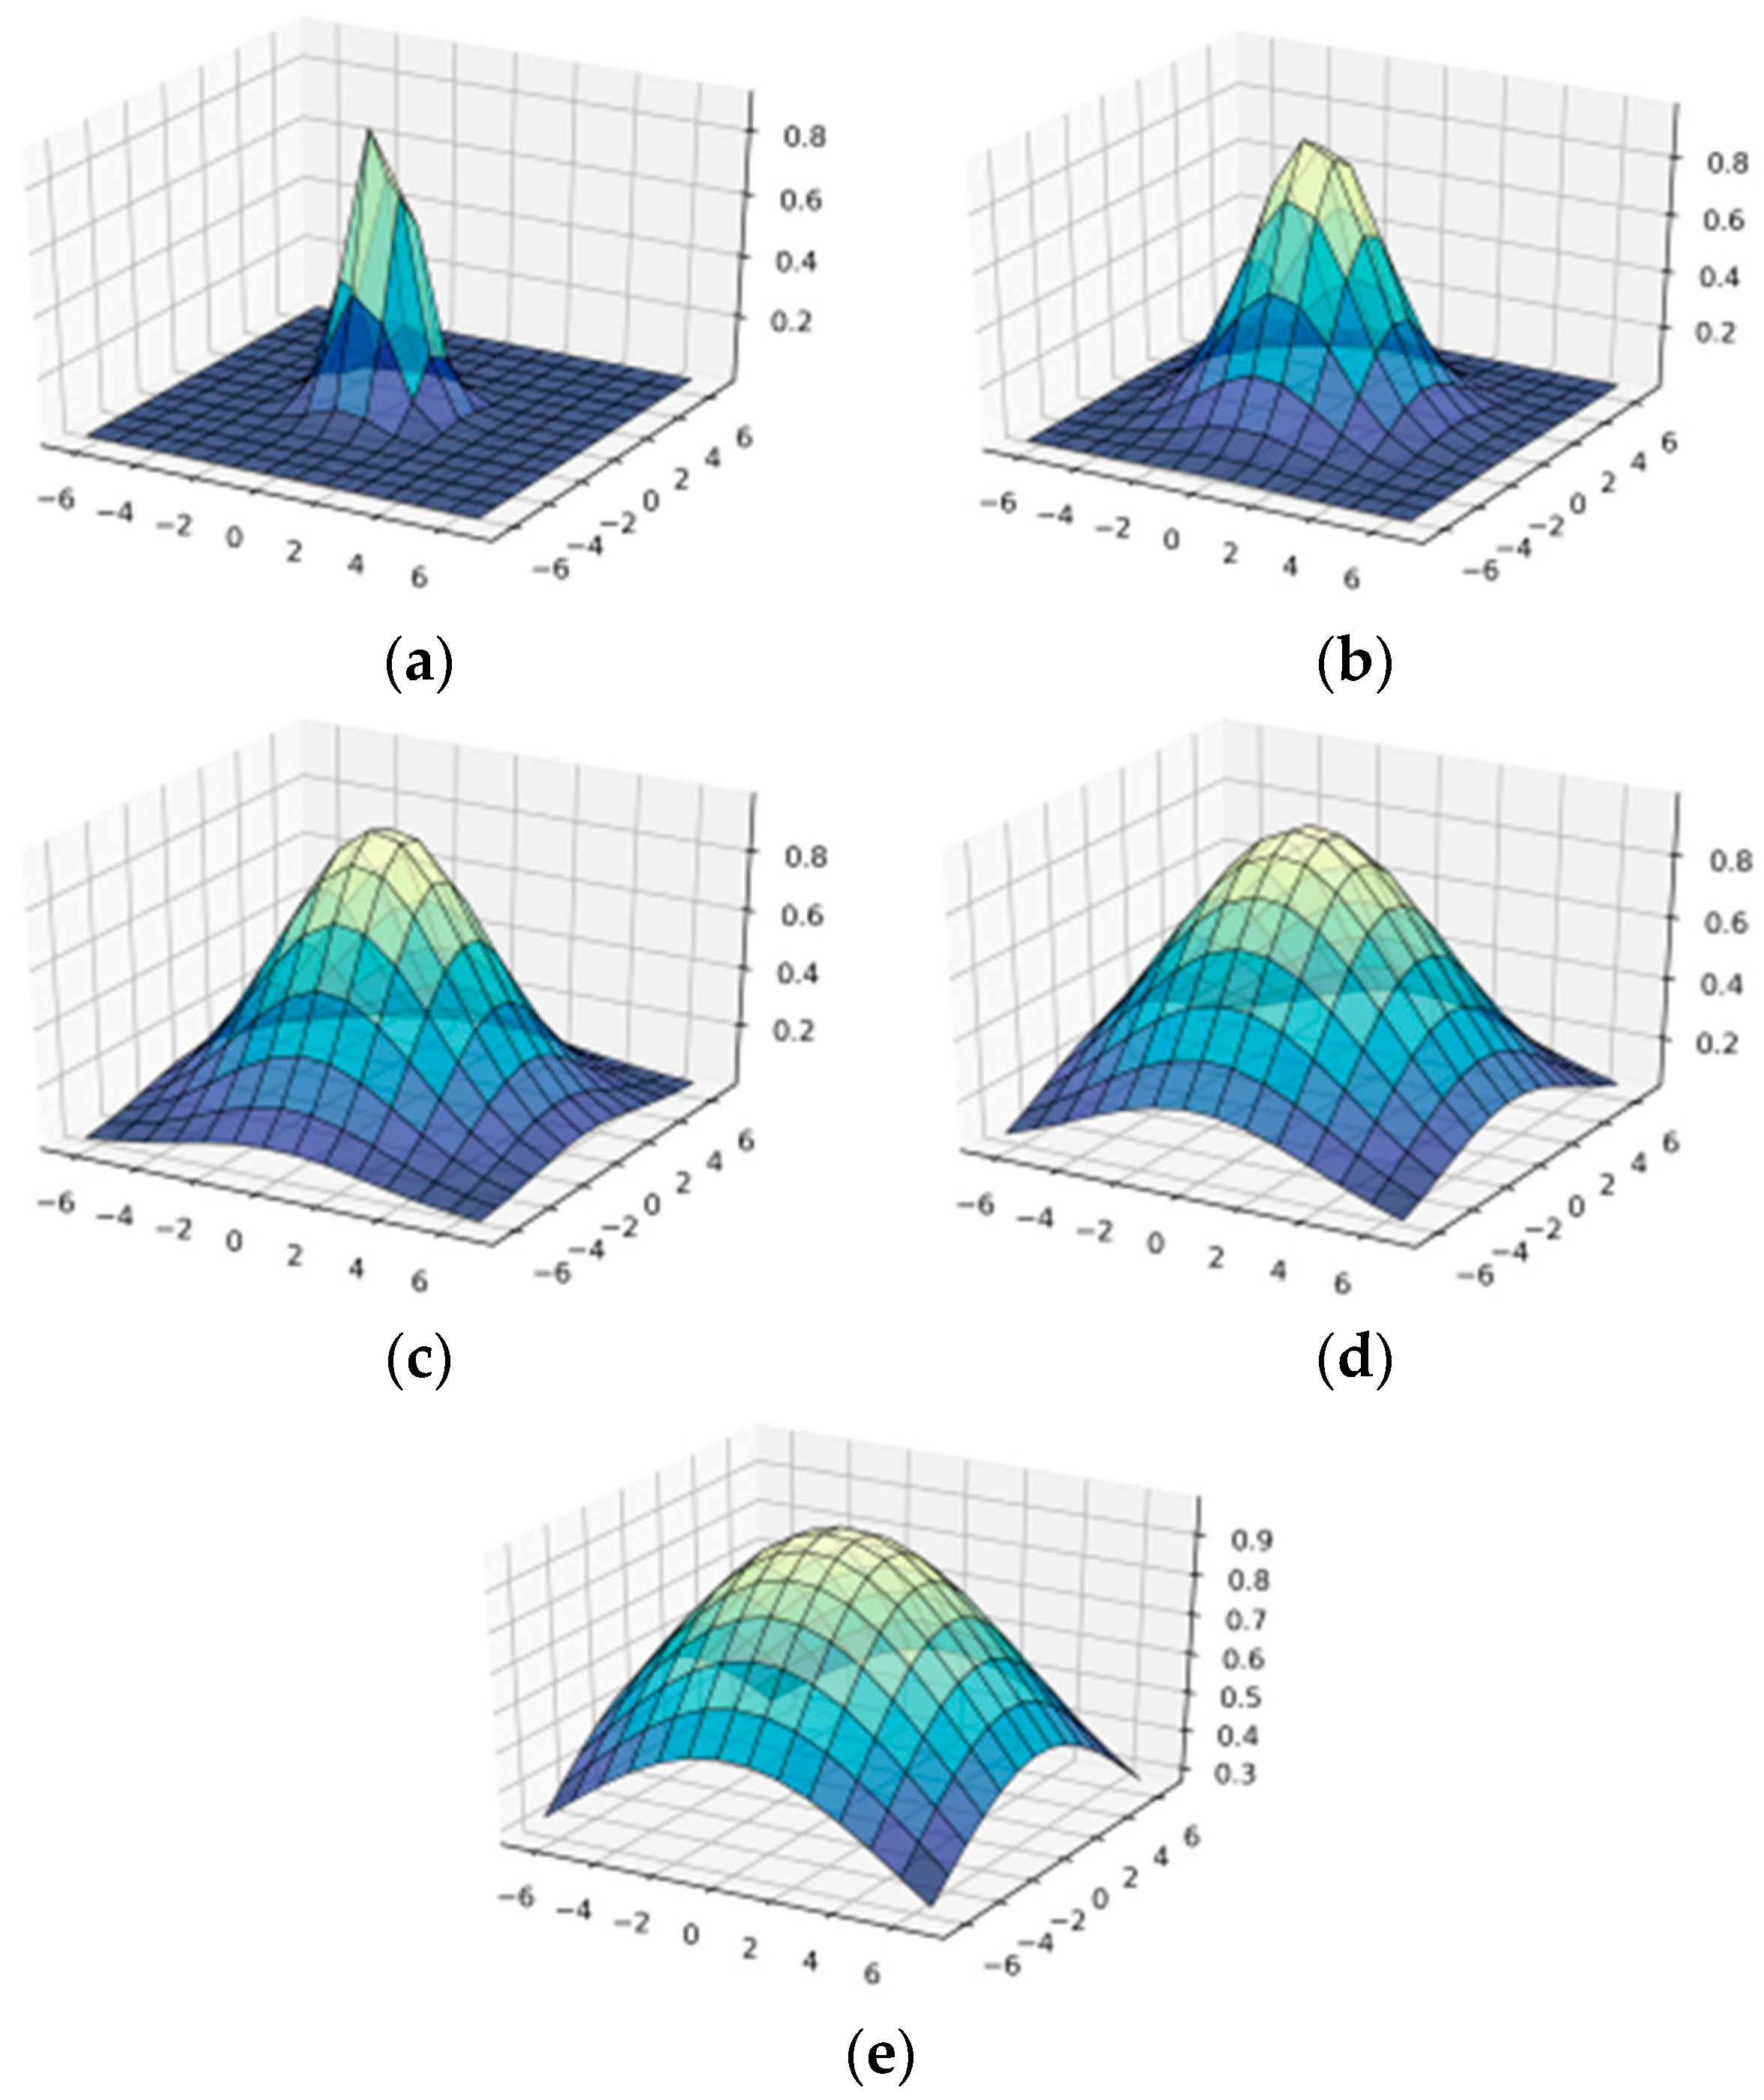
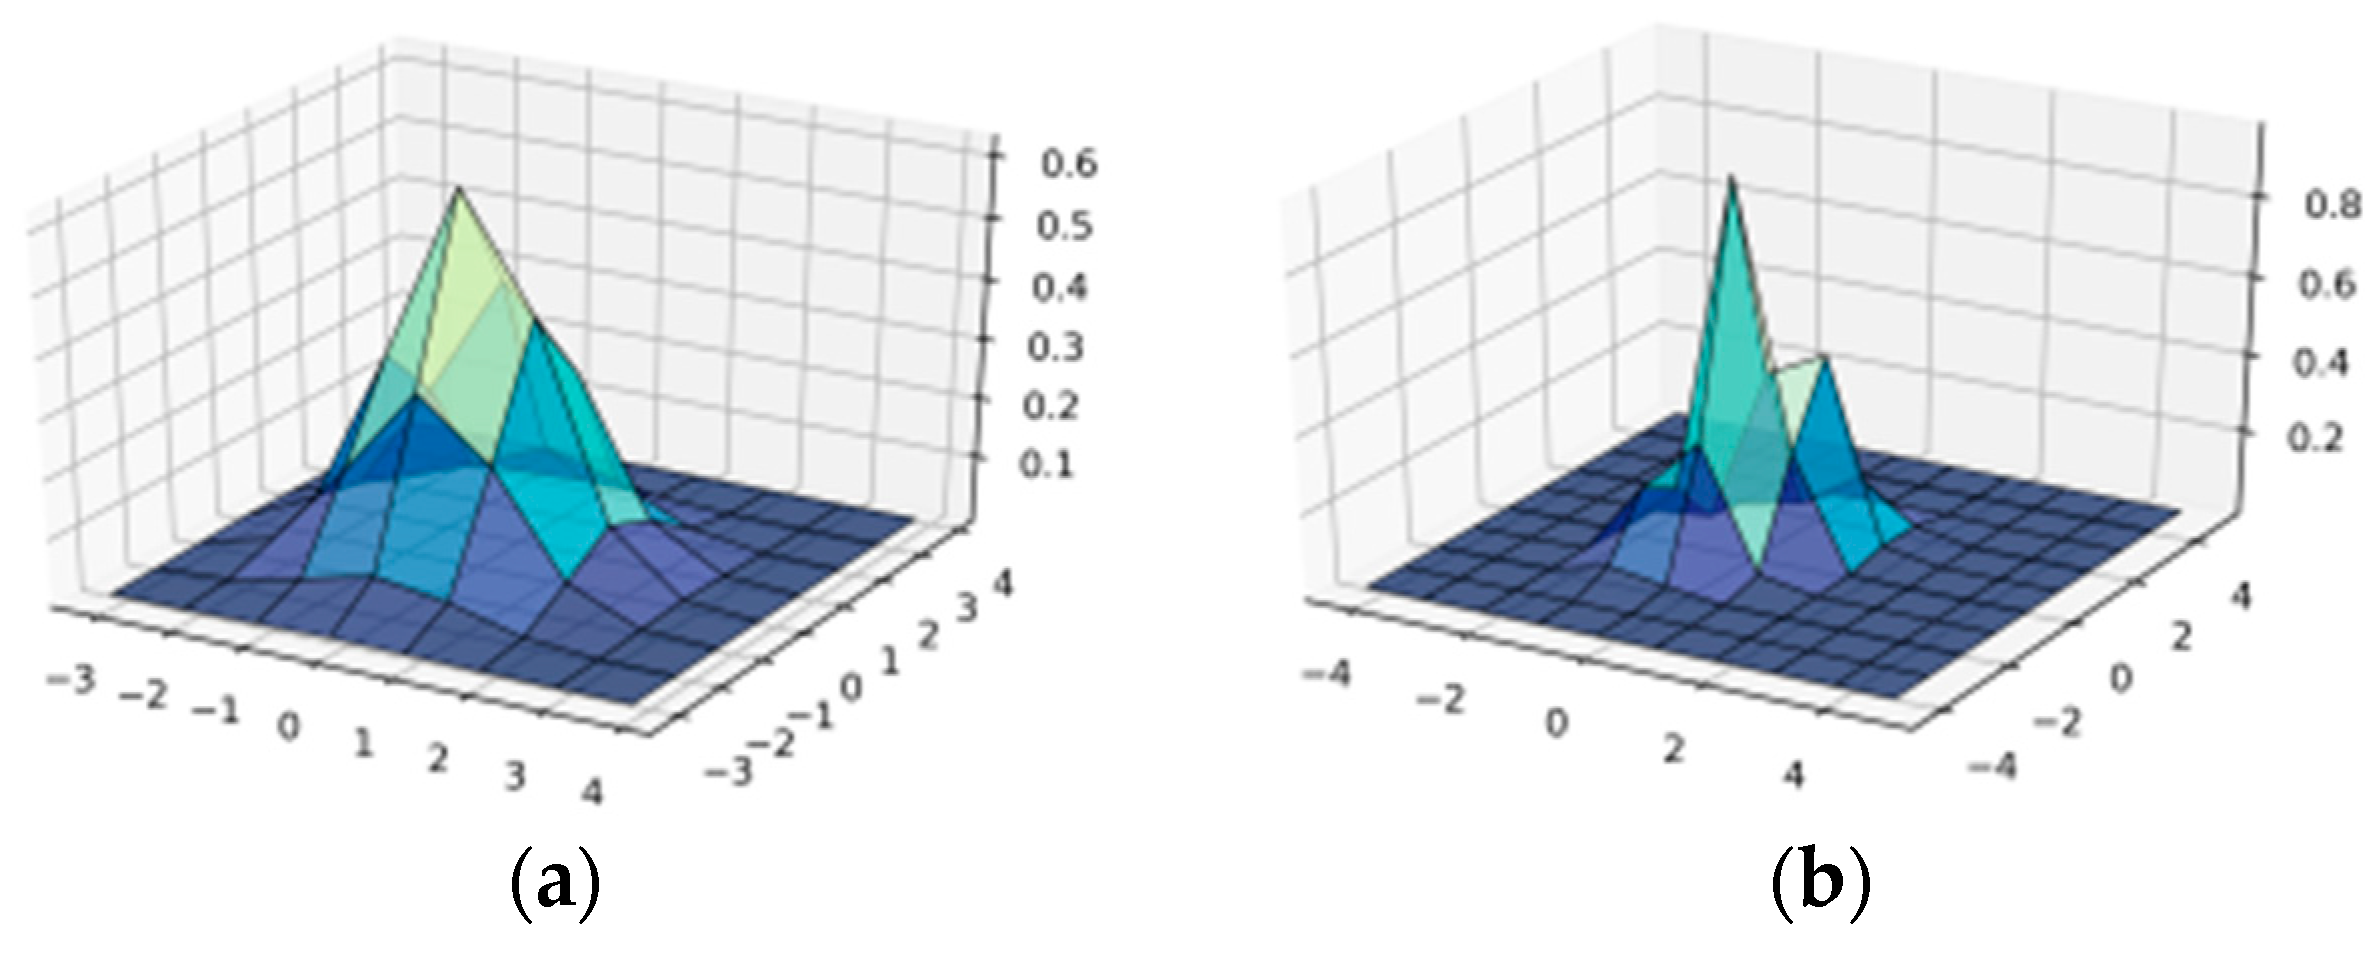
3.4. Simulation of Wavelet-Ateb–Gabor Function with Parameters n, 0 < n < 1

The numerical values of the period of the wavelet of the Ateb–Gabor function were calculated (Table 1). The values of m = 1 were taken to calculate the period, and n was changed from 0.1 to 1.
For the case when m = 1, σ = 1 and the parameter n acquires numbers less than one, we obtain such plots of ATEBG(a, b, m, n, θ, σ, t): as shown in Figure 4, or in Appendix A Figure A3.
When n is greater than one, we obtain such plots of ATEBG(a, b, m, n, θ, σ, t) as shown in Figure 5 and Figure 6, or in the Appendix A Figure A4 and Figure A5.

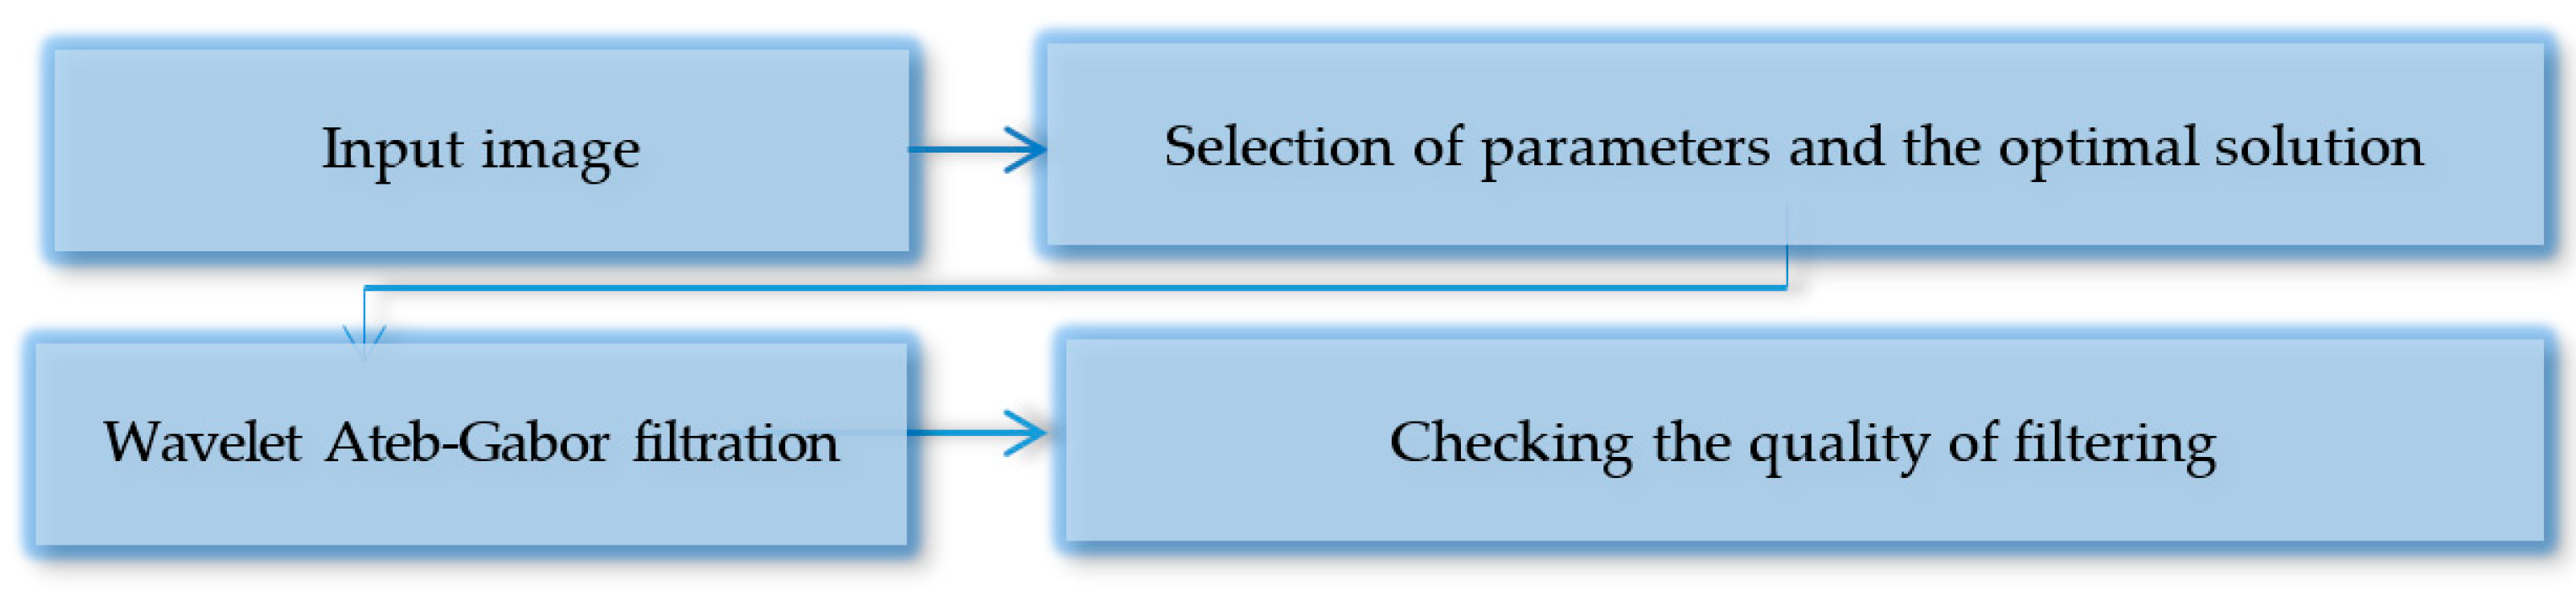
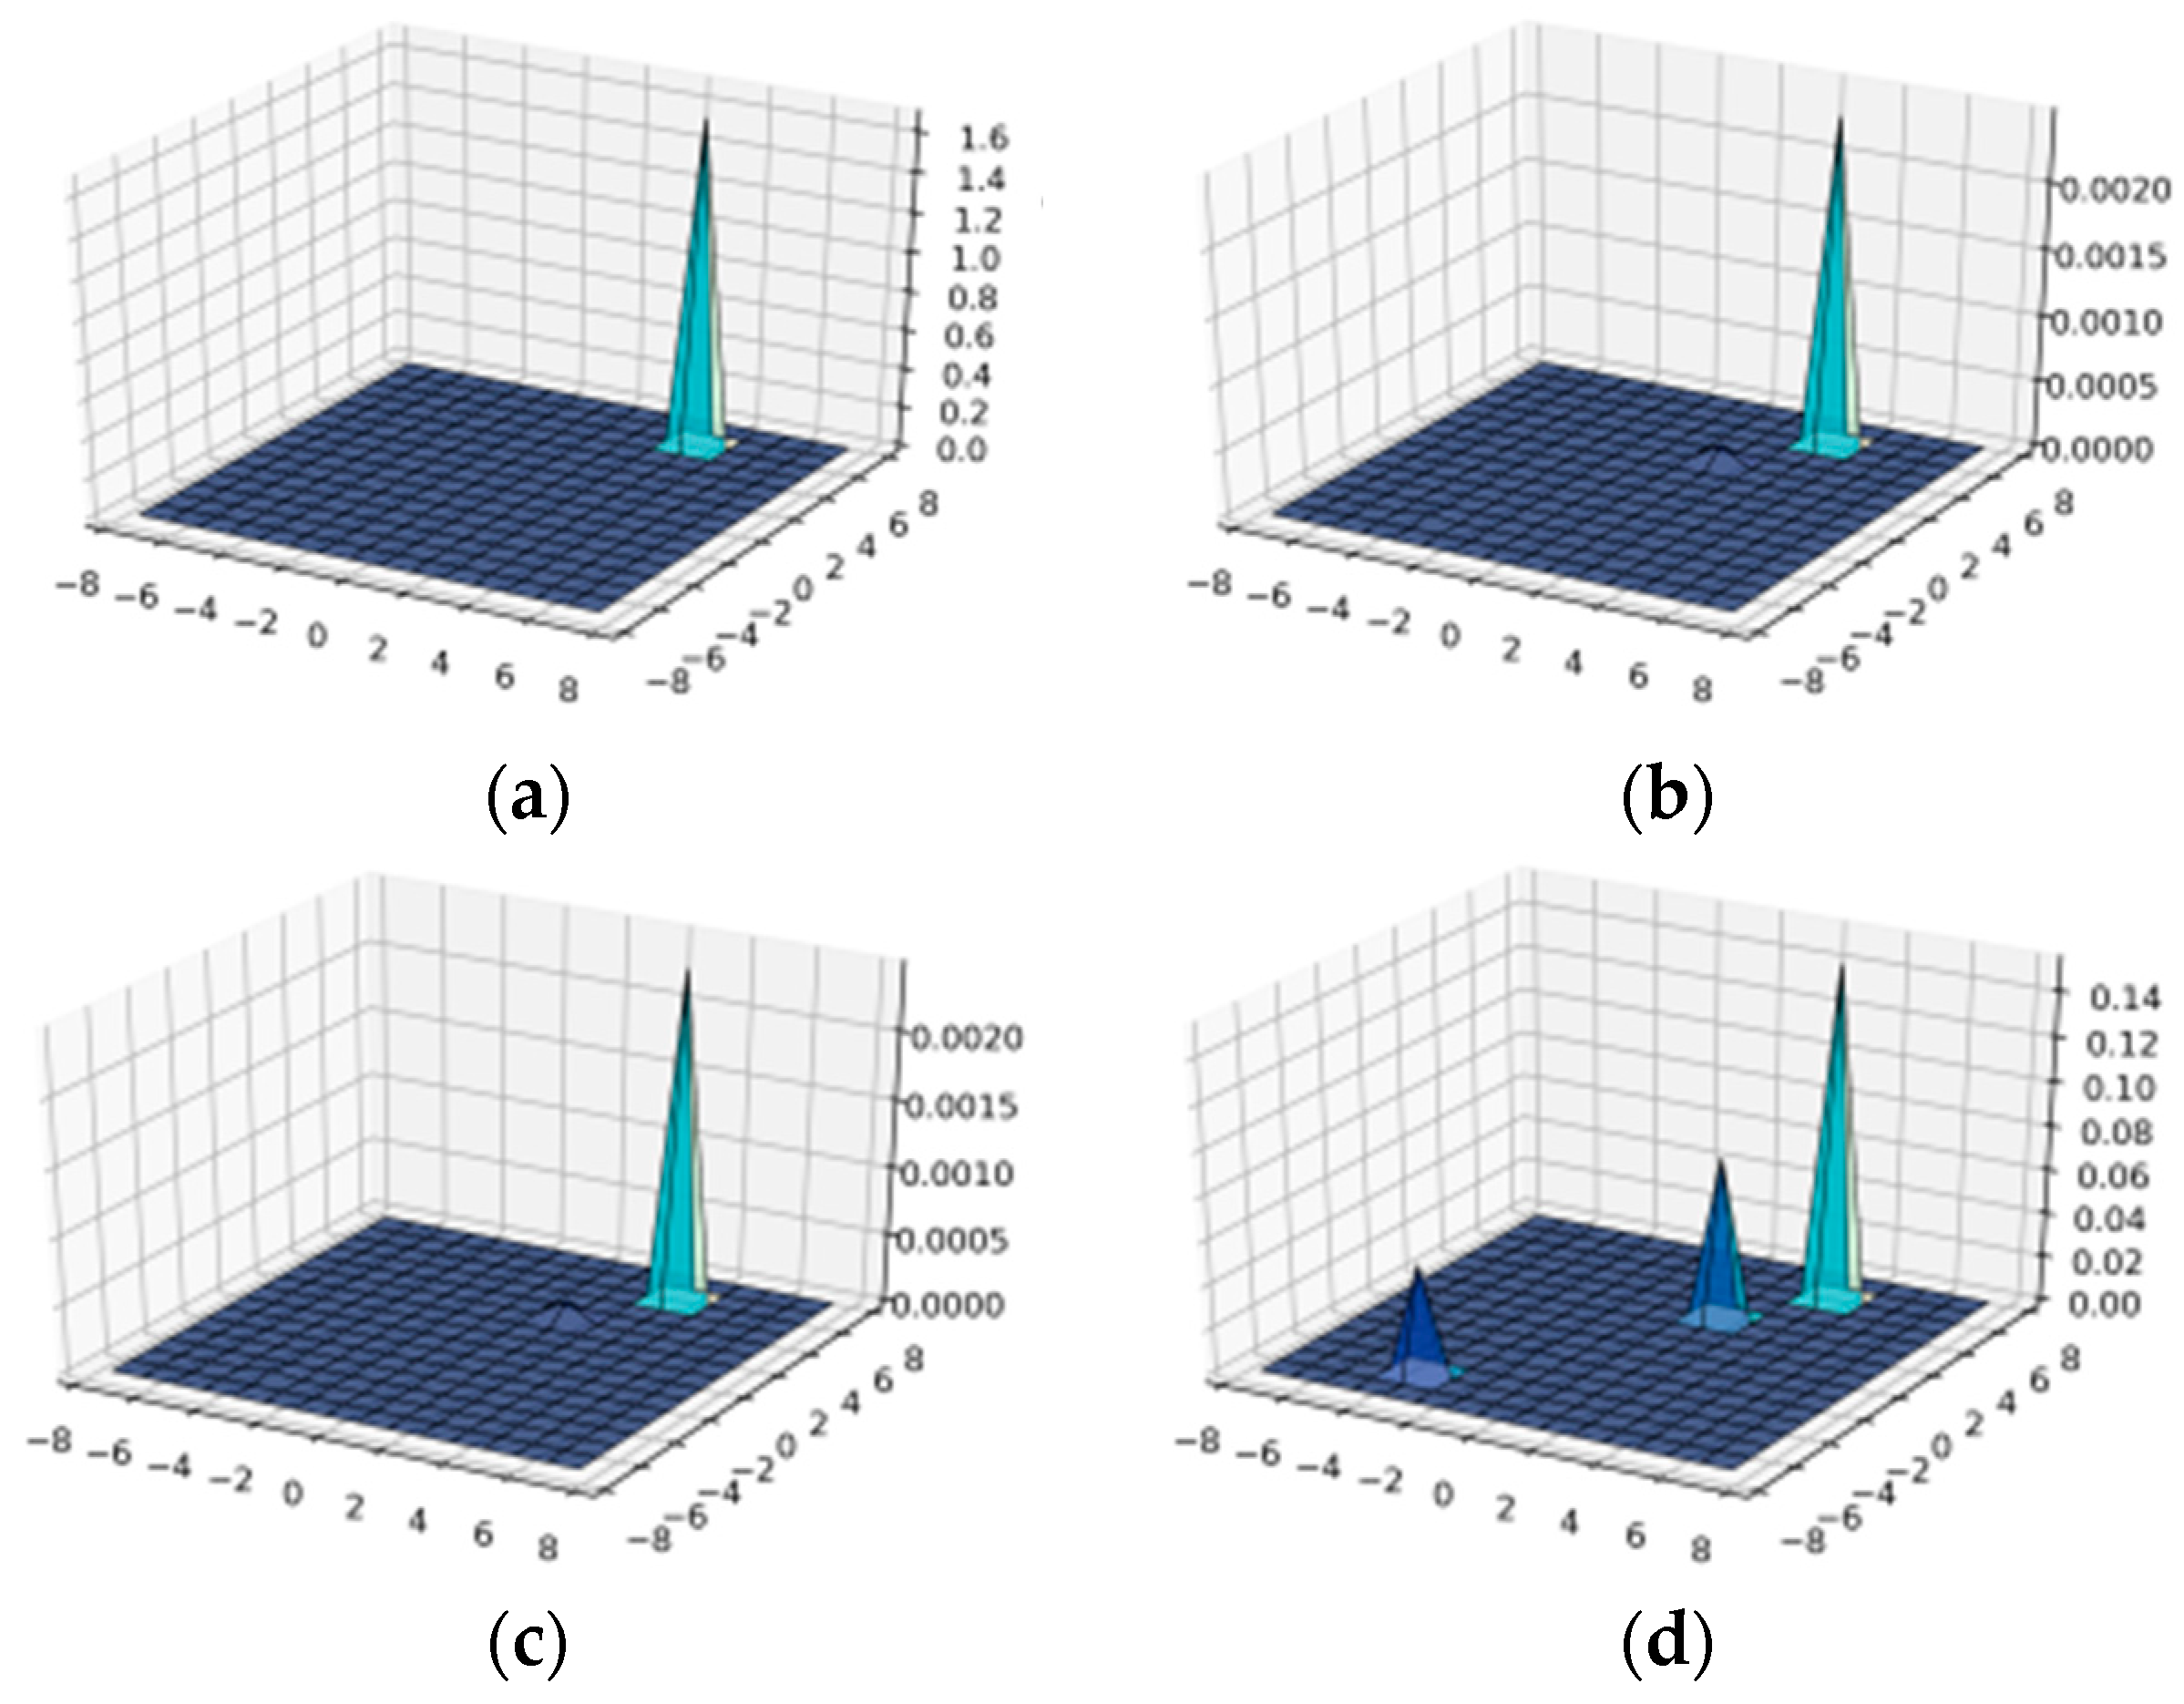
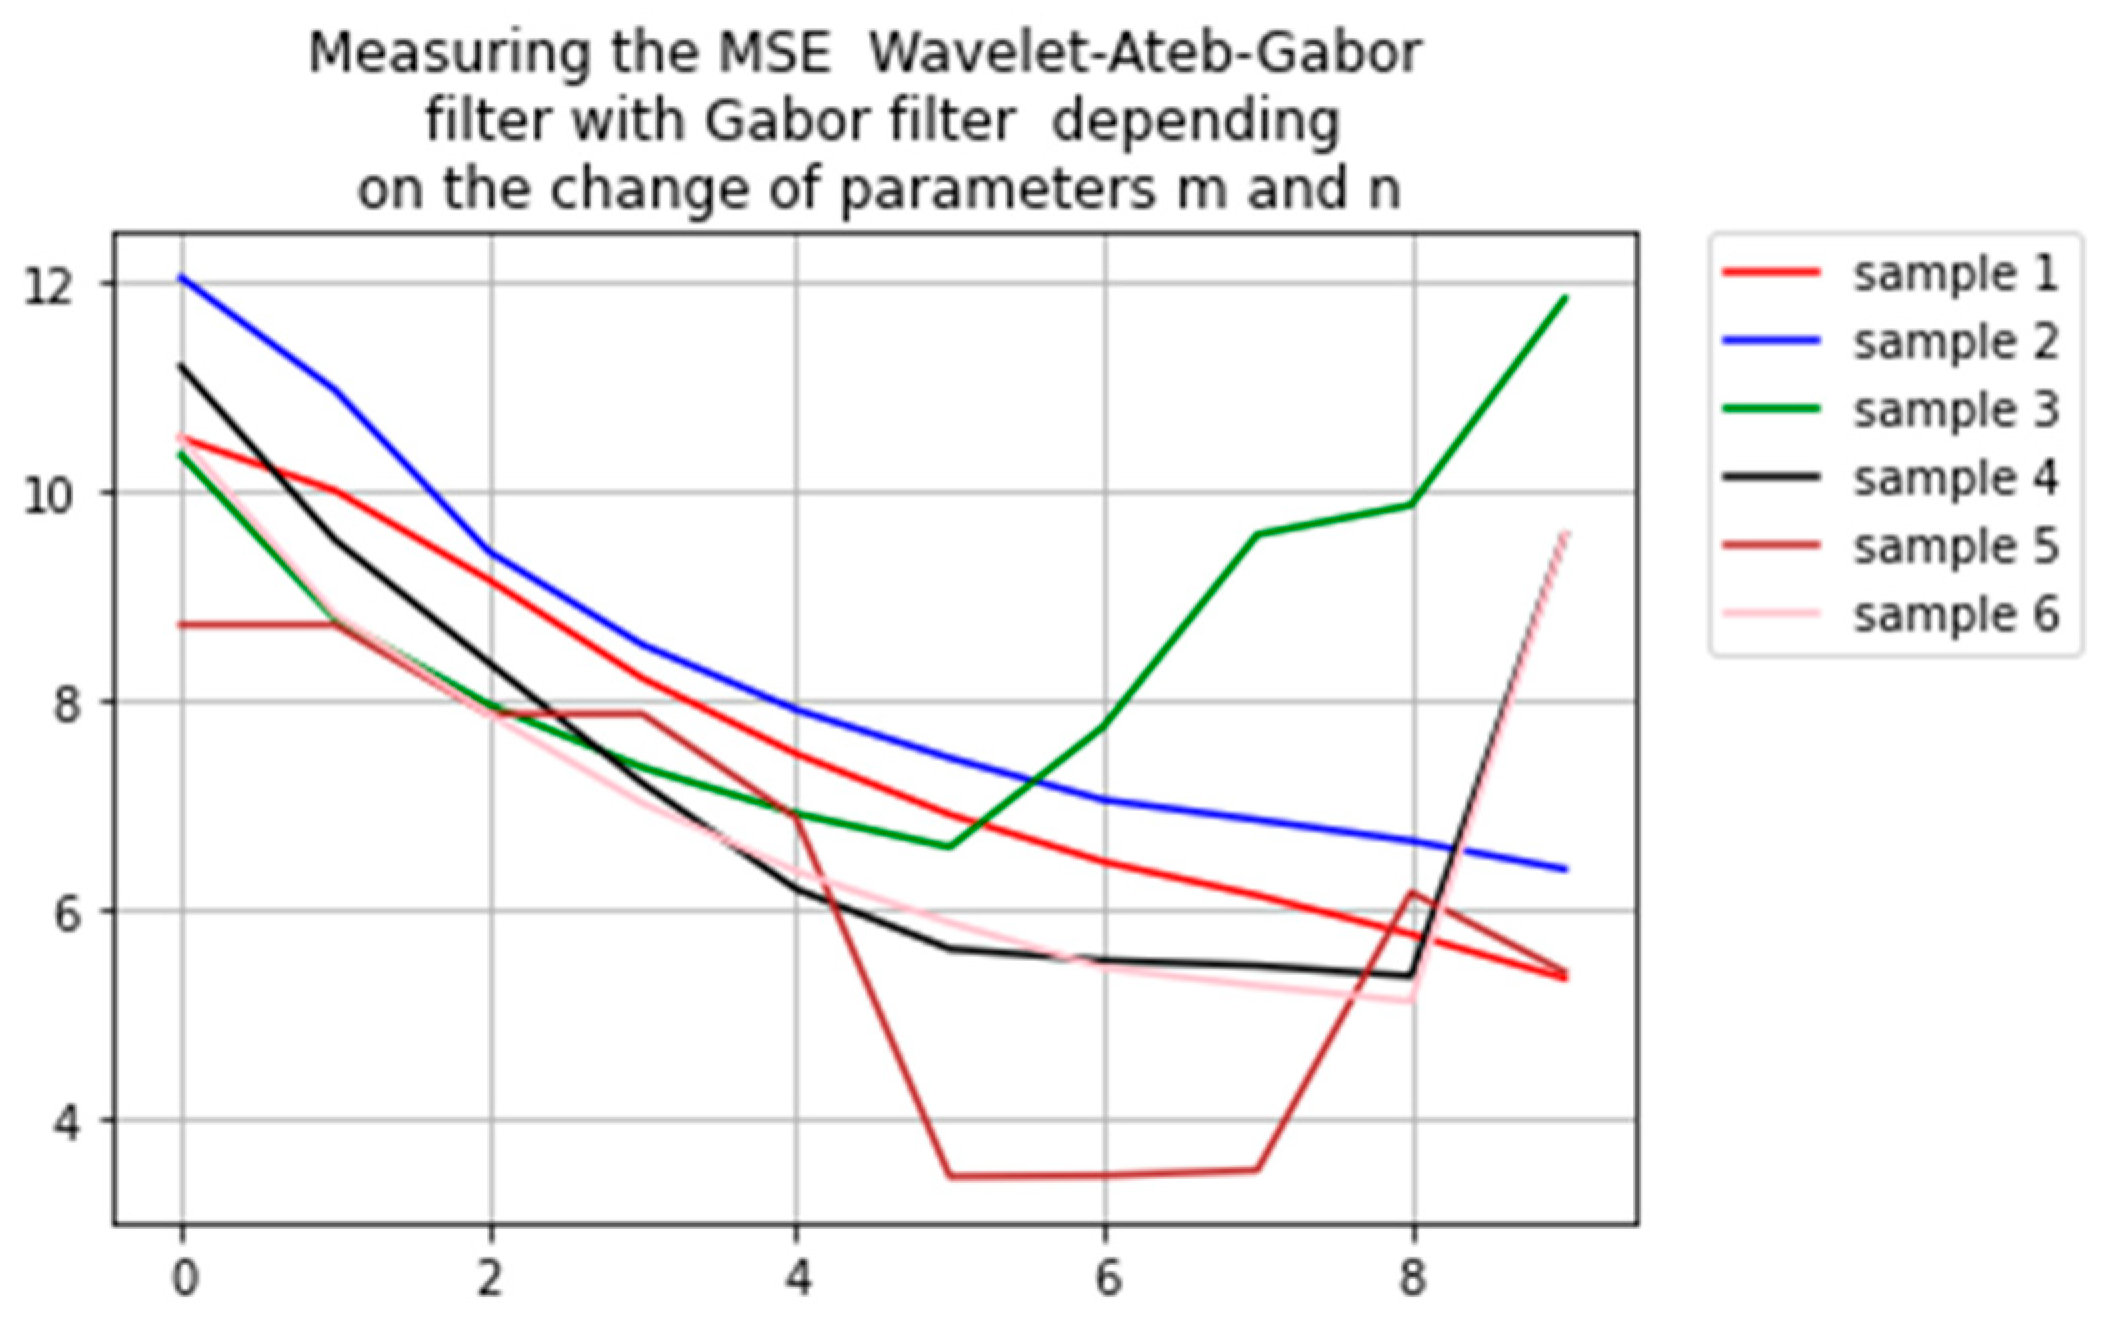
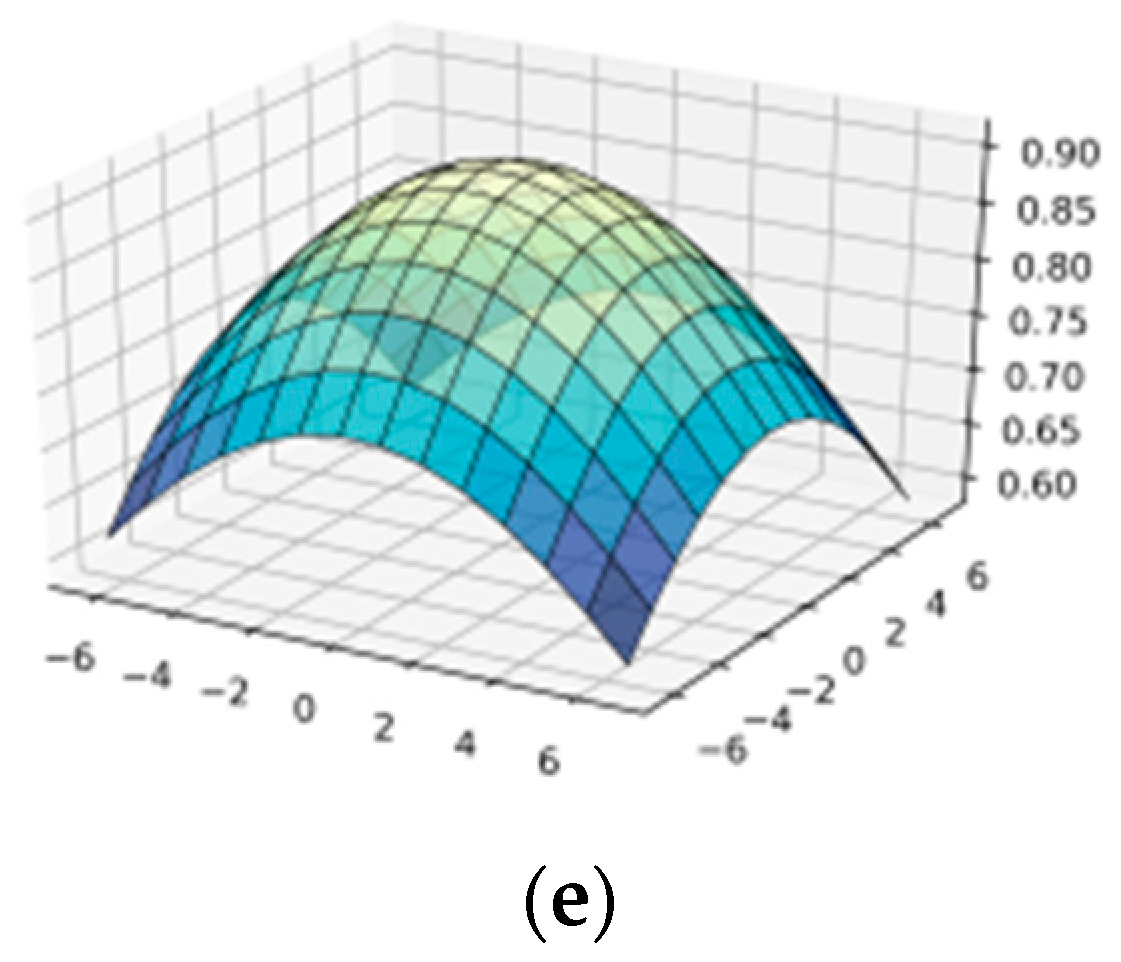
3.5. Simulation of Wavelet-Ateb–Gabor Function with Parameters m, 1 < m < 10

The numerical values of the period of the wavelet of the Ateb–Gabor function were calculated, when m is changing from 1 to 10, and n = 1 (Table 2).
From Figure 5 it follows that the surface of the wavelet-Ateb–Gabor function ATEBG(a, b, m, n, θ, σ, t) with parameters n = 1, σ = 1; when we increase the parameter m we observe different shape and value. At m = 1 and m = 2 there is a surface with positive values, but when m = 3 and m = 4, the image will be illuminated in those areas where the surface is located. Investigation of the wavelet-Ateb–Gabor function ATEBG(a, b, m, n, θ, σ, t) with parameters n = 1, σ = 1, and m = 5, 6 are given in Appendix A Figure A4.

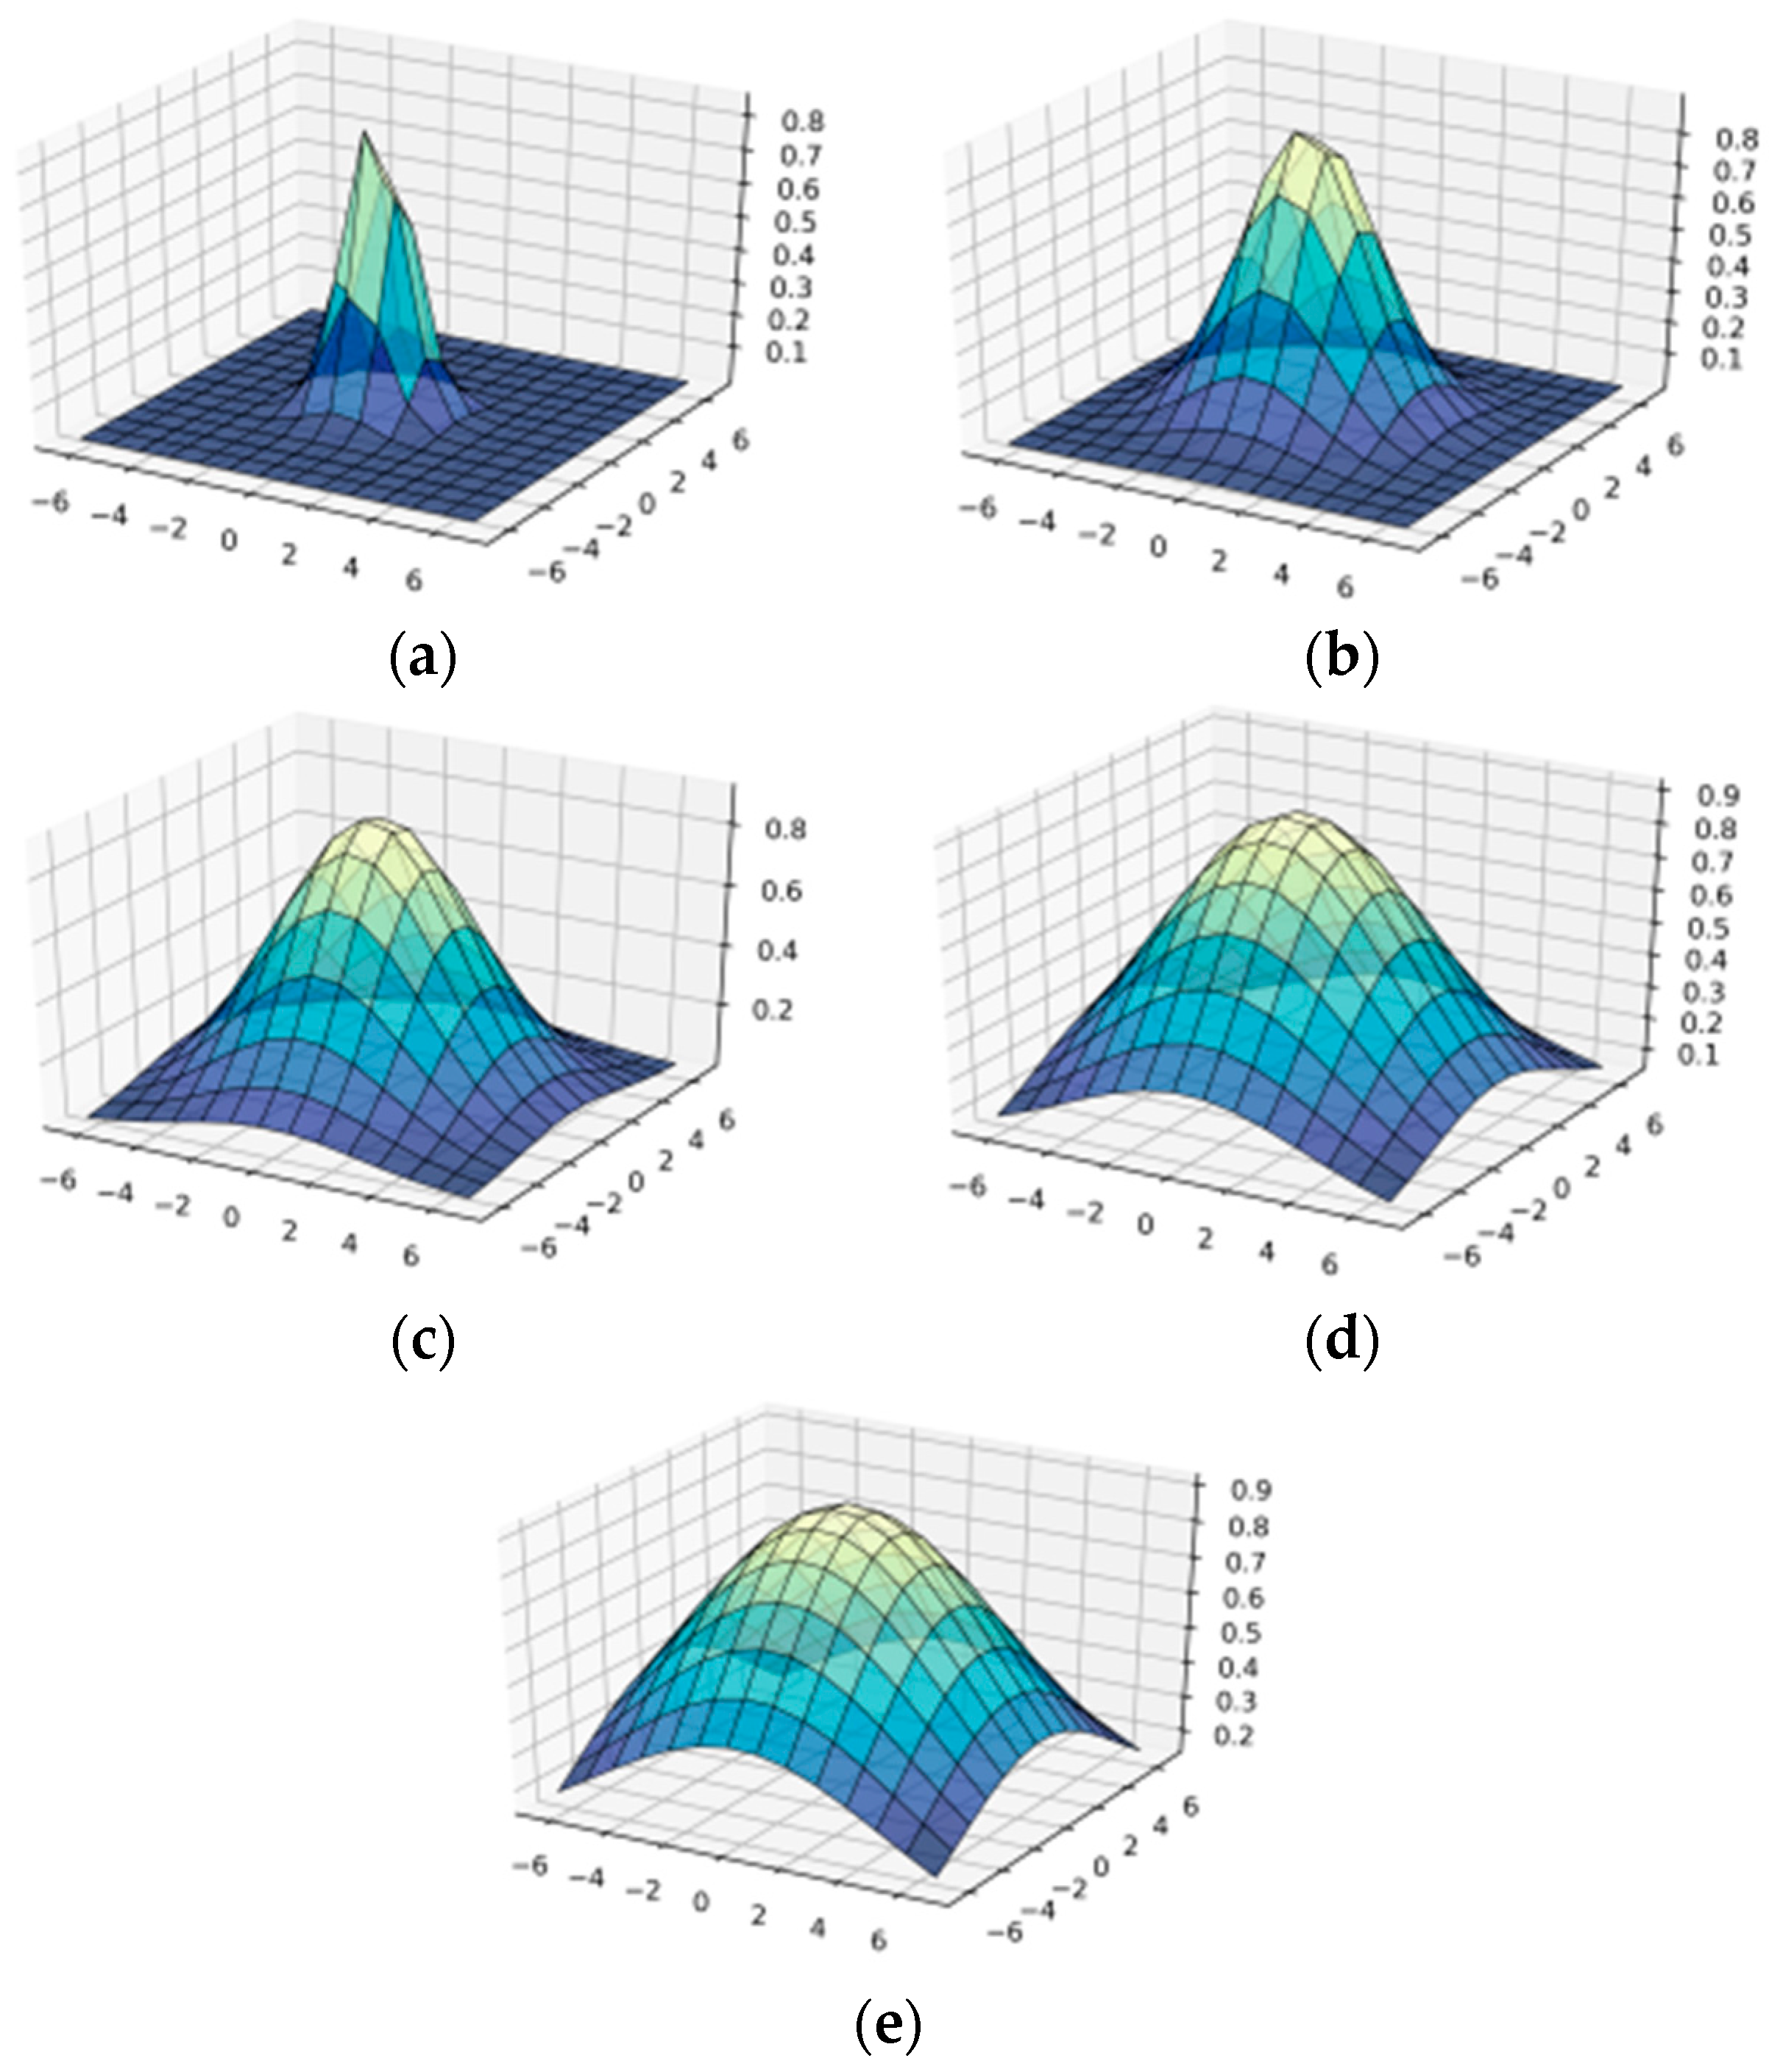
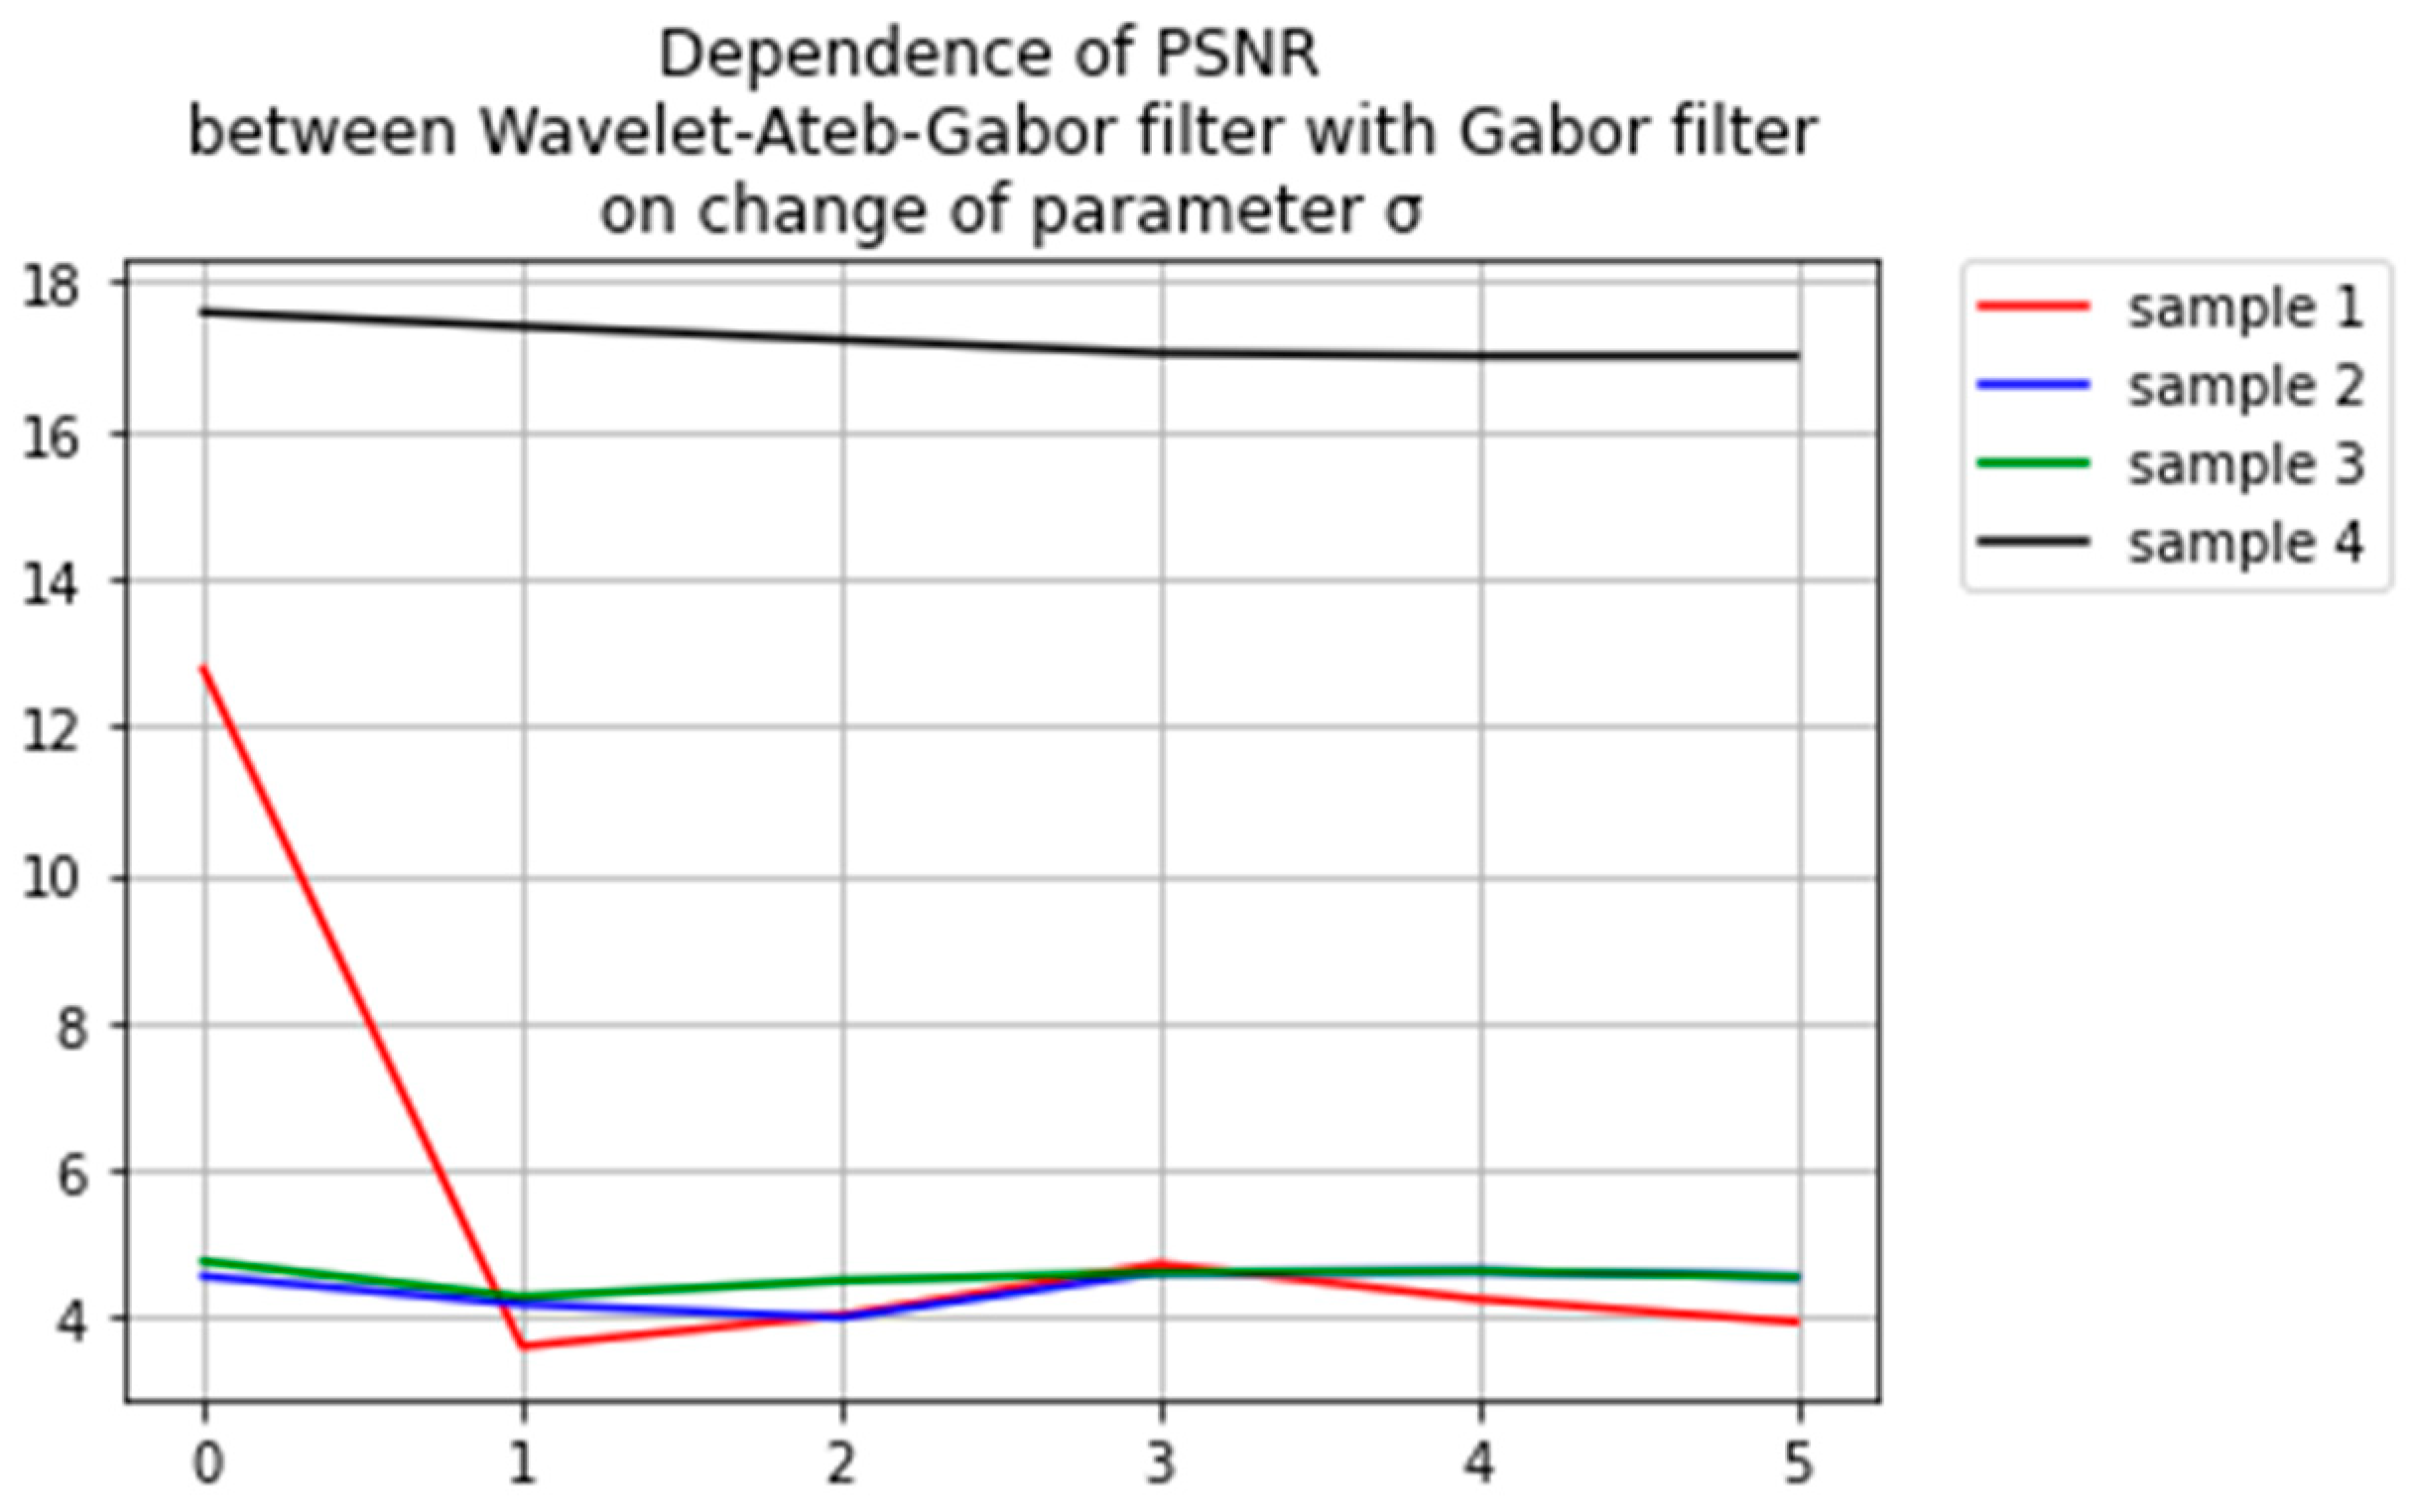
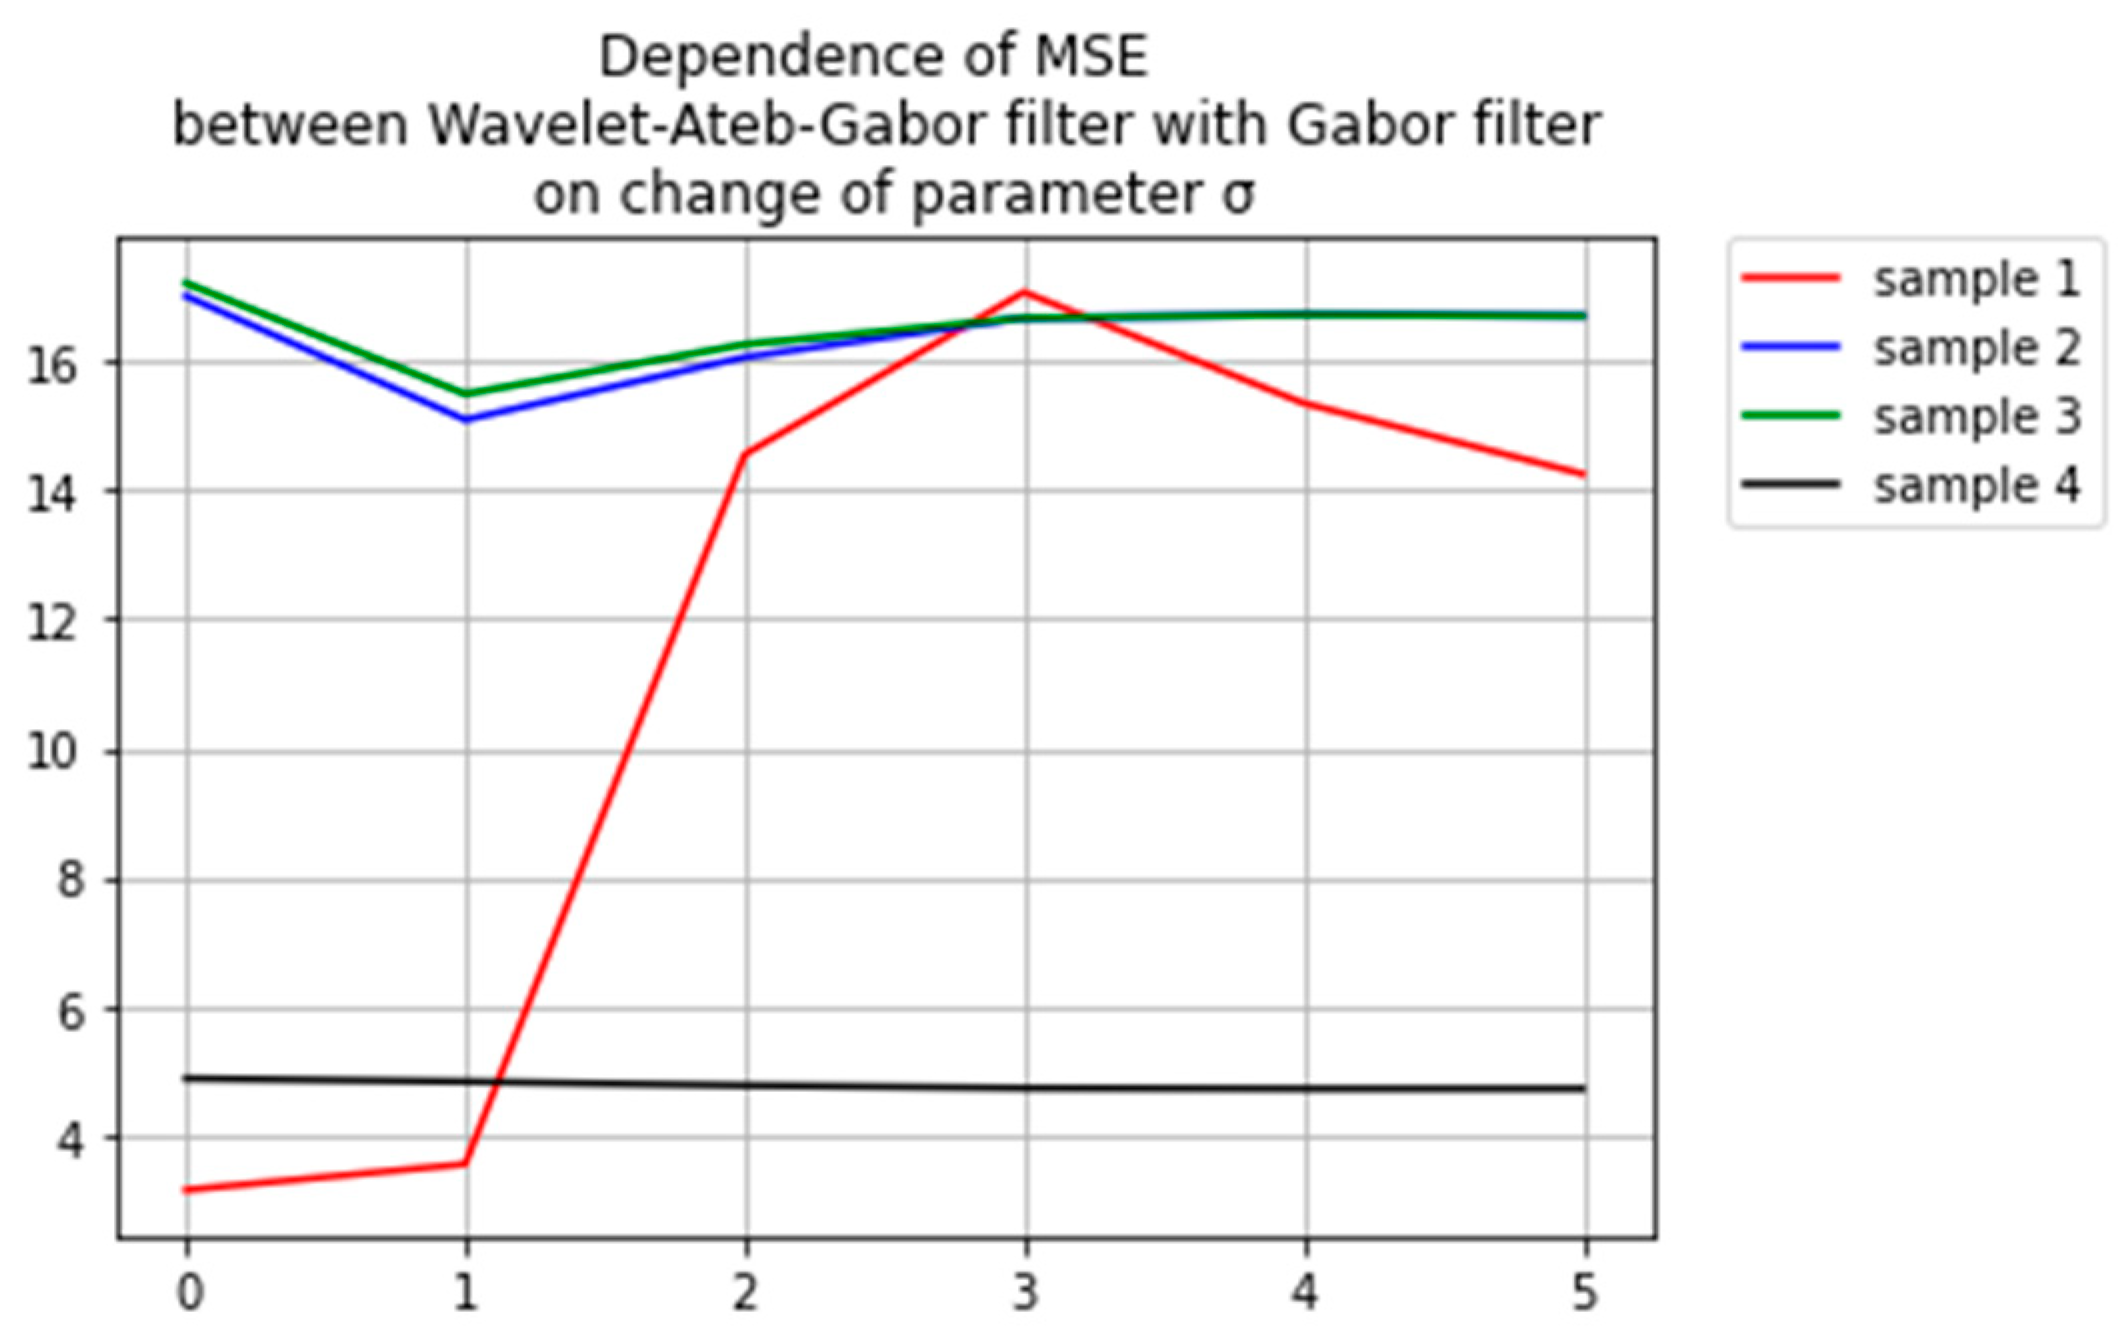
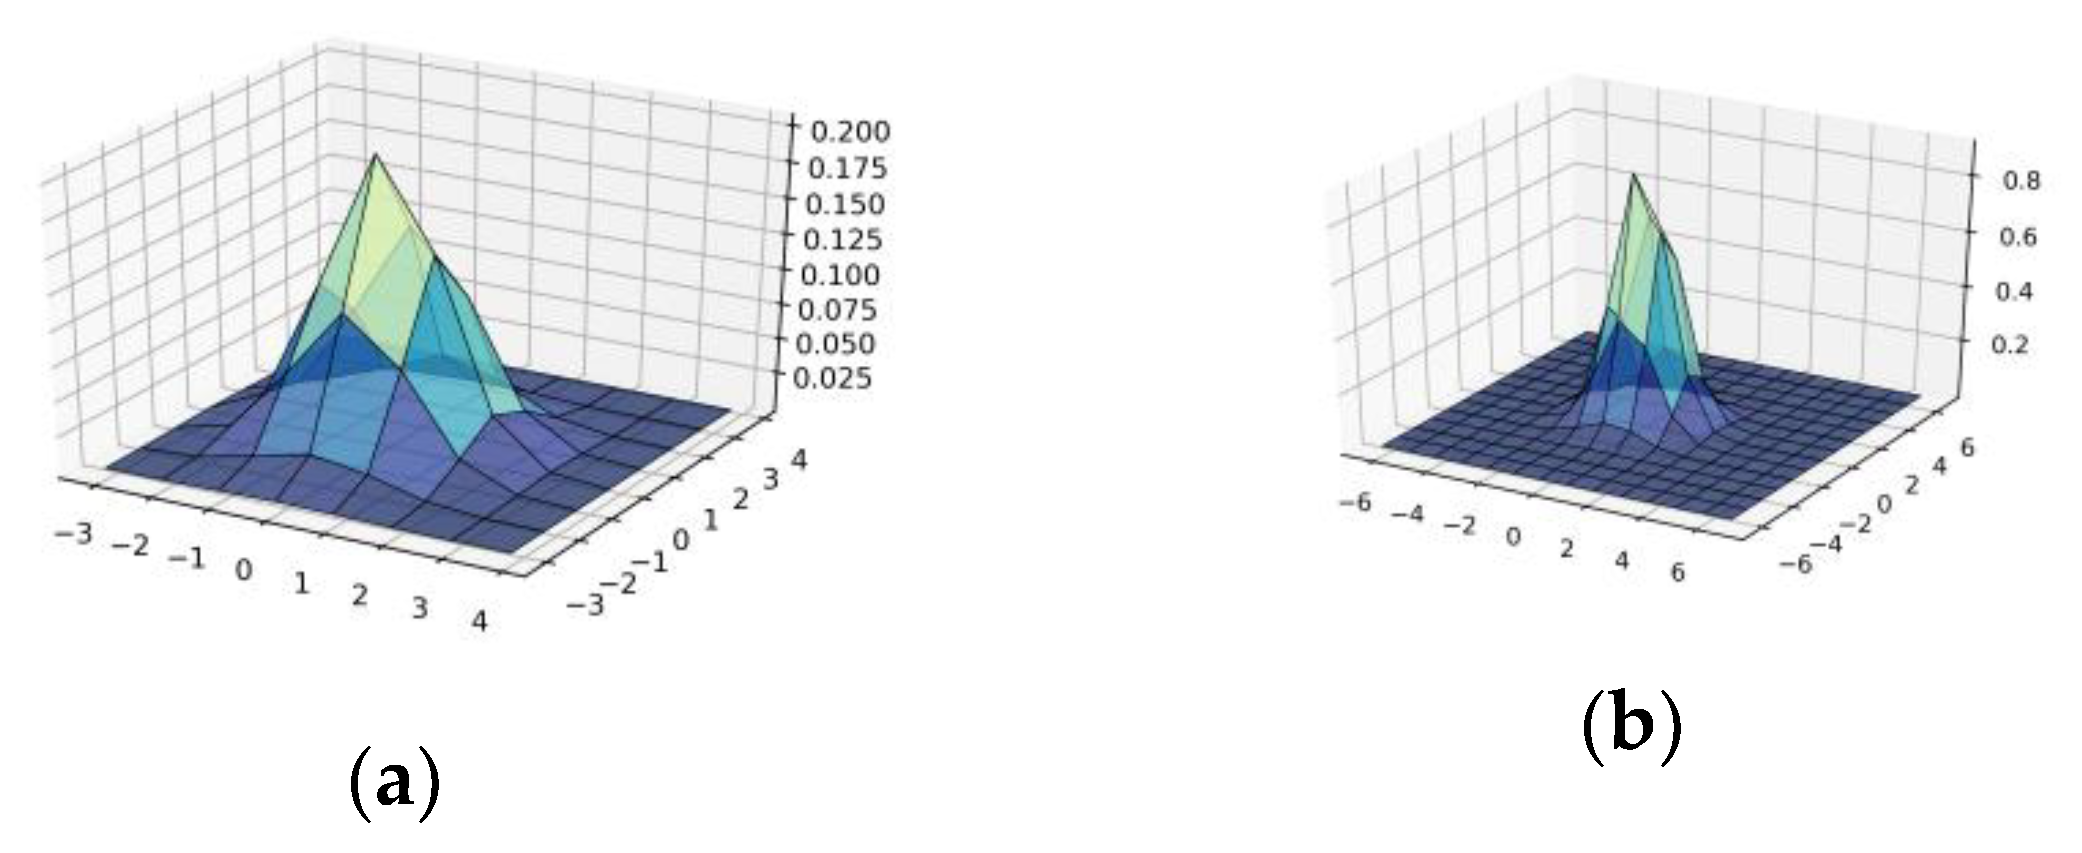
3.6. Simulation of Wavelet-Ateb–Gabor Function with Parameters n = m = 3, 1 < σ < 4

Experiments of the wavelet-Ateb–Gabor function ATEBG(a, b, m, n, θ, σ, t) were performed separately with equal parameters m and n. To do this, the period presented in Table 3 was calculated.
From Figure 6 we can see that for large and equal values of the parameter n = m = 3 the surface of the wavelet-Ateb–Gabor function ATEBG(a, b, m, n, θ, σ, t) changes with spiked peaks with increasing deviation of the Gaussian nucleus, σ = 1; 2; 3; 4. As can be seen from Figure 6, the greater σ, the more peaks are observed. Investigation of the wavelet-Ateb–Gabor function ATEBG(a, b, m, n, θ, σ, t) with parameters m = n = 3, and σ = 5; 6; 7; 8; 9; 10 are given in Appendix A Figure A5.
From the following figures it follows that changing the filter parameters allows us to select different filtering options that differ in shape and numerical values. As can be seen from the above dependencies, the introduction of the Ateb–Gabor filter makes it possible to obtain more control on the effect of filtering comparing to the traditional Gabor filter. Thus, the Gabor filter depends on the parameters ζ , υ , ζ 0 , υ 0 , θ , σ , β . The value of the Gabor filter depends on the coordinates of the filter center x = x 0 , y = y 0 and points ξ = ξ 0 ,   υ = υ 0 of the raster frequency plane, also, it depends on σ and β—scale parameters of elliptical Gaussians along the x and y axes, θ-filter orientation angle, σ —filter phase. Hence the Gabor function has six modes of freedom: ζ 0 , υ 0 , θ , ρ , σ , β .
The introduction of the Ateb–Gabor filter depends on the ATEBG parameters (a, b, m, n, θ, σ, t), where in addition to the basic parameters, rational parameters m and n are added, which significantly affect the shape of the function and result of filtering.

4. Modeling, Results

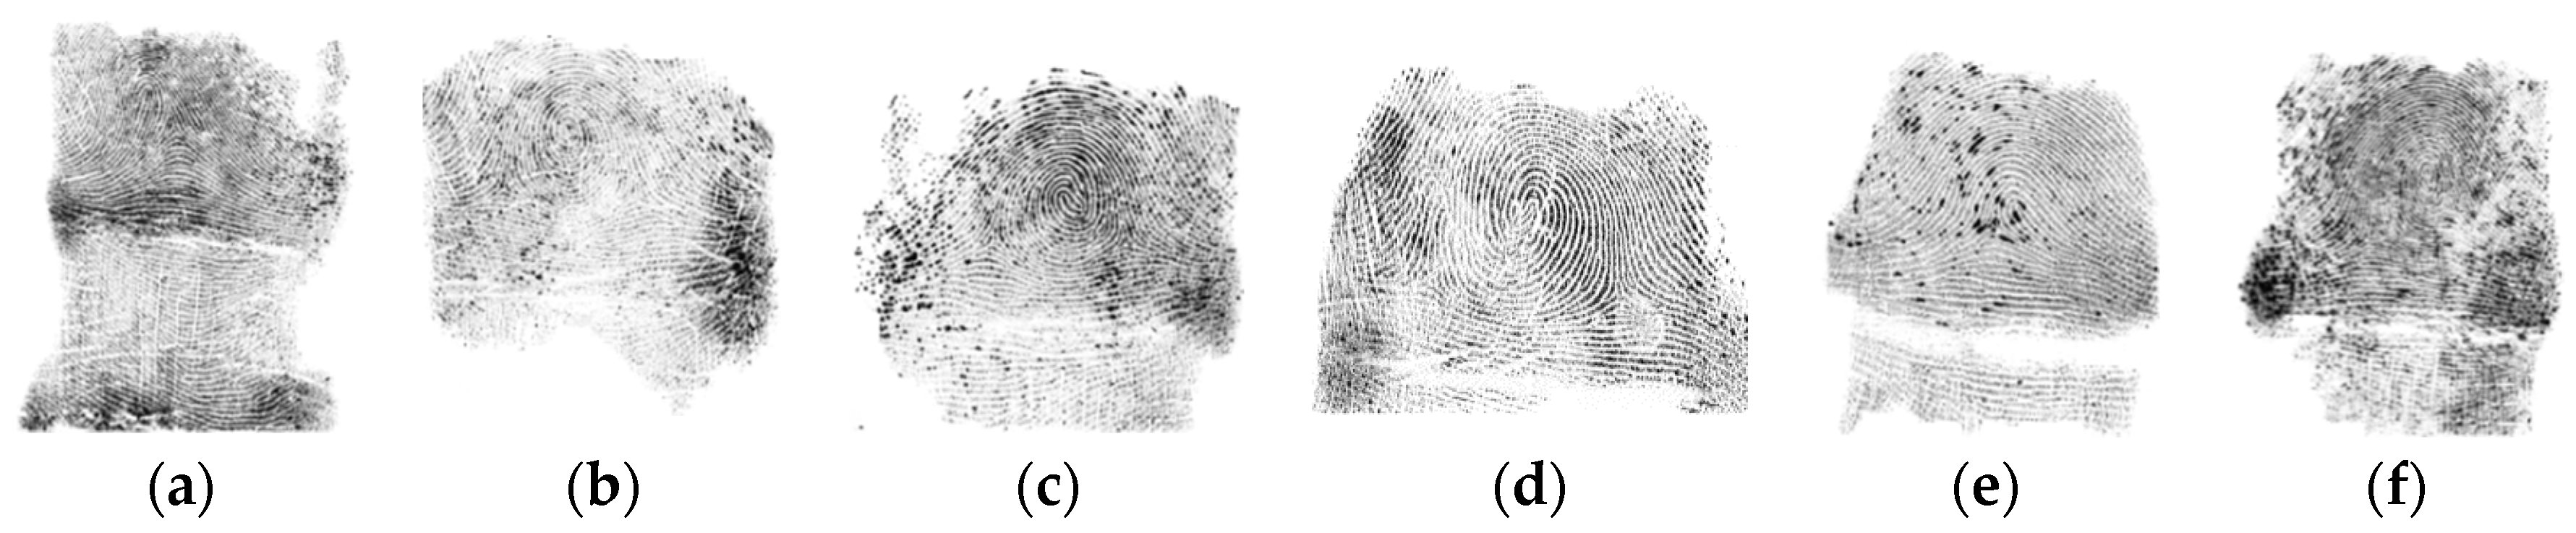
4.1. Dataset for Filtering

The transformation and determination of the efficiency of the proposed filtering method based on wavelet-Ateb–Gabor fingerprint filtering was performed on the basis of the freely available database NIST Special Database 302. The examples of images are displayed in Figure 7.

4.2. Wavelet-Ateb–Gabor Fingerprint Image Filtering

Wavelet-Gabor transformation is used in the filtering of biometric images, because this feature allows you to improve the contours of the ridges of biometrics. The developed method of the wavelet-Ateb–Gabor filter allows to select parameters as it contains more variables and to carry out a qualitative filtering in one pass. In further research, it is necessary to develop a technique of selection of parameters of the Ateb–Gabor filter. The developed method works a little longer than the usual wavelet-Gabor filter, because the mathematical calculations are more complex and the complexity of the calculation algorithm is higher. However, we can choose such rational parameters that will allow high-quality filtering and identification in one pass. The relationship between the frequency and the width of the wavelet-Ateb–Gabor filter was determined, which allowed to automatically execute filtering to find the edges of objects with different frequencies, sizes and directions.
In conclusion, a method for replacing the average filtering frequencies of Ateb–Gabor with close-to-zero values has been developed. The results of numerous experiments demonstrate satisfying edges of the biometric images, obtained after applying the chosen parameters of Ateb–Gabor filter. The results of the experiments are presented in Table 4.
Pre-image processing and wavelet-Ateb–Gabor filtering were performed. A comparison was made based on the signal-to-noise ratio of the wavelet-Ateb–Gabor-filtered image and the input image. The following results were obtained.

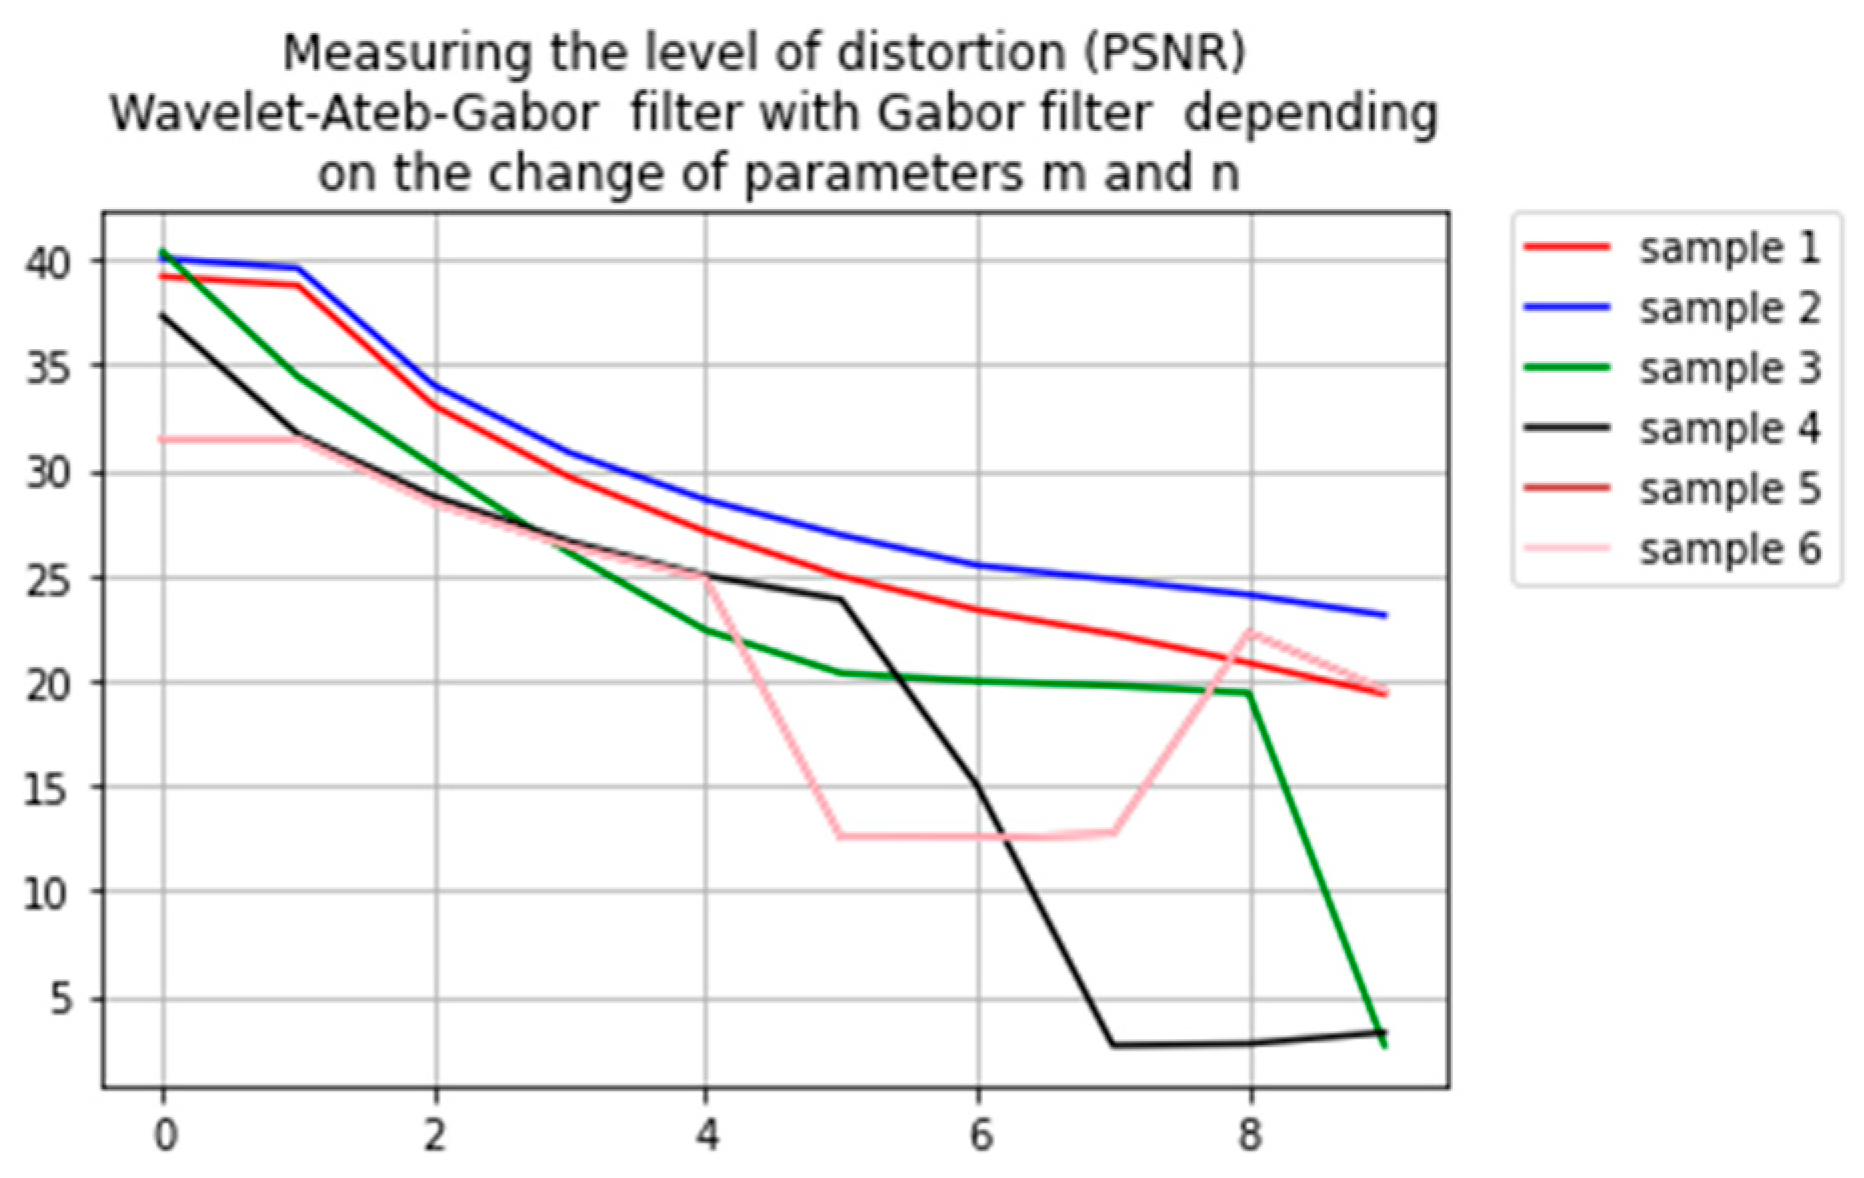
4.3. Comparison of the Efficiency of the Wavelet-Ateb–Gabor Filter with the Existing Ones

The original Gabor filter is defined by ten frequency characteristics. The wavelet-Ateb–Gabor transformation developed and described in this article can significantly increase the number of frequency characteristics. It is possible to further increase the number to 900. Therefore, 900 filtration samples could be conducted. When selecting parameters of Ateb functions that are not, their maximum number is 2900. Therefore, a new filtering method is proposed. It can be considered as universal filtering method, as such method can be applied to any biometric image. Filtration can be performed once and efficiently by selecting the correct wavelet-Ateb–Gabor parameters. Thus, the usage of the proposed method with selected parameters for filtering allows the achievement of a single effective universal filtering of biometric images.
Six samples, displayed in the Figure 7, were selected for the experiment. All of them were subjected to Gabor filtration and proposed wavelet-Ateb–Gabor filter. The outcomes of the comparison are displayed in the Table 4.
Comparison of images with different parameters m, n = 1, σ = pi and Gabor filter are presented as correlation measures of coincidence of these images according to PSNR [31] and MSE [32] filtered by Gabor filter and wavelet-Ateb–Gabor.
According to the results of the experiments, the smaller is the parameter m, the bigger is the discrepancy is between the image filtered by the Gabor filter. Such This dependence can be noticed in Figure 8 as well. It shows the dependence of the change in the distortion of the wavelet-Ateb–Gabor filter with the Gabor filter according to PSNR depending on the change of the parameters m and n. The comparison according to the MSE depending on the change of the parameter σ is shown in Figure 9.
Comparison of the images filtered by wavelet-Ateb–Gabor filter using various parameters of σ and Gabor filter is displayed as correlation measures of coincidence of these images according to PSNR and MSE in the Table 5. The comparison according to the PSNR between the wavelet-Ateb–Gabor filter with the Gabor filter depending on the change of the parameter σ is shown in Figure 10. The comparison according to the MSE depending on the change of the parameter σ is shown in Figure 11.
Indirect sections in Figure 8, Figure 9, Figure 10 and Figure 11 indicate that a broader filtering method has been found. And that method is different from the Gabor filter.
Ateb–Gabor wavelet filtering shows good results and significantly expands the Gabor filtering method. The characteristics of the wavelet Ateb Gabor filtration are investigated, which is shown in numerous graphs. Filtered by a new wavelet filter Ateb Gabor filtration. Filtration results are compared with Gabor filtration based on PSNR and MSE estimates, which show good recognition results. The time characteristics of the filtering are estimated.

5. Conclusions

Ateb–Gabor filtering allows changing of the intensity of the whole image, as well as the intensity in certain ranges, and thus make certain areas of the image more contrasting. Ateb-functions vary from two rational parameters, which, in turn, allow more flexible control of filtering. The properties of the Ateb function, as well as the possibility of changing the amplitude of the function, the oscillation frequency on the Ateb–Gabor filter are investigated. The development of filtration based on two-dimensional Ateb–Gabor is shown. These dependencies are analyzed and appropriate experiments performed. The relationship between the frequency and the width of the Ateb–Gabor filter are determined, which will allow filters to be found to find the edges of objects with different frequencies and sizes. Appropriate filtering software are developed. Fingerprints are filtered using the developed Ateb–Gabor filter. The efficiency of its use is proved, which consists of a larger number of options for filtering the processed images. The results of numerous experiments demonstrate the successful selection of edges in the image based on the obtained parameters of the Ateb–Gabor filter.
In the future, a method for selecting rational parameters for wavelet-Ateb–Gabor filtering will be developed on the basis of the wavelet Ateb–Gabor functions developed in this study. A method of constructing a field of directions of papillary lines will also be developed, and according to this field of directions, the developed filtering will be carried out.

Author Contributions

Conceptualization, M.N.; methodology, Y.V.; software, Y.V.; validation, N.K., M.N. and Y.V.; formal analysis, M.N.; investigation, Y.V.; resources, N.K.; data curation, Y.V.; writing—original draft preparation, N.K.; writing—review and editing, N.K.; visualization, Y.V.; supervision, Y.V.; project administration, Y.V.; funding acquisition, Y.V. All authors have read and agreed to the published version of the manuscript.

Funding

This research did not receive any specific grant from funding agencies in the public, commercial, or not-for-profit sectors.

Institutional Review Board Statement

Not applicable.

Informed Consent Statement

Not applicable.

Data Availability Statement

Not applicable.

Conflicts of Interest

The authors declare no conflict of interest.

Appendix A

Figure A1. Construction of Wavelet-Gabor filter ψ ( ζ , υ , ζ 0 , υ 0 , θ , σ , β ) in OX— ζ , in OY—υ: (a) σ = 6; (b) σ = 7; (c) σ = 8; (d) σ = 9; (e) σ = 10.
Symmetry 13 00717 g0a1
Figure A2. Construction of wavelet-Ateb–Gabor filter ψ ( ζ , υ , ζ 0 , υ 0 , θ , σ , β ) with parameters m = 1, n = 1 in OX— a , in OY—b: (a) σ = 6; (b) σ = 7; (c) σ = 8; (d) σ = 9; (e) σ = 10.
Symmetry 13 00717 g0a2aSymmetry 13 00717 g0a2b
Figure A3. Construction of wavelet-Ateb–Gabor filter ψ ( ζ , υ , ζ 0 , υ 0 , θ , σ , β ) with parameters m = 1, σ = 1; in OX— a , in OY—b: (a) n = 0.5; (b) n = 1 .
Symmetry 13 00717 g0a3
Figure A4. Construction of Wavelet-Ateb–Gabor filter ψ ( ζ , υ , ζ 0 , υ 0 , θ , σ , β ) with parameters n = 1, σ = 1; in OX— a , in OY—b: (a) m = 5; (b) m = 6 .
Symmetry 13 00717 g0a4
Figure A5. Construction of wavelet-Ateb–Gabor filter ψ ( ζ , υ , ζ 0 , υ 0 , θ , σ , β ) with parameters n = 3, m = 3; in OX— a , in OY—b: (a) σ = 4; (b) σ = 5; (c) σ = 6; (d) = 7; (e) = 8; (f) = 9; (g) σ = 10.
Symmetry 13 00717 g0a5aSymmetry 13 00717 g0a5b

References

  1. Savchenko, V.V.; Savchenko, A.V. Method for Measuring Distortions in Speech Signals during Transmission over a Communication Channel to a Biometric Identification System. Meas. Tech. 2021, 63, 917–925. [Google Scholar] [CrossRef]
  2. Al Solami, E.; Kamran, M.; Alkatheiri, M.S.; Rafiq, F.; Alghamdi, A.S. Fingerprinting of Relational Databases for Stopping the Data Theft. Electronics 2020, 9, 1093. [Google Scholar] [CrossRef]
  3. Hrytsyk, V.; Grondzal, A.; Bilenkyj, A. Augmented reality for people with disabilities. In Proceedings of the 2015 Xth International Scientific and Technical Conference Computer Sciences and Information Technologies (CSIT), Lviv, Ukraine, 14–17 September 2015; pp. 188–191. [Google Scholar]
  4. Valechha, L.; Valecha, H.; Ahuja, V.; Chawla, T.; Sengupta, S. Orisyncrasy—An Ear Biometrics on the Fly Using Gabor Filter. In Advances in Data Sciences, Security and Applications; Springer: Singapore, 2020; pp. 457–466. [Google Scholar]
  5. Le, N.T.; Wang, J.-W.; Le, D.H.; Wang, C.-C.; Nguyen, T.N. Fingerprint Enhancement Based on Tensor of Wavelet Subbands for Classification. IEEE Access 2020, 8, 6602–6615. [Google Scholar] [CrossRef]
  6. Chanukya, P.S.V.V.N.; Thivakaran, T.K. Multimodal biometric cryptosystem for human authentication using fingerprint and ear. Multimed. Tools Appl. 2019, 79, 659–673. [Google Scholar] [CrossRef]
  7. Wagh, D.P.; Fadewar, H.S.; Shinde, G.N. Biometric Finger Vein Recognition Methods for Authentication. In Computing in Engineering and Technology; Springer: Singapore, 2020; pp. 45–53. [Google Scholar]
  8. Lee, C.-J.; Wang, S.-D. Fingerprint feature extraction using Gabor filters. Electron. Lett. 1999, 35, 288. [Google Scholar] [CrossRef] [Green Version]
  9. Yang, J.; Liu, L.; Jiang, T.; Fan, Y. A modified Gabor filter design method for fingerprint image enhancement. Pattern Recognit. Lett. 2003, 24, 1805–1817. [Google Scholar] [CrossRef]
  10. Wang, W.; Li, J.; Huang, F.; Feng, H. Design and implementation of Log-Gabor filter in fingerprint image enhancement. Pattern Recognit. Lett. 2008, 29, 301–308. [Google Scholar] [CrossRef]
  11. Areekul, V.; Watchareeruetai, U.; Suppasriwasuseth, K.; Tantaratana, S. Separable Gabor filter realization for fast fingerprint enhancement. In Proceedings of the IEEE International Conference on Image Processing 2005, Genoa, Italy, 11–14 September 2005; IEEE: Piscataway, NJ, USA, 2005; Volume 3, p. III-253. [Google Scholar]
  12. Usmonov, B.; Evsutin, O.; Iskhakov, A.; Shelupanov, A.; Iskhakova, A.; Meshcheryakov, R. The cybersecurity in the development of IoT embedded technologies. In Proceedings of the International Conference on Information Science and Communications Technologies (ICISCT) 2017, Tashkent, Uzbekistan, 2–4 November 2017; pp. 1–4. [Google Scholar]
  13. Lytvynenko, V.; Bidyuk, P.; Myrgorod, V. Application of the method and combined algorithm on the basis of immune network and negative selection for identification of turbine engine surging. In Proceedings of the 2nd International Conference on Inductive Modelling, Kyiv, Ukraine, 15–19 September 2008; pp. 116–123. [Google Scholar]
  14. Hryshchuk, R.; Molodetska, K. Synergetic control of social networking services actors’interactions. In Proceedings of the International Conference on Systems, Control and Information Technologies 2016, Warsaw, Poland, 20–21 May 2016; pp. 34–42. [Google Scholar]
  15. Bogachuk, I.; Sokolov, V.; Buriachok, V. Monitoring Subsystem for Wireless Systems Based on Miniature Spectrum Analyzers. In Proceedings of the 2018 International Scientific-Practical Conference Problems of Infocommunications. Science and Technology (PIC S&T), Kharkiv, Ukraine, 9–12 October 2018; Institute of Electrical and Electronics Engineers (IEEE): Piscataway, NJ, USA, 2018; pp. 581–585. [Google Scholar]
  16. Korchenko, O.; Vasiliu, Y.; Gnatyuk, S. Modern quantum technologies of information security against cyber-terrorist attacks. Aviation 2010, 14, 58–69. [Google Scholar] [CrossRef] [Green Version]
  17. Vacca, J.R. Computer and Information Security Handbook; Elsevier: Amsterdam, The Netherlands, 2012. [Google Scholar]
  18. Nixon, M.; Aguado, A. Feature Extraction and Image Processing for Computer Vision; Academic Press: Cambridge, MA, USA, 2019. [Google Scholar]
  19. Nanavati, S.; Steinhardt, B. Face-off: Is the use of biometrics an invasion of privacy. Netw. World 2000, 17, 143. [Google Scholar]
  20. Bihl, T.J.; Paciencia, T.J.; Bauer, K.W.; Temple, M.A. Cyber-Physical Security with RF Fingerprint Classification through Distance Measure Extensions of Generalized Relevance Learning Vector Quantization. Secur. Commun. Netw. 2020, 2020, 1–12. [Google Scholar] [CrossRef]
  21. Okokpujie, K.; Etinosa, N.O.; John, S.; Joy, E. Comparative analysis of fingerprint preprocessing algorithms for electronic voting processes. In IT Convergence and Security 2017; Springer: Singapore, 2017; pp. 212–219. [Google Scholar]
  22. Lv, X.; Ding, L.; Zhang, G. Research on fingerprint feature recognition of access control based on deep learning. Int. J. Biomed. 2021, 13, 80–95. [Google Scholar]
  23. Nazarkevych, M.; Logoyda, M.; Troyan, O.; Vozniy, Y.; Shpak, Z. The Ateb-Gabor Filter for Fingerprinting. In Proceedings of the Conference on Computer Science and Information Technologies 2019, Lviv, Ukraine, 17–20 September 2019; pp. 247–255. [Google Scholar]
  24. Barina, D. Gabor wavelets in image processing. arXiv 2016, arXiv:1602.03308. [Google Scholar]
  25. Rosenberg, R.M. The Ateb (h)-functions and their properties. Q. Appl. Math. 1963, 21, 37–47. [Google Scholar] [CrossRef] [Green Version]
  26. Senyk, P.M. About Ateb-functions. Rep. AS URSR Ser. A 1963, 1, 23–27. [Google Scholar]
  27. Vozny, A.M. Application of Ateb-functions for construction of solution of one class of essentially nonlinear differential equations. Rep. USSR Acad. Sci. Ser. A 1970, 9, 971–974. [Google Scholar]
  28. Senyk, P.M. Inversion of the incomplete beta function. Ukr. Math. J. 1969, 21, 271–278. [Google Scholar] [CrossRef]
  29. Mouley, J.; Panja, M.M.; Mandal, B.N. Numerical solution of an integral equation arising in the problem of cruciform crack using Daubechies scale function. Math. Sci. 2019, 14, 21–27. [Google Scholar] [CrossRef] [Green Version]
  30. Shensa, M.J. The discrete wavelet transform: wedding the a trous and Mallat algorithms. IEEE Trans. Signal Process. 1992, 40, 2464–2482. [Google Scholar] [CrossRef] [Green Version]
  31. Hore, A.; Ziou, D. Image quality metrics: PSNR vs. SSIM. In Proceedings of the 20th International Conference on Pattern Recognition, Istanbul, Turkey, 23–26 August 2010; pp. 2366–2369. [Google Scholar]
  32. Wang, J.; Chen, P.; Zheng, N.; Chen, B.; Principe, J.C.; Wang, F.-Y. Associations between MSE and SSIM as cost functions in linear decomposition with application to bit allocation for sparse coding. Neurocomputing 2021, 422, 139–149. [Google Scholar] [CrossRef]
Figure 1. Construction of wavelet-Gabor filter ψ ( ζ , υ , ζ 0 , υ 0 , θ , σ , β ) in OX— ζ , in OY—υ: (a) σ = 1; (b) σ = 2; (c) σ = 3; (d) σ = 4; (e) σ = 5.
Symmetry 13 00717 g001
Figure 2. Basic steps of wavelet-Ateb–Gabor filtering.
Symmetry 13 00717 g002
Figure 3. Construction of wavelet-Ateb–Gabor filter A T E B G ( a , b , m , n , θ , σ , t ) in OX— a , in OY—b: (a) σ = 1; (b) σ = 2; (c) σ = 3; (d) σ = 4; (e) σ = 5.
Symmetry 13 00717 g003
Figure 4. Construction of wavelet-Ateb–Gabor filter ψ ( ζ , υ , ζ 0 , υ 0 , θ , σ , β ) with parameters m = 1, σ = 1; in OX— a , in OY—b: (a) n = 0.1; (b) n = 0.2 ; (c) n = 0.3 ; (d) n = 0.4 .
Symmetry 13 00717 g004
Figure 5. Construction of wavelet-Ateb–Gabor filter ψ ( ζ , υ , ζ 0 , υ 0 , θ , σ , β ) with parameters n = 1; σ = 1; in OX— a , in OY—b: (a) m = 1; (b) m = 2 ; (c) m = 3 ; (d) m = 4 .
Symmetry 13 00717 g005aSymmetry 13 00717 g005b
Figure 6. Construction of wavelet-Ateb–Gabor filter ψ ( ζ , υ , ζ 0 , υ 0 , θ , σ , β ) with parameters n = 3, m = 3; in OX— a , in OY—b: (a) σ = 1; (b) σ = 2; (c) σ = 3; (d) σ = 4.
Symmetry 13 00717 g006
Figure 7. The examples of images (a) Sample1; (b) Sample 2; (c) Sample 3; (d) Sample 4; (e) Sample 5; (f) Sample 6.
Symmetry 13 00717 g007
Figure 8. Dependence of the change of distortion level of wavelet-Ateb–Gabor filter with Gabor filter according to PSNR depending on the change of the parameters m and n.
Symmetry 13 00717 g008
Figure 9. Dependence of the change of distortion level of wavelet-Ateb–Gabor filter with Gabor filter according to MSE depending on the change of the parameters m and n.
Symmetry 13 00717 g009
Figure 10. Dependence of PSNR between wavelet-Ateb–Gabor filter with Gabor filter on change of parameter σ.
Symmetry 13 00717 g010
Figure 11. Dependence of MSE between wavelet-Ateb–Gabor filter with Gabor filter on change of parameter σ.
Symmetry 13 00717 g011
Table 1. The period of the wavelet function Ateb–Gabor, which is calculated by (6) when n is changing from 0.1 to 1, and m = 1.
m n The Period of the Wavelet Function Ateb–Gabor
10.12.12142061299
10.22.24050260067
10.32.35762298776
10.42.47307918393
10.52.58710955923
10.62.6999077953
10.72.81163314784
10.82.92241794389
10.93.03237316197
113.14159265359
Table 2. The period of the wavelet function Ateb–Gabor when m is changing from 1 to 10, and n = 1.
m n The Period of the Wavelet Function Ateb–Gabor
113.14159265359
214.20654631598
315.24411510858
416.26865312409
517.28595194366
618.29880821421
719.30874056975
8110.3166455868
9111.3230869752
10112.3284370431
Table 3. The period of the wavelet function Ateb–Gabor with equal parameters m = n.
m n The Period of the Wavelet Function Ateb–Gabor
337.41629870921
Table 4. Comparison of filtered images by Gabor and wavelet-Ateb–Gabor filter PSNR and MSE.
Ateb Filtering, mComparison, mFiltration TimeSample 1Sample 2Sample 3Sample 4Sample 5Sample 6
PSNRMSEPSNRMSEPSNRMSEPSNRMSEPSNRMSEPSNRMSE
111 min 54 s39.2010.540.0512.0337.3310.3440.3811.1831.498.7237.9310.50
0.9 11 min 55 s38.771039.5910.9631.718.7834.439.5331.498.7231.868.82
0.811 min 54 s33.069.1534.039.4228.757.9630.188.3628.437.8728.437.87
0.711 min 54 s29.668.2130.828.5326.607.3626.067.2126.377.8725.377.02
0.612 min 3 s27.087.4928.597.9124.986.9222.396.2024.866.8823.026.37
0.511 min 57 s24.956.9126.917.4523.846.6020.345.6312.513.4621.235.88
0.412 min 1 s23.356.4625.477.0515.07.7519.965.5212.523.4719.705.45
0.3 11 min 53 s22.206.1424.796.862.659.5819.755.4712.703.5219.095.28
0.211 min 55 s20.835.7724.076.662.739.8619.415.3722.286.1718.515.13
0.112 min 11 s19.355.3523.106.393.2711.832.659.5819.545.412.659.58
Table 5. Comparison of filtered images by Gabor and wavelet-Ateb–Gabor PSNR and MSE.
Ateb Filtering m = 1, n = 1, σComparison m = 1, n = 1, σFiltration TimeSample 1Sample 2Sample 3Sample 4
PSNRMSEPSNRMSEPSNRMSEPSNRMSE
π/4π2 min 18 s12.773.144.5617.014.7617.2117.594.87
π/3π2 min 3 s3.613.544.1815.094.2815.4917.404.82
π/2π2 min 15 s4.0314.554.0016.064.5016.2617.224.76
2 × ππ2 min 15 s4.72417.074.6116.674.6116.6717.044.72
3 × ππ1 min 58 s4.2515.354.6316.724.6316.7217.004.71
4 × ππ2 min 3 s3.9414.254.5516.704.5516.7017.004.71
Publisher’s Note: MDPI stays neutral with regard to jurisdictional claims in published maps and institutional affiliations.

