Article

An Enhanced Spectral Clustering Algorithm with S-Distance

by
Krishna Kumar Sharma
1,2,
Ayan Seal
1,3,*,
Enrique Herrera-Viedma
4,5 and
Ondrej Krejcar
3,6
1
Department of Computer Science & Engineering, PDPM Indian Institute of Information Technology, Design and Manufacturing, Jabalpur 482005, India
2
Department of Computer Science & Informatics, University of Kota, Kota, Rajasthan 324022, India
3
Center for Basic and Applied Science, Faculty of Informatics and Management, University of Hradec Králové, Hradec 50003 Králové, Czech Republic
4
Andalusian Research Institute in Data Science and Computational Intelligence (DaSCI), University of Granada, 18071 Granada, Spain
5
Faculty of Engineering, King Abdulaziz University, Jeddah 21589, Saudi Arabia
6
Malaysia-Japan International Institute of Technology (MJIIT), Universiti Teknologi Malaysia, Kuala Lumpur 54100, Malaysia
*
Author to whom correspondence should be addressed.
Symmetry 2021, 13(4), 596; https://doi.org/10.3390/sym13040596
Submission received: 4 March 2021 / Revised: 19 March 2021 / Accepted: 25 March 2021 / Published: 2 April 2021
(This article belongs to the Special Issue Computational Intelligence and Soft Computing: Recent Applications)

Abstract

:
Calculating and monitoring customer churn metrics is important for companies to retain customers and earn more profit in business. In this study, a churn prediction framework is developed by modified spectral clustering (SC). However, the similarity measure plays an imperative role in clustering for predicting churn with better accuracy by analyzing industrial data. The linear Euclidean distance in the traditional SC is replaced by the non-linear S-distance ( S d ). The S d is deduced from the concept of S-divergence (SD). Several characteristics of S d are discussed in this work. Assays are conducted to endorse the proposed clustering algorithm on four synthetics, eight UCI, two industrial databases and one telecommunications database related to customer churn. Three existing clustering algorithms—k-means, density-based spatial clustering of applications with noise and conventional SC—are also implemented on the above-mentioned 15 databases. The empirical outcomes show that the proposed clustering algorithm beats three existing clustering algorithms in terms of its Jaccard index, f-score, recall, precision and accuracy. Finally, we also test the significance of the clustering results by the Wilcoxon’s signed-rank test, Wilcoxon’s rank-sum test, and sign tests. The relative study shows that the outcomes of the proposed algorithm are interesting, especially in the case of clusters of arbitrary shape.

1. Introduction

Advancements in information technology have given rise to digital innovation in the service industry; e.g., the e-commerce industry, banking, telecom, airline industry, etc. [1]. Customers now have easy access to enormous amounts of data for their desired service or consumables. This in turn has generated a scenario in which companies are finding it a very difficult task to retain their existing customer base. Companies have thus become more cautious to increase customer acquisition and to control customer churn. Consumers switching from one firm to another for a specified period negatively impacts the economy of the company. Thus, customer acquisition and churn management have become key factors for the service sector. Several methods exist to effectively increase customer acquisition and to manage customer churn, such as improving customer acquisition by nurturing effective relationship with customers, identifying the customers who are likely to leave and giving proactive solutions to the causes of their dissatisfaction, improving sales approaches and improving marketing strategies and customer services. Technology is also responsible for the reframing of marketing to increase customer loyalty through the examination of stored information and customer metrics. It also allows customer relations to be connected with business demand [2]. However, the problem of identifying the best set of clients who can subscribe to a product or service is considered NP-hard [3].
It is important to utilize and allocate resources effectively and efficiently by distinguishing high-value customers. It is also imperative for industrial enterprises to customize marketing strategies in such a way that they can achieve an edge over their competitors. There is a need to use an unsupervised machine learning clustering algorithm in order to group customers according to some similarity or common trend, especially when the customer database is growing constantly, when the average transaction size increases or when the frequency of transactions per customer increases. In other words, a clustering algorithm helps to analyze the different needs of different groups of customers or to customize marketing strategies for an organization to acquire customers and to manage customer churn. These problems can be handled using analytical methods, which use the concepts of statistics, machine learning and data mining [4]. In [5], data mining by evolutionary learning using the genetic algorithm was presented for churn predictions for telecom subscriber data. Machine learning algorithms—for instance, decision tree (DT) and neural networks (NN)—have been exploited to predict customer churn by considering billing information, demographics, call detail, contract/service status, records and service change logs [6]. An approach to recognizing potential bank customers who may react to a promotional offer in direct marketing based on customer historical data using support vector machine (SVM) was presented in [7]. Churn prediction in online games using records of players’ login was addressed using the k-nearest neighbors (KNN) algorithm in [8,9]. Various machine learning algorithms such as logistic regression, DT, NN and SVM were adopted and compared to anticipate the victory of telemarketing calls for selling bank long-term investments in [10]. SVM [11] and KNN [12] were also used to predict potential online buyers based on browser session data and hypertext transfer protocol level information. In [13], deciding the active demand reduction potential of wet appliances was considered and solved using the expectation-maximization clustering algorithm. Hierarchical and fuzzy k-means clustering were compared in order to improve business models in demand response programs [14]. In [15], density and grid-based (DGB), density-based spatial clustering of applications with noise (DBSCAN), fast search and find of density peaks (FSFDP) and other clustering algorithms were exploited for DNA microarray industrial data, finding DGB is more suitable for clustering databases with arbitrary shapes than the traditional approaches. E-customer behavior characterization was done by utilizing Web server log data using association rules in [16].
It can be observed from the literature that almost all the conventional unsupervised machine learning algorithms have been exploited in industrial applications, especially in churn prediction, by analyzing the behaviors of customers. However, the performance of an unsupervised clustering algorithm relies on data/features, similarity/distance measure, objective functions, initial cluster centers and the clustering algorithm itself. The similarity measure plays an important role in disclosing hidden patterns and understanding the massive industrial data properly. A substantial amount of research work has been done for the study of clustering using various linear distance measures such as Euclidean, Manhattan, Pearson correlation, Eisen cosine correlation, Spearman correlation, Kendall correlation, Bit-Vector, Hamming, the Jaccard Index and the Dice Index, but this has drawn little attention, especially in terms of introducing non-linearity into similarity measures for data clustering [17,18]. Surprisingly few of these approaches do not abide by the triangle inequality property [19]. The aim of investigating non-linearity in clustering algorithms is to identify a more accurate boundary between two groups. The Bregman divergence was considered as a measure of similarity and merged with the traditional k-means to increase its efficacy in [19]. Currently, a few studies on various divergence-based similarity measures in clustering are underway [20,21]. In this work, the spectral clustering (SC) algorithm is adopted and modified using the non-linear S-distance ( S d ), which is obtained from the S-divergence ( S D ). Some characteristics of S d are also discussed in this study. The proposed SC algorithm is implemented on four toy databases, eight real-world UCI databases, two service industrial databases and one telecommunications database related to customer churn. The proposed SC algorithm is compared with conventional SC algorithms; i.e., the SC algorithm with linear Euclidean distance ( E d ) [22], k-means [22] and DBSCAN [15]. All the achieved outcomes show that the proposed clustering algorithm performs better than the three existing approaches.
The rest of the article is structured as follows: S d and its properties are presented in Section 2. The graph Laplacian and its characteristics are shown in Section 3. The modified SC algorithm and its proof of convergence are addressed in Section 4. Section 5 presents empirical outcomes and discussion. Section 6 concludes the work.

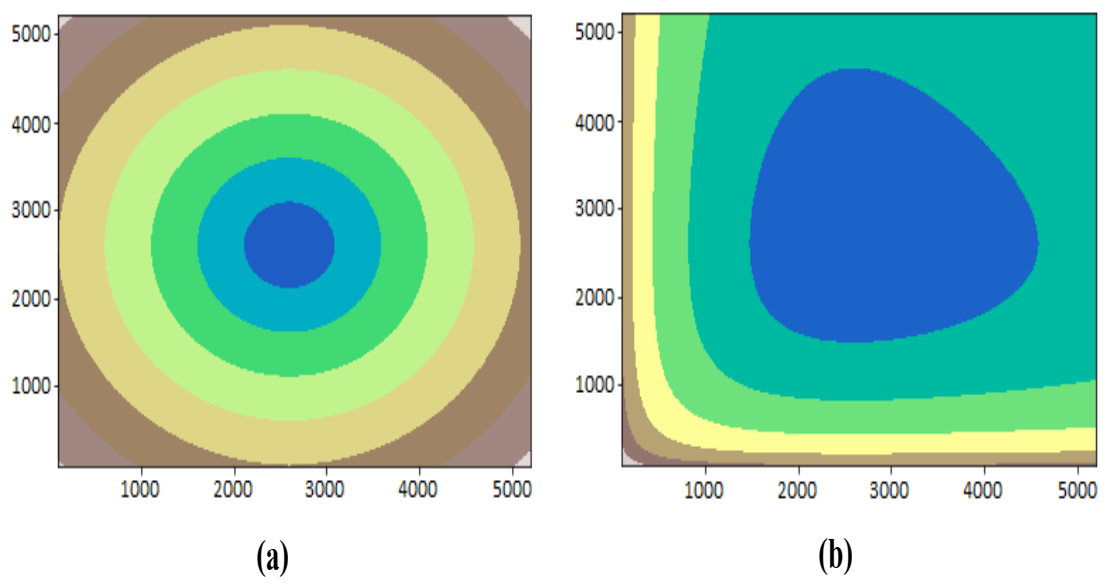
2. S-Distance and Its Properties

In d-dimensional Euclidean space + d , p and q are two points [23]. Equation (1) is employed to compute the S d .
Definition 1.
d i s t s : + d × + d + { 0 } as
d i s t s 2 ( p , q ) = l = 1 d [ log ( ( p l + q l ) / 2 ) ( log ( p l ) + log ( q l ) ) / 2 ]
Let f be an injective function stated as f : + d M d such that f(p) = diag(( p 1 , p 2 , . . . , p d )), where M d represents the positive definite matrices of size d × d . Thus, the S d is well-stated. The S d is obtained from the idea of S D , which is denoted arithmetically by Equation (2).
d i s t s d 2 ( P , Q ) = log | P + Q 2 | log ( | P | ) + log ( | Q | ) 2 ,
where | . | is a determinant of a matrix and d i s t s ( p , q ) = d i s t s d ( f ( p ) , f ( q ) ) . At the moment, we ensure that S d meets all the characteristics for becoming a metric. The characteristics are given below:
Proposition 1.
Non-negativity: d i s t s ( p , q ) 0
Proof. 
The modified form of Equation (1) is presented below:
d i s t s 2 ( p , q ) = l = 1 d [ log ( ( p l + q l ) / 2 ) + log ( ( p l q l ) 1 2 ) ]
l = 1 d log ( p l + q l ) 2 p l q l = l = 1 d log 1 2 p l q l + q l p l 0
d i s t s ( p , q ) 0    □
Proposition 2.
Equality: d i s t s ( p , q ) = 0 iff p = q .
Proof. 
Proposition 2 can be written as d i s t s 2 ( p , q ) = l = 1 d log 1 2 p l q l + q l p l Now, if p and q are the same then q can be substituted by p in the above Equation and the adjusted Equation is d i s t s 2 ( p , q ) = l = 1 d log 1 2 p l p l + p l p l d [ log ( 1 ) ] = 0
d i s t s ( p , q ) = 0 iff p = q .    □
Proposition 3.
Symmetry: d i s t s 2 ( p , q ) = d i s t s 2 ( q , p )
Proof. 
The S d amid p and q is expressed as given below:
d i s t s 2 ( p , q ) = l = 1 d log 1 2 p l q l + q l p l [as already noted in Proposition 1] = d i s t s 2 ( q , p )
d i s t s ( p , q ) = d i s t s ( q , p ) . Thisimplies that the S d also abides by the symmetric metric property.    □
Proposition 4.
Triangle Inequality: In d-dimensional Euclidean space + d , p , q and o are any three points. Then, this proposition states that the sum of any two sides—namely, d i s t s ( p , o ) and d i s t s ( o , q ) —of a triangle is equal to or exceeds the length of the third side d i s t s ( p , q ) . Mathematically, d i s t s ( p , q ) d i s t s ( p , o ) + d i s t s ( o , q ) .
Proof. 
The following can be written by utilizing propositions 1 and 2:
d i s t s ( p , q ) 0 , d i s t s ( p , o ) 0 , and d i s t s ( o , q ) 0
d i s t s ( p , q ) d i s t s ( p , o ) + d i s t s ( o , q ) .
   □
Thus, S d is a metric. At this time, some of the characteristics of S d are presented below:
Theorem 1.
S d is not a Bregman divergence.
Proof. 
This may be demonstrated by refutation. At the beginning, we can assume that the S d is a Bregman divergence. This implies that d i s t s ( p , q ) is rigorously convex in p . It will be necessary to demonstrate that d i s t s ( p , q ) is not convex in p .
Take the double derivative for both sides of the following Equation with regard to p l .
Then,
d i s t s 2 p l = 1 p l + q l 1 2 p l
If l r , then 2 d i s t s 2 p r p l = 0 ;
otherwise, 2 d i s t s 2 p l 2 = 1 ( p l + q l ) 2 + 1 ( 2 p l ) 2 We get 2 d i s t s 2 p l 2 < 0 only when q l < ( 2 1 ) p l l { 1 , , d } , we get 2 d i s t s 2 p l 2 0 for l { 1 , , d } . Thus, a Hassian matrix that has negative diagonal entries would be attained. So, we have verified that the S d is not a Bregman divergence.    □
Theorem 2.
The a p is employed to denote the Hadamard product amid a and p . Then, this can be written d i s t s 2 ( a p , a q ) = d i s t s 2 ( p , q ) for a + d .
Proof. 
This can be written as a p = ( a 1 p 1 , , a d p d ) as per Hadamard product. Thus,
d i s t s 2 ( a l p l , a q l ) = log ( ( a l p l + a l q l ) / 2 ) 0.5 ( log ( a l p l ) + log ( a l q l ) ) = log ( ( a l ( p l + q l ) ) / 2 )
0.5 ( log ( p l ) + log ( q l ) + 2 log ( a l ) )
= log ( ( p l + q l ) / 2 ) 0.5 ( log ( p l ) + log ( q l ) )
= d i s t s 2 ( p , q ) l = 1 d d i s t s 2 ( a l p l , a l q l ) = l = 1 d d i s t s 2 ( p l , q l )
d i s t s 2 ( a p , a q ) = d i s t s 2 ( p , q )    □
Theorem 3.
S d is not an f-divergence.
Proof. 
If q l is substituted by p l ν l , where ν l + d in Equation (1), then
d i s t s 2 ( p , q ) = l = 1 d [ log ( ( p l + p l ν l ) / 2 ) ( log ( p l ) + log ( p l ) ν l ) / 2 ]
d i s t s 2 ( p , q ) = l = 1 d [ log ( ( 1 + ν l ) / 2 ) ( log ( ν l ) ) / 2 ]
l = 1 d U ( ν l ) = l = 1 d U q l p l
Thus, d i s t s 2 ( p , q ) cannot be denoted as l = 1 d p l d i a g q l p l .
d i s t s ( ) is not an f-divergence.    □
Remark 1.
Figure 1 displays the line of the norm-balls of the S d and E d around the point ( 5000 , 5000 ) in + d , where d = 2. One can observe from Figure 1 that the lines of S d and E d look like distorted triangles and concentric circles, respectively. Further, the contour plots of S d approach each other as we get close to the origin. When two points get close to the origin, then S d would be high. On the contrary, the S d of two points would be low when they are far from the origin. In contrast, the E d of two points would be the same in both cases. Thus, S d works well if the larger clusters are far from the origin and the smaller clusters are nearer to the origin.
Remark 2.
S d abides by the principle of Burbea–Rao divergence in + d with condition f ( p ) = l = 1 d log ( p l ) . Thus, f ( p ) is convex in + d .

3. Graph Laplacian and Its Properties

Consider a database D = { p 1 , , p n } with n number of points in d-dimensional Euclidean space, where p i + d expresses the i t h point. W = ( , Ψ , A ) is another representation of the same database, where and Ψ is the set of points and edges of these points, respectively. The A is used to express an affinity matrix or a symmetric weighted matrix of the graph W. In order to build a W, we consider the local neighborhood relationships of these points. Some approaches are available in the literature to construct affinity matrices [24]. Despite that, we have utilized a symmetry-favored KNN to increase the modeling of a graph and reduce outliers and the effect of noise. The graph W may be expressed by the underlying manifold characteristics of the data space [25,26]. In SC, the proper selection of the pairwise similarity measure is crucial [24,26]. Equation (3) is employed to produce an asymmetry-weighted matrix Π n × n connected to W.
Π i , j = exp ( d i s t s 2 ( p i , p j ) d i s t s ( p i , k p i ) d i s t s ( p j , k p j ) ) , if p j d i s t k ( p i ) 0 , otherwise ,
where d i s t s ( ) is the S d between two data points p i and p j , k p i represents the k t h NN of p i and d i s t k ( ) is the set of KNN of p i .
The weighted symmetric matrix of graph W is achieved by utilizing Π using Equation (4).
A i , j = 1 , if p j d i s t k ( p i ) and p i d i s t k ( p j ) Π i , j , if p j d i s t k ( p i ) and p i d i s t k ( p j ) Π j , i , otherwise
Equation (4) is adopted to build the symmetry-favored KNN graph of W. Figure 2 shows a pictorial representation of the difference between a symmetry-favored KNN graph and a KNN graph. The weights of symmetric edges of W are higher than the asymmetric edges because the points associated with symmetric edges belong to the same sub-manifold.
The degree matrix ζ = σ 1 σ 2 σ i σ n , where σ i is determined using Equation (5).
σ i = j = 1 n Π i , j
The essential components of an SC are graph Laplacian matrices, which are of two types: normalized and unnormalized [27]. Equation (6) is employed to estimate the unnormalized graph Laplacian matrix.
W u n = ζ A
In contrast, Equation (7) is exploited to calculate the normalized graph Laplacian matrix.
W n o = ζ 1 2 W u n ζ 1 2 = I ζ 1 2 A ζ 1 2 ,
where I is an identity matrix. The μ 0 , , μ n 1 and τ 0 , , τ n 1 are the eigenvalues and eigenvectors of W n o , respectively. Proposition 5 presents a discussion of the properties of  W n o .
Proposition 5.
Three properties of W n o are given below:
1. 
We have
g T W n o g = 1 2 i , j = 1 n a i , j ( g i σ i g j σ j ) 2
for every g n .
2. 
W n o is symmetric and positive semidefinite.
3. 
W n o consists of n non-negative and real-valued eigenvalues 0 = μ 0 μ n 1 , where n is the number of points in D.

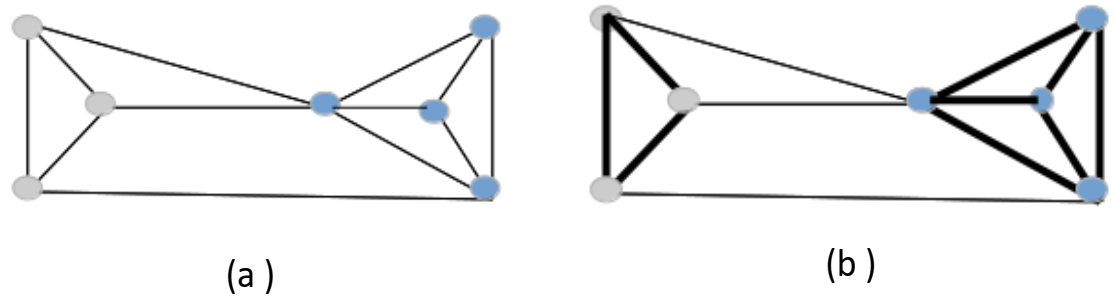
4. Proposed Spectral Clustering Algorithm and Analysis

In SC, a graph partitioning problem is approximated in a manner so that low weights are assigned to edges, which are between clusters. This means that the association between clusters is low or clusters are not similar. On the other hand, high edge weights are assigned when clusters are similar. In [28], a similarity graph with an adjacency matrix A is partitioned by solving the mincut problem. This consists of the selection of partition B 1 , , B k , which minimizes Equation (9).
c u t ( B 1 , , B k ) = i = 1 c c u t ( B i , B i ¯ ) ,
Here, B i ¯ is the complement of B i , where B i is a disjoint subset of points. In reality, the mincut problem does not give us satisfactory partitions. So, this problem can be solved using a normalized cut, Ncut, which is defined by Equation (10).
N c u t ( B 1 , , B k ) = i = 1 k c u t ( B i , B i ¯ ) v o l ( B i ) ,
The Ncut problem can be relaxed and helps to derive the normalized SC [24]. Equation (11) is used to represent the cluster indicator vector, g j = ( g 1 , j , , g n , j ) .
g i , j = 1 v o l ( B j ) , if p i B j 0 , o t h e r w i s e ,
where 1 i n , 1 j k and a matrix G can be constructed as G = ( g i , j ) 1 i n , 1 j k and G G = I with g i ζ g i = 1 and g i W n o g i = 2 c u t ( B i , B i ¯ ) v o l ( B i ) . So, Equation (12) is utilized to denote the minimization of Ncut.
m i n B 1 , , B k T r ( G W n o G ) , subject to G ζ G = I
where T r is the trace of a matrix. After relaxing the discreteness condition and replacing V = ζ 1 2 G , the relaxed problem is as shown in Equation (13):
m i n V n × k T r ( V ζ 1 2 W n o ζ 1 2 V ) subject to V V = I
Equation (13) consists of a matrix V that contains the first k eigenvectors of W n o as columns. Let V = { v 1 , , v n } be a given set of vectors in + k . Equation (13) can be further simplified as Equation (14).
m i n V n × c T r ( V W n o V ) subject to V V = I
Equation (13) is the trace minimization problem that is solved by a matrix V, containing the first k eigenvectors of W n o in columns. We want to assign v i V to any mutually exclusive class such that 2 k n . A mathematical way to design this problem as follows:
χ : minimize h ( Q , C ) = i = 1 n j = 1 k a i j d i s t s 2 ( v i , c j ) subject to j = 1 k a i j = 1 where a i j { 1 , 0 } and C = { c 1 , , c k } , c j + k i { 1 , , n } , j { 1 , , k }
The solution to the above problem χ uses k-means with S d , which converges to a local optimal solution of χ in finite iterations [29]. Algorithm 1 shows the modified SC.
Algorithm 1: The proposed SC algorithm.
Input: , k , k—a set of points, nearest neighbors for affinity matrix and number of clusters
Output: Cluster labels of all the points
1.
Compute the KNN graph and the weight matrix A using (3)–(4)
2.
To get the normalized graph Laplacian W n o by (5)–(7) as
W n o = ζ 1 2 W u n ζ 1 2 = I ζ 1 2 A ζ 1 2
3.
Calculate the k smallest eigenvalues { μ i } i = 1 , , c and their corresponding eigenvectors { σ i } i = 1 , , k using the affinity matrix W n o in (7) and form a matrix Y n × k
4.
Convert Y matrix to Γ n × k by normalizing the Y such that the rows to have unit length (i.e., Γ i j = Y i j ( l Y i l 2 ) 1 2 )
5.
Cluster data points Γ i = 1 , , n k in to k clusters via k-means clustering with either E d or S d
6.
At the end, allot each point p i to cluster j if and only if i t h row of matrix Γ was allotted to cluster j

5. Experimental Results and Discussion

A laptop Intel(R) Core(TM) i7-2620M [email protected] and 4-GB RAM running on Windows 10 with a 64-bit Python 3.6.5 compiler was used for this study. Every aspect of the work was done in the Spyder 3.2.8 Python development environment.

5.1. Database Description

In total, 15 databases of three classes are considered in this work to compare the performance of the proposed clustering algorithm with three existing approaches.

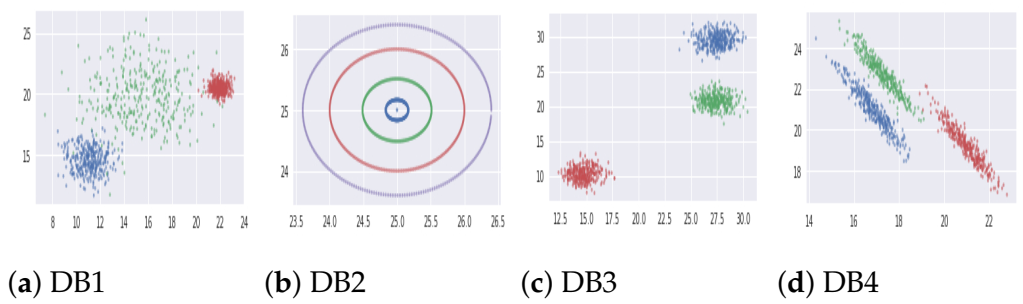
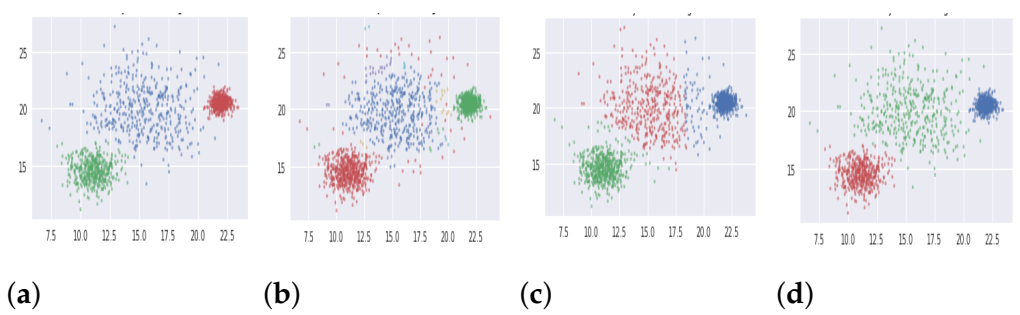
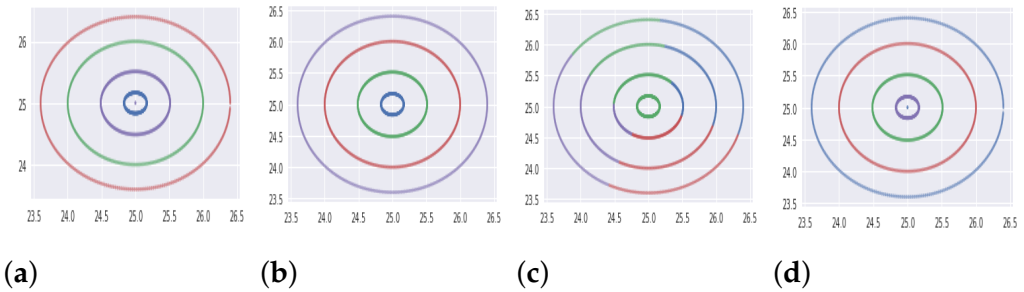
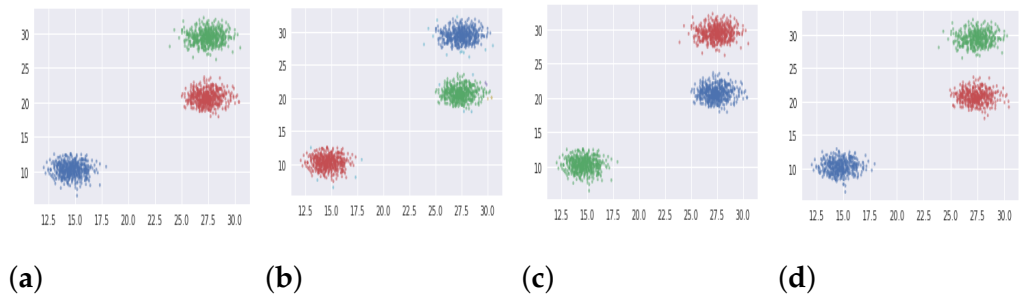
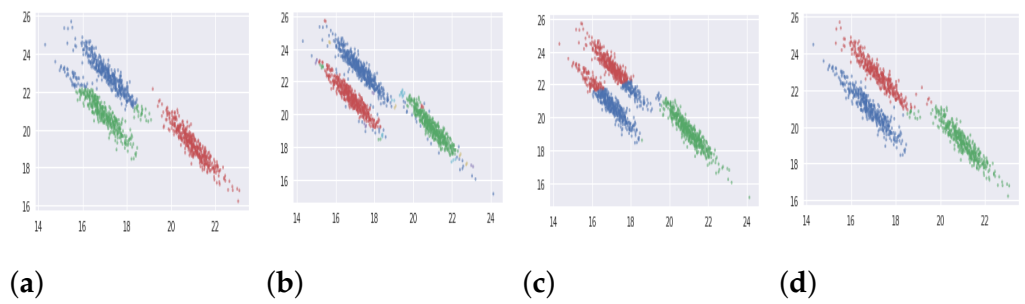
5.1.1. Synthetic Databases

Four synthetic/toy databases were considered. In varied distributed database (DB1), data points are distributed with varied variances. Four concentric circles are present in noisy four-circles (DB2), where each circle represents a class. The blob database (DB3) consists of isotropic Gaussian blobs with three classes. The data point distribution is anisotropic in nature for the anisotropically distributed database (DB4). Table 1 presents the title of the toy databases, the number of sample points of these databases, the number of facets in each point and the number of clusters. The data distribution in the two-dimensional Euclidean space of each of these four synthetic databases is shown in Figure 3. The x-axis and y-axis of each plotted distribution denote feature 1 and feature 2, respectively, as two features are present in each of the toy databases.

5.1.2. UCI and Industrial Databases

Eight popular realistic databases—Digits, Iris, Breast cancer, Wine, Avila, Letter, Poker and Shuttle—were adopted from the UCI repository [30,31]. A brief portrayal of these UCI databases is given in Table 1. On the other hand, two industrial databases—namely, Bank telemarketing [10] and Purchasing intention [32]—are considered in this work. A database related to telecommunication customer churn was adopted from the Kaggle repository to study the customer data for retaining and maximizing benefit by devising suitable business plans. Brief details of these databases are given in Table 1. Outliers and data reconciliation are not handled separately in this work. However, normalization was carried out before applying the proposed algorithm to model the data correctly. As mentioned in Section 2, S d is defined in d-dimensional Euclidean space + d ; thus, raw data were normalized to obtain a positive scale by shifting data with the absolute of the most negative value such that the most negative value would be the minimum positive non-zero value and all other data points would be positive.

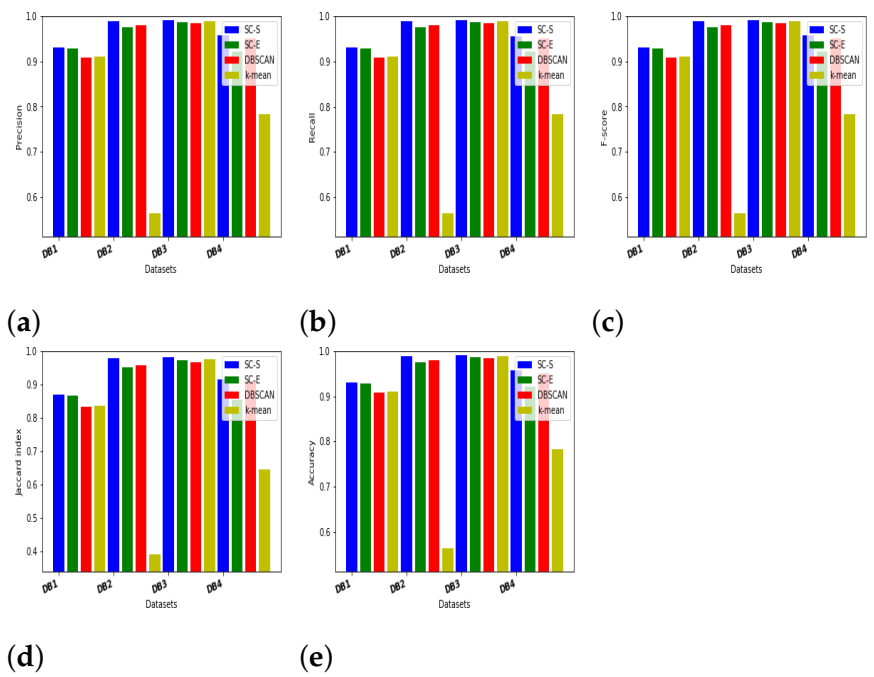
5.2. Evaluation Indices

Accuracy is one of the most adopted validation indices. It denotes the ratio of correct outcomes that a machine learning algorithm has attained. The higher the accuracy obtained by an algorithm, the better and more useful that algorithm is. However, this may mislead researchers due to the accuracy paradox. Accuracy adopted along with other indices; for instance, the Jaccard index, f-score, recall, and precision [33,34,35]. Interested readers are referred to [36] to learn about the various validation indices in depth. Non-parametric statistical hypothesis tests, called the Wilcoxon’s signed-rank test, Wilcoxon’s rank-sum test and sign test, were conducted as well at the 5% significance level to determine whether two dependent samples were chosen from the data [37,38].

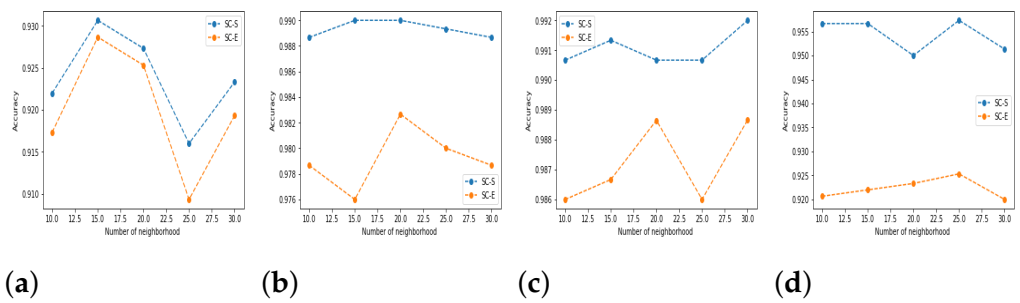
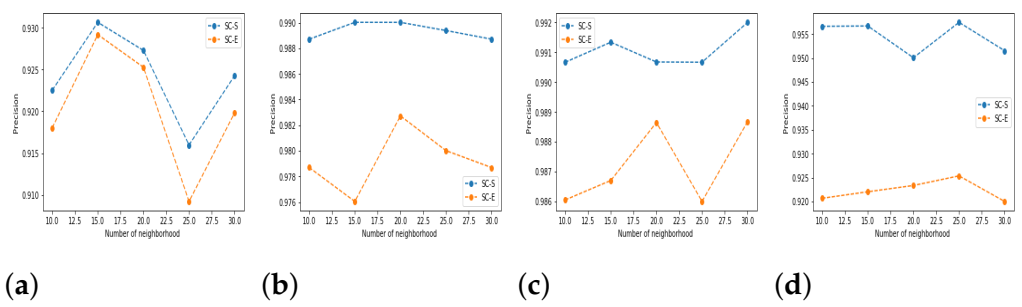
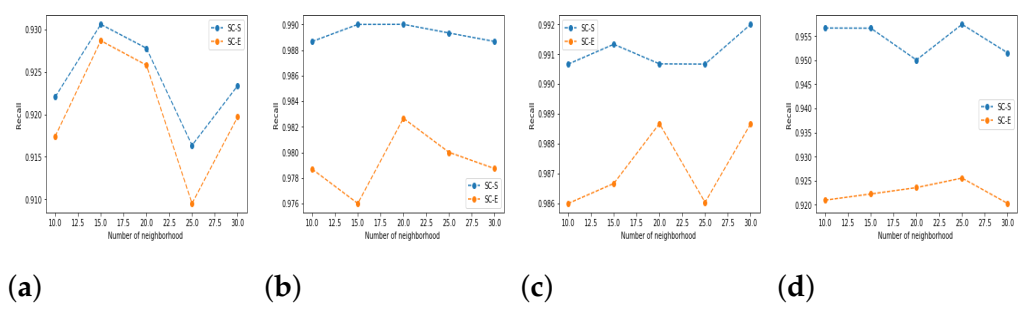
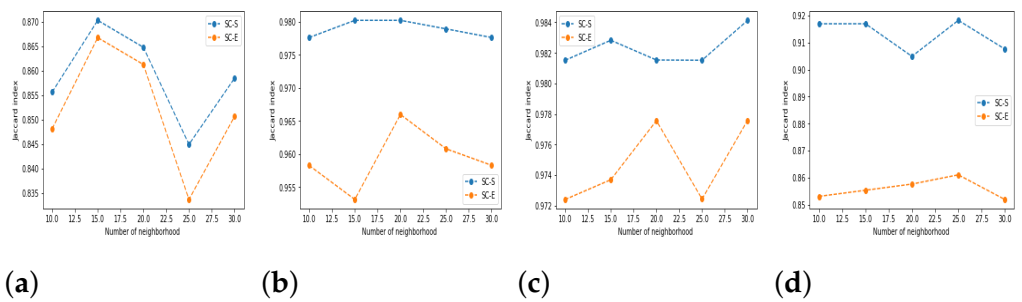
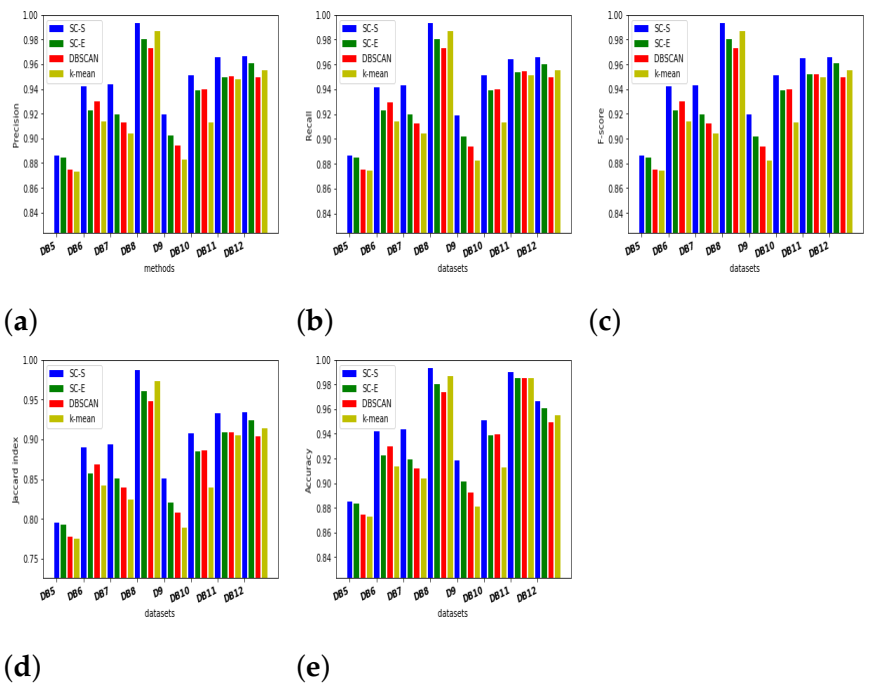
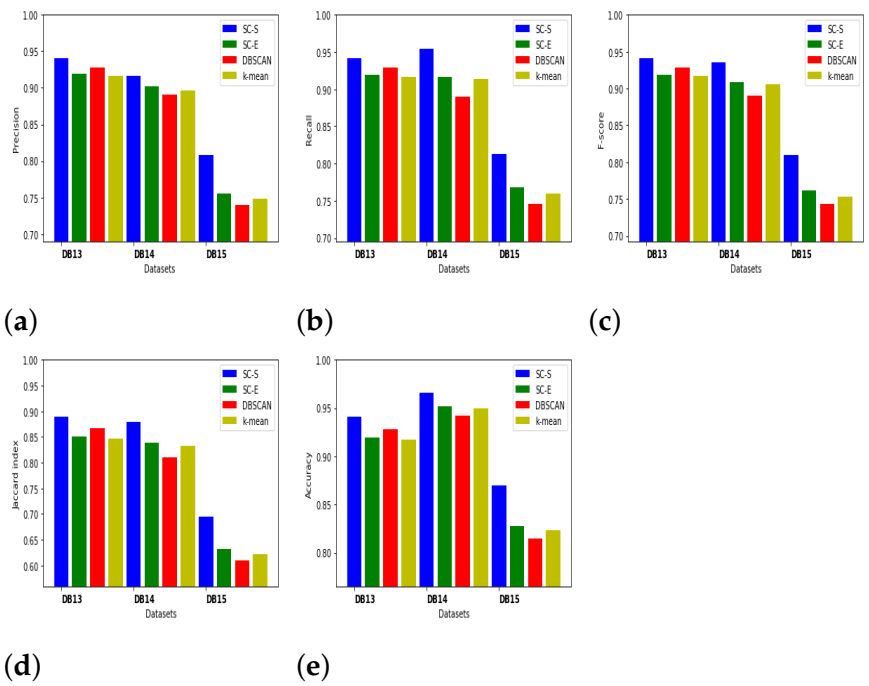
5.3. Results and Discussion

In this study, the proposed SC—i.e., an SC with S d (SC-S)—is compared with the conventional SC (SC-E) [22], k-means [22] and DBSCAN [15] on the basis of 14 databases. As we know, an affinity matrix helps to represent data points graphically and the affinity matrix depends on a symmetric favored KNN. So, in the first experiment, two methods—SC-S and SC-E—were executed on four synthetic databases only and the performances were judged based on five validation indices; namely, the Jaccard index, f-score, recall, precision and accuracy. A significant amount of time has been devoted by the research community to deciding the best value of k for KNN. Still, this is an open problem. So, the value of k is determined based on empirical results in this work. Initially, 10 is considered as the value of k . Later on, this reaches 30 with a step size of 5. The achieved Jaccard index, f-score, recall, precision and accuracy using SC-S and SC-E are shown in Figure 4, Figure 5, Figure 6, Figure 7 and Figure 8, respectively. It is observed from Figure 4, Figure 5, Figure 6, Figure 7 and Figure 8 that the SC-S always outperforms the SC-E for the five evaluation metrics. Moreover, KNN was stable when the value of k was 20, which is used for the rest of the work [25].
In the second experiment, the SC-S was compared with SC-E, k-means and DBSCAN on 14 databases. Figure 9, Figure 10, Figure 11 and Figure 12 show the data distribution of each toy database separately after applying four clustering algorithms. Here, different colors are used to denote different clusters. The number of colors depends on the number of clusters in each database. However, the colors are assigned in each database randomly. So, no color is used to fix a particular cluster. It is clear from Figure 9, Figure 10, Figure 11 and Figure 12 that the k-means performs worst compared to the rest of the three methods, but it is difficult to comment on these three methods with regard only to Figure 9, Figure 10, Figure 11 and Figure 12. In Figure 10, the result of k-means shows that k-means works better in the case of spherical data only. While the other methods perform better compared to k-means, more information is required to say more about the four clustering algorithms. Figure 13 shows the obtained Jaccard index, f-score, recall, precision and accuracy using the four clustering algorithms. Here, two parameters—the radius (Eps) and a minimum number of points (MinPts)—are required to execute DBSCAN. The values of Eps and MinPts are 0.5 and 3, respectively [39]. Figure 13 illustrates that the proposed clustering algorithm SC-S is the best among the four used clustering algorithms in terms of the five evaluation metrics.
The proposed method along with three existing approaches was executed on eight UCI databases as discussed in Figure 14. In addition, two industrial databases and one telecommunication database were used for customer churn analysis, and the achieved results are displayed in Figure 15. Figure 15 shows the accuracy and TP rates obtained for the test cases with regard to the prediction horizon, which is calculated as the number of tasks performed by the users before leaving the commercial web site. As shown in Figure 15, it is clear that the SC-S has the highest accuracy compared to other existing approaches. Long-term deposits are favored by banks to maintain funds with minimal interest. Thus, this long-term deposit policy is better at generating higher successful sales, even if it requires some effort in communicating with customers. Under these circumstances, the proposed model SC-S shows higher accuracy as compared to the other existing approaches, as discussed in Figure 15. In this type of database, human agents have less probability to convert any call into successful calls. The telecommunication database is clustered into two clusters; namely, stable customers and churning customers. The objective is to predict customer behavior in the future based on these features. This analysis using clustering can help enterprises to develop efficient marketing strategies to select valuable customers and those that are necessary to retain, while customers that are going to churn can be contacted with appropriate retention measures to maximize profits. Further, enterprises can perform a deep analysis of the stable customers and can target more similar customers to increase their market space.
In this experiment, the non-parametric significance test of the SC-S was compared with other methods: SC-E, k-means and DBSCAN. First, a pairwise comparison of the SC-C with SC-E was performed and is labeled as “M1”. Second, a pairwise comparison was done with k-means and marked as “M2”. Finally, SC-S was compared with DBSCAN and denoted as “M3”. This pairwise experiment was performed for three indices; namely, the Wilcoxon’s signed-rank test, Wilcoxon’s rank-sum test and sign tests [40]. These pairwise tests are the easiest ways to test statistics that can be conducted within the framework of an empirical study by a researcher. These non-parametric tests are also executed by considering the p-values (in Table 2) that are obtained based on accuracy only. The results of Table 2 allow us to refute the null hypothesis at a 5% level of significance. So, SC-S is statistically superior to the three existing approaches. Some insignificant p-values higher than 0.05 are also reported in Table 2.

6. Conclusions

In this work, an enhanced SC based on S d is proposed to predict customer churn with better accuracy by analyzing industrial data. The traditional KNN is replaced by a symmetric-favored KNN in the proposed algorithm in order to increase the efficacy of clustering. Extensive experiments are performed on four synthetics, eight UCI, two industrial databases and one telecommunication database for customer churn analysis, validating the proposed algorithm by the comparison with three existing clustering algorithms; namely, SC-E, k-means and DBSCAN. All the outcomes show that the proposed algorithm performs better than the three existing approaches in terms of five validation metrics: the Jaccard index, f-score, recall, precision and accuracy. The statistical significance of the SC-S is also measured by considering Wilcoxon’s signed-rank test, Wilcoxon’s rank-sum test and sign tests. This study can be extended to large databases by optimizing the step of eigenvalue computation using either the Hadoop architecture or parallel computation. The real-world databases consist of categorical as well as numerical attributes. This study proves that the SC-S works well on databases with numerical attributes only. However, the SC-S cannot work on databases with categorical attributes, which deserves further study.

Author Contributions

Conceptualization, K.K.S., A.S., E.H.-V., and O.K.; methodology, K.K.S., and A.S.; software, K.K.S. and A.S.; validation, E.H.-V. and O.K.; formal analysis, K.K.S., and A.S.; investigation, A.S., E.H.-V. and O.K.; resources, A.S. and O.K.; data curation, K.K.S. and A.S.; writing—original draft preparation, K.K.S. and A.S.; writing—review and editing, K.K.S., A.S., E.H.-V. and O.K.; visualization, K.K.S., A.S. and E.H.-V.; supervision, A.S., E.H.-V. and O.K.; project administration, A.S., E.H.-V. and O.K. All authors have read and agreed to the published version of the manuscript.

Funding

This research received no external funding.

Institutional Review Board Statement

Not applicable.

Informed Consent Statement

Not applicable.

Data Availability Statement

Not applicable.

Acknowledgments

This work is partially supported by the project “Prediction of diseases through computer assisted diagnosis system using images captured by minimally-invasive and non-invasive modalities”, Computer Science and Engineering, PDPM Indian Institute of Information Technology, Design and Manufacturing, Jabalpur India (under ID: SPARCMHRD-231). This work is also partially supported by the project “Smart Solutions in Ubiquitous Computing Environments”, Grant Agency of Excellence, University of Hradec Kralove, Faculty of Informatics and Management, Czech Republic (under ID: UHK-FIM-GE-2204/2021); project at Universiti Teknologi Malaysia (UTM) under Research University Grant Vot-20H04, Malaysia Research University Network (MRUN) Vot 4L876 and the Fundamental Research Grant Scheme (FRGS) Vot5F073 supported by the Ministry of Education Malaysia for the completion of the research.

Conflicts of Interest

The authors declare no conflict of interest.

References

  1. Mohan, K.; Seal, A.; Krejcar, O.; Yazidi, A. Facial Expression Recognition Using Local Gravitational Force Descriptor-Based Deep Convolution Neural Networks. IEEE Trans. Instrum. Meas. 2020, 70, 1–12. [Google Scholar] [CrossRef]
  2. Rust, R.T.; Moorman, C.; Bhalla, G. Rethinking marketing. Harv. Bus. Rev. 2010, 88, 94–101. [Google Scholar]
  3. Nobibon, F.T.; Leus, R.; Spieksma, F.C. Optimization models for targeted offers in direct marketing: Exact and heuristic algorithms. Eur. J. Oper. Res. 2011, 210, 670–683. [Google Scholar] [CrossRef]
  4. Abbasi, A.A.; Younis, M. A survey on clustering algorithms for wireless sensor networks. Comput. Commun. 2007, 30, 2826–2841. [Google Scholar] [CrossRef]
  5. Au, W.H.; Chan, K.C.; Yao, X. A novel evolutionary data mining algorithm with applications to churn prediction. IEEE Trans. Evol. Comput. 2003, 7, 532–545. [Google Scholar]
  6. Hung, S.Y.; Yen, D.C.; Wang, H.Y. Applying data mining to telecom churn management. Expert Syst. Appl. 2006, 31, 515–524. [Google Scholar] [CrossRef] [Green Version]
  7. Hossein Javaheri, S. Response Modeling in Direct Marketing: A Data Mining Based Approach for Target Selection. 2008. Available online: https://www.researchgate.net/publication/292282619_Response_modeling_in_direct_marketing_A_data_mining_based_approach_for_target_selection (accessed on 25 March 2021).
  8. Castro, E.G.; Tsuzuki, M.S. Churn prediction in online games using players’ login records: A frequency analysis approach. IEEE Trans. Comput. Intell. Games 2015, 7, 255–265. [Google Scholar] [CrossRef]
  9. Sharma, K.K.; Seal, A. Clustering analysis using an adaptive fused distance. Eng. Appl. Artif. Intell. 2020, 96, 103928. [Google Scholar] [CrossRef]
  10. Moro, S.; Cortez, P.; Rita, P. A data-driven approach to predict the success of bank telemarketing. Decis. Support Syst. 2014, 62, 22–31. [Google Scholar] [CrossRef] [Green Version]
  11. Suchacka, G.; Skolimowska-Kulig, M.; Potempa, A. Classification Of E-Customer Sessions Based On Support Vector Machine. ECMS 2015, 15, 594–600. [Google Scholar]
  12. Suchacka, G.; Skolimowska-Kulig, M.; Potempa, A. A k-Nearest Neighbors method for classifying user sessions in e-commerce scenario. J. Telecommun. Inf. Technol. 2015. Available online: https://yadda.icm.edu.pl/baztech/element/bwmeta1.element.baztech-40e29335-8f5f-4d8c-aa93-8c13a90d1b2d (accessed on 25 March 2021).
  13. Labeeuw, W.; Stragier, J.; Deconinck, G. Potential of active demand reduction with residential wet appliances: A case study for Belgium. IEEE Trans. Smart Grid 2015, 6, 315–323. [Google Scholar] [CrossRef]
  14. Faria, P.; Spínola, J.; Vale, Z. Aggregation and remuneration of electricity consumers and producers for the definition of demand-response programs. IEEE Trans. Ind. Inform. 2016, 12, 952–961. [Google Scholar] [CrossRef]
  15. Wu, B.; Wilamowski, B.M. A fast density and grid based clustering method for data with arbitrary shapes and noise. IEEE Trans. Ind. Inform. 2017, 13, 1620–1628. [Google Scholar] [CrossRef]
  16. Suchacka, G.; Chodak, G. Using association rules to assess purchase probability in online stores. Inf. Syst. Bus. Manag. 2017, 15, 751–780. [Google Scholar] [CrossRef] [Green Version]
  17. Bottou, L.; Bengio, Y. Convergence Properties of the K-Means Algorithms; Advances in Neural Information Processing Systems: Vancouver, BC, Canada, 1995; pp. 585–592. [Google Scholar]
  18. Sharma, K.K.; Seal, A. Spectral embedded generalized mean based k-nearest neighbors clustering with s-distance. Expert Syst. Appl. 2020, 169, 114326. [Google Scholar] [CrossRef]
  19. Banerjee, A.; Merugu, S.; Dhillon, I.S.; Ghosh, J. Clustering with Bregman divergences. J. Mach. Learn. Res. 2005, 6, 1705–1749. [Google Scholar]
  20. Nock, R.; Nielsen, F.; Amari, S.I. On conformal divergences and their population minimizers. IEEE Trans. Inf. Theory 2016, 62. [Google Scholar] [CrossRef] [Green Version]
  21. Notsu, A.; Komori, O.; Eguchi, S. Spontaneous clustering via minimum gamma-divergence. Neural Comput. 2014, 26, 421–448. [Google Scholar] [CrossRef] [PubMed] [Green Version]
  22. Chang, E.C.; Huang, S.C.; Wu, H.H. Using K-means method and spectral clustering technique in an outfitter’s value analysis. Qual. Quant. 2010, 44, 807–815. [Google Scholar] [CrossRef]
  23. Sra, S. Positive definite matrices and the S-divergence. Proc. Am. Math. Soc. 2016, 144, 2787–2797. [Google Scholar] [CrossRef] [Green Version]
  24. Von Luxburg, U. A tutorial on spectral clustering. Stat. Comput. 2007, 17, 395–416. [Google Scholar] [CrossRef]
  25. Jiao, L.; Shang, F.; Wang, F.; Liu, Y. Fast semi-supervised clustering with enhanced spectral embedding. Pattern Recognit. 2012, 45, 4358–4369. [Google Scholar] [CrossRef]
  26. Kim, T.H.; Lee, K.M.; Lee, S.U. Learning full pairwise affinities for spectral segmentation. IEEE Trans. Pattern Anal. Mach. Intell. 2013, 35, 1690–1703. [Google Scholar] [PubMed] [Green Version]
  27. Chen, W.; Feng, G. Spectral clustering: A semi-supervised approach. Neurocomputing 2012, 77, 229–242. [Google Scholar] [CrossRef]
  28. Shi, J.; Malik, J. Normalized cuts and image segmentation. IEEE Trans. Pattern Anal. Mach. Intell. 2000, 22, 888–905. [Google Scholar]
  29. Selim, S.Z.; Ismail, M.A. K-means-type algorithms: A generalized convergence theorem and characterization of local optimality. IEEE Trans. Pattern Anal. Mach. Intell. 1984, 1, 81–87. [Google Scholar] [CrossRef] [PubMed]
  30. De Stefano, C.; Maniaci, M.; Fontanella, F.; di Freca, A.S. Reliable writer identification in medieval manuscripts through page layout features: The “Avila” Bible case. Eng. Appl. Artif. Intell. 2018, 72, 99–110. [Google Scholar] [CrossRef]
  31. Dheeru, D.; Karra Taniskidou, E. UCI Machine Learning Repository; UCI: Irvine, CA, USA, 2017. [Google Scholar]
  32. Sakar, C.O.; Polat, S.O.; Katircioglu, M.; Kastro, Y. Real-time prediction of online shoppers’ purchasing intention using multilayer perceptron and LSTM recurrent neural networks. Neural Comput. Appl. 2019, 31, 6893–6908. [Google Scholar] [CrossRef]
  33. Sharma, K.K.; Seal, A. Modeling uncertain data using Monte Carlo integration method for clustering. Expert Syst. Appl. 2019, 137, 100–116. [Google Scholar] [CrossRef]
  34. Seal, A.; Karlekar, A.; Krejcar, O.; Gonzalo-Martin, C. Fuzzy c-means clustering using Jeffreys-divergence based similarity measure. Appl. Soft Comput. 2020, 88, 106016. [Google Scholar] [CrossRef]
  35. Sharma, K.K.; Seal, A. Multi-view spectral clustering for uncertain objects. Inf. Sci. 2021, 547, 723–745. [Google Scholar] [CrossRef]
  36. Fawcett, T. An introduction to ROC analysis. Pattern Recognit. Lett. 2006, 27, 861–874. [Google Scholar] [CrossRef]
  37. Karlekar, A.; Seal, A.; Krejcar, O.; Gonzalo-Martin, C. Fuzzy k-means using non-linear s-distance. IEEE Access 2019, 7, 55121–55131. [Google Scholar] [CrossRef]
  38. Sharma, K.K.; Seal, A. Outlier-robust multi-view clustering for uncertain data. Knowl. Based Syst. 2021, 211, 106567. [Google Scholar] [CrossRef]
  39. Kriegel, H.P.; Pfeifle, M. Density-based clustering of uncertain data. In Proceedings of the Eleventh ACM SIGKDD International Conference on Knowledge Discovery in Data Mining, Chicago, IL, USA, 21–24 August 2005; pp. 672–677. [Google Scholar]
  40. Richardson, A.M. Nonparametric Statistics: A Step-by-Step Approach. Int. Stat. Rev. 2015, 83, 163–164. [Google Scholar] [CrossRef]

Short Biography of Authors

Symmetry 13 00596 i001Krishna Kumar Sharma is currently pursuing PhD with the Computer Science and Engineering Department, PDPM Indian Institute of Information Technology, Design and Manufacturing Jabalpur, Madhya Pradesh, India and has received the M.Tech.(Information Technology) degree from IIIT Allahabad, Uttar Pradesh, India, in 2011. He is also currently an Assistant Professor with the Computer Science and Informatics Department, University of Kota, Kota, Rajasthan, India. His current research interest includes pattern recognition.
Symmetry 13 00596 i002Ayan Seal received the PhD degree in engineering from Jadavpur University, West Bengal, India, in 2014. He is currently an Assistant Professor with the Computer Science and Engineering Department, PDPM Indian Institute of Information Technology, Design and Manufacturing Jabalpur, Madhya Pradesh, India. He is also associated with the Center for Basic and Applied Science, Faculty of Informatics and Management, University of Hradec Králové, Hradec Králové, Czech Republic. He has visited the Universidad Politecnica de Madrid, Spain as a visiting research scholar. He is the recipient of several awards including Sir Visvesvaraya Young Faculty Research Fellowship from Media Lab Asia, Ministry of Electronics and Information Technology, Government of India. He has authored or co-authored of several journals, conferences and book chapters in the area of computer vision and machine learning. His current research interests include image processing and pattern recognition.
Symmetry 13 00596 i003Enrique Herrera-Viedma received the M.Sc. and Ph.D. degrees in computer science from the University of Granada, Granada, Spain, in 1993 and 1996, respectively. He is a Professor of computer science and the Vice-President for Research and Knowledge Transfer with University of Granada, Granada, Spain. His h-index is 81 with more than 23,000 citations received in Web of Science and 97 in Google Scholar with more than 37,000 cites received. He has been identified as one of the world’s most influential researchers by the Shanghai Center and Thomson Reuters/Clarivate Analytics in both computer science and engineering in the years 2014, 2015, 2016, 2017, 2018, 2019 and 2020. His current research interests include group decision making, consensus models, linguistic modeling, aggregation of information, information retrieval, bibliometric, digital libraries, web quality evaluation, recommender systems, and social media. Dr. Herrera-Viedma is Vice President for Publications in System Man & Cybernetic Society and an Associate Editor in several journals such as IEEE Transactions on Fuzzy Systems, IEEE Transactions on Systems, Man, and Cybernetics: Systems, IEEE Transactions on Intelligent Transport System, Information Sciences, Applied Soft Computing, Soft Computing, Fuzzy Optimization and Decision Making, and Knowledge-Based Systems.
Symmetry 13 00596 i004Ondrej Krejcar is a full professor in systems engineering and informatics at the University of Hradec Kralove, Czech Republic. In 2008 he received his Ph.D. title in technical cybernetics at Technical University of Ostrava, Czech Republic. He is currently a vice-rector for science and creative activities of the University of Hradec Kralove from June 2020. At present, he is also a director of the Center for Basic and Applied Research at the University of Hradec Kralove. In years 2016–2020 he was vice-dean for science and research at Faculty of Informatics and Management, UHK. His h-index is 19, with more than 1250 citations received in the Web of Science. In 2018, he was the 14th top peer reviewer in Multidisciplinary in the World according to Publons and a Top Reviewer in the Global Peer Review Awards 2019 by Publons. Currently, he is on the editorial board of the MDPI Sensors IF journal (Q1/Q2 at JCR), and several other ESCI indexed journals. He is a Vice-leader and Management Committee member at WG4 at project COST CA17136, since 2018. He has also been a Management Committee member substitute at project COST CA16226 since 2017. Since 2019, he has been Chairman of the Program Committee of the KAPPA Program, Technological Agency of the Czech Republic as a regulator of the EEA/Norwegian Financial Mechanism in the Czech Republic (2019–2024). Since 2020, he has been Chairman of the Panel 1 (Computer, Physical and Chemical Sciences) of the ZETA Program, Technological Agency of the Czech Republic. Since 2014 until 2019, he has been Deputy Chairman of the Panel 7 (Processing Industry, Robotics, and Electrical Engineering) of the Epsilon Program, Technological Agency of the Czech Republic. At the University of Hradec Kralove, he is a guarantee of the doctoral study program in Applied Informatics, where he is focusing on lecturing on Smart Approaches to the Development of Information Systems and Applications in Ubiquitous Computing Environments. His research interests include Control Systems, Smart Sensors, Ubiquitous Computing, Manufacturing, Wireless Technology, Portable Devices, biomedicine, image segmentation and recognition, biometrics, technical cybernetics, and ubiquitous computing. His second area of interest is in Biomedicine (image analysis), as well as Biotelemetric System Architecture (portable device architecture, wireless biosensors), development of applications for mobile devices with use of remote or embedded biomedical sensors
Figure 1. Contour plot of the norm balls for (a) E d and (b) S-distance ( S d ).
Symmetry 13 00596 g001
Figure 2. (a) 3NN and (b) symmetry-favored 3NN (higher edge weights are denoted by bold edges).
Symmetry 13 00596 g002
Figure 3. Four Toy Databases.
Symmetry 13 00596 g003
Figure 4. Comparative analysis using the accuracy index on various toy databases using SC-E and SC-S in the case of varying neighborhoods for the construction of an affinity matrix. (a) DB1 (b) DB2 (c) DB3 and (d) DB4.
Symmetry 13 00596 g004
Figure 5. Comparative analysis using the precision index on various toy databases using SC-E and SC-S in the case of varying neighborhoods for the construction of an affinity matrix. (a) DB1 (b) DB2 (c) DB3 and (d) DB4.
Symmetry 13 00596 g005
Figure 6. Comparative analysis using the recall index on various toy databases using SC-E and SC-S in the case of varying neighborhoods for the construction of an affinity matrix. (a) DB1 (b) DB2 (c) DB3 and (d) DB4.
Symmetry 13 00596 g006
Figure 7. Comparative analysis using the fscore index on various toy databases using SC-E and SC-S in the case of varying neighborhoods for the construction of an affinity matrix. (a) DB1 (b) DB2 (c) DB3 and (d) DB4.
Symmetry 13 00596 g007
Figure 8. Comparative analysis using the Jaccard index on various toy databases using SC-E and SC-S in the case of varying neighborhoods for the construction of an affinity matrix. (a) DB1 (b) DB2 (c) DB3 and (d) DB4.
Symmetry 13 00596 g008
Figure 9. Result of clustering algorithm on DB1 using four methods: (a) SC-E (b) DBSCAN, (c) k-means clustering and (d) SC-S.
Symmetry 13 00596 g009
Figure 10. Result of Ccustering algorithm on DB2 using four methods: (a) SC-E (b) DBSCAN, (c) k-means clustering and (d) SC-S.
Symmetry 13 00596 g010
Figure 11. Result of clustering algorithm on DB3 using four methods: (a) SC-E (b) DBSCAN, (c) k-means clustering and (d) SC-S.
Symmetry 13 00596 g011
Figure 12. Result of clustering algorithm on DB4 sets using four methods: (a) SC-E (b) DBSCAN, (c) k-means clustering and (d) SC-S.
Symmetry 13 00596 g012
Figure 13. Comparative analysis of SC-E, SC-S, DBSCAN and k-means clustering on toy data sets using various validation indices: (a) precision, (b) recall, (c) f-score, (d) Jaccard index and (e) accuracy.
Symmetry 13 00596 g013
Figure 14. Comparative analysis of SC-E, SC-S, DBSCAN and k-means clustering on UCI data sets using various validation indices: (a) precision, (b) recall, (c) f-score, (d) Jaccard index and (e) accuracy.
Symmetry 13 00596 g014
Figure 15. Comparative analysis of SC-E, SC-S, DBSCAN and k-means clustering on industry data sets using various validation indices: (a) precision, (b) recall, (c) f-score, (d) Jaccard index and (e) accuracy.
Symmetry 13 00596 g015
Table 1. Databases.
Table 1. Databases.
S.No.CategoryDatabasesSamplesFeaturesClusters
1SyntheticVaried Distributed Data (DB1)150023
2SyntheticNoisy 4-Circles (DB2)150024
3SyntheticBlobs (DB3)150023
4SyntheticAnisotropically Distributed Data (DB4)150023
5UCIAvila database (DB5)104301012
6UCIBreast Cancer database (DB6)569302
7UCIDigits database (DB7)17976410
8UCIIris database (DB8)15043
9UCILetter Recognition database (DB9)200001626
10UCIPoker Hand database (DB10)250101010
11UCIShuttle database (DB11)4350097
12UCIWine database (DB12)178133
13IndustrialBanking marketing database (DB13)45211122
14IndustrialOnline Shoppers’ Purchasing Intention (DB14)12330182
15IndustrialTelecommunication customer churn database (DB15)7044212
Table 2. Significance test using the accuracy validation index.
Rank-SumSign-RankSign Test
DatabasesM1M2M3M1M2M3M1M2M3
DB10.049370.000160.001950.00470.004920.004920.001950.049370.0015
DB20.000160.000160.000160.00470.004480.004480.001950.001950.00195
DB30.001950.000160.000160.00470.004920.004920.001950.000160.00195
DB40.289920.000160.00150.00470.004920.004920.001950.001950.0015
DB50.000160.002890.000160.004920.004920.004920.001950.00150.00195
DB60.000160.000160.000160.004920.004920.004920.001950.001950.00195
DB70.000160.000160.000160.004920.004920.00470.00150.000160.00195
DB80.002890.000160.000160.004920.004920.004920.001950.001950.00492
DB90.000160.004920.00150.004480.004480.00470.001950.001950.00195
DB100.000160.000160.000160.004920.004920.004920.00150.001950.00195
DB110.000160.004920.000160.004920.004920.004920.001950.001950.00492
DB120.000160.000160.00150.004920.004920.004920.001950.001950.00195
DB130.00150.000160.000160.004070.00470.004920.001950.001950.00195
DB140.000160.000160.000160.004920.004920.004920.001950.001950.00492
DB150.00470.049370.001950.004920.004480.004920.002890.001950.0047
Publisher’s Note: MDPI stays neutral with regard to jurisdictional claims in published maps and institutional affiliations.

