Abstract
As a whole, human sprinting seems to be a completely periodic and symmetrical motion. This view is changed when a person runs with a running-specific prosthesis after a unilateral amputation. The aim of our study is to investigate differences and similarities between unilateral below-knee amputee and non-amputee sprinters—especially with regard to whether asymmetry is a distracting factor for sprint performance. We established three-dimensional rigid multibody models of one unilateral transtibial amputee athlete and for reference purposes of three non-amputee athletes. They consist of 16 bodies (head, ipper, middle and lower trunk, upper and lower arms, hands, thighs, shanks and feet/running specific prosthesis) with 30 or 31 degrees of freedom (DOFs) for the amputee and the non-amputee athletes, respectively. Six DOFs are associated with the floating base, the remaining ones are rotational DOFs. The internal joints are equipped with torque actuators except for the prosthetic ankle joint. To model the spring-like properties of the prosthesis, the actuator is replaced by a linear spring-damper system. We consider a pair of steps which is modeled as a multiphase problem with each step consisting of a flight, touchdown and single-leg contact phase. Each phase is described by its own set of differential equations. By combining motion capture recordings with a least squares optimal control problem formulation including constraints, we reconstructed the dynamics of one sprinting trial for each athlete. The results show that even the non-amputee athletes showed less symmetrical sprinting than expected when examined on an individual level. Nevertheless, the asymmetry is much more pronounced in the amputee athlete. The amputee athlete applies larger torques in the arm and trunk joints to compensate the asymmetry and experiences a destabilizing influence of the trunk movement. Hence, the inter-limb asymmetry of the amputee has a significant effect on the control of the sprint movement and the maintenance of an upright body position.
Keywords:
asymmetry; sprinting; prostheses; dynamic modeling; motion capture; optimal control; running; amputee 1. Introduction
For humans, running is a very natural movement: Even the first human beings had to use the strength of their legs to flee from dangerous animals, and already in ancient times people competed in races. It is, therefore, reasonable to assume that humans have optimized their running style over time, both for endurance running and for short sprints. Although there are comprehensive training recommendations for sprinters, the underlying criteria for optimal sprint performance are not precisely known. It is not clear which combination of optimization criteria is minimized or maximized in (elite) sprinting. A sprinter in a competition tries to run as fast as possible without caring about fatigue and energy expenditure, thus maximizing his (average) velocity. In sports biomechanics, sprint velocity is commonly defined as the product of step length and step frequency [1,2]. Weyand and colleagues [3] investigated treadmill running at individual top speed of the subjects to find biomechanical differences between slower and faster runners. From their observations they concluded that faster running velocities are achieved by applying high ground reaction forces during relatively short contact times. Willwacher et al. [4] studied free moment application in sprinting and found that the amplitudes of free moment application are significantly higher in sprinting than in endurance running. For the acceleration phase of sprinting, Kugler and Janshen [5] highlight the importance of proper angular momentum control.
A common assumption for sprinters is that they take symmetrical steps, as their body build is also broadly symmetric. In this sense, optimization criteria should be symmetric, i.e., identical for right and left body sides. However, if a person is missing part of a leg, e.g., due to an amputation, the situation is different. Due to the special running-specific prosthesis that the athlete has to use for sprinting, the geometry, mass and mass distribution of the two legs differ significantly. Brüggemann and colleagues [6] have found that even for athletes who have been amputated on both sides, which in turn is actually a symmetrical system again, amputees have a completely different movement pattern than non-amputee sprinters. This is caused by differences in ankle moments, joint energy changes and mass distribution. A study by Weyand et al. [7] shows that although these differences exist, the physiology of sprinting is the same despite the mechanical discrepancies. For unilateral amputee athletes, the question arises yet more clearly whether the physical asymmetry is more of a hindrance or a benefit. At first glance, such an asymmetry certainly appears disadvantageous. Hobara and colleagues [8] investigated unilateral amputee athletes and found significant differences in the regulation of leg stiffness between the biological and the prosthetic side. Again considering the aim of a sprinter to maximize his velocity, Hobara and co-workers [2] studied both non-amputee and amputee athletes. They reported differences in sprint performance caused by shorter step lengths of the amputee compared to the non-amputee athletes. Weyand and Bundle [9] explain that double transtibial amputee athletes can reach higher step frequencies due to the light prostheses which reduce leg mass in comparison to non-amputee athletes. Apart from the fact that the prostheses are lighter than the biological leg, they are made of carbon fiber and therefore have similar properties to a mechanical spring which might be an advantage.
As only a few world-level amputee athletes exist, it is difficult to draw general conclusions from measurements. At this point, computer simulation of whole-body sprinting movements might be helpful. In this study, we analyze the three-dimensional biomechanics of one amputee and three non-amputee athletes with a special emphasis on symmetry and asymmetry. The unilateral transtibial amputee athlete is a highly asymmetric system compared to a non-amputee athlete as for example can also be directly seen in the models in Figure 1. The analysis is based on the reconstructed dynamic solutions of a least squares optimal control problem. In contrast to the inverse dynamics approach which is commonly used for the analysis of motion capture data, the least squares optimal control problem formulation allows for a dynamics reconstruction with zero residual forces based on purely kinematic data (i.e., without force plate measurements). The approach has been successfully used before, e.g., for reconstruction of walking gait dynamics [10], studies on muscle characteristics in walking and running [11,12] and a previous study on two-dimensional amputee and non-amputee sprinting [13]. In contrast to this previous study [13] on running in the sagittal plane, we consider here also asymmetries in sideward motions, rotations in the frontal plane and around the longitudinal axis as well as cross-effects. Furthermore, we analyze the individual segments’ contribution to the angular momentum in detail.
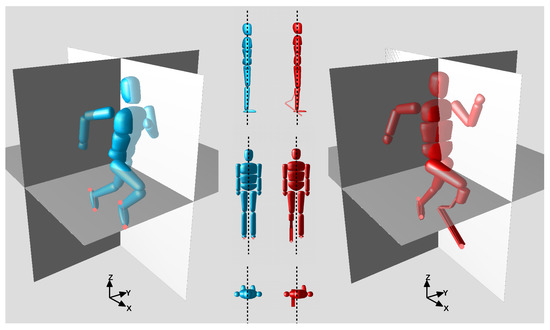
Figure 1.
The unilateral amputee athlete is a highly asymmetric system due to the prosthetic device.
2. Materials and Methods
The present study uses subject-specific 3D models and an optimal control problem formulation to reconstruct the full 3D dynamics of kinematic reference data for three non-amputee and one unilateral transtibial amputee athlete.
2.1. Modeling of Sprinting Motions with and without Running-Specific Prostheses
2.1.1. Three-Dimensional Subject-Specific Modeling of Unilateral Transtibial Amputee and Non-Amputee Athletes
We established subject-specific three-dimensional rigid multi-body system models for one unilateral transtibial amputee athlete and three non-amputee athletes. For each of them, the de Leva data [14] were extrapolated to the measured height and mass of the athletes (as given in Figure 2). A detailed model of the prosthetic device was created based on measurements taken during the motion capture recordings.
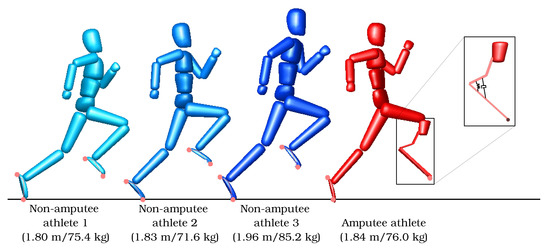
Figure 2.
Visualization of the subject-specific models of three non-amputee and one amputee athlete and the running-specific prosthesis.
The three-dimensional models of the non-amputee athletes consist of 14 segments (head, upper and middle trunk, pelvis, upper and lower arms, thighs, shanks, feet) with a total of 31 degrees of freedom (DOFs). Six DOFs are associated with the overall motion of the model in space where the pelvis is chosen as base segment describing the free motion of the person in space. The remaining 25 DOFs are internal rotations of the joints. Each internal joint can have one, two or three DOFs; the DOFs per joint are given in Table 1. The action of all muscles at a joint is summarized by joint torque actuators, hence we do not distinguish the contribution of antagonist and agonist muscles.

Table 1.
Degrees of freedom per joint (T: Translation, R: Rotation).
To model the amputee athlete, a model of the running-specific prosthesis is necessary as well. Due to its design, a real prosthetic device shows overall deformation instead of having an ankle joint. As an approximation, the model of the prosthesis is made of two rigid segments with a rotational joint in between. The so-defined ‘ankle joint’ is the most posterior point of the prosthesis which is the point of the prosthesis’ greatest curvature [15]. The model of the prosthetic device is attached to the residual shank using a fixed joint and replaces the below-knee segments of the right leg. A linear spring-damper system acts on the prosthetic ankle joint to simulate the spring-like behavior of the running-specific prosthesis. A running-specific prosthesis has to be a passive device, thus non-actuated; with the notation that q stands for the angle, for the angular velocity and k and d for the spring or damping constant, the passive torque generation in the prosthesis is computed via
The rest position of the spring is denoted by .
2.1.2. Mathematical Description of Sprinting Motions
Sprinting at maximum speed can be described as a series of alternating airborne and single support phases linked by touchdown and lift-off events (see Figure 3). We investigate two full steps, since an assumption of symmetry, as is common in non-amputee sprinters, is not reasonable in the case of the one-sided amputee due to the asymmetry between the biological and prosthetic leg. Each phase is described by a separate set of ordinary differential equations (ODEs) or differential-algebraic equations (DAEs).

Figure 3.
Phase description of sprint motions: Each step consists of an airborne phase, a completely inelastic touchdown and a single-support contact phase. Two full steps are shown in the graphics.
The equation of motion during the airborne phases is given by
where q, , and are the generalized positions, velocities, accelerations and forces, respectively. The latter covers all external forces such as gravity and air friction, but also the torque developed by the muscles or the spring-damper system. The positive definite mass matrix depends on the inertial properties of the subject-specific models and the vector accounts for non-linear effects (e.g., centrifugal, gyroscopic, Coriolis forces).
Sprinting at high velocities is characterized by the fact that only the forefoot is in contact with the ground during the single support phases. We model this behavior by a rigid and non-sliding point contact. Distinct contact points are defined at the hallux of each foot and the tip of the running-specific prosthesis for all models. This non-sliding contact constraint reduces the number of DOFs of the system by two during each of the two contact phases. As it is more convenient for the computations, we keep the same number of coordinates, but insert holonomic scleronomic constraints into the set of equations with m being the number of constraints.
As already mentioned, the flight and contact phases are linked by touchdown and lift-off events. Each airborne phase is initiated by the lift-off event of the respective hallux contact point which takes place as soon as the vertical ground reaction force vanishes, i.e.,
Here, ‘LH’ and ‘RH’ denote the left and right hallux points, respectively, and ‘P’ the contact point at the tip of the running-specific prosthesis. As we arrange phases in the order shown in Figure 3, lift-off occurs at initial time , after the first contact phase and at final time .
In contrast to the lift-off events, the touchdown events are described by their own transition phases with zero phase duration (cf. Figure 3). This is necessary as we model the touchdown to be instantaneous and completely inelastic which can result in discontinuities in the velocities. The generalized velocity after the collision and the contact impulse are computed from the generalized velocity before the collision and the same mass matrix M as above via
The contact Jacobian is computed based on the constraints g. The touchdown event happens when the hallux contact points reaches the ground, i.e., when its z-position becomes zero. By assuming the contact to be instantaneous, we ignore fast timescale effects of the real contact in order to guarantee that the contact point remains in rigid contact with the ground instead of bouncing off again or moving parallel to it. Hence, the touchdown constraints can be formulated as:
Previous research has proven this approximation to be valid in the context of whole-body model running motion prediction [16,17].
During the contact phase, the equations of motions can then be written as an index-3 DAE system:
where is again the contact Jacobian and are the contact forces. If the invariants of the constraints
are fulfilled at the beginning of the contact phase, we can equivalently rewrite the index-3 DAE system (6) as a linear system of the unknowns and :
As this is an index-1 DAE, the contact Hessian appears naturally after differentiating the position constraints. The system can always be solved, if the conditions in are not redundant. To ensure proper unilateral ground contact, we introduce a constraint that the vertical ground reaction force must be positive,
such that the hallux contact point remains rigidly attached to the ground.
We employ the Rigid Body Dynamics Library (RBDL, [18]) to derive the equations of motion for the models.
2.2. Least-Squares Optimal Control Problem for Dynamics Reconstruction
We formulate a multi-phase least squares optimal control problem (OCP) of the form
subject to
to reconstruct the full dynamics of sprinting motions for each subject. This approach which will be explained right below is based only on reference kinematic data without any force plate information. Hence, an identification of all joint torques and the ground reaction forces with zero residual error is possible because proper ground contact is ensured by the underlying dynamics (see Section 2.1.2 for the description of the constraints). The variables x and u denote the vectors of differential state and control variables, respectively. The former is made up of the generalized positions , velocities and joint torques , the latter contains the derivatives of the torques, . The multi-phase OCP consists of six phases in total with phase durations for airborne and contact phases extracted from the kinematically fitted motion by visual analysis. As previously described, the two transition phases to model touchdown are of zero length. We chose the number of nodes for the least squares method per phase with a total of 53 time points. They are distributed to the individual phases as follows: each flight phase consists of 15 nodes, each contact phase of 10 nodes, each transition phase of one node. The last node belongs to the end of the time horizon. In the case of the amputee athlete, one free parameter occurs, namely the spring constant of the prosthetic device.
Equation (10a) is the objective function of the OCP. It consists of two contributing parts: a least squares term and a regularization term. The least squares term minimizes the deviations between the generalized coordinates of the model and the generalized reference coordinates at each time point . We use motion capture data of the three non-amputee athletes and one amputee athlete which was provided by partners at the German Sport University Cologne as reference data. The motion capture data was transferred to the joint angles of our models using the tool Puppeteer [10]. For a detailed description of the experimental setup and the pre-processing, we refer to [13]. As the motion capture data was recorded at a fixed sampling rate, it is interpolated by spines such that it can be assesed at the correct corresponding time points. The diagonal weight matrix is introduced to balance different orders of magnitude in the generalized positions, as a deviation of a few centimeters in the positions might have an different impact on the reconstruction than a deviation of a few rad in the joint angles. The regularization term is introduced to suppress oscillations and guarantee a unique solution. The scaling factor is chosen carefully in order to prevent large contributions of the regularization term to the objective function.
The full multiphase dynamics including contact and phase switching conditions as elaborated in Section 2.1.2 is introduced to the OCP formulation by Equations (10b) and (10c). Further constraints regarding for example proper ground contact as well as touchdown and lift-off events are formulated with the non-linear equality and inequality point constraints (10e) and (10f). Upper and lower bounds on all variables and parameters are inserted via the path constraints in Equation (10d). The limits are generously chosen to allow an exact reconstruction of the recorded motions. Since the spring constant must be positive, the lower limit was set to zero in this case. The software package MUSCOD-II [19,20] was developed at the Interdisciplinary Center for Scientific Computing Heidelberg to solve OCPs. It applies multiple shooting for state parameterization and a direct method for control discretization. An especially tailored sequential quadratic programming method including condensing techniques for the solution of the quadratic subproblems solves the large non-linear problem resulting from the discretization and parameterization.
3. Results and Discussion
Since we have a large number of numerical results, we present them by topic and have combined description and discussion of each result for the sake of clarity. We reconstructed the dynamics of three non-amputee and one amputee recorded sprinting trial using subject-specific three-dimensional rigid multi-body system models with a least squares optimal control problem formulation from purely kinematic data without additional forceplate information. Figure 4 shows the resulting animated sequences. In addition, we show the front, side and top view of the motions for one non-amputee (NA1) and the amputee athlete in Figure 5.
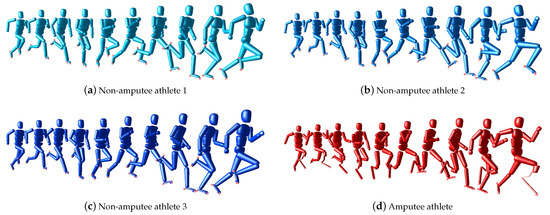
Figure 4.
Animated sequences of the sprint motions of three non-amputee and one amputee athlete. For an animated version of this figure, see the supplementary video.
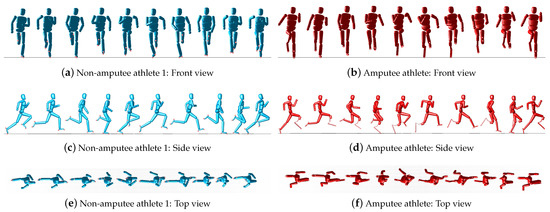
Figure 5.
Animated sequences of the sprint motions of one non-amputee and one amputee athlete from different perspectives to highlight differences in upper body movement. For an animated version of this figure, see the supplementary video.
3.1. Precision of Kinematic Reconstruction
We first evaluate the quality of the reconstructions by computing the root-mean-square error (RMSE) of reconstructed and reference data and comparing torques and forces with (literature) reference values. The RMSE is computed by
with and denoting the reconstructed and reference generalized positions of the degree of freedom (DOF) k. Instead of assessing each DOF individually, we compute the RMSE for translational and rotational DOF groups, denoted by the set of indices . The RMSE is calculated over all multiple shooting nodes and normalized by the number of DOFs and the number of multiple shooting nodes m. The results are:
- cm and for non-amputee athlete 1,
- cm and for non-amputee athlete 2,
- cm and for non-amputee athlete 3,
- cm and for the amputee athlete.
As the RMSEs are smaller than cm for translational and (≈0.6) for rotational DOFs, the solution of the least squares OCP follows the reference movement quite closely. Most of the deviations between the reconstructed and the reference motion are due to small variances in the exact contact point and the rather simple foot model, which approximates the contact by a single contact point. In reality, though, this contact point moves a few centimeters along the forefoot during contact. It should be noted at this point that the computed RMSEs only account for deviations between the reconstructed and reference data, however not for measurement errors and errors in the transfer of the measured marker positions to model joint angles. Especially considering the coordinates’ range of motion, the RMSEs are small enough to accept the quality of the reconstruction.
3.2. Validation of Ground Reaction Forces
To demonstrate that our approach generates reasonable ground reaction forces and joint torques, we compare the reconstructed ground reaction forces with the filtered measurements from force plates (Figure 6).
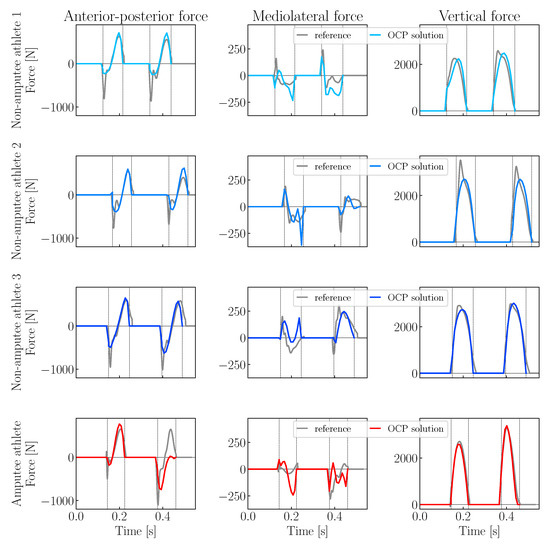
Figure 6.
Reconstructed and measured filtered ground reaction forces of three non-amputee and one amputee athlete (rows from top to bottom: non-amputee athlete 1, non-amputee athlete 2, non-amputee athlete 3, amputee athlete; columns from left to right: anterior-posterior force (TX), mediolateral force (TY), vertical force (TZ))
Figure 6 shows the anterior-posterior (TX), mediolateral (TY) and vertical (TZ) components of both the measured filtered and reconstructed ground reaction forces for all four athletes investigated. Apart from minor deviations, the reconstructed and measured forces fit together well. The anterior-posterior force (TX) is composed of a braking and propulsive component and the time of the zero transition is appropriate, too. For the vertical forces (TZ), the reconstructed and measured data show a parabolic course, in accordance with literature on sprint dynamics [21,22]. However, there are minor deviations in each of the three force components, which we will discuss briefly. In the measured anterior-posterior force (TX), there is a peak at the beginning of the contact which is not reconstructed. In addition, the propulsive component is over- or underestimated, especially during the second contact. This is particularly noticeable in the amputee athlete’s second contact. Apart from the possibility of residual artifacts in the measured data, two causes in particular appear plausible: First, we use a rather simple foot-contact model which is a strong approximation of reality (but as the overall good results show, it is certainly justified). On the other hand, especially for the second observation, it seems probable that the formulation of the optimal control problem allows fulfilling the regularization term of the objective function (10a) more strongly during the second contact phase. Here it would be interesting to analyze a longer step sequence. Regarding the mediolateral ground reaction forces (TY), it is noticeable that the reconstructed forces follow the measured ones rather roughly. We attribute this to the simplified foot model, since even small displacements of the contact point in mediolateral direction have a large influence. Finally, we consider the vertical force (TZ): Here, the reconstructed forces are very good, only for the non-amputee athlete 2 is the rapid increase in the measured data at the beginning of the contact phase not present.
3.3. Validation and Analysis of Joint Torques
As a third and final validation step, we compare the reconstructed joint torques with literature values for non-amputee [23,24,25] and double transtibial sprinting [6]. To our knowledge, no joint torques for unilateral amputee sprinting have been published yet. Figure 7 shows the mean and standard deviation of the joint torques of the non-amputee athletes (blue solid line and shaded regions) as well as the joint torque curves of the amputee athlete (red lines where dashed red lines show the curves of the unaffected side joints if applicable). Intuitively, one would expect that non-amputee athletes would run symmetrically, i.e., that the movements of joints that are present twice would show similar curves, if one takes into account the phase shift and possible sign changes between the sides. Accordingly, and because it is not clear why the right side of the amputee athlete should be compared with the right side of the non-amputee athlete, we consider for the non-amputee athletes the mean values of both steps of the three sprinters. In the subsequent section, we will examine in more detail how symmetrically the non-amputee athletes actually run.
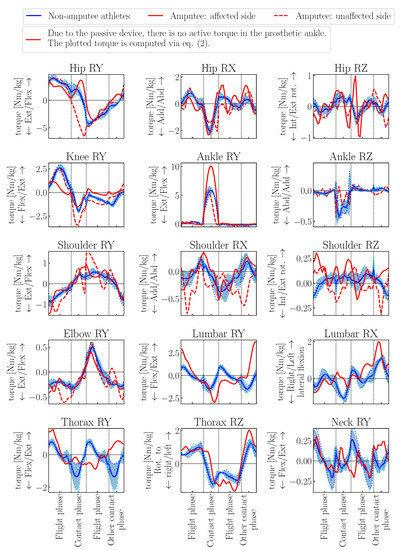
Figure 7.
Comparison of joint torques for non-amputee and amputee springting. Joint torques are normalized by individual body mass, phase durations are scaled per phase. For the non-amputee athletes, the mean values over both steps of all three athletes are shown together with the regions of standard deviation.
As described in detail in Section 2, we approximate the action of all muscles at a related joint (i.e., antagonist and agonist muscles) by net torque actuators. All four mentioned publications report sagittal plane moments for (part of) the leg joints based on measurements and standard inverse dynamics techniques. For the sagittal plane hip joint torques during the stance phase, the trend from external flexion to external extension torques is consistent between the reconstructed and the literature data. The orders of magnitude match, too. However, Bezodis and colleagues [23] found a peak at the beginning of the contact phase which our non-amputee models do not generate. In accordance with [24], they computed maximal extension and flexion torques of N −1 for the knee joints which corresponds to the reconstructed values of 1 N −1 for the maximal extension and 3 N −1 for the maximal flexion torques. For the ankle torques, too, the both the course and the magnitude of the reconstructed torques fit well with the literature values with a peak external flexion torque of circa 5 N −1. Transversal and frontal moments for knee and ankle joints are reported by Stafilidis and Arampatzis [24]. However, our models have only the RZ-DOF in the ankle which corresponds with the reported data. As the additional torques are rather small, the simplifications introduced in our models by diminishing the number of DOFs seems justifiable. The torques given by Schache and colleagues [25] correspond well during the stance phase. In addition, they show torques during the swing phase of sprinting at () /−1 which fit the reconstructed torques.
Brüggemann and co-workers [6] investigated double transtibial amputee sprinting. While the order of magnitude of the reported hip moments match the ones from our reconstruction of a unilateral transtibial amputee sprinter, there are significant differences in the curves. They probably stem from differences between one-sided and double amputee athletes concerning leg stiffness of the biological versus the prosthetic leg and mass differences between the two. The deviations in the peak flexion torque of the prosthetic ankle might be partly due to the same reason. In addition, they are probably a result of the different prosthesis models – they differ both in reality and in the computer model.
As already mentioned, we examined the results of the reconstruction in the sagittal plane (2D), among others also the joint torques, in a previous publication [13]. In the present study, we focus on a comprehensive analysis of the (a)symmetry between steps and the angular momentum about the center of mass (CoM). Nevertheless, we will now briefly review the reconstructed joint torques and discuss especially those in the frontal and transversal planes: Without looking more closely at any of the subdiagrams, clear differences between the non-amputee and amputee athletes are apparent from the very first look. In addition, even when comparing the two sides of the amputee’s body (solid line: body side of the amputated leg, dashed line: side of the biological leg), differences can be seen directly. In the sagittal plane, the active joint torques in the affected leg are significantly lower, except for the hip joint during the contact phase. The latter remains completely within the flexion region during the contact phase, while a transition from flexion to extension torque can be seen in non-amputee athletes. Presumably, the low knee flexion moment in the sagittal plane and the strong hip rotation in the transversal plane are compensated here. Especially in the hip rotation moments of the frontal and transversal planes, the influence of the different geometry between affected and non-affected leg is clearly visible. On the one hand, the reduced torque in the knee joint of the affected leg could indicate that this joint is likewise affected by the amputation. On the other hand, there are indicators that the conscious stiffening of the knee joint could be a strategy to make optimal use of the prosthesis [26,27]. At first glance, it seems appropriate in this context that the passive torque generated in the prosthetic ankle is almost twice as high as in the biological ankle. However, a closer look reveals it as an artefact of the geometry of the prosthetic device as the large joint torque is generated at the very posterior prosthetic ankle joint and the ground reaction forces are of comparable magnitude for both non-amputee and amputee athletes. In the sagittal plane, the torques in the biological leg of the amputee athlete are on average greater than those of the non-amputee athletes, especially in the knee joint during ground contact. To run at a comparable speed to that of the non-amputee athletes, the amputee must therefore generate significantly more torque with the non-amputee leg. The progression of the hip torque during the contact phase is also interesting, since the torque is in the extension range during the entire phase. In the frontal and sagittal plane, the torques of the biological leg are also higher on average than those of the non-amputee athletes. In addition, they fluctuate more, which indicates that more permanent readjustment is necessary to achieve a stable sprint movement. The observation of the arm torques shows that especially the arm that is on the opposite side to the prosthetic leg has significantly higher torques in all planes. The amputee must therefore use this arm more to compensate for the inter-limb asymmetry. However, the amputee’s other arm also has slightly greater torque compared to the non-amputee’s arm. This also applies to the spinal joints: the torques are significantly higher on average than in the non-amputee control group.
To be able to make another quantitative statement, we calculated the average of the absolute joint torques for each joint and normalized them with respect to the individual body mass M and covered distance D by:
The total duration of the motion is individual for each athlete. The computed values are given in Table 2.

Table 2.
Average over absolute joint torques per joint normalized by covered distance. For joints that appear on both sides of the body, we give the average over both sides in the case of the non-amputee athletes and the individual values in the case of the amputee athlete. All numbers are given in N −1.
In addition to the values for the amputee athlete and the mean of the non-amputee athletes, we focus on the values for the non-amputee athlete 1 for the comparison of amputee and non-amputee sprinting since the average velocities of the non-amputee athlete 1 and the amputee athlete are of comparable order. The non-amputee athletes 2 and 3 run −1 and −1 slower on average, respectively (see Table 3). However, the effects due to the different velocities are already reflected to some extent by the normalization with respect to total time and covered distance. We first compare the amputee athlete with the mean value of the non-amputee athletes: it is immediately noticeable that the sum over all joints for the amputee athlete is smaller than for the non-amputee athletes (98.8%), but still quite clearly within the standard deviation. Furthermore, it is noticeable that the values in some joints are lower than those of the non-amputee athletes: in the affected leg (hip: 90.3%, knee: 41.7% compared with the mean of the non-amputee athletes), in the biological ankle (76.0%), and in the right elbow (94.6%). However, except for the affected knee, all values are within the standard deviation regions. In all other joints (except the neck, where the values are practically the same), the values are significantly larger and also lie at the margin (right shoulder) or significantly above the standard deviation regions (unaffected hip, unaffected knee, left shoulder, left elbow, lumbar, thorax). The deviations from the mean ranged from 13.3% to 53.3%. Compared to the mean value of the non-amputee athletes, it is therefore clear that the amputee athlete must apply significantly greater torques in the majority of the joints, which also increases the risk of fatigue and injury in these joints. If we now draw the comparison only to the non-amputee athlete 1, who runs at a comparable speed, the result becomes a little less clear, but remains broadly the same: In the same joints as before, the torque values of the amputee athlete are lower than those of the non-amputee athlete 1 (affected hip: 80.3%, affected knee: 35.7%, biological ankle: 70.4%, right elbow: 88.1% compared to the non-amputee athlete 1). In the joints where the values for the amputee were greater in the previous comparison, the deviations are a little less significant, ranging between 3.7% and 35.3%. Considering the sum over all joints, the value of the amputee athlete is 89.7%. Nevertheless, it is also clear that this comparatively smaller value results in particular from lower torques in the affected leg. Due to the asymmetry of the amputee athlete, there is a clear imbalance in the load on the individual joints, which particularly affects the back and arms. Overall, it can be seen that the amputee must use his upper body more and in some joints in a completely different way to compensate for the asymmetry caused by the prosthesis.

Table 3.
Average velocities of non-amputee athletes.
3.4. Symmetry Analysis of 3D Kinematics and Dynamics
The diagrams of Figure 7 show the mean values over both steps in the case of the non-amputee athletes. This is reasonable due to the fact that it is not a priori evident why the we should compare the right/left side of the amputee athlete with the corresponding side of the non-amputee athletes, without further knowledge of which is the “stronger side”. Nevertheless, there are some suggestions that a certain asymmetry is also present in non-amputee elite sprinters and might be beneficial for performance. We therefore now take a closer look at the (a)symmetry in the generalized positions and joint torques of both the non-amputee and unilateral transtibial amputee athletes. Figure 8 and Figure 9 show the absolute symmetry values between the two steps with values closer to zero indicating that the two steps are more symmetric. These differences are computed by subtraction of the second step from the first with respecting the necessary phase shifts in leg and arm joints. Hence, their time horizon is only one step consisting of one airborne and one contact phase. In all diagrams (of Figure 8 and all following figures), the red solid lines represent the data of the amputee athlete. The blue solid lines show the mean curves of the non-amputee athletes with shaded regions indicating the standard deviations. In addition, we show the individual curves of the three non-amputee athletes by dashed lines in shades of blue. All phase durations are scaled to allow a better comparison of the curves at the same relative time points in phases. Individual phase durations are given in Table 4. The joint torques are normalized by the individual body masses. As the prosthetic device has to be passive, no active torque produced by a torque actuator is present. For the diagrams, we computed the torque generated by the prosthesis via Equation (1). Passively generated torques are drawn as green solid lines. We refer to the most posterior point of the prosthesis when using the term ‘prosthetic ankle’. At this point, we would like to refer in addition to Figure 5, which shows the animated sequences of the movements, from which many of the observations described below can also be graphically understood.
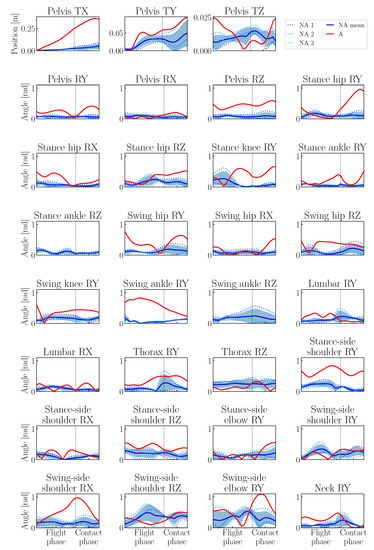
Figure 8.
Amount of asymmetry in generalized positions of the amputee athlete (red solid line, ‘A’), the mean and standard deviation regions of the non-amputee athletes (blue solid line and region, ‘NA mean’ and the three individual non-amputee athletes (blue dotted lines, ‘NA 1’, ‘NA 2’ and ‘NA 3’). The symmetry values have been computed by subtracting the second step from the first step at respective time points in phases taking into account the phase shifts between left and right steps. Phase durations are scaled for better comparability. We show the absolute symmetry values and a value of 0 would indicate that the motions are perfectly symmetric.
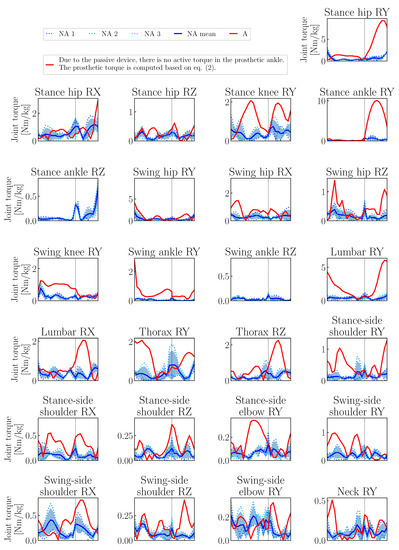
Figure 9.
Amount of asymmetry in joint torques of the amputee athlete (red solid line, ‘A’), the mean and standard deviation regions of the non-amputee athletes (blue solid line and region, ‘NA mean’ and the three individual non-amputee athletes (blue dotted lines, ‘NA 1’, ‘NA 2’ and ‘NA 3’). The symmetry values have been computed by subtracting the second step from the first step at respective time points in phases taking into account the phase shifts between left and right steps. We show the absolute symmetry values and a value of 0 would indicate that the motions are perfectly symmetric. Phase durations are scaled for better comparability and joint torques are normalized by body mass. The joint torques for the ankle joint rotations in the sagittal plane have been computed with the passively generated torque in the prosthetic device, computed based on Equation (1).

Table 4.
Phase durations of the amputee athlete and the non-amputee athletes. Phases are numbered as ordered in Figure 3: 1—first flight phase, 2—right contact phase (affected leg), 3—second flight phase, 4—left contact phase (unaffected leg).
Considering both figures together, we immediately notice that the values for the amputee athlete are much larger on average than those of the non-amputee athletes (for both the mean and the individual curves). Hence, non-amputee sprinting is much more symmetric than unilateral transtibial amputee sprinting. This meets our expectations as the body of the amputee athlete is highly asymmetric, while those of the non-amputee athletes are a lot more symmetric. Hence, our above symmetry assumption for the comparison of the joint torques seems justified.
We start the analysis with a description and discussion of the absolute asymmetries in the generalized positions (i.e., overall position in space and joint angles). On average, the differences between the two steps for the translational DOFs are about three and a half times greater in the amputee athlete than in the non-amputee control group. The significantly large difference in the distance travelled in the forward direction plays a particularly important role here: during the second step (following the prosthetic contact phase) the amputee’s center of mass moves about 30 cm further than during the first step. This step takes also about 8 ms longer (see Table 4). Interestingly, the difference in the step lengths of these two steps is only about 15 cm. It follows that the amputee positions his pelvis significantly differently with respect to the contact point during the two contact phases. For the rotational DOFs, the differences between the two steps are more than twice as great when the amputee is compared with the control group. As expected, the greatest differences are found here in the leg joints and individual joints of the arms. In particular, hip movement in the sagittal plane and knee movement during contact are very asymmetrical. In the arm joints, the asymmetry is particularly evident on the side of the body opposite the amputation (‘swing-side’). It appears that the amputee attempts to compensate for the weight asymmetry of his or her legs with the arm movements.
Another interesting fact is that the asymmetry between the two steps in the amputee case is significantly greater for almost all joints than in the non-amputee athletes; on average almost three times greater for all joints.Here it is particularly clear that the amputee has a completely different actuation strategy firstly for both legs, but also between the steps in which the prosthesis and the biological foot are in contact with the ground. The question arises whether such an actuation strategy, which has to generate very different torques, is disadvantageous overall or in relation to individual joints, e.g., in terms of increased abrasion or fatigue and the associated increased risk of injury.
Although we are particularly interested in the differences in sprinting behavior of the amputee compared to the average of non-amputee athletes, we would like to briefly discuss the aspect of asymmetry in non-amputee sprinting. In both figures we also drew the symmetry values for the individual athletes (dashed lines). It is noticeable that even the non-amputee athletes do not run perfectly symmetrically. Averaged over all diagrams, the non-amputee athlete 3 runs most symmetrically and the non-amputee athlete 2 runs most asymmetrically. Interestingly, the non-amputee athlete 1 is exactly in between in terms of symmetry, although his average speed shows the greatest difference between the two steps (see Table 3). Interestingly, the athlete which runs most asymmetrically is at the same time the athlete with the lowest average velocity, the shortest contact phase durations and the biggest peak vertical ground reaction forces in this study. Hence, it seems that smaller asymmetries such as in non-amputee athletes 1 and 3 might have little influence on or even be beneficial for sprint performance. However, more pronounced asymmetries (non-amputee athlete) might hinder sprint performance.
3.5. (Symmetry) Analysis of Angular Momentum Around Center of Mass in all Three Planes
Figure 10, Figure 11 and Figure 12 show the angular momenta for the sagittal, frontal and transversal planes, respectively. The values are normalized by body mass and body height squared. The diagrams distinguish the contribution of the legs, arms and torso segment to the total angular momentum. At first sight, clear differences in the angular momentum curves between the amputee and the non-amputee athletes are visible. To begin with, we take a look at the total angular momentum of the non-amputee athlete: They follow similar curves as those observed by Hinrichs[28], though absolute numbers vary because of differences in running velocity. Arms and trunk move around an angular momentum of zero. However, the angular momentum of the two legs is in opposite directions, with the contact leg always having a greater angular momentum. Accordingly, the total angular momentum does not move around zero. The reason for this is the circular motion of the legs, especially the feet (see Hinrichs [28]). A comparison with the curves of the amputated athlete now shows a similar curve for the biological leg, which consequently follows a comparable circular motion. In contrast, the angular momentum of the prosthetic leg during the contact phase is significantly lower and the curve deviates. We suspect the cause to be the asymmetry of the legs, which is especially caused by the lighter prosthesis. Similar observations can be made for the leg angular momenta in the frontal and transversal planes: For the biological leg, the curves of the amputee athlete are comparable to those of the non-amputee reference group, whereas the curves for the leg affected by the amputation differ more. For rotations around the forward axis (RX), the curve of the affected leg’s angular momentum changes more frequently indicating that the amputee athlete has to adjust this leg several times during the motion. For rotations around the vertical axis (RZ), the prosthetic leg rotates clearly stronger than the biological legs which is probably due to the fact that the prosthetic device is a fixed device which has only one rotational DOF, i.e., the one around the frontal axis.
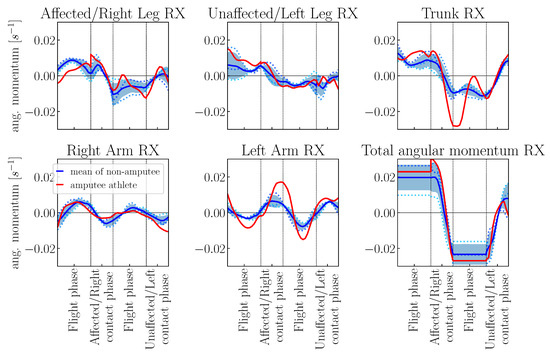
Figure 10.
Angular momentum about CoM of the amputee athlete and the non-amputee reference group in the frontal plane (rotations around x-axis). Phase durations are scaled and angular momentum values are normalized by body mass and body height squared.
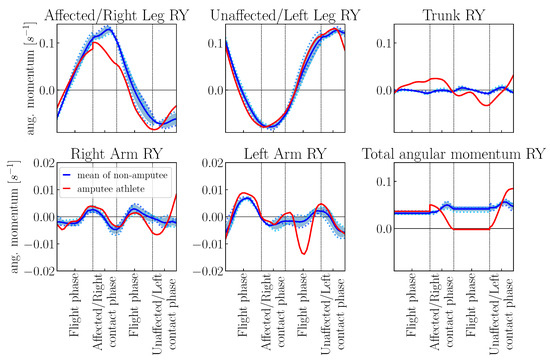
Figure 11.
Angular momentum about CoM of the amputee athlete and the non-amputee reference group in the sagittal plane (rotations around y-axis). Phase durations are scaled and angular momentum values are normalized by body mass and body height squared. Please note the different y-axis scales for the contribution of the arms.
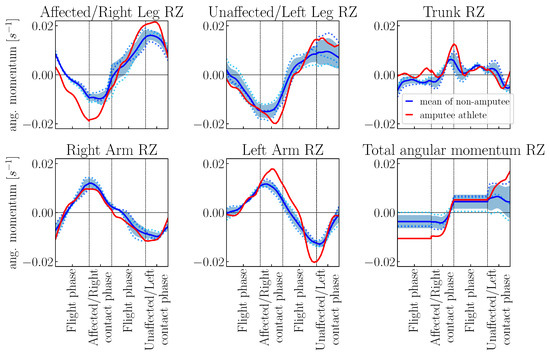
Figure 12.
Angular momentum about CoM of the amputee athlete and the non-amputee reference group in the transversal plane (rotations around z-axis). Phase durations are scaled and angular momentum values are normalized by body mass and body height squared.
Coming back to the sagittal plane angular momentum, the differences in the total angular momentum of the amputee athlete versus the control group of non-amputees cannot be completely explained by differences in the leg movement. Overall, the angular momentum of the arm segments is comparable between amputee and non-amputee athletes; there are small differences in the left arm angular momentum during the flight phase following contact with the prosthetic leg. Interestingly, in the frontal and transversal plane, too, is mainly the left arm (i.e., the arm on the opposite body side to the one where the amputation has been) angular momentum that has a different course in comparison to the non-amputee reference group. The left arm angular momentum values are significantly larger, especially during the contact phase with the prosthetic leg and the subsequent flight phase. This indicates that the amputee athlete has to make great use of his left arm for compensation of the weight asymmetry in the legs. The angular momenta of the trunk (spinal) segments are larger in the frontal and sagittal planes as well, in the frontal plane again especially at the end of the prosthetic contact and the subsequent flight phase. Hence, the spinal segments as well account for balancing the lift-off of the relatively light prosthetic leg.
Considering the total angular momenta, we notice that they are larger for the amputee than for the non-amputee reference group in the frontal and transversal planes, i.e., the planes which are generally considered less interesting in linear sprint motions. Interestingly, the total angular momentum of the amputee is relatively symmetrically distributed around the zero line. The rotations in these two planes are therefore overall very symmetrical for the two steps, but show clear asymmetries when the individual components are considered. In the sagittal plane, the total angular momentum is comparable during the first flight phase which is the airborne phase following contact with the biological leg. During the flight phase following prosthetic contact, the angular momentum of the amputee athlete is close to zero, indicating very little rotation around the frontal axis.
In summary, the amputee’s angular momentum values, particularly in the frontal and lateral planes, are on average significantly higher than those of the non-amputee athlete. Regarding the legs, the inter-limb asymmetry mainly affects the rotations in the sagittal plane. However, the amputee athlete generates completely different angular momenta in his arms and spine to achieve stability despite the present asymmetries.
4. Conclusions & Future Work
We reconstructed the three-dimensional dynamics of one unilateral transtibial amputee athlete and for reference purposes of three non-amputee athletes based on subject-specific models and a least squares optimal control problem formulation. In comparison to a previous study [13], which focused on the analysis of dynamics in the sagittal plane, it was shown that the consideration of the three-dimensional movement provides valuable new insights, especially regarding the angular momentum and the joints of the upper body (shoulders, lumbar and thorax).
We found asymmetries in all athletes’ motions, whether in amputee or the non-amputee athletes. However, these asymmetries are of varying intensity: the unilateral amputee athlete is significantly more asymmetric than the non-amputee athletes. The inter-limb asymmetry of the amputee athlete is clearly reflected in the joint angles, joint torques and angular momenta. We observed significant differences in the actuation pattern of the unilateral transtibial amputee athlete: the strategies to achieve stability and comparable sprint velocities to the non-amputee athletes are largely different. In fact, the larger ground reaction forces are not generated with the prosthetic leg, but with the biological leg. The compensation for the inter-limb asymmetry is mainly done using the arms and trunk segments. Our analysis shows that the amputee athlete actually produces larger joint torques in these segments compared to the non-amputee athletes. Large torques also increase the risk of injury, abrasion and strain in the respective joint. Furthermore, the contributions of the trunk to the total angular momentum were remarkably larger in the case of the amputee athlete, especially in the frontal and sagittal planes. These strong back and forth as well as lateral motions are a clearly destabilizing influence on the overall motion. It seems plausible that the observed asymmetries in the motion and the destabilizing angular momentum disrupt the sprint motion. This is supported, for example, by the clear differences between the average velocities of the two steps. In contrast to small oscillations of acceleration and deceleration in each step for non-amputee athletes, the amputee athlete is in addition constantly undergoing more pronounced acceleration and deceleration due to the huge velocity differences between left and right steps. At this point, the difference to earlier studies, which found that bilateral amputee athletes might have an advantage for uniform sprinting at constant speed compared to non-amputee athletes, can be clearly seen: While bilateral amputee athletes are again a symmetrical system and can therefore also use their prostheses consistently, unilateral amputee athletes must adapt their behavior in each step to the conditions of the current contact leg. In addition and in further contrast to bilateral amputee athletes, unilateral amputee athletes cannot choose the length of their prosthesis as it has to match the length of the biological leg.
Finally, it should be noted that a sprint race does not only consist of the maximum speed phase. Previous studies on sprint start of unilateral amputee athletes [29,30] suggest that prostheses limit power transfer to the starting block and sprint start performance. The additional complexity of accelerating at the beginning of a sprint race is for both unilateral and bilateral amputee athletes challenging. Together with the results presented here, especially the pronounced asymmetry, there are several hints that unilateral amputee athletes do not have an advantage due to their running-specific prosthesis over non-amputee athletes in sprint races. However, the study of more amputee and non-amputee athletes would be necessary to make more reliable claims. Furthermore, it should be investigated how the different simplifications of our models, e.g., the rather simple foot contact model, the model of the running-specific prosthesis or the approximation of the work of all muscles at a specific joint by a joint torque actuator influence the motions and results. Finally, it might be interesting to apply the approach of optimization-based dynamics reconstruction to conduct studies including athletes of different age, gender, weight, and physical fitness.
Supplementary Materials
The following are available online at https://www.mdpi.com/article/10.3390/sym13040580/s1, the video of animated sequences of the sprint motions of three non-amputee and one amputee athlete.
Author Contributions
Conceptualization, A.L.E. and K.M.; computations, A.L.E.; validation, A.L.E. and K.M.; formal analysis, A.L.E. and K.M.; writing—original draft preparation, A.L.E.; writing—review and editing, K.M.; visualization, A.L.E.; supervision, K.M. All authors have read and agreed to the published version of the manuscript.
Funding
This research received no external funding.
Institutional Review Board Statement
Not applicable.
Informed Consent Statement
Not applicable.
Data Availability Statement
Not applicable.
Acknowledgments
We want to thank the Simulation and Optimization research group of the IWR at Heidelberg University for giving us the possibility to work with MUSCOD-II. Furthermore we thank Wolfgang Potthast and Johannes Funken from the Institute of Biomechanics and Orthopaedics at the German Sport University Cologne for the motion capture data.
Conflicts of Interest
The authors declare no conflict of interest.
References
- Mann, R.V. A kinetic analysis of sprinting. Med. Sci. Sport. Exerc. 1981, 13, 325–328. [Google Scholar] [CrossRef]
- Hobara, H.; Kobayashi, Y.; Mochimaru, M. Spatiotemporal Variables of Able-bodied and Amputee Sprint in Men’s 100-m Sprint. Int. J. Sport. Med. 2015, 36, 494–497. [Google Scholar] [CrossRef] [PubMed]
- Weyand, P.G.; Sternlight, D.B.; Bellizzi, M.J.; Wright, S. Faster top running speeds are achieved with greater ground forces not more rapid leg movements. J. Appl. Physiol. Respir. Environ. Exerc. Physiol. 2000, 89, 1991–1999. [Google Scholar] [CrossRef]
- Willwacher, S.; Funken, J.; Heinrich, K.; Alt, T.; Müller, R.; Potthast, W. Free moment application by athletes with and without amputations in linear and curved sprinting. In Proceedings of the 35th International Conference on Biomechanics in Sports, Cologne, Germany, 14–18 June 2017; Volume 35, pp. 847–850. [Google Scholar]
- Kugler, F.; Janshen, L. Body position determines propulsive forces in accelerated running. J. Biomech. 2010, 43, 343–348. [Google Scholar] [CrossRef] [PubMed]
- Brüggemann, G.P.; Arampatzis, A.; Emrich, F.; Potthast, W. Biomechanics of double transtibial amputee sprinting using dedicated sprinting prostheses. Sport. Technol. 2008, 1, 220–227. [Google Scholar] [CrossRef]
- Weyand, P.G.; Bundle, M.W.; McGowan, C.P.; Grabowski, A.; Brown, M.B.; Kram, R.; Herr, H. The fastest runner on artificial legs: Different limbs, similar function? J. Appl. Physiol. Respir. Environ. Exerc. Physiol. 2009, 107, 903–911. [Google Scholar] [CrossRef]
- Hobara, H.; Baum, B.S.; Kwon, H.J.; Shim, J.K. Running mechanics in amputee runners using running-specific prostheses. Jpn. J. Biomech. Sport. Exerc. 2013, 17, 1–9. [Google Scholar]
- Weyand, P.G.; Bundle, M.W. Point: Artificial limbs do make artificially fast running speeds possible. J. Appl. Physiol. Respir. Environ. Exerc. Physiol. 2010, 108, 1011–1012. [Google Scholar] [CrossRef]
- Felis, M.L.; Mombaur, K.; Berthoz, A. An optimal control approach to reconstruct human gait dynamics from kinematic data. In Proceedings of the IEEE-RAS 15th International Conference on Humanoid Robotics (Humanoids), Seoul, Korea, 3–5 November 2015; pp. 1044–1051. [Google Scholar] [CrossRef]
- Lin, Y.C.; Pandy, M.G. Three-dimensional data-tracking dynamic optimization simulations of human locomotion generated by direct collocation. J. Biomech. 2017, 59, 1–8. [Google Scholar] [CrossRef]
- Miller, R.H.; Umberger, B.R.; Hamill, J.; Caldwell, G.E. Evaluation of the minimum energy hypothesis and other potential optimality criteria for human running. Proc. R. Soc. B Biol. Sci. 2011, 279, 1498–1505. [Google Scholar] [CrossRef] [PubMed]
- Emonds, A.L.; Funken, J.; Potthast, W.; Mombaur, K. Comparison of Sprinting With and Without Running-Specific Prostheses Using Optimal Control Techniques. Robotica 2019, 37, 2176–2194. [Google Scholar] [CrossRef]
- De Leva, P. Adjustments to Zatsiorsky-Seluyanov’s segment inertia parameters. J. Biomech. 1996, 29, 1223–1230. [Google Scholar] [CrossRef]
- Willwacher, S.; Funken, J.; Heinrich, K.; Müller, R.; Hobara, H.; Grabowski, A.M.; Brüggemann, G.P.; Potthast, W. Elite long jumpers with below the knee prostheses approach the board slower, but take-off more effectively than non-amputee athletes. Sci. Rep. 2017, 7, 16058. [Google Scholar] [CrossRef] [PubMed]
- Schultz, G.; Mombaur, K. Modeling and Optimal Control of Human-Like Running. IEEE/ASME Trans. Mechatronics 2010, 15, 783–792. [Google Scholar] [CrossRef]
- Mombaur, K. Modeling, Simulation and Optimization of Complex Processes—HPSC 2012; Chapter A Mathematical Study of Sprinting on Artificial Legs; Springer: Cham, Switzerland, 2014; pp. 157–168. [Google Scholar] [CrossRef]
- Felis, M.L. RBDL: An efficient rigid-body dynamics library using recursive algorithms. Auton. Robot. 2017, 41, 495–511. [Google Scholar] [CrossRef]
- Bock, H.G.; Plitt, K.J. A multiple shooting algorithm for direct solution of optimal control problems. IFAC Proc. Vol. 1984, 17, 1603–1608. [Google Scholar] [CrossRef]
- Leineweber, D.B.; Bauer, I.; Bock, H.G.; Schlöder, J.P. An efficient multiple shooting based reduced SQP strategy for large-scale dynamic process optimization (Parts 1 and 2). Comput. Chem. Eng. 2003, 27, 157–174. [Google Scholar] [CrossRef]
- Clark, K.P.; Ryan, L.J.; Weyand, P.G. A general relationship links gait mechanics and running ground reaction forces. J. Exp. Biol. 2017, 220, 247–258. [Google Scholar] [CrossRef]
- Geyer, H.; Seyfarth, A.; Blickhan, R. Compliant leg behaviour explains basic dynamics of walking and running. Proc. R. Soc. B Biol. Sci. 2006, 273, 2861–2867. [Google Scholar] [CrossRef]
- Bezodis, I.N.; Kerwin, D.G.; Salo, A.I.T. Lower-Limb Mechanics during the Support Phase of Maximum-Velocity Sprint Running. Med. Sci. Sport. Exerc. 2008, 40, 707–715. [Google Scholar] [CrossRef]
- Stafilidis, S.; Arampatzis, A. Track compliance does not affect sprinting performance. J. Sport. Sci. 2007, 25, 1479–1490. [Google Scholar] [CrossRef] [PubMed]
- Schache, A.G.; Blanch, P.D.; Dorn, T.W.; Brown, N.A.T.; Rosemond, D.; Pandy, M.G. Effect of Running Speed on Lower Limb Joint Kinetics. Med. Sci. Sport. Exerc. 2011, 43, 1260–1271. [Google Scholar] [CrossRef] [PubMed]
- Funken, J.; Willwacher, S.; Heinrich, K.; Müller, R.; Hobara, H.; Grabowski, A.M.; Potthast, W. Long jumpers with and without a transtibial amputation have different three-dimensional centre of mass and joint take-off step kinematics. R. Soc. Open Sci. 2019, 6, 190107. [Google Scholar] [CrossRef] [PubMed]
- Funken, J.; Willwacher, S.; Heinrich, K.; Müller, R.; Hobara, H.; Grabowski, A.M.; Potthast, W. Three-Dimensional Takeoff Step Kinetics of Long Jumpers with and without a Transtibial Amputation. Med. Sci. Sport. Exerc. 2019, 51, 716–725. [Google Scholar] [CrossRef] [PubMed]
- Hinrichs, R.N. Upper Extremity Function in Running. II: Angular Momentum Considerations. Int. J. Sport Biomech. 1987, 3, 242–263. [Google Scholar] [CrossRef]
- Willwacher, S.; Herrmann, V.; Heinrich, K.; Funken, J.; Strutzenberger, G.; Goldmann, J.P.; Braunstein, B.; Brazil, A.; Irwin, G.; Potthast, W.; et al. Sprint Start Kinetics of Amputee and Non-Amputee Sprinters. PLoS ONE 2016, 11, e0166219. [Google Scholar] [CrossRef]
- Strutzenberger, G.; Brazil, A.; von Lieres und Wilkau, H.; Davies, J.D.; Funken, J.; Müller, R.; Exell, T.; Willson, C.; Willwacher, S.; Potthast, W.; et al. 1st and 2nd step characteristics proceeding the sprint start in amputee sprinting. In Proceedings of the 34th International Conference on Biomechanics in Sports, Tsukuba, Japan, 18–22 July 2016; Volume 34. [Google Scholar]
Publisher’s Note: MDPI stays neutral with regard to jurisdictional claims in published maps and institutional affiliations. |
© 2021 by the authors. Licensee MDPI, Basel, Switzerland. This article is an open access article distributed under the terms and conditions of the Creative Commons Attribution (CC BY) license (https://creativecommons.org/licenses/by/4.0/).