Article

Application of Wind Tunnel Device for Evaluation of Biokinetic Parameters of Running

1
Faculty of Mechanical Engineering, University of Ljubljana, Askerčeva cesta 6, 1000 Ljubljana, Slovenia
2
Department of Track and Field, University School of Physical Education, Wroclaw, Ul. Paderewskiego 35, 51-612 Wrocław, Poland
3
Faculty of Sport, University of Ljubljana, Gortanova ul. 22, 1000 Ljubljana, Slovenia
*
Author to whom correspondence should be addressed.
Symmetry 2021, 13(3), 505; https://doi.org/10.3390/sym13030505
Submission received: 31 January 2021 / Revised: 8 March 2021 / Accepted: 16 March 2021 / Published: 19 March 2021
(This article belongs to the Special Issue Bioinformatics and Computational Biology)

Abstract

:
The aim of the study was the application of high-tech wind tunnel device to identify the changes in the biokinetic parameters of running performed on the specially designed treadmill. The research was carried out in the “Planica Nordic Centre—PNC” in the wind tunnel system, where the AirRunner Assault treadmill, which was equipped with four sensors measuring the vertical and horizontal ground reaction forces, was installed. To obtain biokinetic data, the runners performed the treadmill’s run under conditions of airflow directed at each participant’s back (backwind speeds +3 m/s and +5 m/s) and the chest (headwind speeds −5 m/s and −7 m/s). The runner’s speed was measured via image analysis using a DSLR camera and markers on the belt of the treadmill. Additionally, a high-speed camera synchronised to the force acquisition system was used to analyse the contact phase via comparison of foot placement and time series of the ground reaction forces. The contact phases of the running step were found to be longer than the flight phases, with their duration ranging from 0.15 to 0.20 s and the maximum forces at take-off were found to be greater than when running with the backwind. It should be noted that the application of high-tech devices wind tunnel and treadmill were found to be sufficiently accurate to perform kinetic measurements of running parameters in changing conditions, such as resistance and assistance (facilitating).

1. Introduction

Running is a key factor of performance in many sports, so it is often the focus of sports science. It is a natural human movement, but it is a complex skill that is defined by many motor and functional abilities as well as neuro-muscular mechanisms. The most rational running training methods, employing the lowest energy consumption, have resulted in performance improvements in the sprint and in middle- and long-distance runs. These methods mainly depend on accessible technologies at a given time. They differ in whether the runs are performed in the scope of assistance training or resistance training methods. Utilising assistance training running methods (running by pulling, running downhill, and sprint accelerators) makes it possible to improve speed, especially the parameter of step frequency [1,2]. Using resistance training methods (dragging sleds, running uphill, running on sand, and parachute running), it is possible to specifically develop running power. Both of the methods increase the running potential of runners and other athletes. The disadvantage of these methods, on the other hand, is the lack of precise experimental technologies for monitoring the effects of training. Therefore, the application of high-tech devices such as treadmill and wind tunnel allow a better understanding of the above-mentioned issues.
Over the years, there has been an increasing interest in the application of the motorized treadmill for walking and running analysis. The evaluation of explosive power output during running on motorized treadmill showed up difficulties in data comparison because of different methodological approaches. Therefore, the correct treadmill should be utilised to improve the quality of the research. In the present study, the problems that are associated with motorized treadmills have been minimized by applying a non-motorized treadmill (NMT) type Assault AirRunner, manufactured by US company Assault Fitness. NMT are participant driven and they allow it a stronger impact on ground locomotion by enabling rapid acceleration and deceleration, gradual variation in gait, and pace changes [3,4,5]. Several recent studies have proved that NMTs to be a practical, valid, and reliable advice for evaluation a range of movement structure, mainly running and walking [6,7]. Additionally, to comprehensively investigate the biomechanics of running in changing wind conditions, the NMT was placed in a wind tunnel. Several wind tunnel testing methods have already been described and provided the essential information [8,9,10], however only a few investigated the aerodynamics as a crucial factor in various aspects of sports [11,12]. Ito [11] experimentally studied drag reduction in the wind tunnel using thre-component load cells and smoke visualization. Furthermore, he performed numerical investigation explaining the aerodynamic phenomena of group formation running where the coefficient of drag was, in some cases, reduced by the factor of 10. In the study by Hirata [12], optimal tandem-running formation was studied and, recently, Tatsuya [13] developed a moving belt system to investigate the air drag effects, where a 10% increase was found in the case of solo running. The use of a wind tunnel is one of the most effective activities aimed at both explaining the flows around runners and assessing the impact of air as resistance or assistance and, therefore, analysing changes in the kinematic parameters of the run, according to Tatsuya [13].
Running efficiency depends on various biomechanical factors of movement [13,14,15], athletes’ physiological characteristics, psychological readiness, equipment, and external conditions [16,17], among which airflow interacting with a runner’s movement is of great importance [18,19]. The significance of each of these factors is different and interconnected. Therefore, in the present investigation, we focused on the kinematics of running in terms of step frequency, stride length over a longer time interval, and the presence of airflows of different intensities and directions. Moreover, the study addresses monitoring of the vertical and horizontal components of the runner’s ground reaction force. The progression of the contact phases is examined by the simultaneous observation of each contact phase’s kinetics of the left and right legs. In doing so, a synchronised high-speed imaging and force measurement is used to analyse the forces that are exerted by the feet on the running surface during the contact phases of the runner’s feet on the treadmill surface.
The approach used in the current study is based on previous wind tunnel running research that was presented by various authors [20,21,22]. Shanebrook and Jaszczak [21] studied the power dissipation with respect to air drag in the wind tunnel and measured the power dissipation of 0.33–0.49 HP at 10 m/s. Furthermore, the drag effects of running behind another athlete was investigated by Kyle [22], who found that running velocity can be improved by 0.1 m/s and energy consumption reduced by 2–4%. Overall, the researchers investigated the effects of airflow on the runner, based on a model, highlighting the impact of airflow on running parameters, including the dynamics in the turbulent marginal layer between the running surface, the runner, and the airflow in the plane above the treadmill. Therefore, the application of high-tech wind tunnel device to identify changes in the biokinetic parameters of running performed on the specially designed AirRunner Assault treadmill, equipped with custom force measurement device, was the main goal of the study.

2. Materials and Methods

2.1. Study Design

In the present study, we examine the biomechanics of running in the wind tunnel at various airflow speeds and directions (headwind vs. backwind in relation to the runner on the treadmill). The experiment is performed when considering homogeneous airflow at selected nominal speeds, achieved using different integral parameters of axial fans embedded in the wind tunnel. The measurement apparatus built upon the AirRunner Assault treadmill is set up in the “Planica Nordic Centre—PNC”. Three trained middle-distance runners were included in this experiment to verify the adequacy of the proposed measurement method. The developed expert system allows for the measurement of longitudinal and vertical reaction forces that formed in the contact phases of running. The running speed was determined using a marker that was mounted onto the treadmill surface. Based on the length of the running belt and the number of camera frames per second, we were able to calculate the athlete’s speed. DSLR camera Nikkon D 3000, manufactured by US company Nikkon was used to record markers on the treadmill belt, with the frequency of 60 Hz, in order to determine the speed of the treadmill. Additionally, step frequency, and especially step length, depends mainly on an athlete’s body height, or the length of the leg and the force developed by the hip extensors.

2.2. Participants

None of the three trained middle-distance runners who participated in the experiment were reported to have an injury to the musculoskeletal system. All of them were informed of the purpose of the study and the measurement procedures involved. All of the participants signed an informed consent form, in accordance with the Helsinki-Tokyo Declaration, stating that their cooperation was voluntary and that they could choose to stop their participation in the study at any time. The Human Ethics Committee of the University of Ljubljana approved the study design (Code:14_2020-1442). The participants understood that taking part in the study was voluntary and that they may terminate their participation at any time. The key characteristics of the participants are summarized in the Table 1.

2.3. The Basic Characteristics of the Wind Tunnel

The research of the impact of airflow on runners was carried out in the wind tunnel of the “Planica Nordic Centre” (PNC). The NCP wind tunnel is a closed-circuit tunnel, where the airflow circulates through the vertical portion of the wind tunnel—the vertical section (1), which is primarily intended for parachute training, as shown in Figure 1. This section is followed by the horizontal portion of the wind tunnel—the horizontal section (2), which is intended to train ski jumpers and alpine skiers. In the latter part of the wind tunnel, studies of running, cycling, and cross-country skiing can also be carried out. Two axial fans with a total power of 2.2 MW (3) are installed in the lower portion of the flow system to generate airflow in the wind tunnel. The volume flow rate is regulated by the frequency regulator on the installed fans. Figure 1A,B show the wind tunnel flow tract with the listed vital segments of the wind tunnel (1–3) that are connected by optimally designed flow channels. The shape of the entire flow tract was designed and selected following computational fluid dynamics (CFD) studies (Figure 1B) that were experimentally verified on a wind tunnel model (Figure 1A), ensuring the geometric and kinematic similarity between the model and the prototype of the wind tunnel at the NCP facility.
Airflow straighteners are installed at the inlet and exit of the horizontal section, providing a homogeneous field of airflow. A diagram of the velocity field of the horizontal section of the wind tunnel is presented on the right side of Figure 2. This parameter was measured to show the velocity profile in the plane in which the runner on the treadmill was moving when the experiment being carried out. The average airflow velocity of the measuring plane during the velocity distribution control measurement was <v> = 10.5 m/s. This value was controlled by the integral measurement value of the wind tunnel v = f(n), which was previously determined for the purposes of regulating the airflow velocity in the vertical section of the wind tunnel, depending on the rotational frequency of the installed axial fans. Table 2 and Table 3 present the functional parameters of the wind tunnel.

2.4. Experimental Procedure

In the horizontal section of the wind tunnel, an Assault AirRunner treadmill (Assault Fitness, Carlsbad, CA, USA) was installed for the purpose of the study. The treadmill was attached to the wind tunnel through consoles for measuring vertical and longitudinal reaction forces, as shown in the Figure 2 and Figure 3. The measuring consoles were fixated using screw joints to measure the Fx longitudinal reaction force, at two supporting points, and four vertical Fy reaction forces at all the supporting points of the treadmill on the wind tunnel’s lower horizontal tunnel platform. The installation allowed for the treadmill to be rotated for 180° around its vertical axis. In this way, measurements of the reaction forces on the measuring consoles were performed with respect to the airflow direction-headwind, as shown on the left of Figure 2, and backwind if the treadmill was rotated for 180°.
The left photo of Figure 2 shows the layout of the treadmill with the runner in the horizontal section of the wind tunnel. On the right side of Figure 2, a diagram of the local velocity at the PCN location, in the horizontal direction of the wind tunnel at the treadmill position, depending on the vertical position y. The velocity was measured using a Schiltknecht MiniAir 20 anemometer (Schiltknecht Messtechnik AG, Gossau/ZH). The flow velocity was measured at 1 m from the treadmill entry in the airflow direction of the meridian plane, which was positioned on the longitudinal axis of the treadmill.
Airflow velocity measurements were performed at integral parameters of the wind tunnel: volume flow V = 110 m3/s with a nominal average velocity calculated from the volume flow <vnom> (m3/s) and the surface of the flow tunnel A = 10.5 m2; <vnom> = V/A. The velocity was measured at 1 m from the entry to the treadmill running belt in the direction of the airflow in the meridian plane, positioned on the treadmill’s longitudinal axis. The measurement uncertainty of the recorded and nominal velocities was within the [ + ]   2% limit. The running speed was determined using a marker that was mounted onto the treadmill surface. Based on the length of the running belt and the number of camera frames per second, we were able to calculate the athlete’s speed. To determine the speed of the treadmill, we used a Nikkon D 3000 camera to record the markers on the treadmill belt, with a frequency of 60 Hz.
Measuring cells or force sensors allows for detection of eccentric loads. Force sensors with load capacity of 60 and 100 kg, and C2/C3 accuracy class, manufactured by XNQ Electric Company (Shenzen/CN) were used. Force sensors with a load capacity of 100 kg were used to detect forces in the horizontal plane, while sensors with a load capacity of 60 kg were used to detect forces in the vertical plane. The horizontal force components were measured at four points. Horizontal sensors were attached to the underside of a metal plate, allowing for better stability. Vertical sensors were installed on the front measuring points and then fixated onto the lower part of the treadmill (Figure 3, right). The rear part of the treadmill was freely mounted in a horizontal direction (Figure 3). The measuring sensors were wired to a data capture system, which was developed at the Faculty of Mechanical Engineering, University of Ljubljana. The system allows for the simultaneous capture of individual load sensors. The force acquisition was performed with sampling frequency of 1200 Hz. To provide a detailed description of force-step interdependence, the mini UX100 high-speed camera, manufactured by Photron (West Wycombe /UK), was utilised to perform visualization synchronous to force measurement. The camera was mounted perpendicularly to the meridian plane of the horizontal wind tunnel, approximately 3 m from the runner on the treadmill and approximately 3 m from the front of the runner to analyse the frontal view of the contact phase. The image capture frequency was 1000 Hz, and the camera was synchronised with a computer system recording the time signals of forces acting on the treadmill sensors, as shown in Figure 4. Force measurements and high-speed camera images were postprocessed using the LabView program, allowing for the synchronisation of the camera with the force data capture system.
Qualitative and quantitative running analyses of the results of the kinematic measurements and the dynamics of the runner on the treadmill, in the presence of stationary aerodynamic characteristics of the airflow-velocity <vnom> in the wind tunnel, are presented below. The basic parameters of the run are first provided in the introductory portion of the analysis. A description of the methodology for evaluating the time course of the horizontal and vertical loads on the treadmill sensors, depending on the time course of the load on the runner’s feet on the surface of the running belt, follows. The results are provided with time series Fvert(t) and Fvert(t), which were obtained as the load sum of the four vertical force sensors and the two horizontal force sensors:
F v e r t = 1 4 F v e r t . i
F h o r i = 1 2 F h o r i . i
Both time series, as calculated by Equations (1) and (2), represent quasi-periodically repetitive loads of the force sensors upon contact (contact between the runner’s left or right foot with the running belt). The analysis assumes that the measured values on the sensors are equal to the force values—the foot load on the surface of the belt.
Figure 4 presents a typical example of the load of a runner on a treadmill. The diagram presents a snapshot from the measured time series, capturing loads of the left (L) and right (R) feet at any selected stride length t 0 D . A detailed description of the course of the forces’ time signals is presented below with the kinesiological results of the runner’s movement on the treadmill. Down below, the equations for calculation of the running parameters are listed:
Vertical reaction impulse Jvert, braking impulse Jdec, and accelerator impulse Jacc:
J v e r t = t 0 t 1 F v e r t   d t
J d e c = t 3 t 2 F h o r   d t
J a c c = t 2 t 4 F h o r   d t
Contact time:
t k ( i ) = t 2 L     ( i )   t 0 L ( i ) + t 2 D ( i ) t o D ( i ) ,   t k D ( i ) = t 2 D ( i ) t o D ( i ) ,   t k L ( i ) = t 2 L ( i ) t o L ( i )
Time-averaged contact time:
t k = i t k , i / N
Running frequency:
f ( i ) =   1 ( t 0 D i + 1 ) ( t 0 D i ) 1 ( t 0 L i + 1 ) ( t 0 L i )
Time-averaged frequency:
f i = 1 / N i f i
Stride length
L i = i = 1 N v i t 2 D , i t o L , i N
Time-averaged stride length:
L i = 1 / N i = 1 N L i
These equations allow for the analysis of running on the integral and differential scales, as determined by the frequency of force measurement by the experimental system at specific time intervals of running, which were determined by the study protocol

3. Results

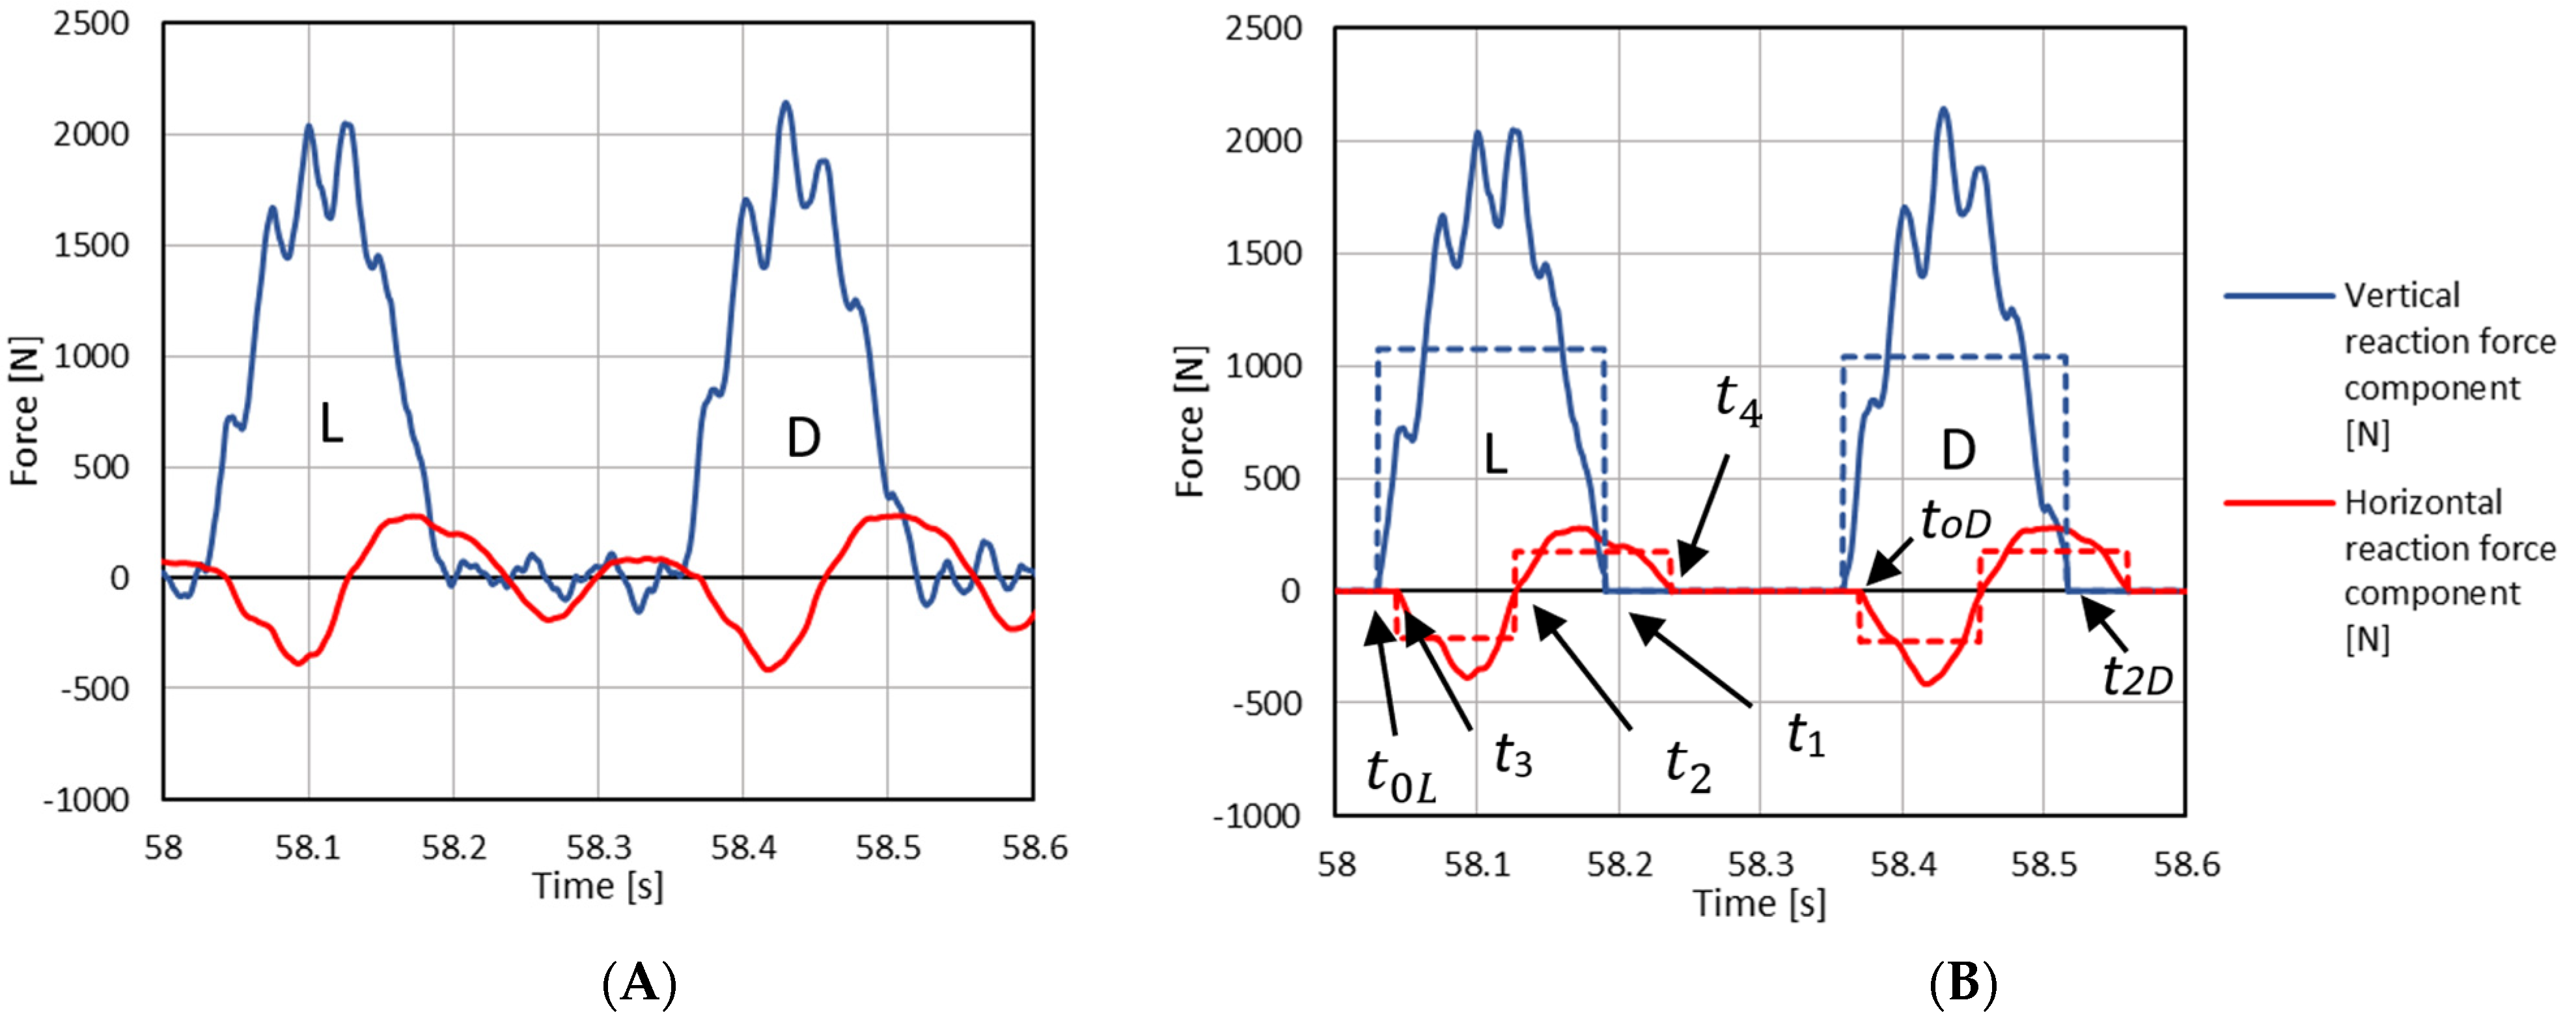
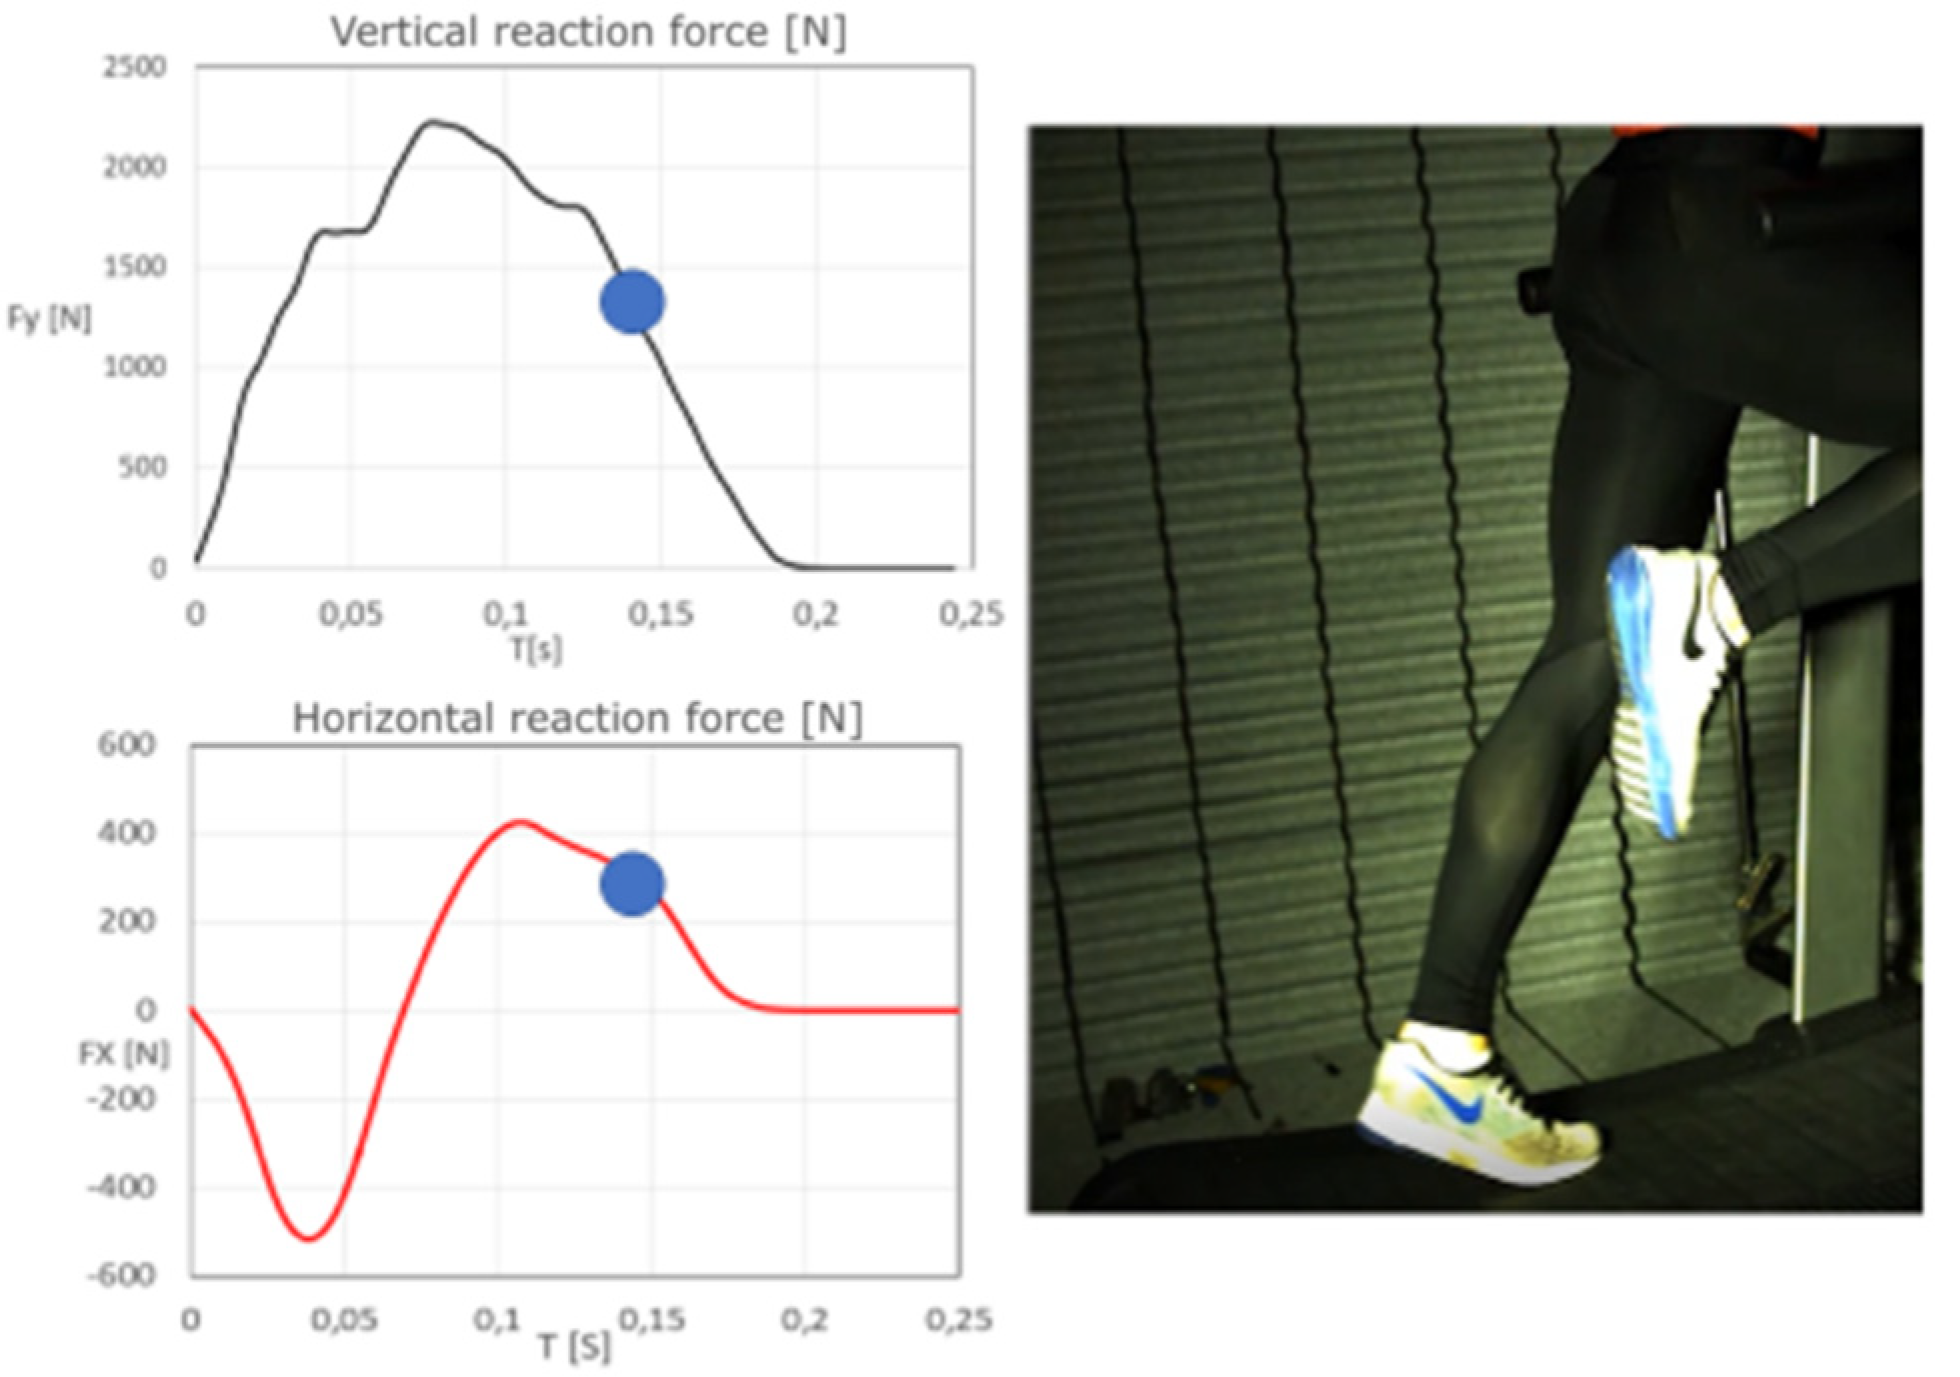
3.1. Simultaneous Analysis of the Running Topology and the Measured Forces of the Athlete on the Running Surface

The images following the diagrams show that the position of the runner’s foot varies according to the surface of the running belt; from the outer side of the foot, being marked by the red circle in Figure 5, through the initial contact phase, to the transition to the inner side of the foot, marked by the red circle in Figure 6 and Figure 7, and then to the final stage of the contact phase, at the tip of the toe, as shown in Figure 8.
In Figure 9, Figure 10, Figure 11 and Figure 12, the kinematics of the runner are presented in the meridian-longitudinal plane of the treadmill. In Figure 9, it can be seen that the runner’s outstretched leg is at an angle of 90° to the treadmill’s running surface. The next moment is characterized by a tilt of the shin in the running direction and the bent leg, which results in a reduced angle (typically less than 90°, the load on the front of the foot, indicating the runner’s take-off, and an increase in the vertical reaction force (Figure 11). The vertical load diagram shows that the maximum vertical load Fy is achieved during the transition from the load of the entire foot to the load of the front portion of the foot, but before tilting the shin in the running direction.

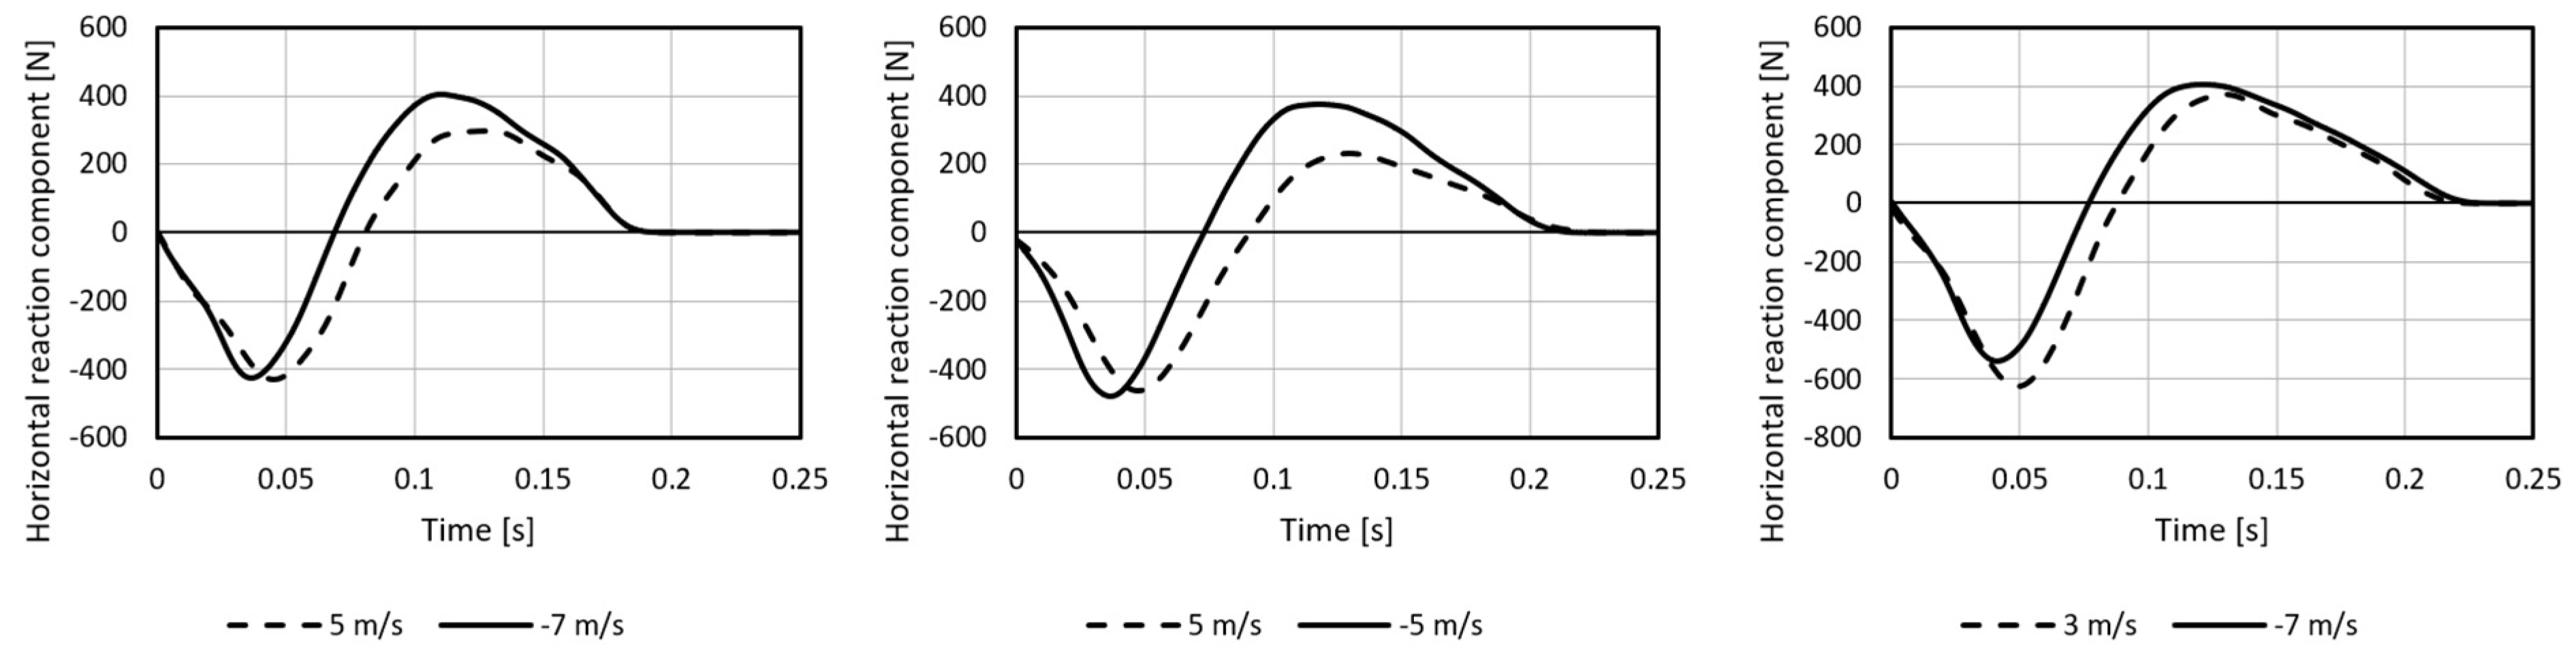
3.2. Integral Analysis of Kinematic and Dynamic Running Characteristics and the Impact of Airflow in the Wind Tunnel

The vertical load of the running belt shows that the load amplitudes, as well as the contact times with the treadmill, are similar between the individual athletes (Diagram 14). The contact time of Athlete 1 is slightly shorter (0.15 s) than that of Athletes 2 and 3 (0.20 s). The maximum value of the vertical component of the ground reaction force Fy is slightly lower for Athlete 1. Athlete 2 developed the largest vertical force, which surpassed 2000 N. As expected, a lower contact time was also present for Athlete 1, which is likely related to his longitudinal dimensions. Athlete 1 is 171 cm tall, Athlete 2 has a height of 186 cm, and Athlete 3 is 183 cm tall.
As opposed to the course of the vertical forces, as seen in Figure 13, a significant influence of the airflow velocity in the wind tunnel can be observed on running dynamics. This association is apparent along the course of the horizontal force (Figure 14) during the contact phase. In the case of headwind airflow, the braking phase of the runner is shorter. The gradient of increase of the horizontal force, on the other hand, is greater. The maximum forces at take-off are greater than in the case of running with a backwind.
Figure 15 also presents the time series of the measured contact times and ‘flight’ times, depending on the time, i.e., the number of steps in a selected measurement interval for the chosen athlete and airflow velocity in the wind tunnel. There is a symmetrical dispersion of values around the trend line, which increases over the course of the experiment. A slight difference of contact of the left and right leg is observed. What is also important is that both the frequency and contact time fluctuation increase with the running duration and that, as the frequency of running increases, the contact time decreases (as shown in Figure 15). The flight phase times are longer than the contact phases, due to the specific nature of running on the treadmill.
From the value of the average vertical force Fy in Figure 16A, it can be found that the ground forces are characteristically dependent on the mass of the athletes. There is also an established influence of the forces that are related to the orientation and intensity of the athletes’ braking (or accelerating) forces. However, in analysing the vertical force of all the athletes, it should be noted that the wind speed did not significantly affect the results of Fy. In contrast, the effect of airflow on the course of the horizontal forces is characteristically present, as shown in Figure 16B,C. During the foot’s contact phase with the ground-braking (Figure 16B), a weak increase of force in the opposite direction of the movement of the runner appears (headwind −), which is the lowest at a higher headwind speed and increases with the intensity of backwind (backwind +).
All of the runners are characterised by a descending curve, from high wind speeds to the chest (+8 m/s) to the lowest values of the ratio and high backwinds (−5 m/s). From the curve courses of the diagram shown in Figure 17, the ratio of “useful force” represented by the acceleration force relative to the braking force is reduced.
Figure 18 shows the time-averaged frequencies of individual athletes with different aerodynamic airflow characteristics in the wind tunnel. The course of the diagrams for the individual athletes shows a significant difference between the step frequencies of individual athletes. However, we cannot conclude that the airflow velocity during running significantly affects frequency. For Athletes 1 and 2, there is a noticeably small increase in frequency when transitioning from the headwind to the backwind.
When comparing contact and flight times as shown in the Figure 19, we can notice that the contact phase is significantly longer than the flight phase for all athletes. A reciprocal course of values is also noticeable, which means that those variables’ curves are mirrored according to wind speed. This characteristic is most pronounced in Athletes 2 and 3. Because of the specific conditions of the treadmill, runners generally have longer contact phases and shorter flight phases, regardless of the aerodynamic conditions in the wind tunnel.

4. Discussion

In the present study, the biomechanics of running in the wind tunnel was studied with respect to airflow velocity and direction (headwind vs. backwind in relation to the runner on the treadmill). The experiment assumed homogeneous airflow at selected nominal speeds, which was achieved while using different integral parameters of axial fans that were embedded in the wind tunnel. However, it is worth noting that running is a complex cyclic movement, predominantly determined by step frequency and stride length. Both parameters are interdependent and individually determined by central regulatory processes of movement, biomotor abilities, energy processes, and morphological characteristics [13,14,15,19,22].

4.1. The Analysis of the Running Topology and the Forces Measurement on the Treadmill Surface

The time series of the vertical force on the running belt (blue) shows the typical course of force Fvert(t) of the left—L and right—R foot, which is repeated throughout the course of the experiment in seemingly stationary chronological sequence. Minor differences between the loads of the left and right foot can be observed. This is expected based on the training pattern of the athletes. According to some studies, trained runners generally have very little asymmetry of force development between the left and right leg; the asymmetry is less than 1.5% [13,18,23]. The red curve on the diagram represents the braking and accelerating phase of the runner’s take-off on the running belt. The time series between t0 to t2 represents the braking phase, and the t2 to t3 interval represents the acceleration phase. At this point, it is worth noting that, during the analysis of the dynamics shown in Figure 4 (the transition from A to B), time segments were selected when the runner’s left or right leg generated a vertical force on the surface of the running belt. Figure 4B illustrates the occurrence of a “delayed” horizontal force signal behind the vertical force, at its transitional point where the values shift from positive to negative. This phenomenon is attributed to the force transfer properties from the running belt to the runner’s foot (at contact) onto the horizontal force sensors. This transfer occurs due to the deformability of the belt, mechanical transmissions between the belt and the underlying support rollers, and the force sensors. It is assumed that the time delay is a function of the mechanical properties of the set of individual elements and the airiness between each of them, which results in the time delay of the measured signal. We also estimate that this phenomenon does not significantly affect the amplitude of the measured horizontal forces.
Based on the analysis of Figure 5 through Figure 8, the kinematics of a runner’s right foot, during the contact phase, can be determined in the frontal view. Figure 5 captures the moment that the runner’s foot touches the running belt. This moment is part of the initial contact phase. As such, a vertical force appears on the sensors, which decreases to a value of 0 in Figure 8 via the extreme of the Fx force in Figure 6, when the contact phase is completed. In turn, in Figure 9, Figure 10, Figure 11 and Figure 12, we can track the transfer of foot load from the heel, over the entire foot, through to the take-off phase, which ends on the front of the foot. In doing so, the leg is again extended in the ankle, knee, and hip joints. The analysed contact phase was selected from the captured running segment when the airflow velocity in the wind tunnel was equal to v = 0. Each of the images consist of a snapshot of the foot on the running belt and the corresponding value of the vertical force Fy, and the horizontal force Fx, which is marked for a given time series by a point on the diagram of forces Fx(t) and Fy(t). In this section of the analysis, we focused on the momentary position of the foot on the running belt and the corresponding values of the forces that represent the foot reaction forces onto the belt. The curves in each figure represent the course of the Fx and Fy reaction forces on the running surface, as measured by the built-in sensors during the time interval of the stride, consisting of the right foot’s take-off from the belt. The red curve illustrates the Fy reaction force’s course in the vertical direction, and the blue curve represents the course of the horizontal Fx reaction force. Each of these curves represents the momentary sum of the measured values: the red curve—the sum of four values in the vertical direction, calculated according to Equation (1); the blue curve—the sum of the forces, calculated according to Equation (2), in the horizontal wind tunnel. Points on the diagrams of the momentary force values that belong to the displayed image are shown next to the diagrams.

4.2. The Impact of Airflow on Kinematic and Dynamic Characteristics of Running

Wind direction is determined by the sign (+ for backwind) and (− headwind). Table 4 shows that each runner only completed a certain number of tests, which is be presented below in the analysis. The diagrams presented in Figure 13 show the distributions of the vertical loads-reaction forces Fy at the time intervals of the runner’s contact phase with the running belt. The curves represent the average force values at intervals over the entire duration of the run at individually selected airflow velocities in the wind tunnel.
In order to understand the importance of ground reaction forces (GRF), which are directly related to an athlete’s acceleration during a run, it is necessary to incorporate experimental methods that allow for the measurement of acceleration using different time and locational scales. On this topic, we would like to mention the contributions of Morin [18,24], who, together with his co-authors, introduced a new method where basic kinetics and sprinter forces are analysed simultaneously on a 60 m surface. The developed expert system allows for the measurement of longitudinal and vertical reaction forces that formed in the contact phases of running. However, it should be noted that the interacting effects of the airflow around the runner, which, through the forces of aerodynamic resistance, affect the production of longitudinal and vertical reaction forces, and the associated energy efficiency of the run. The maximum impact of airflow is present for the horizontal force Fx, during the acceleration phase of the take-off from the running surface (Figure 16C). The maximum take-off forces are present at high airflow velocities at the runner’s chest (headwind −). In contrast, the take-off force is the smallest at high airflow velocities directed at the runner’s back (backwind +). This phenomenon is present for all runners. The ratio between acceleration force and braking force for individual athletes under different aerodynamic conditions is an important measure of running efficiency.
This can be interpreted as meaning that the energy (which is proportional to the above-mentioned ratio) required to run with a backwind is lower. Hence, less effort is needed for the runner to run. The contact phase is undoubtedly a key kinematic factor, which defines the sprinting efficiency in terms of the relationship between the braking and the propulsive (useful) phase. This ratio should be 40%: 60% [18,25,26]. The shorter the braking phase, the lower the reduction of the horizontal velocity of the runner.
It is worth noting that running is a complex cyclic movement, which is predominantly determined by step frequency and stride length. Both parameters are interdependent and individually determined by central regulatory processes of movement, biomotor abilities, energy processes, and morphological characteristics [13,14,15]. Running, as a movement stereotype, consists of repeating steps in a unit of time. The stride length mainly depends on an athlete’s body height, or the length of the leg and the force developed by the extensors of the hip, knee, and ankle joints during the contact phase. Moreover, it should be emphasised that reducing this ratio results in the reduction of the runner’s energy consumption. Rationalisation while running under specific conditions (running in water, running downhill, duet running) is a trend in the current training programs for runners that avoids overloading the knee and ankle joints, the muscular system, and the feet [11,12,13]. Subsequently, we can conclude that the frequency largely depends on an athlete’s genetics and less on the marginal conditions of the airflow in which the running takes place. To a large extent, the frequency depends on the stride length; as the stride length increases, the frequency decreases as compensation. This principle is organised by a “movement program” in the central nervous system [26,27].
The contact phase’s execution is one of the most important generators of running efficiency [13,28]. The contact phase must be as short as possible with an optimal ratio between the braking and propulsion phases. In recent times, this problem has been experimentally and analytically researched by Morin et al. [17], who have found that sprinters are faster the more they produce the maximum amount of horizontal net pulse per unit of a runner’s body weight. The execution of the contact phase is one of the most important running speed efficiency generators [13,29,30,31,32]. The contact phase must be as short as possible with an optimal ratio between the braking and propulsion phases. The relationship between the contact time and flight time for each runner is individually defined and automatic. In as short contact phase as possible, the runner must develop as much ground reaction force as possible. The flight phase directly depends on the ground reaction force [31]. Our experiment showed that the contact time differs between runners. That of Athlete 1 is slightly shorter (0.15 s) than that of Athletes 2 and 3 (0.20 s). The contact times are significantly longer on the treadmill than, under normal circumstances, when running on an athletic tartan track. The average contact time of middle-distance runners on a standard tartan track is 112 milliseconds, and 80 milliseconds for sprinters [15,19,28,33]. Based on Figure 13, we can see that, on average, our athletes have contact times longer than 0.15 s. Therefore, efficient running speed is basically the optimal ratio between contact time and the flight phase [34,35]

5. Conclusions

The results show changes in the ratio of contact and flight phases, and lower running loads in the vertical direction. The maximum forces at take-off are greater than when running with a backwind. Step frequency could not be found to depend on airflow. In the future, research should be continued and improved by synchronising kinetics and kinematics, improving airflow control, and increasing the number of participants in the measuring sample, enabling a greater generalisation of the research results. Understanding the biomechanics of running can undoubtedly represent a significant contribution to the training design, both in efficiency and injury prevention. Additionally, the field of sports biomechanics, as well as certain other areas of sports science, depend on the progress of technologies that are available for human movement research.

Author Contributions

Conceptualization, B.Š., M.Č.; methodology, B.Š.; M.Č.; software, M.S.; J.G.; formal analysis, M.Č.; investigation, M.Č., B.Š., J.G.; M.S.; a resources, M.Č., B.Š.; M.Č.; data curation, J.G.; M.Č.; writing—original draft preparation, K.M., M.Č.; B.Š.; writing-review and editing, B.Š.; K.M., M.Č.; B.Š.; K.M.; supervision, K.M., B.Š.; M.Č. All authors have read and agreed to the published version of the manuscript.

Funding

This research was financially support by the Slovenian Research Agency (ARRS).

Institutional Review Board Statement

The study design was approved by the Human Ethics Committee of the University of Ljubljana.

Informed Consent Statement

Informed consent was obtained from all subjects involved in the study.

Data Availability Statement

The data presented in this study are openly available on [repository] and on request from the corresponding author.

Acknowledgments

We would like to thank the runner for participating in the experiment and the head of NC Planica Jelko Gros for allowing us to perform the experiments in the wind tunnel.

Conflicts of Interest

The authors have no conflict of interest to declare. The results do not constitute endorsement of any product or device. The authors would like to thank the sprinters who participated in this study.

References

  1. Davis, C.T. Effects of wind assistance and resistance on the forward motion of a runner. J. Appl. Physiol. 1980, 48, 702–709. [Google Scholar] [CrossRef]
  2. Saraslanidis, P. Training for the improvement of maximum speed: Flat running or resistance training? New Stud. Athl. 2000, 15, 45–51. [Google Scholar]
  3. De Witt, J.K.; Lee, S.M.; Wilson, C.A.; Hagan, R.D. Determinants of time to fatigue during nonmotorized treadmill exercise. J. Strength Cond. Res. 2009, 23, 883–890. [Google Scholar] [CrossRef] [PubMed] [Green Version]
  4. Fullenkamp, A.M.; Matthew Laurent, C.; Campbell, B.M. Automated gait temporal-spatial assessment fromnon-motorized treadmill belt speed data. Gait Posture 2015, 41, 141–145. [Google Scholar] [CrossRef] [PubMed]
  5. Stevens, C.J.; Hacene, J.; Wellham, B.; Sculley, D.V.; Callister, R.; Taylor, L.; Dascombe, B.J. The validity of endurance running performance on the Curve 3TM non-motorised treadmill. J. Sports Sci. 2014, 33, 1141–1148. [Google Scholar] [CrossRef]
  6. Gonzalez, A.M.; Wells, A.J.; Hoffman, J.R.; Stout, J.R.; Fragala, M.S.; Mangine, G.T.; McCormack, W.P.; Townsend, J.R.; Jajtner, A.R.; Emerson, N.S.; et al. Reliability of the Woodway curve non-motorized treadmill for assessing anaerobic performance. J. Sports Sci. Med. 2013, 12, 104–108. [Google Scholar] [PubMed]
  7. Mangine, G.T.; Hoffman, J.R.; Gonzalez, A.M.; Wells, A.J.; Townsend, J.R.; Jajtner, A.R.; McCormack, W.P.; Robinson, E.H.; Fragala, M.S.; Fukuda, D.H.; et al. Speed, force, and power values produced from nonmotorized treadmill test are related to sprinting performance. J. Strength Cond. Res. 2014, 28, 1812–1819. [Google Scholar] [CrossRef] [Green Version]
  8. Rae, W.H.; Pope, A. Low-Speed Wind Tunnel Testing, 2nd ed.; John Wiley & Sons: New York, NY, USA, 1984. [Google Scholar]
  9. National Aeronautics and Space Administration. Wind-Tunnel Model Systems Criteria; Langley Research Center: Hampton, VA, USA, 2015. [Google Scholar]
  10. Placek, R. Errors and problems while conducting research studies in wind tunnel-selected examples. Trans. Inst. Aviat. 2016, 4, 69–177. [Google Scholar]
  11. Ito, S. Aerodynamic effects by marathon pacemakers on a main runner. Trans. Jpn. Soc. Mech. Eng. Ser. B 2006, 73, 1975–1980. [Google Scholar] [CrossRef] [Green Version]
  12. Hirata, K.; Okayama, T.; Teraoka, T.; Funaki, J. Precise aerodynamic measurement of track runner using a wind-tunnel moving-belt system. Procedia Eng. 2012, 34, 32–37. [Google Scholar] [CrossRef] [Green Version]
  13. Tatsuya, I.; Takafumi, O.; Takahiro, T.; Satoshi, M.; Hirata, K. Wind-tunnel experiment on aerodynamic characteristics of a runner using a moving-belt system. Cogent Eng. 2016, 3, 1231–1389. [Google Scholar]
  14. Mero, A. Force-Time Characteristics and Running Velocity of Male Sprinters during the Acceleration Phase of Sprinting. Res. Q. 1988, 59, 94–98. [Google Scholar] [CrossRef]
  15. Gambetta, V. Essential consideration for development of teaching model for 100 m sprints. New Stud. Athl. 1991, 1, 36–42. [Google Scholar]
  16. Donatti, A. The development of stride lenght and frequency in sprinting. New Stud. Athl. 1995, 10, 51–66. [Google Scholar]
  17. Morin, J.B.; Sève, P. Sprint running performance: Comparison between treadmill and field conditions. Eur. J. Appl. Physiol. 2011, 111, 1695–1703. [Google Scholar] [CrossRef]
  18. Morin, J.B.; Samozino, P.; Bonnefoy, R.; Edouard, P.; Belli, A. Direct measurement of power during one single sprint on treadmill. J. Biomech. 2010, 43, 1970–1975. [Google Scholar] [CrossRef]
  19. Novacheck, T. The biomechanics of running. Gait Posture 1998, 7, 77–95. [Google Scholar] [CrossRef]
  20. Mero, A.; Komi, P.; Gregor, R. Biomechanics of Sprint Running. Sport Med. 1992, 13, 376–392. [Google Scholar] [CrossRef] [PubMed]
  21. Shanebrook, J.R.; Jaszczak, R.D. Aerodynamic drag analysis of runners. Med. Sci. Sports Exerc. 1976, 8, 43–45. [Google Scholar] [CrossRef]
  22. Kyle, C. Reduction of wind resistance and power output of racing cyclists and runners travelling in groups. Ergonomics 1979, 22, 387–397. [Google Scholar] [CrossRef]
  23. Maćkała, K.; Fostiak, M. Acute effects of plyometric intervention—Performance improvement and related changes in sprinting gait variability. J. Strength Cond. Res. 2015, 29, 1956–1965. [Google Scholar] [CrossRef]
  24. Mann, R.; Sprague, P. A kinetic analysis of the ground leg during sprint running. Res. Q. Exerc. Sport 1980, 51, 334–348. [Google Scholar] [CrossRef]
  25. Mero, A.; Komi, P. Electromyographic activity in sprinting at speed ranging from sub-maximal to supra-maximal. Med. Sci. Sports Exerc. 1987, 19, 266–274. [Google Scholar] [CrossRef]
  26. Morin, J.B.; Dalleau, G.; Kyrolainen, H.; Jeannin, T.; Belli, A. A simple method for measuring stiffness during running. J. Appl. Biomech. 2011, 21, 167–180. [Google Scholar] [CrossRef] [PubMed]
  27. Luhtanen, P.; Komi, P. Force-, power- and elasticity-velocity relationship in walking, running and jumping. Eur. J. Appl. Physiol. 1980, 44, 79–289. [Google Scholar] [CrossRef]
  28. Morin, J.B. Sprint Running Mechanics New technology, new concepts, new perspectives. Aspetar Sports Med. J. 2020, 2, 326–332. [Google Scholar]
  29. Young, W. Laboratory strength assessment of athletes. New Stud. Athl. 1995, 10, 89–96. [Google Scholar]
  30. Bret, C.; Rahmani, A.; Dufour, A.; Messonnier, L.; Lacour, J. Leg strength and stiffness as ability factors in 100 m sprint running. J. Sports Med. Phys. Fit. 2002, 42, 274–281. [Google Scholar]
  31. Delecluse, C.; Coppenolle, H.; Goris, M. A model for the scientific preparation of high level sprinters. New Stud. Athl. 1992, 7, 57–64. [Google Scholar]
  32. Prampero, P.; Fusi, S.; Sepulcri, J.; Morin, B.; Belli, A.; Antonutto, G. Sprint running: A new energetic approach. J. Exp. Biol. 2005, 208, 2809–2816. [Google Scholar] [CrossRef] [Green Version]
  33. Cronin, J.; Hansen, T. Strength and power predictors of sports speed. J. Strength Cond. Res. 2005, 19, 349–357. [Google Scholar] [PubMed]
  34. Nicol, C.; Avela, J.; Komi, P. The Stretch-Shortening Cycle. Sports Med. 2006, 36, 977–999. [Google Scholar] [CrossRef] [PubMed]
  35. Hay, J. The Biomechanics of Sports Techniques, 4th ed.; Prentice Hall: Upper Saddle River, NJ, USA, 1993. [Google Scholar]
Figure 1. (A) represents the wind tunnel’s physical model, tested by the water flow in the model with an M:1:36 ratio (wind tunnel designed size: wind tunnel model size); (B) represents the computational fluid dynamics (CFD) model of the airflow in the wind tunnel flow tract.
Symmetry 13 00505 g001
Figure 2. Treadmill positioning (A) with marginal conditions—airflow velocity profile in the meridian plane (B).
Symmetry 13 00505 g002
Figure 3. The horizontal x-oriented force sensors and the vertically oriented sensors–schematic representation (A); images of the sensors in the x orientation and y orientation (B).
Symmetry 13 00505 g003
Figure 4. Snapshot of the step load of the runner time series, consisting of the left—L and right—R leg load on the treadmill. original signal (A); a snapshot of the time series specifying the time limits of the foot’s contact with the surface of the treadmill (B).
Symmetry 13 00505 g004
Figure 5. Initial contact of the right foot.
Symmetry 13 00505 g005
Figure 6. Achieving the local extreme of the on its outer side. the Fy force load on the inner side of the foot.
Symmetry 13 00505 g006
Figure 7. Transition into the take-off phase.
Symmetry 13 00505 g007
Figure 8. Reduction of the vertical force on the outer side of the foot. Fy load on the inner side of the foot.
Symmetry 13 00505 g008
Figure 9. Initial foot contact phase.
Symmetry 13 00505 g009
Figure 10. Transition to running acceleration.
Symmetry 13 00505 g010
Figure 11. The take-off phase and lifting the foot.
Symmetry 13 00505 g011
Figure 12. Final stage of the take-off -flight.
Symmetry 13 00505 g012
Figure 13. Vertical component of the force on the surface of the running belt Fy (N).
Symmetry 13 00505 g013
Figure 14. Horizontal component of the force on the surface of the running belt Fx (N).
Symmetry 13 00505 g014
Figure 15. Step frequency, contact times, and flight phases as functions of the time sequence of running.
Symmetry 13 00505 g015
Figure 16. Time-averaged forces in vertical and horizontal directions: (A)—Fy, (B)—force Fx during the braking phase, (C) force Fx during the acceleration phase, at different airflow velocities, and running Athletes 1, 2, and 3.
Symmetry 13 00505 g016
Figure 17. Relationship between the acceleration and deceleration force for individual athletes under different aerodynamic conditions.
Symmetry 13 00505 g017
Figure 18. Running frequency of individual athletes, depending on aerodynamic characteristics.
Symmetry 13 00505 g018
Figure 19. Contact times (A) and flight phases (B) of individual athletes depending on aerodynamic characteristics.
Symmetry 13 00505 g019
Table 1. Descriptive Data of Selected Anthropometric Characteristic of Male Athletes.
Athlete 1Athlete 2Athlete 3
Age (years)262228
Height [cm]171186183
Body Mass [kg]587274
1500 m (PR) * 03.59, 003.58, 7503.58, 8
* Personal record in the 1500 m run.
Table 2. Nominal Wind Tunnel Parameters.
Nominal volume flow rate in the wind tunnel510 m3/s
Cross-section of the vertical sectionΦ 3.6 m
Maximum airflow velocity in the vertical section of the wind tunnel61 m/s
Nominal total pressure differential on installed fans4300 Pa
Air density range in the wind tunnel1.1–1.2 kg/m3
Nominal electrical power of fans2.2 MW
Table 3. Nominal Wind Tunnel Parameters-Horizontal Section.
Nominal volume flow rate in the wind tunnel124 m3/s
Transverse section of horizontal section A10.5 m2
Maximum airflow velocity in the vertical section of the wind tunnel45 m/s
Table 4. Average Wind Speeds in the Meridian Plane of the Wind Tunnel.
V1 (m/s)V2 (m/s)V3 (m/s)V4 (m/s)V5 (m/s)
Athlete 153057
Athlete 25305
Athlete 3 3057
Publisher’s Note: MDPI stays neutral with regard to jurisdictional claims in published maps and institutional affiliations.

