Abstract
In this paper, a memory-efficient outlier detection (MEOD) approach for streaming data is proposed. The approach uses a local correlation integral (LOCI) algorithm for outlier detection, finding the outlier based on the density of neighboring points defined by a given radius. The radius value detection problem is converted into an optimization problem. The radius value is determined using a particle swarm optimization (PSO)-based approach. The results of the MEOD technique application are compared with existing approaches in terms of memory, time, and accuracy, such as the memory-efficient incremental local outlier factor (MiLOF) detection technique. The MEOD technique finds outlier points similar to MiLOF with nearly equal accuracy but requires less memory for processing.
1. Introduction
A variety of modern telecommunications and Internet of Things (IoT) applications generate a large amount of streaming data in which, along with the regular data entries, there are entries that contain extreme or unexpected values, called outliers. From the whole dataset, the outliers are very few and are nothing but an abnormal behavior of data. Outlier detection techniques are applied in a variety of domains such as fraud detection, human gait analysis, intrusion detection, etc.
Outlier detection techniques are broadly classified into three types:
- Distance-based outlier detection: For finding outliers, the distance between the data points is calculated, and outlier points are those whose distance is much bigger than the average distance [1,2]. As compared with the other two techniques, this technique is much simpler to use, and unlike the statistical-based approach, no prior assumptions are required.
- Density-based outlier detection: This approach compares the object density with respect to neighboring objects. Outlier points have a lower density than neighboring points. Local outlier factor (LOF) [3] and local correlation integral (LOCI) [4] are the popular density-based approaches provided by most of the machine learning libraries. Most of the methods, for example, DBSCAN [5], use a clustering technique for outlier detection. The outliers are treated as a by-product of the clustering technique. Initially, clustering is applied, and then the points far away from the centroid are identified as outliers.
- Statistical approach: The statistical approach [6,7,8] assumes a distribution of the data and generates a probability model on the basis of which a discordance test is performed to detect whether a given object is an outlier or not.
The distance-based and density-based approaches are widely used. In LOF, the reachability distance is calculated for each point, and then the ratio of the average density of n neighboring points to the density of the point itself is calculated. For normal data points, the densities are the same as the other points, and the ratio tends to 1, whereas for outliers, the ratio is high. There is a dependency on the number of nearest neighbors’ value k when calculating the LOF factor. LOCI addresses this issue by finding the nearest neighbors within a radius r, and using these points, the reachability density is calculated. The LOCI technique does not have any mechanism to find the optimal value of radius r. The value of r is set a priori, or there should be some optimization algorithm that finds the value of r. The other disadvantage of LOF and LOCI is that the time and space complexity for finding the outlier score for each point increases by increasing the dataset size.
In the approach proposed in this paper, an evolutionary algorithm to find the optimal value of radius r is used. The evolutionary algorithms are population-based metaheuristics that find the optimal solution using multiple iterations [9]. The swarm-based optimization algorithms are a category of the evolutionary algorithms using swarm-based metaheuristics, which are mainly derived from particle swarm optimization (PSO) and ant colony optimization (ACO) metaheuristics. Rough set outlier detection [10] and web bots detection [11] are examples of PSO-based outlier detection techniques.
In the proposed approach, an optimization problem is established to find the optimal value of r, and the outlier scores for the candidate points that have the potential to be an outlier [12,13] are calculated. The swarm optimization technique is used to find the value of r. According to Knorr’s definition [14], the data point is an outlier if it has at least a fraction of 1−β points further away from the radius r. It means that a data point O should have k nearest neighbors within the radius r centered from point O. The goal is to minimize the ratio k/r. In the proposed approach, the optimal value of r is determined, minimizing the ratio k/r, and calculated for those points that have the potential to be an outlier using the particle swarm optimization technique.
Outlier detection techniques generally are applied on a static dataset containing a finite number of samples. In the case of streaming, data outlier detection is a challenging task due to the data volume and the limitations in available processing memory. The challenges and various techniques in outlier detection using streaming data are discussed in [15]. Incremental local outlier factor (iLOF) [16] and memory-efficient incremental local outlier factor (MiLOF) [17] are outlier detection techniques that work with streaming data. MiLOF is a memory-efficient outlier detection algorithm as compared to iLOF, and it computes the LOF value with defined memory constraints and uses a sliding window protocol with a data summarization technique. Rather than preserving all the data points in memory, a summary of the previous data points with limited memory resources is kept using data summarization. Hybrid PSO-MiLOF [18] is a memory-efficient technique to find outliers using PSO and LOF in a memory-efficient manner over streaming data.
Inspired by particle swarm optimization(PSO)-based outlier detection using LOCI [12,13] and MiLOF [17], a new outlier detection approach named memory-efficient outlier detection (MEOD) is proposed in this paper. This approach works on streaming data similar to the MiLOF technique and finds the outlier using the LOCI algorithm. Using the PSO-based technique, the optimal value of radius r is calculated. Following are the main advantages of the proposed MEOD approach:
- It is a local outlier detection technique over streaming data based on the local correlation integral (LOCI) technique.
- It works with limited memory resources using a data summarization mechanism.
- It uses a swarm intelligence technique to find the optimal value for radius r for LOCI calculations.
- To improve the efficiency of the algorithm, MEOD finds an outlier factor value for only candidate points rather than the whole dataset.
The paper is organized as follows. Section 2 includes preliminaries followed by the proposed methodology in Section 3. Section 4 presents the experimental setup containing hardware and software requirements, dataset, and performance measure details. Section 5 presents and analyzes the results. Section 6 concludes the paper.
2. Preliminaries
LOCI-, PSO-, and MiLOF-based streaming data processing are the key aspects of the proposed approach. Following are some details of each technique.
2.1. Local Correlation Integral
LOCI uses a multi-granularity deviation factor (MDEF) and normalized deviation factor (σMDEF) at radius r. Using these factors, the outliers can be identified and calculated as:
where pi is part of a set of objects, P = {p1,…, pi,…, pN}, n(pi, αr) is the number of objects in the αr-neighborhood of pi, and n’(pi, r, α) is the average of all objects present in the αr-neighborhood of pi. It is calculated as:
The standard deviation of n(p, αr) over the set of r neighbors is σn’(pi, α, r) and can be calculated as:
The point is said to be an outlier if:
where kσ is the constant value set as 3.
2.2. Particle Swarm Optimization
PSO is a population-based stochastic optimization tool. The algorithm is designed based on bird flocking behavior, assigning multiple particles that are moving around the defined space. This algorithm finds the solution iteratively, updating the position of the particles after each iteration. The loop is executed until maximum iterations are reached or up to reaching a satisfactory solution.
The position Xi and velocity Vi of each particle i is updated at each iteration using the following formula:
where x is the constriction factor (set to 0.729); θ1 and θ2 are acceleration coefficients; c1 and c2 are random numbers in the range [0,1]; Xibest is the best position of particle i; and Xigbest is the global best position found among neighborhood particles of i.
In the proposed approach, the ring topology for information exchange is used where the particles are connected to two other neighboring particles. This topology avoids the swarm of falling into a local optimum.
The PSO-based approach finds the optimal value of r for MDEF calculations in LOCI. The system tries to find the points that have a minimum k/r ratio. By keeping this objective, the fitness function f(X) for PSO is defined as [12]:
where α is a constant value; n is the size of the dataset; α/(r X k) is the value to limit the lower bound value of r; and k/(n − k) limits the upper bound value of r.
Lower and upper bound limits help to select the appropriate value of r. If r is too low, then very few neighboring points will be considered, whereas if the value is too high, then too many neighboring points will be considered, thus affecting the outlier detection procedure.
2.3. Memory-Efficient Approach
Streaming data points are processed using the sliding window protocol. From a stream b, data points are selected after every interval defined as a sliding window size. The system identifies the local outlier for each sliding window. The b/2 points are processed using the following three phases:
- Summarization: Due to memory constraints, it is not feasible to preserve all the data points in the stream. If the previous data points are deleted, then the new events cannot be distinguished from the past ones. This affects the accuracy of the evaluation as there is no history of data to be considered while checking the local outlier. In the summarization phase, the summary of previous data points is preserved. For every window slot, b/2 points are processed, and a summary is generated of these points. For summary generation, the clustering technique is used. A large number f of cluster counts is set, and the cluster centers are preserved as a summary of information with granularity deviation factor (MDEF) and normalized deviation factor (σMDEF) at radius r values. The remaining points are deleted, and then the next slot is processed.
- Merging: The cluster centers generated in previous sliding window i-1 and clusters generated in the current sliding window i are merged in this phase, and a single value of cluster centers is preserved. For clustering, the cluster centers from the sliding windows i-1 and i are merged using a weighted c-means clustering algorithm where each point has a weight that shows the point importance value in the clustering process. In this process, each point is a cluster center. Hence the count of cluster members is assigned as a weight to the cluster center. After the clustering process, the weights of the cluster centers are updated as:
- Revised insertion: In the revised insertion phase, the processing is completed using the b/2 points in the current sliding window and the summarized points preserved in the memory. The outlier of a point is calculated using MDEF values. If the point is present in a radius of previously summarized points, then this point is not considered an outlier. Hence, there is no need to calculate the outlier factor of such points.
3. Proposed Outlier Detection Technique
Figure 1 shows the processing architecture of the MEOD technique. The streaming data and predefined constant parameters are input into the system. The system generates an outlier point list and the data point summary for the sliding window.
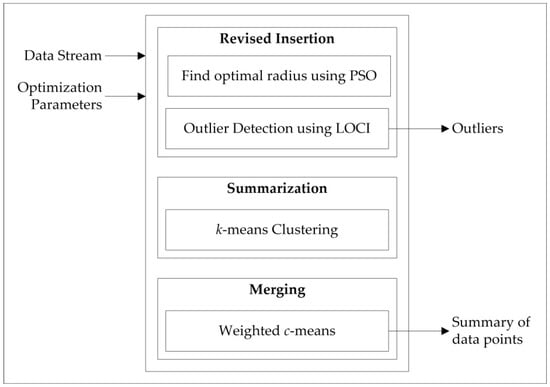
Figure 1.
Processing architecture of memory-efficient outlier detection (MEOD).
For each sliding window, the outliers are enlisted, and only the important reference points are preserved in the memory as history using the memory-efficiency approach. This approach allows outlier detection to be applied on streaming data while using limited memory resources as the outliers are detected using the LOCI technique. LOCI detects the outlier based on the density of neighboring points defined using the radius r. The radius value can be user-defined, but in order to remove such dependency, the r-value is automatically found using an optimization function applying the PSO-based approach to find the optimal value of the radius r.
The system operation is mainly divided into three phases executed iteratively for each sliding window.
- Revised insertion: For each sliding window, the outliers are detected using the LOCI technique, finding the outlier based on the density of neighboring points defined using the radius r. The radius value can be user-defined, but in order to remove such dependency, the r-value is automatically found using an optimization function applying the PSO-based approach to find the optimal value of the radius r.
- Summarization: The data representative points are extracted using a k-means clustering algorithm. The cluster centroids, treated as representative points for the rest of the cluster points, are preserved as summary information with a granularity deviation factor (MDEF) and a normalized deviation factor (σMDEF) at radius r values.
- Merging: A summary generated in the current sliding window is merged with the previous sliding window summary using the weighted c-means algorithm.
Figure 2 (Algorithm 1) shows the implementation of the PSO-LOCI algorithm based on the swarm optimization technique to find the optimal value of radius r using a fitness function as defined in (7). In steps 1 and 2, particles are initialized with random values. The optimization process is executed until the maximum value of iterations is reached. In steps 4 and 5, the k neighboring points are found, and the fitness value for each particle is calculated. Using these values, the value of r, as well as the global best and local best values, are calculated in steps 7 and 9, respectively. The particle position is updated in steps 11 to 13. Based on the optimal value of the radius r, the MDEF and σMDEF values are calculated for candidate points that are not in a radius of previously preserved points (steps 16 to 19). The outlier points are detected in step 20 using Equation (5).
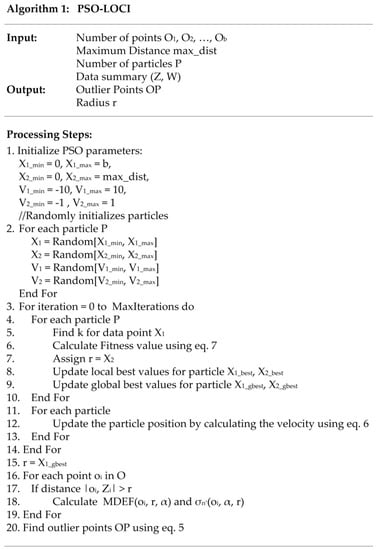
Figure 2.
Algorithm 1. Particle swarm optimization local correlation integral (PSO-LOCI).
The detailed performance of the MEOD technique is explained in Figure 3 (Algorithm 2). From the data points O, b data points are read, and the outlier is detected based on PSO-LOCI (Algorithm 1 in Figure 2). In step 4, the system summarizes the b/2 data points and creates K clusters with Vi centroids. The calculation is completed in each sliding window. The current sliding window result is merged with the previous sliding window. For merging, the MDEF(Vi, r, α) and σMDEF(Vi, r, α) values are calculated for centroidi in step 5 using the following formulas:
where |Ci| represents the number of points in cluster Ci.
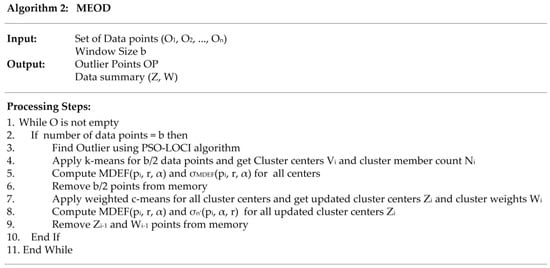
Figure 3.
Algorithm 2. MEOD.
The centroid values are the average value of MDEF and σMDEF values of all cluster points. Centroids are preserved, and b/2 points are removed from memory in step 6. The weighted c-means are applied in step 7, and the centroid points are updated again with MDEF and σMDEF values in step 8. The previous centroids are deleted, and the summary is updated in step 9, preserving in memory as history only the important reference points using the memory-efficiency approach.
4. Implementation Details
The system is developed and tested on a machine with 4 GB RAM and an i3 processor running the Windows 10 operating system. Python programming language for the implementation of the suggested MEOD outlier detection approach is used.
The experimental evaluation is based on various real-time datasets downloaded from the UCI repository [19] and the Kaggle repository [20]. Table 1 shows the database information in terms of the number of instances and the number of dimensions of the dataset.

Table 1.
Datasets.
In addition, three synthetic datasets are generated using the Gaussian clustering function. A mixture of two Gaussians is used to generate each dataset. For better visualization purposes, two-dimensional datasets are generated.
The parameter values are set based on the common settings described in [12]. For the PSO algorithm, the population size is set as 30 particles. The maximum iteration count is set to 1000. The ring topology is used for particle connections. The constriction factor required for the velocity calculation is set to 0.729. The parameters c1 and c2 required for the velocity calculation are set to 2.02.
For streaming, the window size is defined as 1000. The number of cluster counts is set to 50. The number of iterations for the k-means and weighted c-means are set to 100 and 10, respectively [17].
For distance calculation, the Euclidean distance measure is used. Initially, the attribute values of the dataset are normalized in the range [0,1], according to the following equation:
where fi is the attribute value, and fimax and fimin are the minimum and maximum values in attribute fi.
5. Results
The evaluation time and the memory required for processing the above-described datasets using the suggested MEOD technique are compared with the results using MiLOF. The influence of the window size on the time and the memory required for data processing is evaluated. The accuracy of the outlier detection results is also compared for the selected datasets.
Figure 4 shows the effect of the value K of the k-means algorithm on the outlier detection process obtained using the Kaggle wine dataset [20]. The results are collected by changing the value of K as 5, 10, 15, and 20. As can be seen from the results obtained, varying the number of neighbors used in the k-means clustering significantly influences the number of outliers detected. The suggested MEOD technique finds the optimal value of r by removing the dependence on the K value.
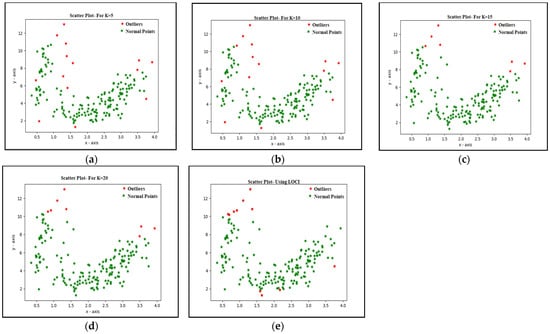
Figure 4.
Effect of parameter K on the outlier detection process: (a) K = 5; (b) K = 10; (c) K = 15; (d) K = 20; (e) using LOCI.
5.1. Accuracy Analysis
The effect of the value K on the outlier detection process is compared for the above-described two-dimensional synthetic datasets. The outlier points are manually annotated by checking the data distribution, and the detected outlier points using the MEOD technique are compared with the dataset outlier points. Figure 5 shows the accuracy obtained for the synthetic datasets applying the MEOD technique. The precision value is compared for different parameter K settings. The x-axis represents the used values of K: 5, 10, 15, and 20. The optimal r-value obtained using MEOD finds more accurate outlier points; thus, the accuracy of the MEOD technique compared to MiLOF for two of the datasets is higher. Moreover, the suggested MEOD technique not only outperforms MiLOF in terms of outlier detection accuracy but also the accuracy does not vary with respect to any parameter.
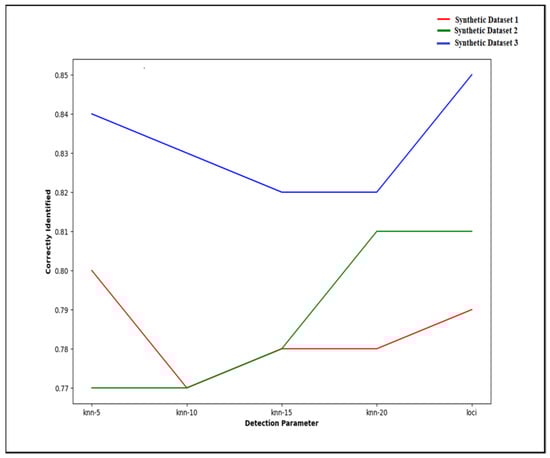
Figure 5.
Accuracy of the MEOD technique on the synthetic datasets.
5.2. Time and Memory Analysis
Figure 6 shows a comparison of the execution time and the memory requirements for outlier detection applied on various UCI datasets [19] using MiLOF and MEOD. The suggested MEOD technique finds the optimal value of r that increases the outlier detection accuracy and removes parameter dependency, but the process requires extra computation time as compared to the existing MiLOF technique. After finding the optimal r-value, only the distance record of r neighbors is kept in memory. There is no need to generate a distance matrix among all the points; hence, memory consumption is less as compared to MiLOF.
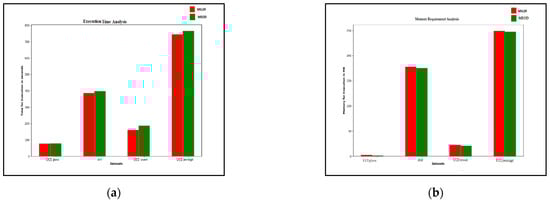
Figure 6.
Comparison of the execution time and the memory requirements of memory-efficient incremental local outlier factor (MiLOF) and MEOD for several UCI datasets: (a) execution time; (b) memory required.
In Figure 7, the influence of the sliding window size on the time and the memory requirements of MiLOF and MEOD outlier detection techniques for the synthetic dataset are compared. Increasing the size of the sliding window, the number of processing points increases, and hence the required computational time and memory for processing in each window is increased. As the experimental results show, for various sliding window sizes corresponding to processing points varying from 1000 to 500, the MiLOF technique is time efficient but requires higher memory as compared to the MEOD technique. For each sliding window, the points present in the radius of previously saved points are not taken into account in the outlier detection process, thus reducing computational overhead. The computational efficiency varies with respect to the dataset structure and points present in each sliding window.
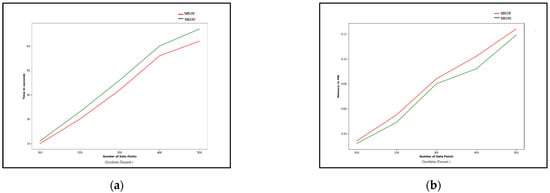
Figure 7.
Comparison of the execution time and the memory requirements of MiLOF and MEOD for outlier detection in the synthetic dataset with different sliding window sizes: (a) execution time; (b) memory requirement.
6. Conclusions
In this paper, a memory-efficient outlier detection (MEOD) approach for streaming data is proposed. For the outlier detection process, the LOCI algorithm is used. The neighboring points are defined using radius r that is automatically determined by applying optimization using the PSO-based approach to find the optimal value of radius r. A summary of previous data points is created, and a subset of data points is preserved in the memory, which helps to preserve the evolutionary history of data. The experimental results show that the proposed MEOD approach removes the dependency of the K value of the used k-means clustering algorithm in the outlier detection process as opposed to MiLOF, finds outlier points with similar accuracy to the MiLOF, but requires less memory for processing compared to MiLOF.
Author Contributions
Conceptualization, A.K. and V.P.; methodology, A.K. and M.L.; software, A.K.; validation, A.K. and P.K.; investigation, A.K. and M.L.; resources, A.K.; writing—original draft preparation, A.K.; writing—review and editing, A.K., P.K., and V.P.; visualization, A.K. and P.K.; supervision, V.P. and M.L.; funding acquisition, V.P. and M.L. All authors have read and agreed to the published version of the manuscript.
Funding
The APC was funded by the project UNITe BG05M2OP001-1.001-0004/28.02.2018 (2018–2023).
Institutional Review Board Statement
Not applicable.
Informed Consent Statement
Not Applicable.
Data Availability Statement
No new data were created or analyzed in this study. Data sharing is not applicable to this article.
Acknowledgments
The authors acknowledged support from the project UNITe BG05M2OP001-1.001-0004/28.02.2018 (2018–2023).
Conflicts of Interest
The authors declare no conflict of interest.
References
- Radovanovic, M.; Nanopoulos, A.; Ivanovic, M. Reverse nearest neighbors in unsupervised distance-based outlier detection. IEEE Trans. Knowl. Data Eng. 2015, 27, 1369–1382. [Google Scholar] [CrossRef]
- Zhang, K.; Hutter, M.; Jin, H. A new local distance-based outlier detection approach for scattered real-world data. In Advances in Knowledge Discovery and Data Mining (PAKDD 2009). Lecture Notes in Computer Science; Theeramunkong, T., Kijsirikul, B., Cercone, N., Ho, T.B., Eds.; Springer: Berlin/Heidelberg, Germany, 2009; Volume 5476. [Google Scholar] [CrossRef]
- Breunig, M.; Kriegel, H.-P.; Ng, R.; Sander, J. LOF: Identifying density-based local outliers. Proc. ACM SIGMOD Int. Conf. Manag. Data (SIGMOD’00) 2000, 29, 93–104. [Google Scholar] [CrossRef]
- Papadimitriou, S.; Gibbons, P.B.; Faloutsos, C. LOCI: Fast outlier detection using the local correlation integral. In Proceedings of the 19th International Conference on Data Engineering, Bangalore, India, 5–8 March 2003; pp. 315–326. [Google Scholar] [CrossRef]
- Ester, M.; Kriegel, H.-P.; Sander, J.; Xu, X. A density-based algorithm for discovering clusters in large spatial databases with noise. In Proceedings of the Second International Conference on Knowledge Discovery and Data Mining (KDD’96); AAAI Press, Association for Computing Machinery: New York, NY, USA, 1996; Volume 96, pp. 226–231. [Google Scholar] [CrossRef]
- Chen, F.; Lu, C.-T.; Boedihardjo, A.P. GLS-SOD: A generalized local statistical approach for spatial outlier detection. In Proceedings of the 16th ACM SIGKDD International Conference on Knowledge Discovery and Data Mining; Association for Computing Machinery: New York, NY, USA, 2010; pp. 1069–1078. [Google Scholar] [CrossRef]
- Liu, X.; Lu, C.-T.; Chen, F. Spatial outlier detection: Random walk based approaches. In Proceedings of the 18th SIGSPATIAL International Conference on Advances in Geographic Information Systems (GIS’10); Association for Computing Machinery: New York, NY, USA, 2010; pp. 370–379. [Google Scholar] [CrossRef]
- Kriegel, H.P.; Kr€oger, P.; Schubert, E.; Zimek, A. LoOP: Local outlier probabilities. In Proceedings of the 18th ACM Conference on Information and Knowledge Management (CIKM’09); Association for Computing Machinery: New York, NY, USA, 2009; pp. 1649–1652. [Google Scholar] [CrossRef]
- Mukhopadhyay, A.; Maulik, U.; Bandyopadhyay, S.; Coello, C.A.C. A survey of multiobjective evolutionary algorithms for data mining: Part I. IEEE Trans. Evol. Comput. 2014, 18, 4–19. [Google Scholar] [CrossRef]
- Misinem; Bakar, A.A.; Hamdan, A.R.; Nazri, M.Z.A. A rough set outlier detection based on particle swarm optimization. In Proceedings of the 10th International Conference on Intelligent Systems Design and Applications, Cairo, Egypt, 29 November–1 December 2010; pp. 1021–1025. [Google Scholar] [CrossRef]
- Alam, S.; Dobbie, G.; Koh, Y.S.; Riddle, P. Web bots detection using particle swarm optimization based clustering. In Proceedings of the 2014 IEEE Congress on Evolutionary Computation (CEC), Beijing, China, 6–11 July 2014; pp. 2955–2962. [Google Scholar] [CrossRef]
- Mohemmed, A.W.; Zhang, M.; Will, B. Particle swarm optimisation for outlier detection. In Proceedings of the 12th Annual Conference on Genetic and Evolutionary Computation (GECCO’10); Association for Computing Machinery: New York, NY, USA, 2010; pp. 83–84. [Google Scholar] [CrossRef]
- Hashmi, A.; Doja, M.; Ahmad, T. An optimized density-based algorithm for anomaly detection in high dimensional datasets. Scalable Comput. Pract. Exp. 2018, 19, 69–77. [Google Scholar] [CrossRef]
- Knorr, E.M.; Ng, R.T.; Tucakov, V. Distance-based outliers: Algorithms and applications. VLDB J. 2000, 8, 237–253. [Google Scholar] [CrossRef]
- Karale, A. Outlier detection methods and the challenges for their implementation with streaming data. J. Mob. Multimed. 2020, 16, 351–388. [Google Scholar] [CrossRef]
- Pokrajac, D.; Lazarevic, A.; Latecki, L.J. Incremental local outlier detection for data streams. In Proceedings of the 2007 IEEE Symposium on Computational Intelligence and Data Mining, Honolulu, HI, USA, 1 March–5 April 2007; pp. 504–515. [Google Scholar] [CrossRef]
- Salehi, M.; Leckie, C.; Bezdek, J.C.; Vaithianathan, T.; Zhang, X. Fast Memory efficient local outlier detection in data streams. IEEE Trans. Knowl. Data Eng. 2016, 28, 3246–3260. [Google Scholar] [CrossRef]
- Karale, A.; Lazarova, M.; Koleva, P.; Poulkov, V. A hybrid PSO-MiLOF approach for outlier detection in streaming data. In Proceedings of the 43rd International Conference on Telecommunications and Signal Processing (TSP), Milan, Italy, 7–9 July 2020; pp. 474–479. [Google Scholar] [CrossRef]
- UCI Machine Learning Repository. Available online: http://archive.ics.uci.edu/ml (accessed on 8 March 2021).
- Kaggle Wine Dataset. Available online: https://www.kaggle.com/rishidamarla/2d-3d-pca-t-sne-and-umap-on-wine-dataset (accessed on 8 March 2021).


Publisher’s Note: MDPI stays neutral with regard to jurisdictional claims in published maps and institutional affiliations. |
© 2021 by the authors. Licensee MDPI, Basel, Switzerland. This article is an open access article distributed under the terms and conditions of the Creative Commons Attribution (CC BY) license (http://creativecommons.org/licenses/by/4.0/).