Article

Health Monitoring System for Elderly Patients Using Intelligent Task Mapping Mechanism in Closed Loop Healthcare Environment

1
Department of Computer Engineering, Jeju National University, Jeju 63243, Korea
2
Software Engineering Department, University of Engineering & Technology Mardan, Mardan 23200, Pakistan
3
Department of IT Convergence Engineering, Gachon University, Seongnam-Si 461-701, Korea
*
Author to whom correspondence should be addressed.
Symmetry 2021, 13(2), 357; https://doi.org/10.3390/sym13020357
Submission received: 7 January 2021 / Revised: 8 February 2021 / Accepted: 10 February 2021 / Published: 22 February 2021

Abstract

:
The ageing population’s problems directly impact countries’ socio-economic structure, as more resources are required to monitor the aged population’s health. The growth in human life expectancy is increasing due to medical technologies and nutritional science innovations. The Internet of Things (IoT) is the connectivity of physical objects called things to the Internet. IoT has a wide range of health monitoring applications based on biomedical sensing devices to monitor health conditions. This paper proposes elderly patients’ health monitoring architecture based on an intelligent task mapping approach for a closed-loop IoT healthcare environment. As a case study, a health monitoring system was developed based on the proposed architecture for elderly patients’ health monitoring in the home, ambulance, and hospital environment. The system detects and notifies deteriorating conditions to the authorities based on biomedical sensors for faster interventions. Wearable biomedical sensors are used for monitoring body temperature, heart rate, blood glucose level, and patient body position. Threshold and machine learning-based approaches were used to detect anomalies in the health sensing data. The proposed architecture’s performance analysis is evaluated in terms of round trip time, reliability, task drop rate, and latency performance metrics. Performance results show that the proposed architecture of the elderly patient health monitoring can provide reliable solutions for critical tasks in IoT environments.

1. Introduction

Medical science innovations and advancements in nutritional science immensely increase human life expectancy, which raises the ageing population’s problems. Chronic diseases in elderly patients rise issues which put significant pressure on the health care, and economy [1] of a country. Thus, the demand for health monitoring resources in hospitals and health care clinics increases. Health monitoring resources mainly include a hospital bed, human staff such as doctors and nurses, health monitoring device, and machines [2]. There is a research gap for proposing solutions to reduce this significant pressure on the health care systems. Elderly patients who are not at high risk can be monitored remotely from home, whereas patients at risk can be monitored and treated in the hospital to reduce healthcare systems’ pressure. In general, Patient health monitoring systems are developed based on the integration of communication and computing technologies. In the literature, electronic health services-based models were developed for sustainable e-health services to address the challenges and issues of these systems [3]. In broader-spectrum, these solutions have common objectives and goals to provide electronic health services. One goal of these solutions is to monitor and evaluate patient health conditions based on vital signs [4].
In the literature, IoT-based applications are developed in the domain of smart homes, smart cities, smart fisheries, smart industries, and smart hospitals, to named a few [5]. Previous studies use IoT as a potential solution to address the significant pressure on the healthcare management systems [6]. Some of the research studies focused on patient health monitoring of specific diseases based on vital signs monitoring. A few studies used IoT-based technologies to develop remote smart health care systems. Survey studies have been presented listing applications, challenges, and issues of commercial IoT platforms [7]. These survey studies discussed data analysis approaches, comparative analysis of medical sensing devices but no studies present solutions to develop sustainable e-health services. A sustainable solution must address and improve issues related to reliability, latency, and stability to the health monitoring systems.
Previously tasks orchestration mechanism based on the Do It Yourself(DIY) approach has been proposed for smart home-based thermal comfort applications [8] and mountain fire detection [9]. Task orchestration mechanism provides task-level management of IoT services. Task management makes the IoT application flexible and scalable. There are two approaches when it comes to service-oriented IoT. Service-level orchestration and Task-level orchestration. Service level orchestration is a familiar research topic and has been used in many studies. However, the use of a single monolithic service makes them inflexible, and with the addition of more devices, the application has to do a bulk of rework. Task orchestration is a more granular approach, and thus in its core, it adds flexibility to the IoT application. Moreover, the task-level granularity is very scalable, and when more devices are registered, a very minimal effort is required to assign tasks to newly added devices [10,11,12]. Task orchestration inherently deals with resource under-use and over-use. In case of lack of connectivity, the resource allocation algorithm re-run task mapping algorithm and finds the next better device to which connection can be established [11], in case of redundant connection, it uses those devices which are optimally located [10,13]. In healthcare, it is essential to have a scalable system to accommodate new patients in an emergency; therefore, the task-level approach is the logical candidate for such systems where the load is not predictable. There are quite a few studies that encourage task management instead of service management. Tasks level management of services was proven effective for latency-critical applications.
Task orchestration mechanism is based on a series of steps such as services analysis for tasks generation, device virtualization management, task mapping, and task deployment on IoT devices. A task executes a functional unit of the IoT service. Device virtualization virtualizes IoT devices such as sensors and actuators to virtual objects. Device virtualization management gives freedom from hardware dependency. Task mapping mechanism is used for mapping tasks to relevant virtual objects. Task mapping generates pairs of virtual objects and tasks. These pairs are ordered based on task parameters such that most urgent tasks are executed first and vice versa. These ordered tasks and virtual objects are used to create processes for execution on IoT devices. The DIY-based IoT tasks orchestration mechanism cannot handle critical task applications as the IoT application is designed manually by the end-user.
This study proposes an intelligent task mapping mechanism to produce optimal task device operation plans based on an optimization scheme to overcome this drawback of DIY-based task orchestration. As a case study, the elderly patient health monitoring(EPHM) architecture is proposed for a closed-loop IoT healthcare environment based on an intelligent task mapping-based task orchestration mechanism. A closed environment for elderly patient health monitoring provides reliable health monitoring in the home, ambulance, and hospital environments. This study proposes a multi-objective functions-based intelligent task mapping algorithm to produce optimal device operations plans. The proposed intelligent task mapping architecture can be used to develop applications for critical task environments such as smart hospitals, smart industry, and smart transportation. An elderly patient health monitoring system (E-PHMS) is developed based on the proposed intelligent tasks mapping-based task orchestration. The system monitors elderly patients based on microservices such as patient health monitoring at home, patient health monitoring at the hospital, and patient health monitoring in an ambulance. These microservices are organized into functional health units called health tasks. The proposed system uses a device virtualization mechanism to register health devices’ virtual objects. The proposed intelligent task mapping algorithm produces an optimal operational plan for these tasks and health monitoring devices. The system creates processes for the optimal operations plans and deploys them for execution on health monitoring devices.
A conceptual diagram of the proposed E-PHMS in a closed-loop healthcare environment is given in Figure 1. An elderly patient is monitored in three scenarios, smart home, smart ambulance, and smart hospital. E-PHMS is designed with alarming threshold profiles to detect and notify anomalies in the vital signs to healthcare authorities. If a patient outbreak is detected in the smart home, the patient is transferred to a smart ambulance environment and monitored through the proposed E-PHMS. In the smart ambulance, patient vital signs are continuously monitored and visualized on the hospital’s emergency dashboard. Once the elderly patient is hospitalized to the intensive care unit (ICU), the system monitors the vital signs and provides descriptive and predictive analysis on the patient data. When elderly patients’ health conditions are recovered, they are discharged and transferred to the smart home and monitored continuously. The system’s data is used for data analysis, such as anomalous behavior detection and notification.
The rest of the paper is structured as follows. Section 2 highlights significant contributions to health monitoring systems. In Section 3, the materials and methods of the proposed system are discussed. Experimental results and discussions are presented in Section 4. Conclusion and future research directions are presented in Section 5.

2. Related Work

This section highlights significant contributions made to patient health monitoring systems and architectures. There are many IoT-based healthcare applications developed to monitor patients health remotely [14]. Health monitoring platforms are developed based on IoT architectures for monitoring chronic and acute diseases. In the literature, some studies focus on the integration of IoT in healthcare solutions [15]. These IoT-based healthcare systems reduce the costs of treatment for the elderly by developing platforms and applications to improve healthcare services. Moser et al. proposed a cost-effective platform to allow a person to monitor their health conditions and prescribe treatment related to the diseases [16]. Turner et al. proposed a smart device-based platform based on a microcontroller, HR sensor, and electro pads for doctors and patients to monitor heart rate to avoid severe health damage [17]. Heart rate and body temperature are essential human body traits for determining health conditions. A healthy adult person’s normal pulse rate is between 60 and 100 beats per minute. The average heart rate is 70 beats per minute for males, and for females, average heartbeats are 75 [18]. Diabetes is a prevalent disease throughout the globe. According to a health report from the world health organization (WHO), 422 million people have diabetes, which is increasing day by day [19]. In [20] the authors’ proposed smart health monitoring platform for determining patients’ health conditions using pulse oximeter(PO) sensor, body temperature(BT) sensor, glucometer(GM) sensor, body position sensor, electrocardiogram(ECG) and electroencephalogram (EEG) sensors. The sensing data is used to classify the patient conditions as normal and abnormal. Penmatsa et al. proposed an abnormality detection platform for heart rate sensing data for real-time health care assistance of doctors and medical specialists [21]. Studies assume that by 2025 there will be about 50 to 100 billion devices connected to the Internet [22]. IoT developers widely use Raspberry Pi and Arduino Uno to deploy IoT applications in the development stage. In the literature, Raspberry Pi was used for healthcare IoT systems to monitor respiration rate and rapid pulse detection [23,24]. Arduino Uno-based platforms were developed to monitor heart problems [20] , abnormality detection [21], diagnosing of hypothermia [25] and diabetes Mellitus [26]. A field-programmable gate array (FPGA) is used in IoT-based healthcare monitoring systems due to real-time performance and multi-sensing data handling [27].
In the literature, many studies attempted to integrate IoT in healthcare monitoring systems for elderly patients due to the growing numbers of the elderly population. Islam et al. [28] examined several IoT-based health monitoring application for elderly patients. Several studies proposed evaluation techniques for the efficiency, stability, and mobility of elderly patients monitoring systems such as Timed Up and Go (TUG). TUG is used to analyze the time required for different movement segments completion by the elderly subject. These segments include the time needed to getting up from a chair, walking for a 3-meter distance, then coming back and sitting again. The subject with higher TUG indicates a higher risk of falling from a chair. Another similar study presented in [29], proposed an accurate fall detection system based on wearable sensors. The wearable sensors, such as kinematic sensors, are used to evaluate the subject’s ability during the TUG, to provide a more accurate and decisive conviction of a possible fall [30]. According to a study presented in [31], a fall monitoring system based on a kinematic sensor discover the most decisive fall situation, which stimulates different fall scenarios. In [32], the authors proposed an algorithm to detect fall based on different parameters, such as the beginning stage of the falling subject, shock, aftershock, and posture stage. The authors also analyzed the changes in an acceleration vector based on these mentioned stages. Giorgi et al. presented a smartphone-based IoT system to detect the fall of elderly patients. In their study, a smartwatch act as a gateway to receive sensing data and send an emergency notification to the cloud once the fall is recognized [33]. Wu falin et al. presented a fall recognition and locating system based on wearable sensing devices ad Global System for Mobile (GSM). The authors used a 3D accelerometer(3D AM) sensor and GSM module to recognize and locate fall [34]. Some existing studies applied gyroscopes and barometers to detect fall and enhance the performance of the existing methods [35].
In paper [36], the authors presented a practical approach of a remote health monitoring system to monitor and track vital signs of remote patients using wearable sensors. Wearable sensors monitor vital signs such as blood pressure(BP), pulse, and count of red blood cells. The system generates a report based on vital signs and sends the patient’s medication recommendation to health authorities for further evaluation. In [37], the authors developed a health monitoring system to detect abnormalities of remote patients, such as the abnormal condition of ECG and HR. In [38], the authors presented a model to detect abnormalities in remote patients health conditions, which is used to overcome the critical conditions of the remote patients by following precautionary measures. This study also investigated security risks associated with the developed application in treatment support, diagnostic support, and remote monitoring. Furthermore [39,40], two techniques were proposed to encrypt medical data for securing data transmission in order to protect sensitive information. In [41], the authors proposed a cost-efficient approach for treating and monitoring patients through an IoT-driven health monitoring system. Revolutionized IoT models have been integrated with healthcare to reduce cost, time, and investment and enhance efficiency and privacy [42]. Patient health monitoring approaches based on battery-driven sensors are vulnerable to failure and energy consumption problems. IoT-driven remote monitoring systems frequently gather and send data to a nearby IoT gateway. The acquired sensing information are examined and monitored by the end-users or applications through the gateway. In the literature, the most common gateways used are smartphone or tablet to transmit the healthcare data to a distant physical resource [43].
IoT-based remote monitoring systems still suffer from different issues, such as reliability and delays [44]. Despite many efforts to make IoT-based health monitoring reliable and efficient, existing systems imposed a massive transmission load on sensing devices. These sensing devices have low power because of operating in a long-term mode. Consequently, it increases the energy requirements and decreases the overall system’s efficiency. Therefore, an optimized solution is needed to overcome the critical issues in the existing patient health monitoring systems. Applications based on data compression techniques are widely used to overcome energy consumption requirements. However, data compression techniques cannot be employed in IoT platforms because they consume energy, influencing the developed system’s efficiency. In summary of the related studies, there is a need for an elderly patient health monitoring platform that enables collecting the health data remotely from elderly patients to monitor their conditions at any time with high reliability and minimum delay. New elderly patient health monitoring platform should provide remote monitoring, fall detection, efficient decision support, and timely interventions and activities monitoring. The elderly patient health monitoring should be performed with minimum latency, high reliability, and minimum energy consumption. Table 1 provides a comprehensive summary of existing IoT-based health platforms.
Summary and comparison of health platforms are presented based on sensing resources, notification devices, usage applications, support for edge computing, open-source, advantages, and disadvantages.

3. Materials and Methods

In this section, the materials and methods used to design the proposed health monitoring system are discussed. The proposed methodology consists of a series of task orchestration steps, microservices analysis for health-tasks generation, creation of virtual objects from health devices, intelligent task mapping of health, and health task deployment on health devices in an IoT environment. 
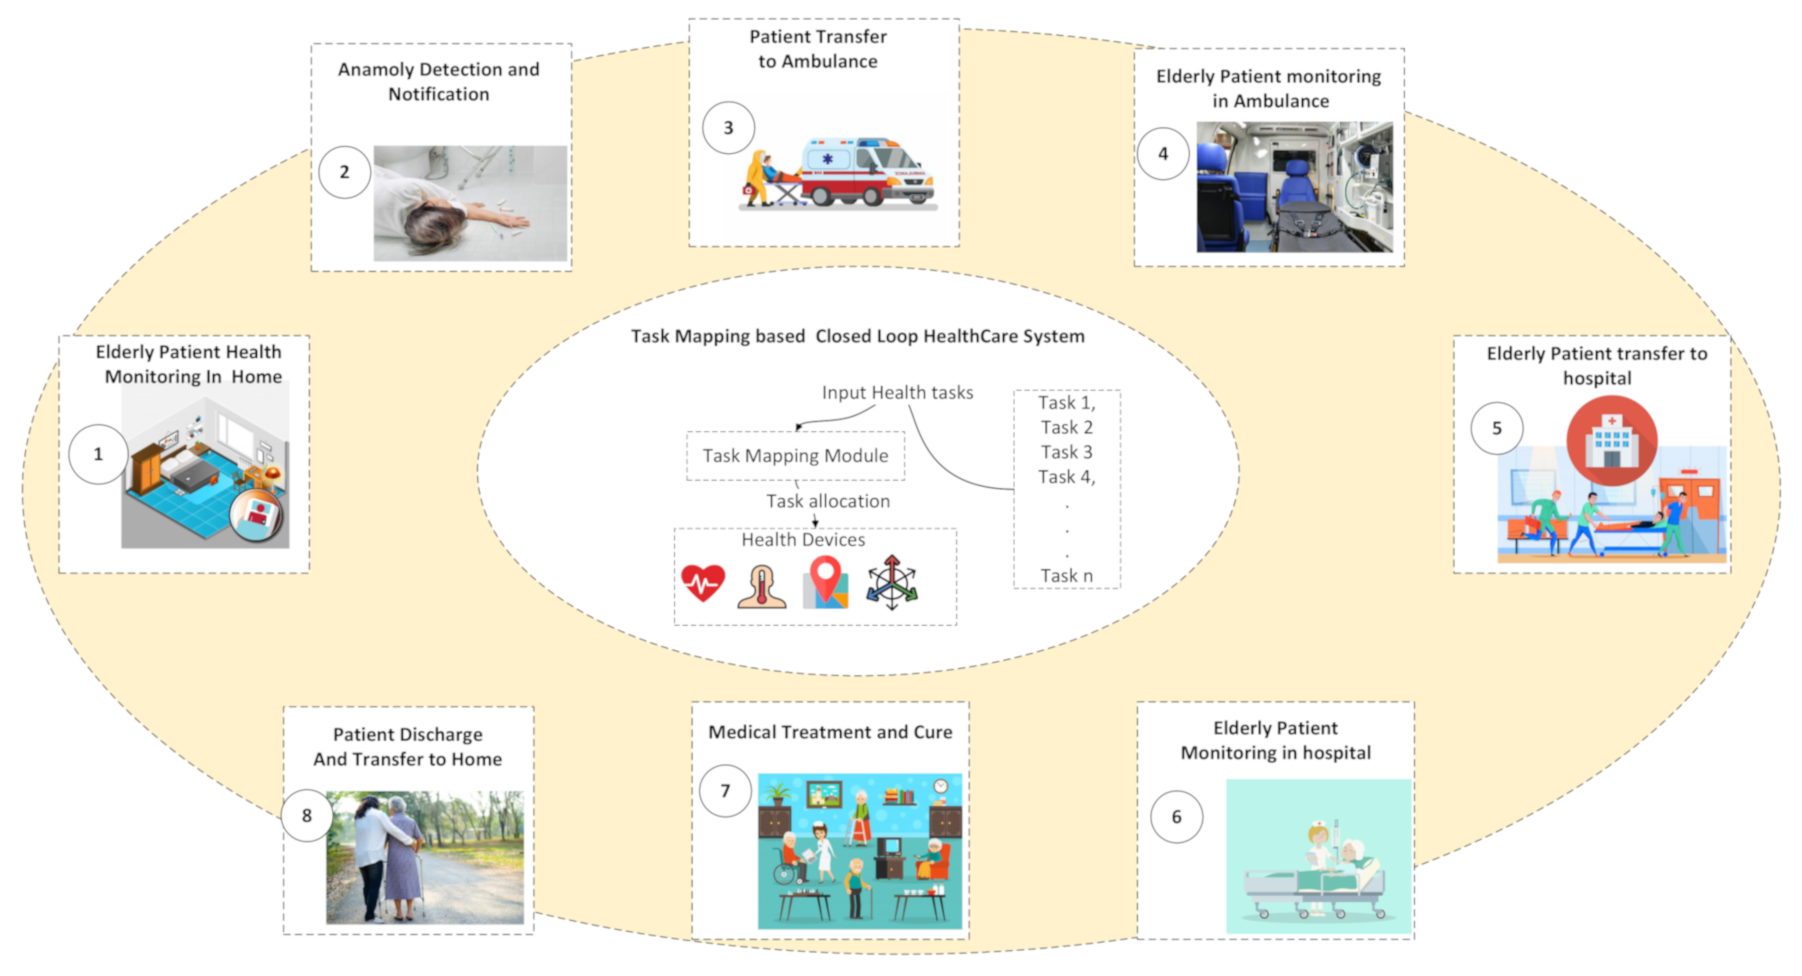
Figure 2 presents the flow of the proposed task orchestration approach using intelligent task mapping to develop E-PHMS. The first component is the elderly patient health monitoring service, which is analyzed to generate microservices such as elderly patient health monitoring at home, elderly patient health monitoring in the ambulance, and elderly patient health monitoring at the hospital.
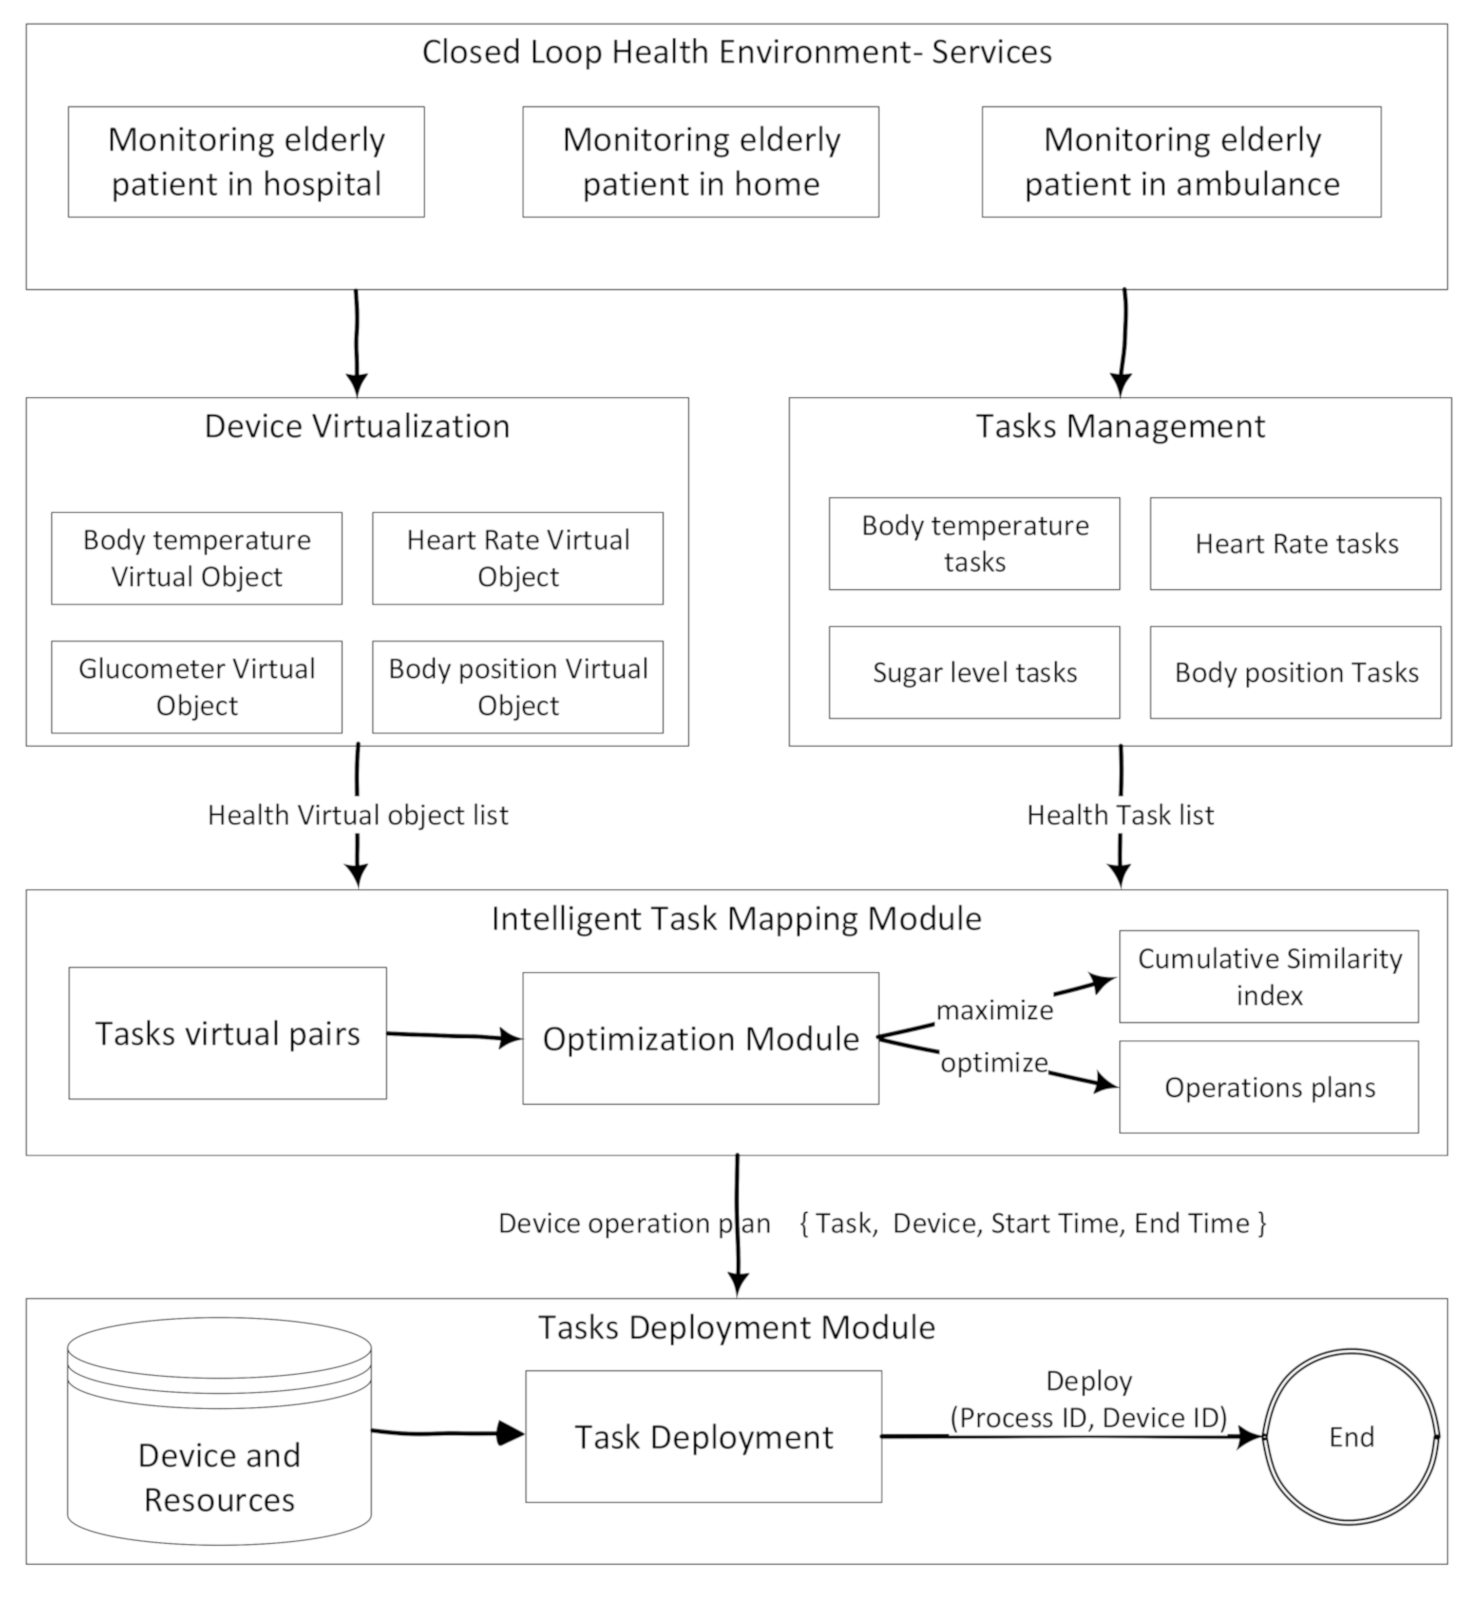
Health tasks are defined based on the generated task suggestions from the microservice analyzer component. Health tasks are functional units of health microservices. Health monitoring devices are the biomedical sensors used for monitoring patients. Health devices are virtualized into virtual objects using the virtualization module of the system. Virtual objects are connected to biomedical sensing devices using an attribute of the virtual objects called Uniform Resource Identifier (URI). Task mapping component map health tasks on health devices based on the optimal order received from the proposed task mapping algorithm. The proposed task mapping algorithm uses objective optimizations based optimization approach to generate optimal devices operations plans. For ease of understanding the concept, the mapping component visualizes the results task mapping algorithm in a mapping window, showing a visual connection between virtual objects and health tasks. Finally, device operations plans are used to create processes for execution on one or more biomedical sensors. The process of executing a health task on a health device is called health task deployment.
Six layered architecture for the design of an E-PHMS is presented in Figure 3. IoT health devices layer is composed of environmental and body area sensors. Examples of body area sensors are a body temperature sensor, heart rate sensor, accelerometer, and a glucometer. Example of environmental sensors includes thermal comfort monitoring sensors and actuators. The Device virtualization (DV) Layer creates virtual objects based on the health monitoring devices from the IoT health devices layer. The DV layer is managed by the device virtualization manager(DVM). DVM functionalities include creating virtual objects and registering the virtual object in the E-PHMS IoT server’s registry. DVM also provides a mechanism for the visualization of health devices in the E-PHMS dashboard.
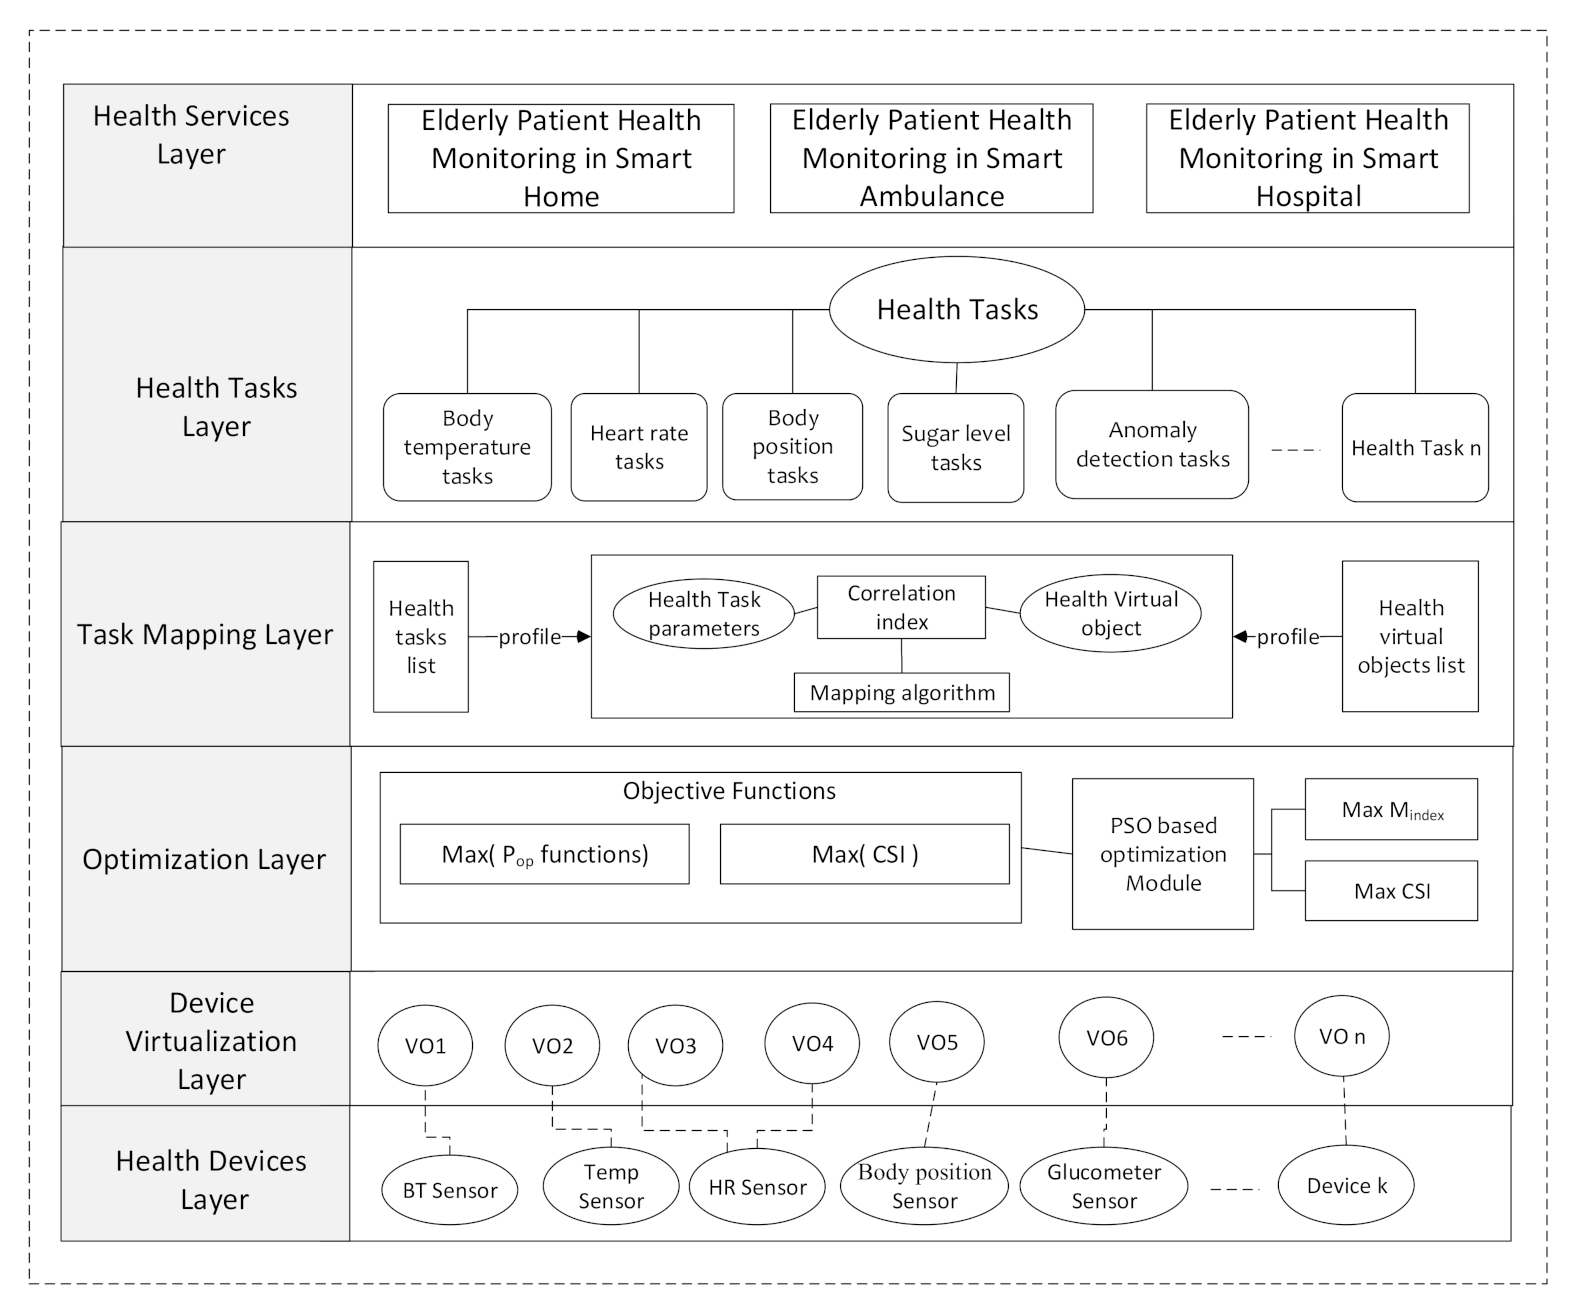
Micro-operations, also known as health tasks, are assigned to one or more virtual objects. A virtual object emulates the features and attributes of health monitoring devices. The health tasks layer provides task-level management of health monitoring microservices. The tasks Mapping (IM) layer provides a mechanism for generating tasks and virtual object pairs. The TM layer input health task attributes to task mapping algorithms to generate optimal ordered pairs of health tasks and virtual objects. The optimization layer provides optimization schemes to generates these ordered mapped pairs based on optimal health devices operation plans. Optimal health device operation plans are obtained by maximizing the objective function results. The ordered task mapping pairs are used to create processes. These processes are executed on health monitoring devices.

3.1. Mathematical Formulation of Task Mapping Algorithm

In this section, mathematical formulation of objective functions of the intelligent task mapping scheme is presented. In the later part of the section, the proposed task mapping scheme is discussed in algorithmic form. The list of symbols used in the formulation of the objective function is described in Table 2.
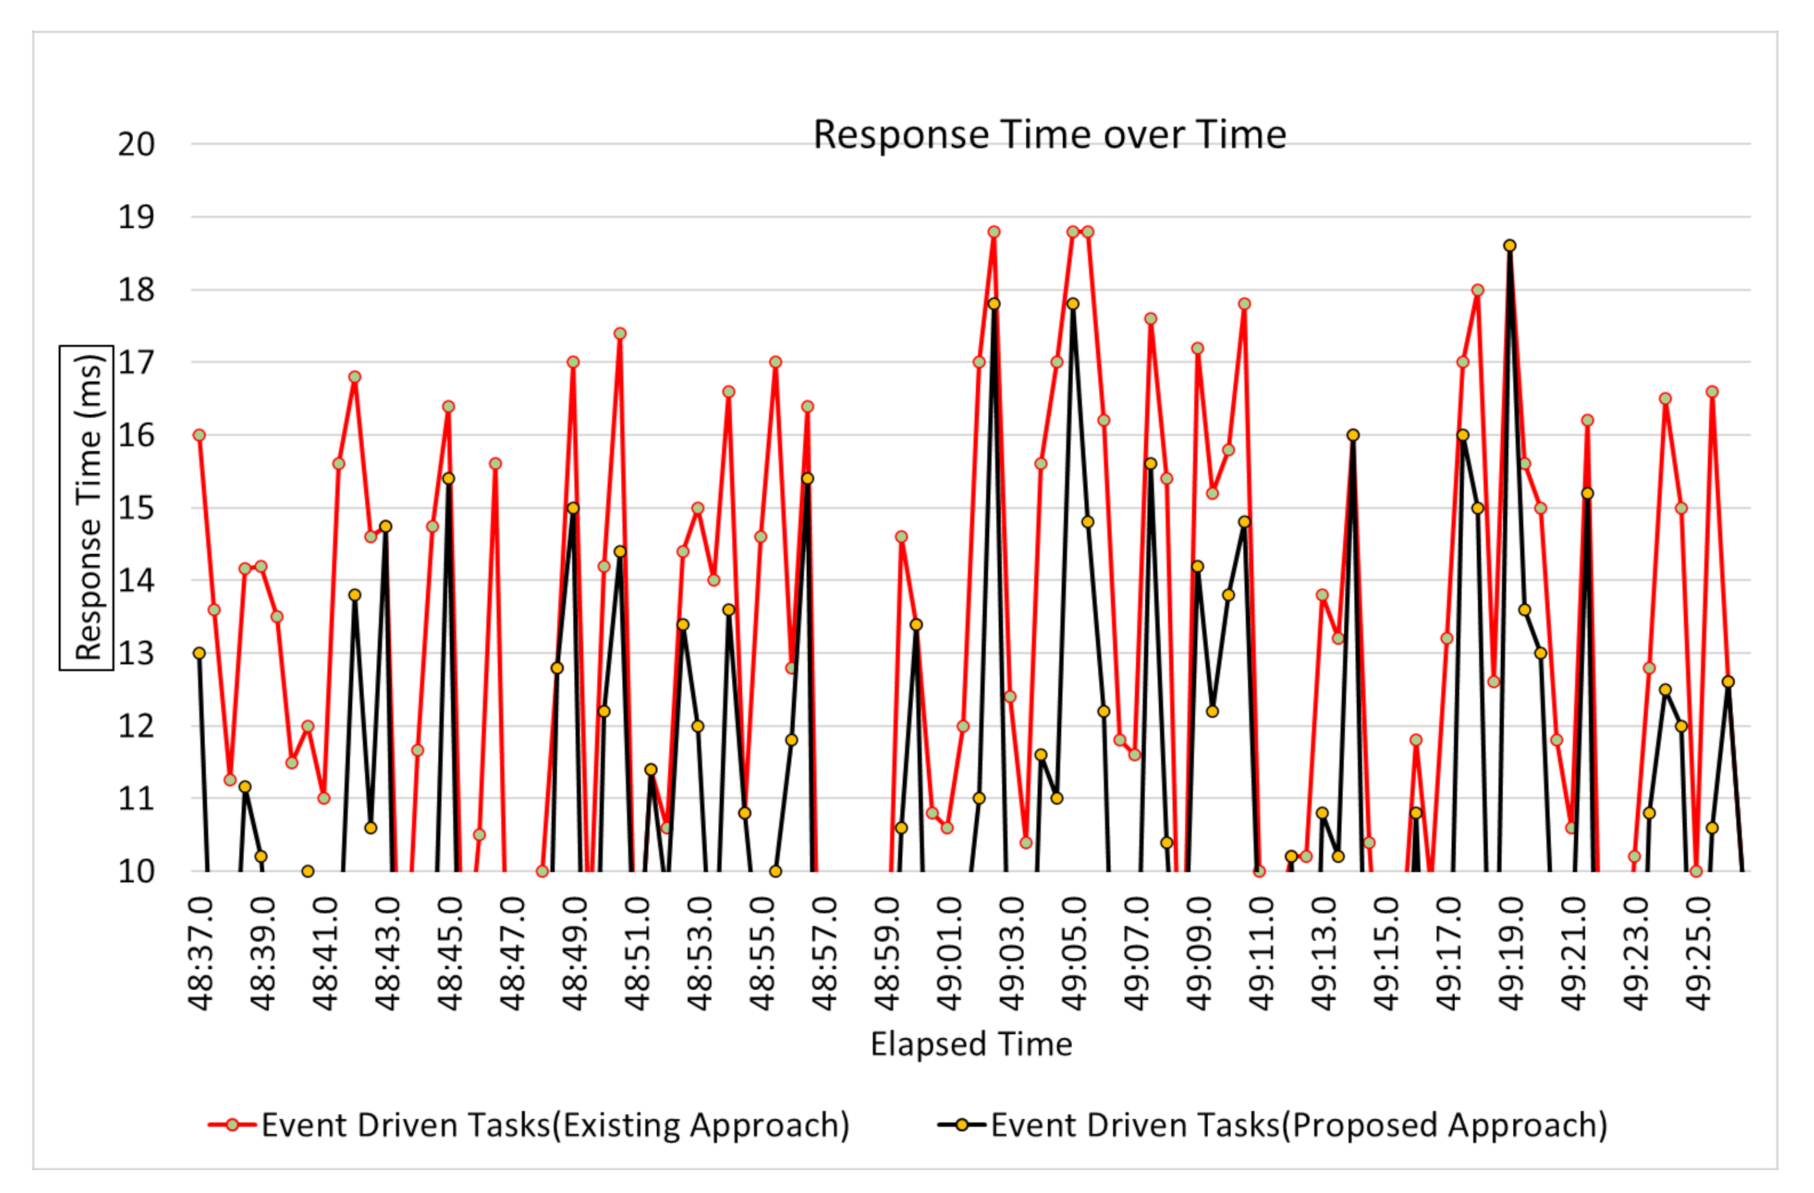
In the E-PHMS case study, there are a set of tasks performing health monitoring operations on health devices. There are two types of tasks, periodic and event-based tasks. An example of periodic tasks is sensing tasks such as body temperature tasks. An example of event-driven are tasks that are executed when some event is detected by the system, such as patient fall detection tasks. Consider the set of health tasks in S h e a l t h are H t a s k 1 , H t a s k 2 , H t a s k 3 , H t a s k 4 , . . . H t a s k n responsible for health operations on health devices H d e v i c e = H d e v i c e 1 , H d e v i c e 2 , H d e v i c e 3 , . . . H d e v i c e n . A health task H t a s k is a functional unit of the health monitoring services for performing a unit operation such as monitoring the body temperature of the elderly patient. For instance, report-body-temperature and get-body temperature are examples of two distinct unit health tasks. A task can be allocated on one health virtual object H V o or on a set of health-virtual objects H V o 1 , H V o 2 , H V o 3 , . . . H V o n .
A health task is an operation performed by a health monitoring device, or in other words; health device operation is a health task in execution, i.e., T h e a l t h = P . A health task must be executed based on an optimal mapping index. Before starting the discussion on the optimization scheme for optimal mapping index, constraints are discussed. Each health task has attributes such as duration, period, priority, worst case finish time, start time, finish time, and delayable time. The system sets the priority of the tasks; for example, the system will prioritize event-driven tasks compared to regular periodic tasks. Each task is executed on the health device using its related process. A process is created based on one or more tasks using the priority of a task, task mapping index, and list of devices on which the process will be executed.
Based on the constraints discussed, the task mapping algorithm computes a function using optimization objective function which propels the health tasks arrangement in such a way that maximum task delayable time is achieved. Tasks delayable time is maximized based on task start and finish time assignment to obtain optimal cumulative T d t m . Optimal T d t m is given by :
T d t m = i = 0 n T w c f t s T d u r a t i o n
where T d t m of cumulative delayable time of arranged tasks list, delayable time of health task is the time till which health execution can be delayed. T w c f t s and T d u r a t i o n are the worst-case finish time and duration of T h e a l t h respectively. For the mathematical presentation of the task mapping mechanism, examples of body temperature, heart rate, and body position sensors are taken as elderly patient health monitoring devices. However, the number of devices can be increased for monitoring more complex situations. Based on these sensors’ profile descriptions, generated health tasks are given in Table 3. The health task parameters presented are in milliseconds. T w c f t s , T d u r a t i o n attributes are the primary constraint considered; however, some other health task attribute can be considered to maximize the cumulative delayable time all of tasks arrangement.
The next step of the intelligent task mapping mechanism generates possible health tasks and virtual objects pairs such as get-body-temperature, body temperature sensor, get-heart-rate, heart rate sensor. The intelligent task mapping approach’s objective is to find tasks devices pairs list, which leads to a maximum of M i n d e x . M i n d e x is the task device mapping index that finds optimal operation plans of the health monitoring devices. Table 4 presents ordering of health devices operation plan.
Task device mapping index is a function of maximizing the delayable time of device operations plans. If the task device mapping index is maximum, the delayable time of device operations plans will be maximum and vice versa. Task device mapping index ( M i n d e x ) is given by :
M i n d e x = m a x ( P o p f u n c t i o n )
where P o p function provides device operation plans to maximize resource use. Table 4 presents ordering of Health Devices Operation Plan. P o p of health devices, H d e v i c e 1 , H d e v i c e 2 , H d e v i c e 3 , ... H d e v i c e n is given by: P o p function of health devices is computed as follows.
P o p f u n c t i o n ( H d e v i c e x , H d e v i c e y ) = 1 1 + T v a c a y
Maximum M i n d e x means optimal devices operation plan with short idle time and high delayable time. Table 5 presents task allocations on different health devices and its impact on cumulative similarity index (CSI). Task allocation based on a maximum M i n d e x means that task allocation based on the device operations plans is flexible. The flexibility of the architecture highlights the reliability factor of the proposed architecture.
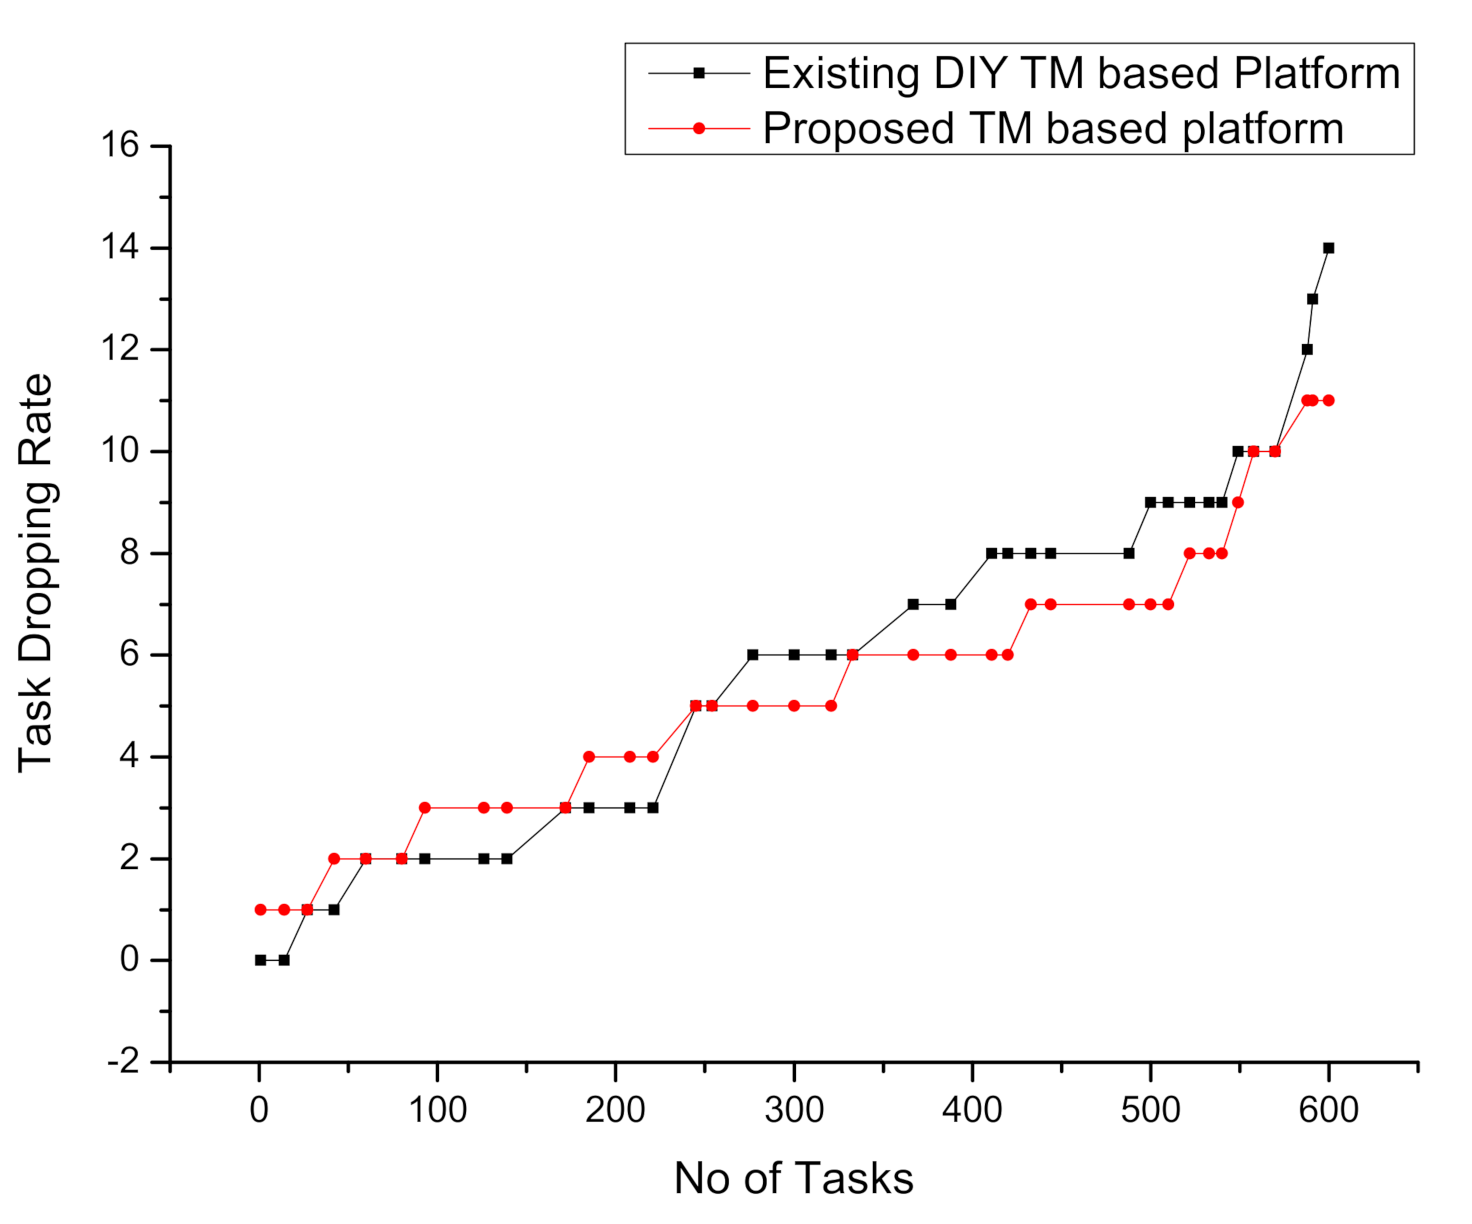
If delayable time is low, then changes in the task mapping plan may make the delayable time negative, and hence health task will be dropped. The high task drop rate means low reliability of the system and vice versa. Many literature studies highlight the importance of reliability and network delay in critical task applications. The group of devices with a maximum M i n d e x reside in the same network; thus, delay for a request to devices is less compared to devices belonging to a different network. Thus, maximum M i n d e x also minimizes network latency. The main objective of the intelligent task mapping mechanism is to find a set of devices that contribute to the highest CSI. The objective function goal is to maximize CSI. The CSI of a network is given by:
C S I = i = 0 n ( C M i n d e x i )
M a x ( C S I ) = M a x ( i = 0 n ( C M i n d e x i ) )
C M i n d e x i = i = 0 n j = 0 k ( M i n d e x i + M i n d e x j )
Based on the CSI equation, the task mapping module’s job is to find device operational plans within a network to maximize the CSI. Maximum CSI also means a reliable and efficient plan of devices and tasks arrangement; hence it will lead to a flexible task mapping plan and the most scalable task orchestration architectures.
The proposed task mapping algorithm uses the optimization scheme mentioned above for task allocation on devices with optimal cumulative task mapping index C M i n d e x i . The algorithm’s input are, list of health tasks and health devices H d e v i c e . For each health device, a virtual object is generated; these virtual objects are added to the list of virtual objects. Next, a greedy approach is used to generate all task virtual object pairs. For each task pair, maximum delayable time is computed for the execution on the health device. In the next step, device operation plans for the health devices are calculated. The mapping index is calculated based on the task mapping pairs and function from a set of health devices operations plans. This individual mapping index is summed to the cumulative mapping index. The algorithm (Algorithm 1) uses the cumulative mapping index to compute the cumulative similarity index. Finally, processes are created for device plans with a maximum cumulative similarity index. The process is allocated to health monitoring devices.
Algorithm 1: Task Mapping Algorithm
Symmetry 13 00357 i001

3.2. Implementation Environment

In this section, the discussion on the implementation environment for the E-PHMS application development is presented. The E-PHMS application is developed based on the proposed intelligent task mapping-based task orchestration architecture. The IoT server is developed on Raspberry PI devices. Three Raspberry PI devices are used for emulating home, ambulance, and hospital environments. For health sensors, the e-Health sensing platform was used, which provides support for many health sensors. This toolkit comes with many biomedical sensing devices. Table 6 presents the implementation environment of E-PHMS.
Body temperature, heart rate, body position, and blood glucose level sensors were used for the case study of E-PHMS. These devices are connected to the IoT servers configured on Raspberry PI devices. The IoT server maintains the registry of these health sensors after devices’ virtualization into virtual objects. The registry contains information, including connectivity status and URI of these sensing devices. E-PHMS application was deployed on a PC server where flask-based web server was configured. E-PHMS application is mainly programmed using python language based on the model view controller paradigm(MVC). The application identifies each sensing device using URI for the deployment of a health task. The application send HTTP-based request to the IoT server using the URI of the device, and the IoT server parses the request. The requested operation is executed on the health device, and the response is sent back to the application in the form of a JSON object. E-PHMS application parses the JSON object into a user-friendly HTML-based presentation.
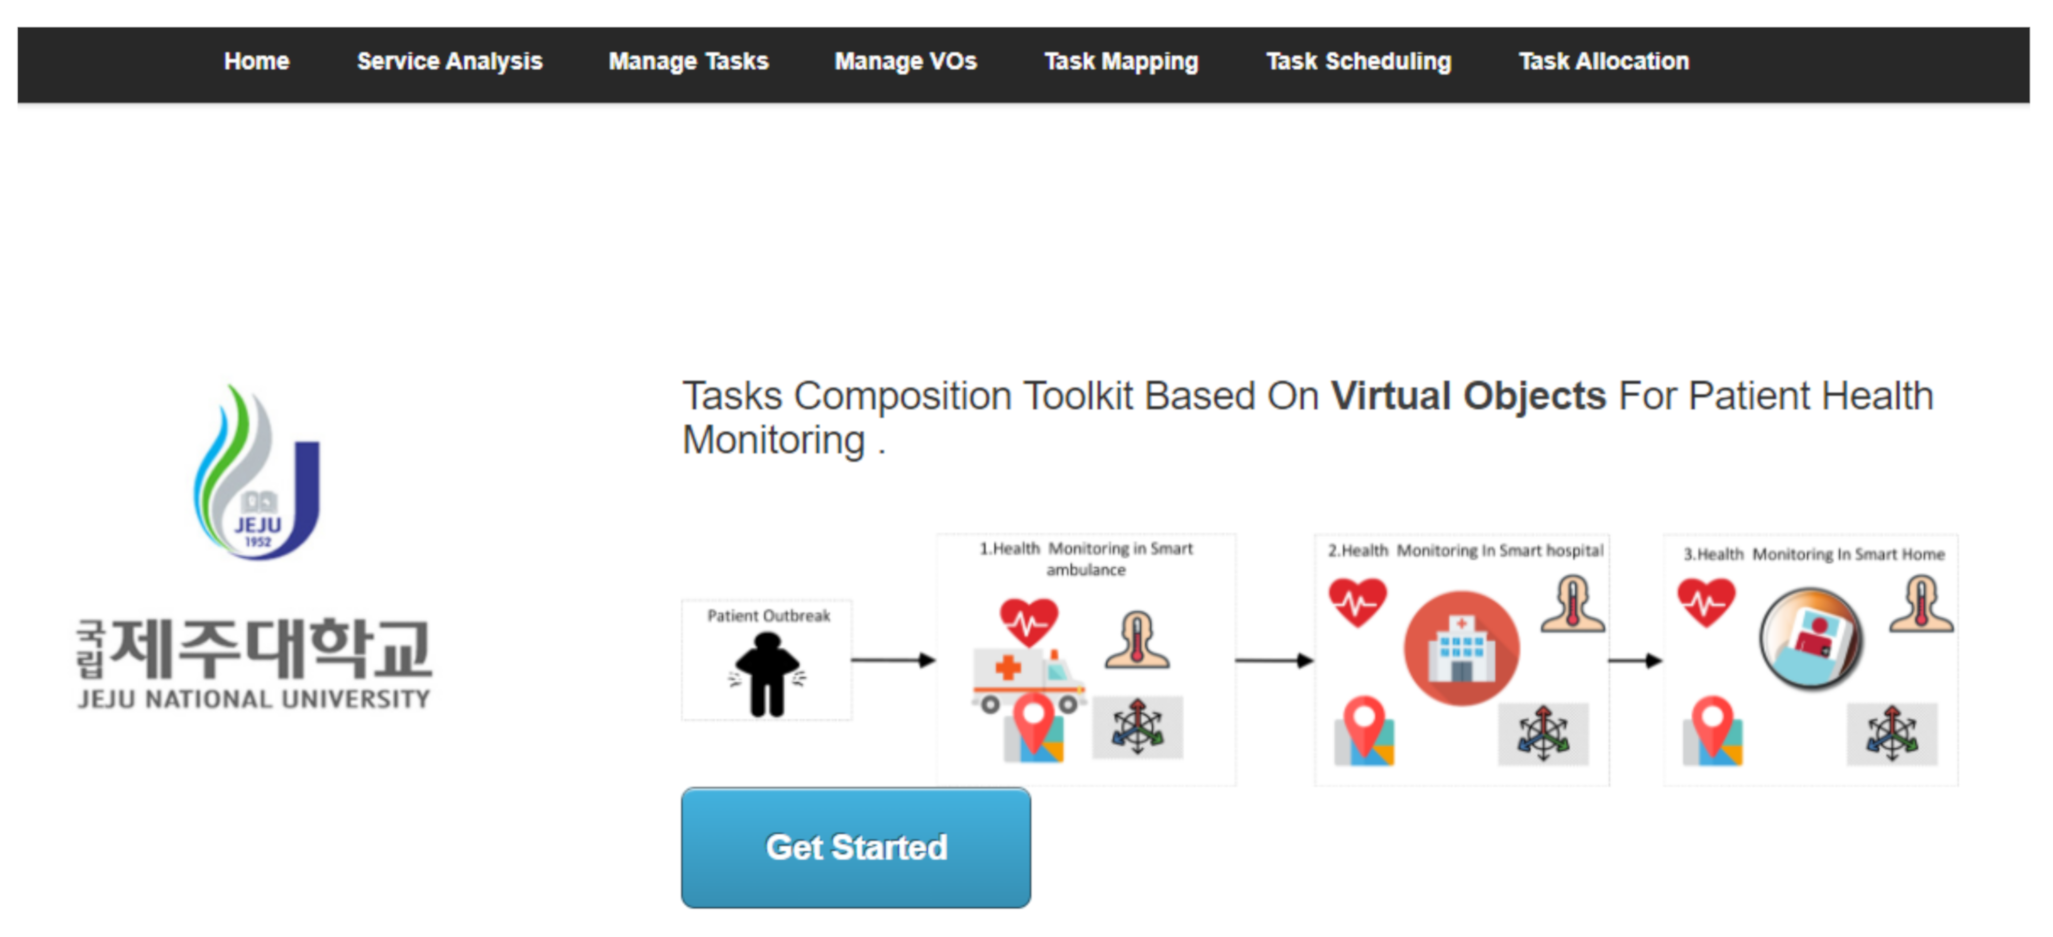
Figure 4 represents the developed health monitoring application using the task composition toolkit based on intelligent task mapping. The service analysis menu is used for health monitoring services, and the manage tasks menu is used for tasks level management. Task mapping menu provides task mapping scheme interface. Task scheduling menu visualizes tasks virtual objects ordered pairs using timeline chart. Task allocation represents task deployment results of elderly patient health monitoring services.
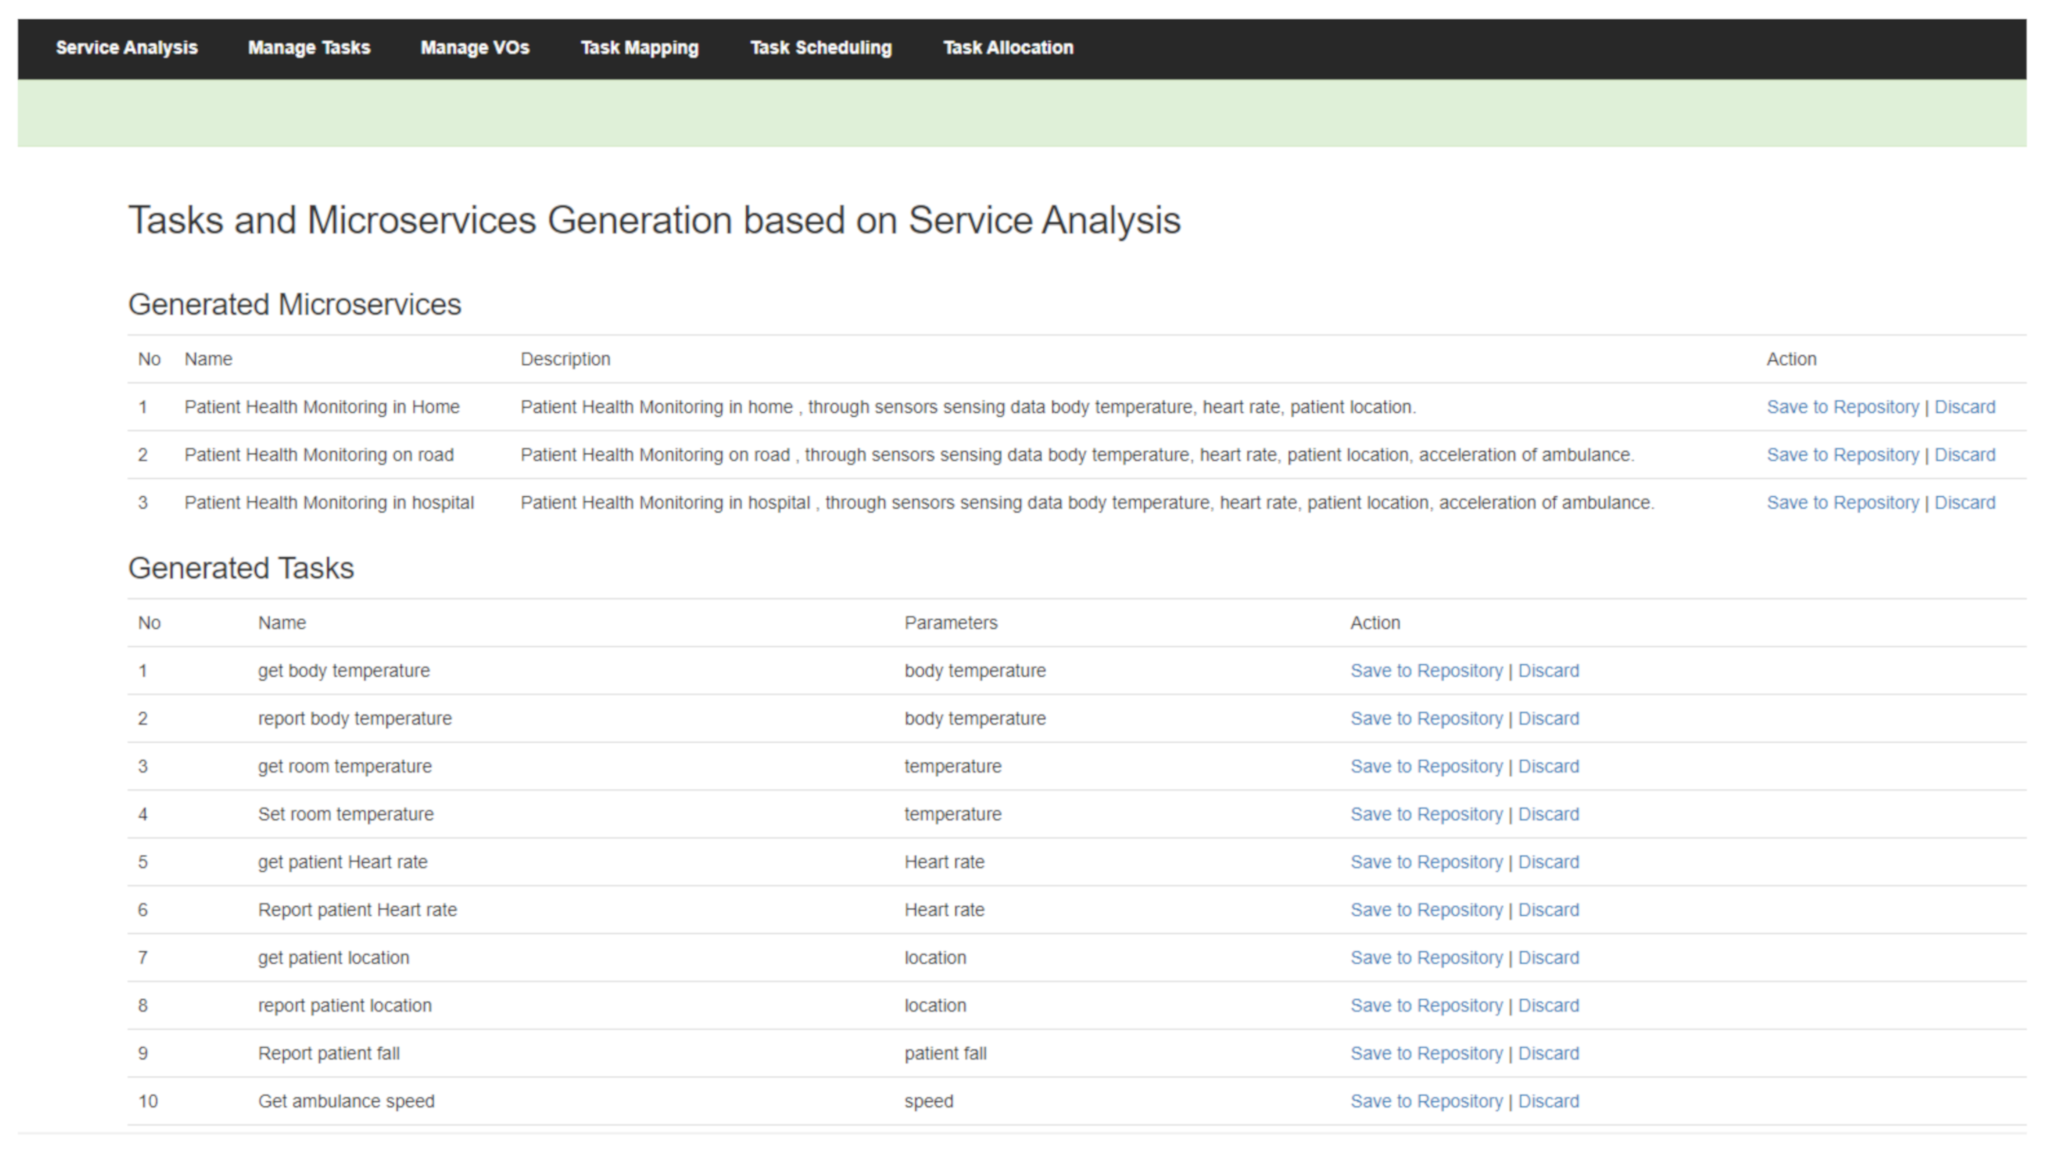
Figure 5 represents health task and microservices generation window that shows the visualization of the health tasks suggestion based on the microservice analyzer component. Three microservices of patient health monitoring along with ten health tasks are generated by the microservice analyzer component using the service description. The automated suggested tasks and microservices can be saved to the repository or discarded. However, the application also provides manual addition of tasks and microservices. Health tasks and microservices are generated based on the description of the services needed by the health authorities. E-PHMS application uses natural language processing (NLP) library NLTK. E-PHMS application is scalable to other health microservices and tasks using a manual approach. Microservice and health task forms are used for manual entry. Apart from adding new microservices, existing microservices and tasks can be removed or edited using the E-PHMS application dashboard. The save to repository option is used to save tasks and microservices permanently in the database. MySql was used as a database server; however, any alternative database can be used. Manage tasks menu is used for tasks profile management, whereas manage VOs menu is used for device virtualization and device profile management. Tasks allocated on devices can be accessed through the "task allocation" menu. The proposed task mapping algorithm generates devices and health tasks operations plans for the generated tasks and virtual objects. An optimal device operation plan results in an optimal ordered list of tasks virtual object pairs. An optimal devices operation plan is selected for task allocation on the sensing device to maximize the time until which a task can be delayed and minimize the delay for a task that needs to be executed first. For task allocation, the system creates processes from the device operation plan. The process is deployed on the IoT device using the URI. As discussed above, the IoT server registry contains information on all health sensors and actuators. For example, the URI of the device contains the ID and a message. IoT server parses this message using the decoded mechanism to deploy the process on the device.
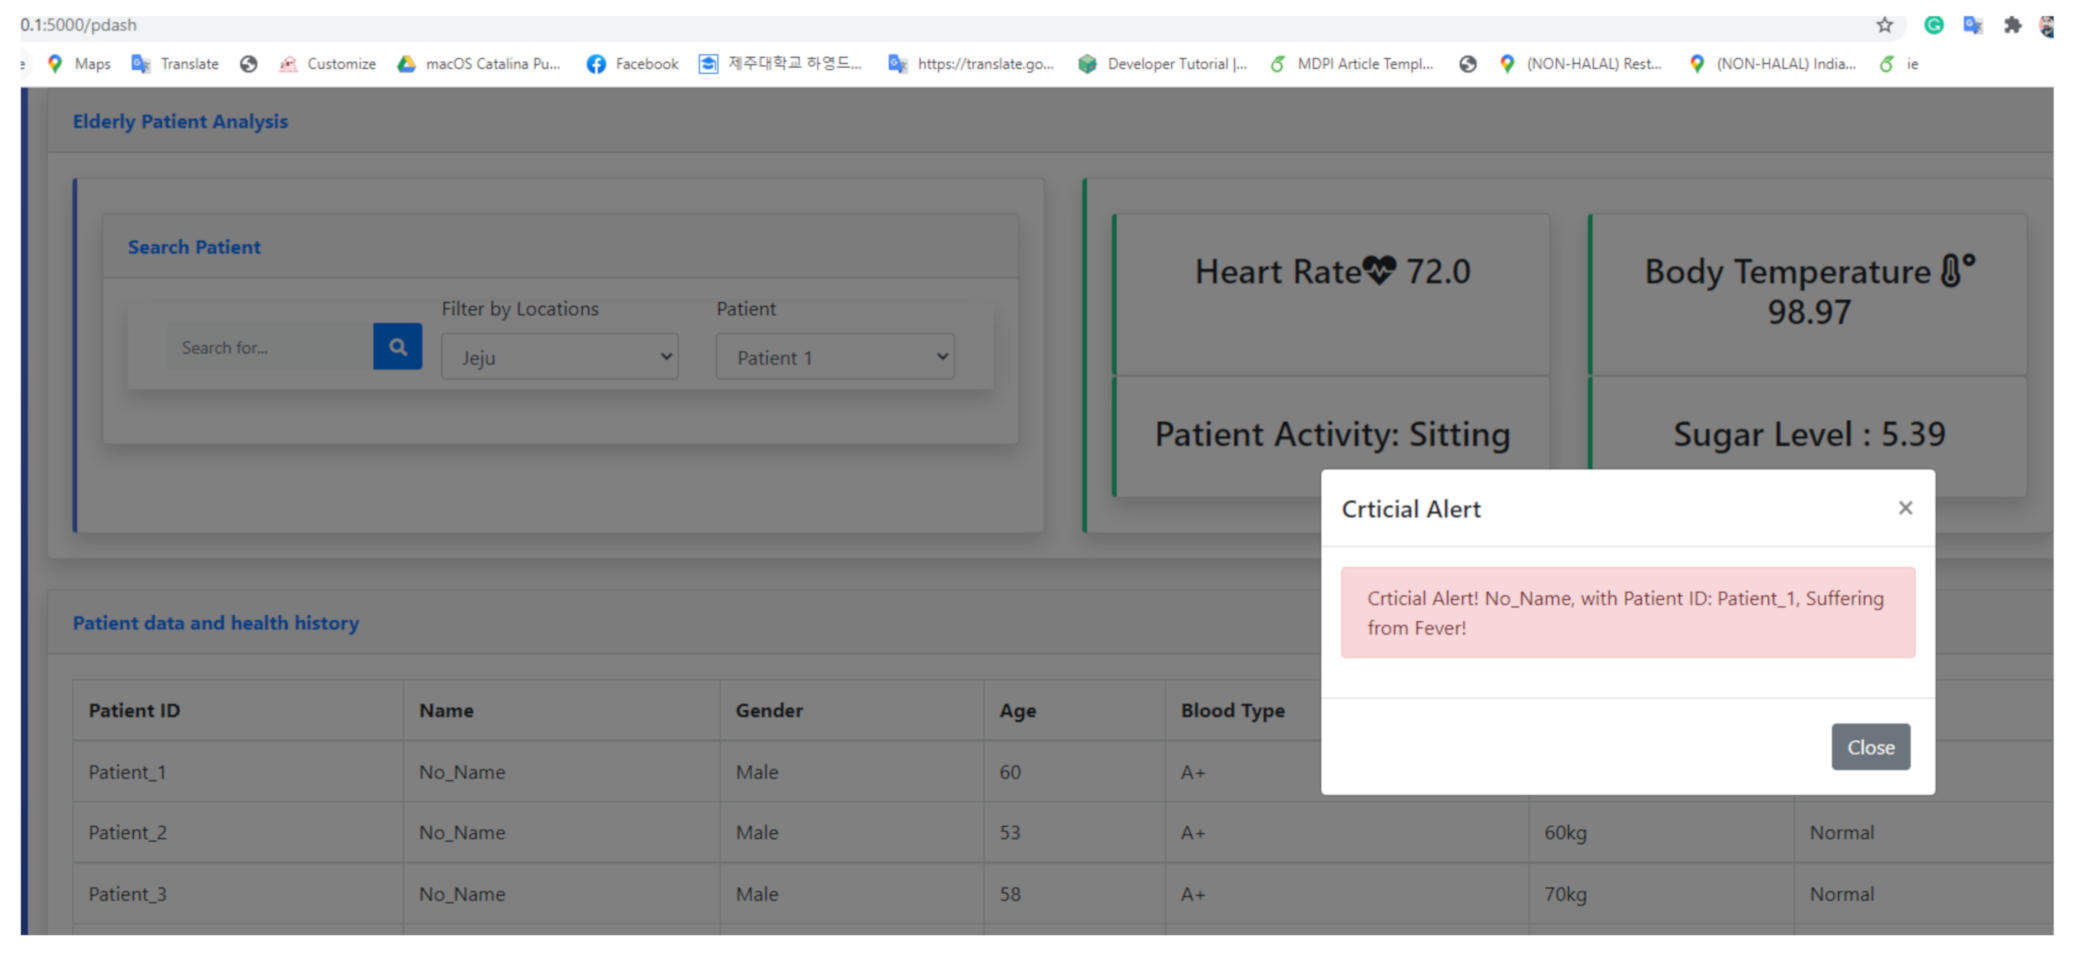
Figure 6 represents anomaly detection using the E-PHMS application. E-PHMS application displays the task execution results in a graphical user interface, as shown in the Figure.
For instance, the body temperature, heart rate, body position, and blood glucose level tasks are visualized in the figure. Once an anomaly is detected in the results from task execution based on the threshold-based method, it is notified using dialogue alert, alarm, and call alert. Anomaly detection based on the body temperature data is shown in the figures. The dialogue shows the notification of a patient suffering from fever. Anomaly detection based on the health sensing data is discussed in detail in the results and discussion sections.

3.3. Data Presentation and Assessment

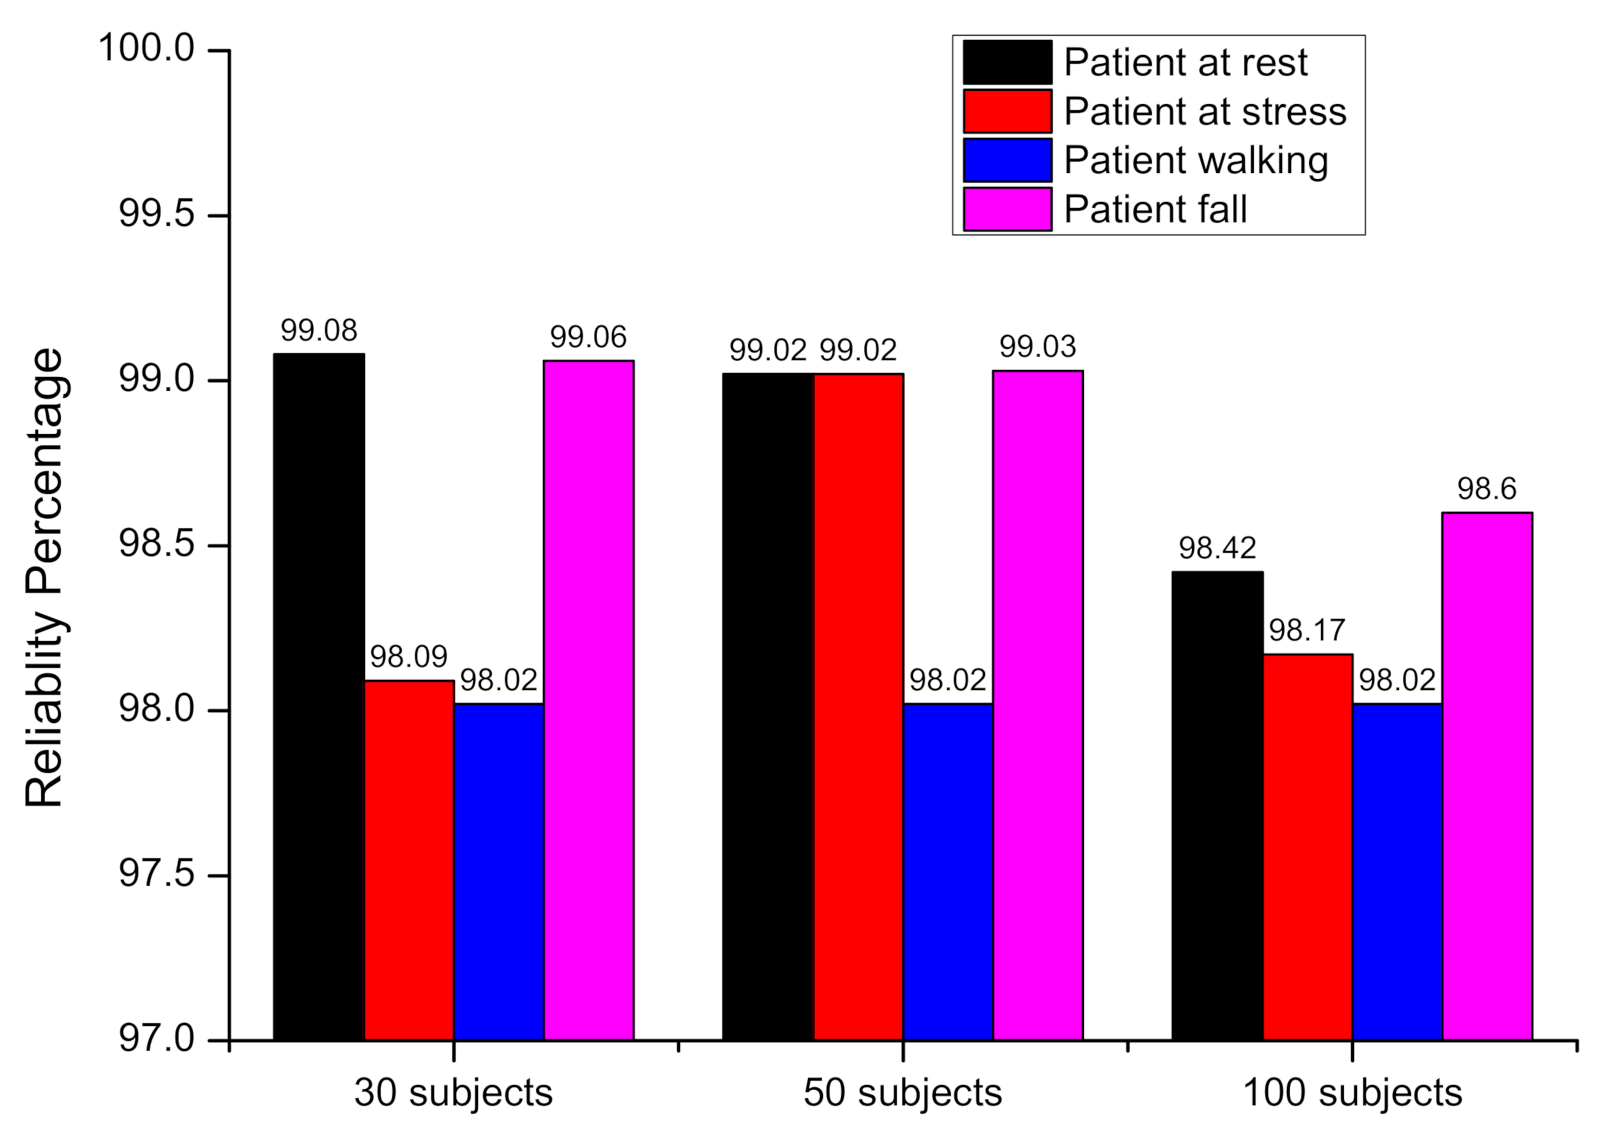
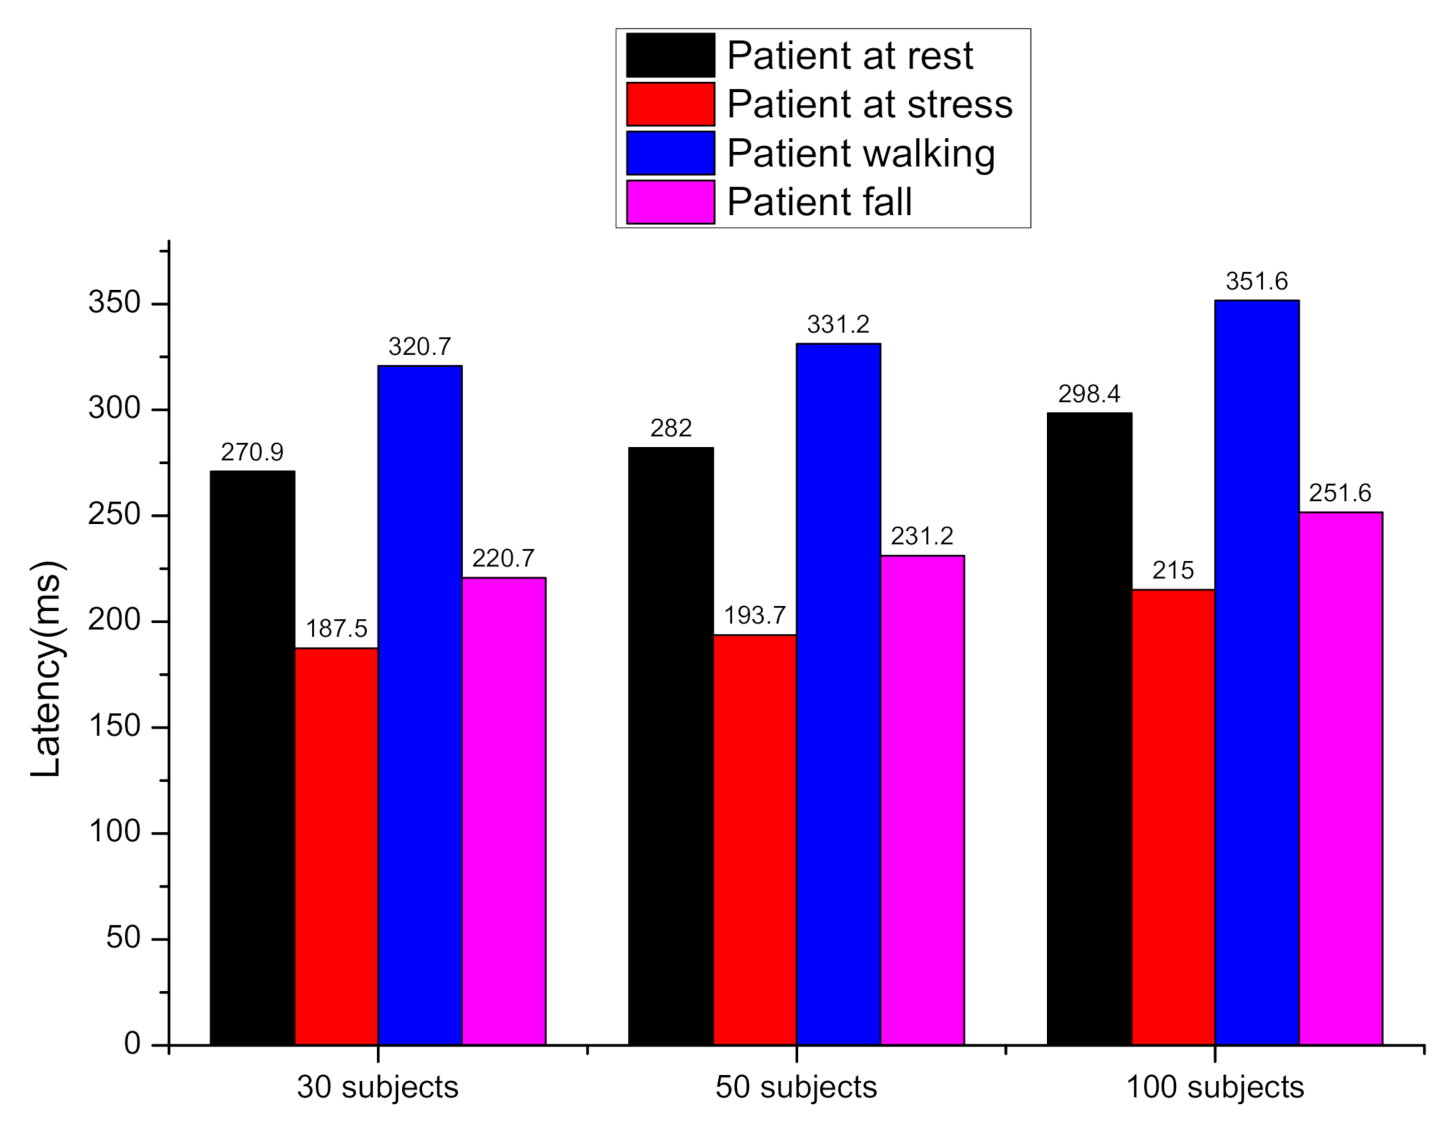
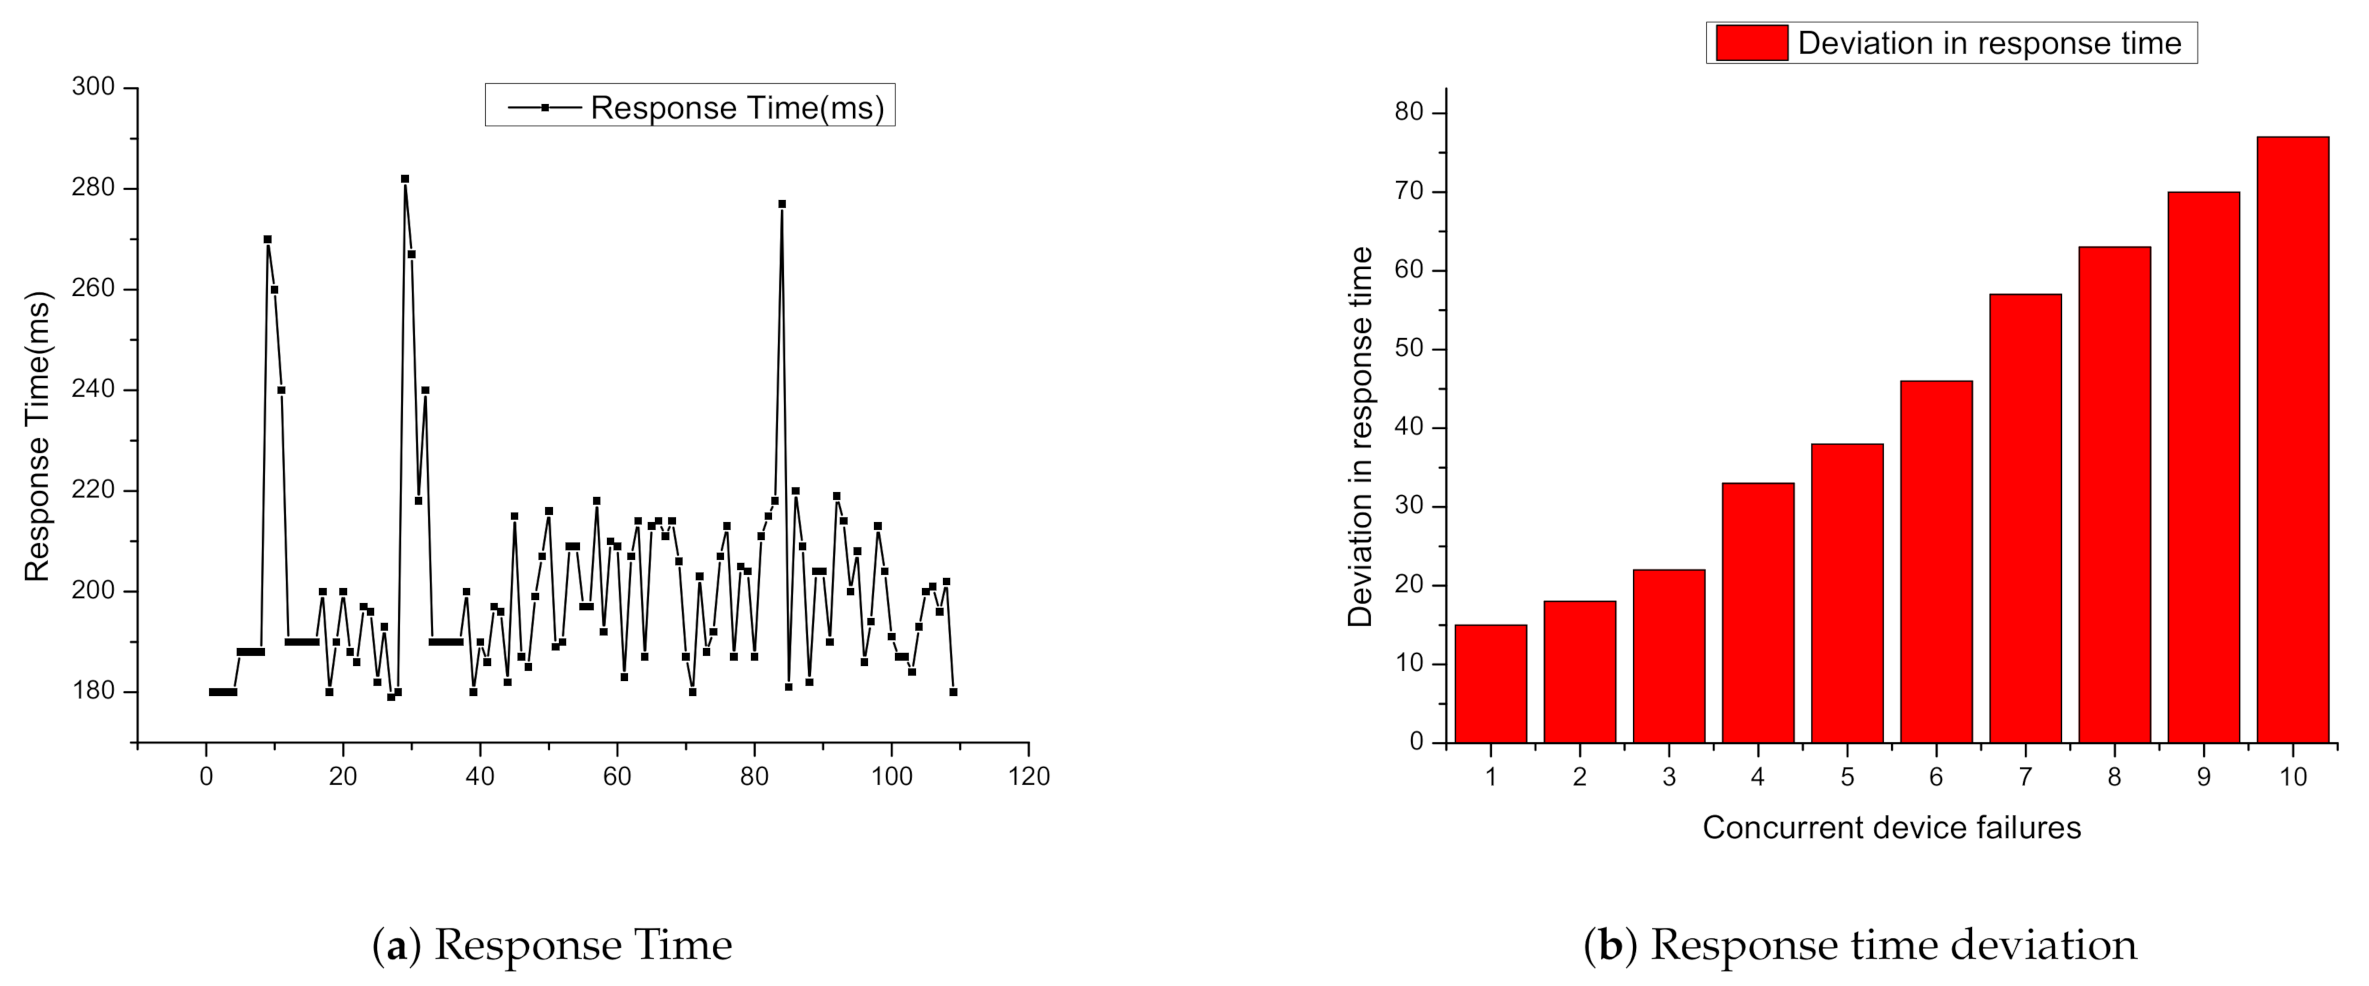
The system is evaluated using two types of subjects data, first with a real test using 30 volunteer subjects wearing the biomedical sensors and performing activities such as walking, sitting, standing, falling, and jogging. Other performance evaluation tests such as reliability, round trip time (RTT), and latency were conducted in a simulation environment for three sets of virtual patients of 30, 50 and 100 users. For the simulation of various user sets, the Locust load testing tool was used. Pox-based simulation of devices were used to investigate sensing devices failure effect on the response time. The devices were power off to induce device failure error. The experiment of 30 subjects has been done in the Mobile computing laboratory of the computer engineering department of Jeju National University, Jeju, South Korea. A total of 1440 data instances was recorded for different activities of these 30 subjects. Heart rate, body temperature, blood glucose level, and body position was recorded using wearable sensors. Statistical data of 30 subjects sensing data are presented in Table 7. The average heart rate recorded during the experiment is 73.4. Heart rate is calculated based on the number of times a heart beats in one minute. A healthy heart function is to supply the right amount of blood at the right rate for body activities. For example, running or walking fast will make the heart rate faster. The average body temperature recorded is 97.1, and the average blood glucose level recorded using a glucometer sensor is 5.61. Minimum, maximum, average, and standard deviation were used to statistically analyze the collected data.
Heart rate, body temperature, and blood glucose level are essential human body traits to identify normal and abnormal health conditions. 
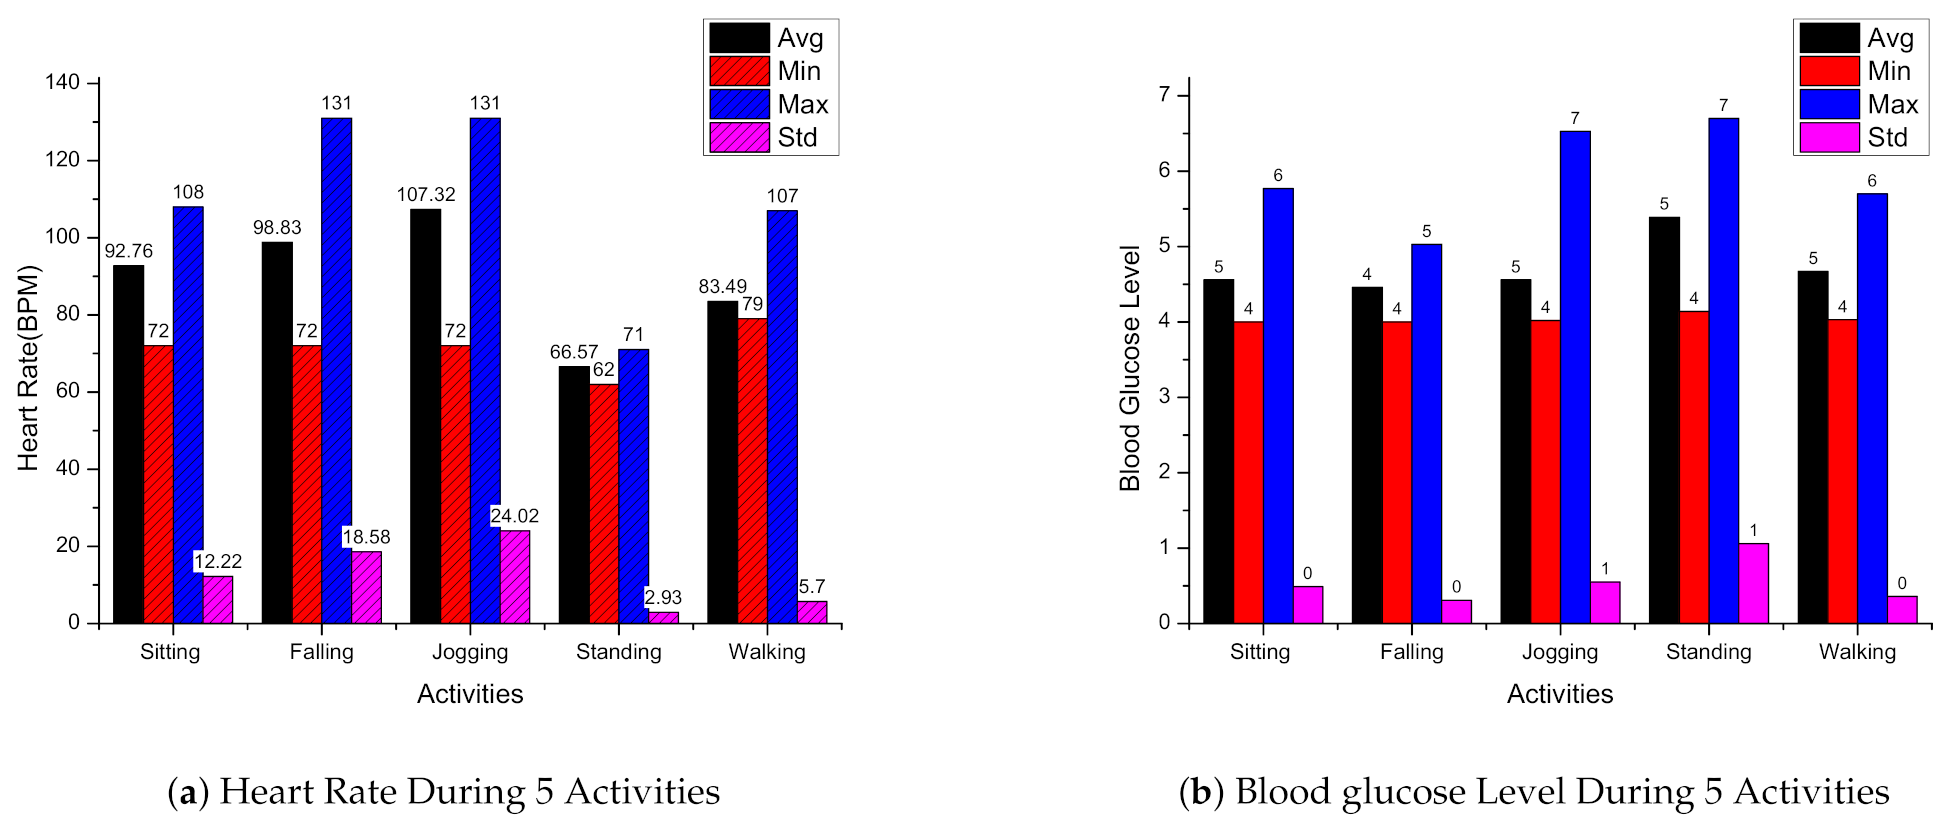
Figure 7a represents the average, minimum, maximum, and standard deviation of heart rate data collected during the subjects’ activities. Figure 7b represents the average, minimum, maximum, and standard deviation of blood glucose level data collected during the subjects’ activities.
If an elderly patient has a disease or injury, it will weaken the heart, and the body organs will not receive enough blood to function normally. A human being’s heart rate gets progressively slower when a person moves towards adolescence. The normal heart rate, body temperature, and blood glucose level are analyzed to set a threshold for anomaly detection and alarming abnormal behavior. Heart rate data is in beats per minute (BPM), whereas blood glucose level data is in millimoles per liter (mmol/L).

4. Results and Discussions

In this section, the results of the proposed elderly patient health monitoring system are discussed. Data analysis is performed based on the data obtained from E-PHMS. Threshold and machine learning-based mechanism used for anomaly detection is discussed. The later sub-section discussed optimization module results, performance analysis, and discussion on the proposed architecture’s comparison and significance.

4.1. Anomaly Detection

Anomaly detection is used to detect an abnormal event occurrence that deviates from regular events. In the elderly patient monitoring case study, analysis of collected sensing data has been made from the wearable sensors to determine anomalous behavior in terms of the defined threshold. Two approaches were used for detecting abnormal behavior in elderly patient health monitoring environment. The first one is based on a simple threshold method, and the second is machine learning-based predictive models for identifying abnormal behavior based on past historical data. Table 8 presents threshold information for detecting abnormalities from the sensing data of heart rate and body temperature sensors is presented. A threshold is defined for normal and abnormal heart rate and body temperature. In the future, this threshold for different abnormal situations can be extended to identify more abnormal behaviors. Some abnormal behavior on which the system will raise the alarm is the detection of fever, bradyarrhythmia, tachycardia, etc.
In Table 9, the threshold for anomaly detection in blood glucose level data is presented. Type 2 diabetes is a long-lasting disease that increases insulin resistance in the body. Middle-aged and older people are mostly affected by type 2 diabetics, but it can also affect kids and teenagers with childhood obesity. Type 1 diabetes is a chronic condition in which the body has little or no insulin. Type 1 diabetic factors are genetics, and some viruses may also contribute to it. Type 1 diabetes symptoms usually appear in childhood or adolescence, and it can also develop in adults. There is no cure introduced for type 1 diabetes, and the treatment is based on the management of blood glucose levels with insulin using diet and lifestyle management.
Two methods were implemented for anomalous behavior detection in elderly patient activities, such as a patient fall. The first one is a threshold-based approach, and the second approach is a machine learning classifier-based approach based on elderly patient activities data. A threshold-based approach based on multiple parameters from the accelerometer and a gyroscope sensing data gives a relatively high sensitivity of 91 percent and specificity of 92 percent [54]. In this approach, 3-axial acceleration sensing data was used as used by previous studies [55]. Fall detection using acceleration data from accelerometer based on the threshold approach of multiple parameters has 85.7 percent sensitivity and 90.1 percent specificity [56]. Fall detection using a gyroscope angular velocities have 100 percent sensitivity, and 97.5 percent specificity [57]. The second approach for anomaly detection of patient activities is an artificial neural network (ANN) based detection of regular and fall activity. Machine learning classifiers have been trained using the activities data from the E-PHMS and compared with ANN. The Fall activity is labeled one, and other activities are labeled zero. The trained models are tested and evaluated in terms of classification performance matrices. ANN model performs best than the traditional threshold-based approach for fall detection with an accuracy of 95 percent. As part of future work, a hybrid approach based on machine learning and a threshold-based approach can be implemented to increase the reliability of the fall detection module.
The dataset produced from the E-PHMS contains 1440 instances. The data set contains 5 data features, time, body temperature, heart rate, activity, and blood glucose level of the E-PHMS users. Figure 8 presents correlation analysis between the features of the prepared dataset.
The dataset’s activity feature is labeled for training the machine learning models. The dataset is split into 70 percent training data and 30 percent test data. The training dataset is of 1008 instances, whereas test dataset instances are 432. Other classifiers along ANN was trained for fall detection using the training data. Finally, models were tested, and fall detection accuracy is evaluated in terms of accuracy, recall, precision, and F1 score. Table 10 presents the Performance analysis of Fall detection using machine learning models.

4.2. Particle Swarm Optimization

Particle swarm optimization( PSO) is used due to its accuracy for optimization problems’ solutions [58,59,60]. In this study, PSO-based optimization was used to achieve optimal task mapping using the proposed objective functions. Three versions of PSO, such as the traditional PSO approach, Darwinian PSO (DPSO), and Improved PSO (IPSO) algorithms, were used for optimization based on proposed objective functions. PSO is explained in detail in the book of Olsson et al. [61]. Detail description of DPSO is found in the study of Tillett et al. [62]. Researchers using these algorithms for multilevel optimizations objective. IPSO is an improved version of PSO based on a modification mechanism involving the update of the velocity equation. Figure 9, presents P o p objective function results obtained using PSO, IPSO, and DPSO.
P o p function provides a value based on device operation plans to use the resources in such a manner that delayable time of devices operation is maximized. The P o p value is directly proportional to delayable time, the maximum the P o p value, the maximum is the delayable time, and minimum the P o p value, the minimum is the delayable time. Results of P o p objective function using DPSO is more optimized than traditional PSO and IPSO. Figure 10 shows the CSI objective function results based on PSO, IPSO, and DPSO are presented. As explained earlier, CSI is the correlation between a set of devices, and maximum CSI means the device sets are related, and the operational plans based on these devices will lead to flexible task mapping plans, minimum idle time, and maximum delayable time. The P o p value is directly proportional to CSI value. The highest CSI value is achieved based on the maximum P o p value. Results of the CSI objective function are compared using three versions of PSO. DPSO is more optimized as compared to traditional PSO and IPSO approaches.

4.3. Performance Analysis

The performance analysis of the proposed E-PHMS based on an intelligent task mapping approach is evaluated using metrics such as round-trip time, reliability, and network Latency. The round-trip time is the total time E-PHMS takes from health task generation to process execution on health devices and respond back from health devices to E-PHMS. Health tasks for 30 volunteers were deployed, and the round-trip time based on the log system of E-PHMS were recorded for analysis. From these 30 subjects’ data, aggregation functions such as minimum, maximum, and average of the round-trip time are calculated. Round trip time analysis of E-PHMS is presented in Figure 11. The round-trip time is measured in milliseconds.
The figure shows minimum round-trip time is four milliseconds, the maximum round-trip time is 87.8 milliseconds, and the average round-trip time is around 45 milliseconds. The average round-trip time for all health tasks depicts the architecture strength for patient health monitoring and other critical task applications. The second metric used for the performance analysis of E-PHMS is the reliability of the architecture during elderly patient activities such as rest, stress, walking, and patient fall. The reliability percentage is calculated from the mean percentage of task dropping rate. Figure 12 shows the reliability results of E-PHMS in percentage during various patient activities. The reliability is calculated using 30, 50, and 100 subjects health tasks in the apache Jmeter, a load testing tool. The lesser the task dropping rate, the higher the system’s reliability. For 30 subjects, the task dropping rate is minimum, and hence the reliability is maximum. The reliability of a system decrease for more tasks load as the number of tasks load increases, but the reliability decrease is very steady for the proposed E-PHMS architecture. Even for 100 subjects tasks, the minimum reliability percentage is 98.02 percent, which shows the proposed architecture’s efficiency for critical tasks such as fall detection tasks.
The third metric for performance analysis is the latency of health task deployment. Figure 13 shows the latency of health tasks deployment of the 30, 50, and 100 users.
The performance of the proposed system was further evaluated using task deployment latency was with respect to patient activities of the virtual patients. Minimum latency values of 30, 50 and 100 users’ cross-domain requests were 187.5, 193.7 and 215 milliseconds respectively. Maximum latency values of 30, 50 and 100 users were 320.7, 331.2 and 351.6 milliseconds respectively.
For risk management analysis of the architecture, we consider recovery from failure. Fault tolerance is used as a reliability metric for the IoT platforms. Sensing devices fail due to environmental effects, battery drainage, hardware failure, to name a few. The task mapping module runs the proposed task mapping algorithm and assigns the top ten virtual objects are assigned with a mapping index. The virtual object with the highest mapping index is selected for health task deployment. If the biosensor associated with the virtual object is active, the health task is executed. In case the device failed to respond, the allocator finds the next virtual object in the list and deploys it on the corresponding biosensor. An exceptional situation can happen if all the ten virtual objects face device failure. In such exceptional cases, the architecture’s recovery time will be more as the PHMS will cause an error message. The task mapping module will regenerate the task mapping index recommended pool. Once a device node failure occurs, the next device node is fetched from the queue. If ten concurrent device failures occur, which have a very low probability, the average deviation of the response time is 77 ms.
Figure 14a shows response time analysis likely to frequent failures. Figure 14b depicts response time deviation with concurrent device failures.The spikes in the Figure are the deviation from the response time, which is the time spent in searching for a new device and re-running the algorithm. The graph also depicts that the response time is back to normal for the next iteration of devices with a slight increase. This slight increase is because the first iteration of selected devices is the best, which leads to the minimum response time.

4.4. Comparison and Significance

To the best of the authors’ knowledge, E-PHMS is the first-ever attempt towards patient health monitoring using task composition architecture based on an intelligent task mapping approach. Previously task composition architecture was proposed based on DIY approaches to provide task-level management of IoT services [8]. DIY approaches based task composition architecture address various aspects of task-level management in the IoT environment. However, the DIY based task mapping approach has limitations of manual deployment of tasks on the physical device. The manual task mapping approach is not appropriate for critical tasks applications such as health monitoring. The comparison of proposed E-PHMS architecture based on intelligent task mapping with existing IoT task composition architecture based on DIY task mapping approach is discussed in terms of task dropping rate, response time over time, and an average latency of task deployments.
The first quantitative metric considered for the performance comparison of the proposed intelligent task mapping-based architecture with exiting DIY task mapping-based architectures is stability in peak load time. The stability of the architecture is evaluated based on the task dropping rate. A lesser rate of tasks dropping in peak load time means the system is more stable and reliable. Tasks dropping-based comparison analysis is presented in Figure 15. The figure shows that as the task load increases, the rate of tasks dropping increases, and vice versa. It is evident from the rate of tasks dropping increase, although the number of tasks drop is small for the DIY task mapping-based approach for small tasks load. However, for more tasks load intelligent task mapping-based architecture’s drop rate is steady.
Figure 16 presents the performance comparison of the proposed intelligent task mapping-based architecture with existing DIY task mapping-based architecture in terms of response time-over-time. As in the health scenarios, event-driven tasks are more critical. The proposed architecture’s response time is compared with existing DIY task mapping-based architecture in term of event-driven tasks.
Event-driven tasks sense ambient scenarios and alarming situations such as anomaly detection in the data. Control tasks are activated for notification and handling the alarming situation based on event-driven tasks. The control tasks, which are based on event-driven tasks, are given the highest priority. The Lower response time in the comparison witness that proposed architecture always gives more priority to event-driven tasks than existing DIY task mapping-based architecture.
The third quantitative metric considered for the performance comparison of the proposed intelligent task mapping-based architecture with existing DIY task mapping-based architecture is the latency of tasks deployment. The comparison shown in Figure 17 is made using Locust, an open-source tool for three sets of virtual users. The average latency of DIY task mapping-based architecture for 50, 300 and 1000 users are 238 ms, 327 ms, and 432 ms. The average latency of the proposed intelligent task mapping-based architecture for 50, 300 and 1000 users are 238 ms, 327 ms and 432 ms.
Table 11 presents qualitative comparison of the proposed architecture with existing IoT-based health platforms. The proposed E-PHMS platform was compared with existing health platforms in terms of task-level management, remote access, device-level management, edge computing support, scalability issues, applications, and relative merits.

5. Conclusions

In this paper, elderly patient health monitoring architecture based on an intelligent task mapping approach is proposed for a closed-loop IoT healthcare environment. As a case study, an elderly patient health monitoring system was developed on the proposed health monitoring architecture. The system could detect and notify deteriorating conditions to the authorities based on biomedical sensors for faster interventions. The system used sensing data from the biomedical sensors and notified abnormalities using threshold and machine learning approaches. The proposed architecture’s performance is evaluated in terms of round trip time, reliability, latency, and recovery. Performance results show that the proposed architecture of the elderly patient health monitoring can be used to develop reliable solutions for critical tasks in IoT environments. As future work, the proposed architecture will be coupled with advanced predictive analysis and predictive optimization module to design optimal policies regarding the internet of healthcare resources. We will further extend the study to design risk management and cost-benefit analysis framework to analyze risk factors and the economic impact of the proposed system.

Author Contributions

I. conceived the idea for this paper, designed the experiments, and wrote the paper. N.I. assisted in the experimental design, and S.A. assisted in review and editing. D.H.K. supervised and proof-read the study of the health monitoring system for elderly patients using intelligent task mapping mechanism in the closed-loop healthcare environment. All authors have read and agreed to the published version of the manuscript.

Funding

This research received no external funding.

Acknowledgments

This research was supported by Basic Science Research Program through the National Research Foundation of Korea (NRF) funded by the Ministry of Education (2018R1D1A1A09082919), and this work was supported by Institute for Information & communications Technology Promotion (IITP) grant funded by the Korea government (MSIT) (No. 2018-0-01456, AutoMaTa: Autonomous Management framework based on artificial intelligent Technology for adaptive and disposable IoT), Any correspondence related to this paper should be addressed to DoHyeun Kim.

Conflicts of Interest

The authors declare no conflict of interest.

References

  1. Borah, K.; Jayalakshmi, L.C.M. A comparative study to assess the quality of life among elderly population of urban and rural areas of Kamrup district, Assam. IJAR 2020, 6, 371–374. [Google Scholar]
  2. Rostami, V.; Shojaei, P.; Bahmaei, J. Interpretive Structural Modeling of the Factors Affecting Induced Demand for Health Services. J. Health Manag. Inform. 2020, 7, 107–116. [Google Scholar]
  3. Van Vooren, N.; Steenkamer, B.; Baan, C.; Drewes, H. Transforming towards sustainable health and wellbeing systems: Eight guiding principles based on the experiences of nine Dutch Population Health Management initiatives. Health Policy 2020, 124, 37–43. [Google Scholar] [CrossRef]
  4. Wynn, R.; Gabarron, E.; Johnsen, J.A.K.; Traver, V. Special Issue on E-Health Services. Int. J. Environ. Res. Public Health 2020, 17, 2885. [Google Scholar] [CrossRef]
  5. Lee, I.; Lee, K. The Internet of Things (IoT): Applications, investments, and challenges for enterprises. Bus. Horiz. 2015, 58, 431–440. [Google Scholar] [CrossRef]
  6. Purri, S.; Choudhury, T.; Kashyap, N.; Kumar, P. Specialization of IoT applications in health care industries. In Proceedings of the 2017 International Conference on Big Data Analytics and Computational Intelligence (ICBDAC), Andhra Pradesh, India, 23–25 March 2017; pp. 252–256. [Google Scholar]
  7. Alam, M.M.; Malik, H.; Khan, M.I.; Pardy, T.; Kuusik, A.; Le Moullec, Y. A survey on the roles of communication technologies in IoT-based personalized healthcare applications. IEEE Access 2018, 6, 36611–36631. [Google Scholar] [CrossRef]
  8. Ahmad, S.; Kim, D.; Imran. Design and Implementation of Thermal Comfort System based on Tasks Allocation Mechanism in Smart Homes. Sustainability 2019, 11, 5849. [Google Scholar]
  9. Ahmad, S.; Kim, D.H.; Imran. A task orchestration approach for efficient mountain fire detection based on microservice and predictive analysis In IoT environment. J. Intell. Fuzzy Syst. 2020, 1–16. [Google Scholar]
  10. Ahmad, S.; Malik, S.; Ullah, I.; Park, D.H.; Kim, K.; Kim, D. Towards the design of a formal verification and evaluation tool of real-time tasks scheduling of IoT applications. Sustainability 2019, 11, 204. [Google Scholar] [CrossRef] [Green Version]
  11. Ahmad, S.; Kim, D. A multi-device multi-tasks management and orchestration architecture for the design of enterprise IoT applications. Future Gener. Comput. Syst. 2020, 106, 482–500. [Google Scholar] [CrossRef]
  12. Hang, L.; Kim, D.H. Reliable task management based on a smart contract for runtime verification of sensing and actuating tasks in IoT environments. Sensors 2020, 20, 1207. [Google Scholar] [CrossRef] [Green Version]
  13. Kolomvatsos, K.; Anagnostopoulos, C. Multi-criteria optimal task allocation at the edge. Future Gener. Comput. Syst. 2019, 93, 358–372. [Google Scholar] [CrossRef] [Green Version]
  14. Boukhennoufa, I.; Amira, A.; Bensaali, F.; Esfahani, S.S. A novel gateway-based solution for remote elderly monitoring. J. Biomed. Informatics 2020, 109, 103521. [Google Scholar] [CrossRef] [PubMed]
  15. Mahmood, D.; Fadhil, A.; Rafaa, M.M. IoT based on Health Caring Systems Survey. Int. J. Comput. Digit. Syst. 2020, 10, 1–10. [Google Scholar]
  16. Moser, L.E.; Melliar-Smith, P. Personal health monitoring using a smartphone. In Proceedings of the 2015 IEEE International Conference on Mobile Services, New York City, NY, USA, 27 June–2 July 2015; pp. 344–351. [Google Scholar]
  17. Turner, J.; Zellner, C.; Khan, T.; Yelamarthi, K. Continuous heart rate monitoring using smartphone. In Proceedings of the 2017 IEEE International Conference on Electro Information Technology (EIT), Lincoln, RI, USA, 14–17 May 2017; pp. 324–326. [Google Scholar]
  18. Islam, M.M.; Rahaman, A.; Islam, M.R. Development of Smart Healthcare Monitoring System in IoT Environment. SN Comput. Sci. 2020, 1, 185. [Google Scholar] [CrossRef] [PubMed]
  19. Manihar, P.H.; Wani, V.J. World Health Day: Trends and Today’s Times. Indian Pract. 2020, 73, 55–56. [Google Scholar]
  20. Kumar, S.P.; Samson, V.R.R.; Sai, U.B.; Rao, P.M.; Eswar, K.K. Smart health monitoring system of patient through IoT. In Proceedings of the 2017 International Conference on I-SMAC (IoT in Social, Mobile, Analytics and Cloud) (I-SMAC), Palladam, India, 10–11 February 2017; pp. 551–556. [Google Scholar]
  21. Penmatsa, P.L.; Reddy, D.R.K. Smart detection and transmission of abnormalities in ECG via Bluetooth. In Proceedings of the 2016 IEEE International Conference on Smart Cloud (SmartCloud), New York, NY, USA, 18–20 November 2016; pp. 41–44. [Google Scholar]
  22. Rogers, E.A.; Junga, E. Intelligent Efficiency Technology and Market Assessment; American Council for an Energy-Efficient Economy (ACEEE): Washington, DC, USA, 2017. [Google Scholar]
  23. Kumar, R.; Rajasekaran, M.P. An IoT based patient monitoring system using raspberry Pi. In Proceedings of the 2016 International Conference on Computing Technologies and Intelligent Data Engineering (ICCTIDE’16), Kovilpatti, India, 7–9 January 2016; pp. 1–4. [Google Scholar]
  24. Wu, F.; Wu, T.; Yuce, M.R. Design and implementation of a wearable sensor network system for IoT-connected safety and health applications. In Proceedings of the 2019 IEEE 5th World Forum on Internet of Things (WF-IoT), Limerick, Ireland, 15–18 April 2019; pp. 87–90. [Google Scholar]
  25. Trivedi, S.; Cheeran, A.N. Android based health parameter monitoring. In Proceedings of the 2017 International Conference on Intelligent Computing and Control Systems (ICICCS), Madurai, India, 15–16 June 2017; pp. 1145–1149. [Google Scholar]
  26. Sabbir, A.S.; Bodroddoza, K.M.; Hye, A.; Ahmed, M.F.; Saha, S.; Ahmed, K.I. Prototyping Arduino and Android based m-health solution for diabetes mellitus patient. In Proceedings of the 2016 International Conference on Medical Engineering, Health Informatics and Technology (MediTec), Dhaka, Bangladesh, 17–18 December 2016; pp. 1–4. [Google Scholar]
  27. Desai, M.; Toravi, S. A smart sensor interface for smart homes and heart beat monitoring using WSN in IoT environment. In Proceedings of the 2017 International Conference on Current Trends in Computer, Electrical, Electronics and Communication (CTCEEC), Mysore, India, 8–9 September 2017; pp. 74–77. [Google Scholar]
  28. Islam, S.R.; Kwak, D.; Kabir, M.H.; Hossain, M.; Kwak, K.S. The internet of things for health care: A comprehensive survey. IEEE Access 2015, 3, 678–708. [Google Scholar] [CrossRef]
  29. Trumpf, R.; Zijlstra, W.; Haussermann, P.; Fleiner, T. Quantifying Habitual Physical Activity and Sedentariness in Older Adults—Different Outcomes of Two Simultaneously Body-Worn Motion Sensor Approaches and a Self-Estimation. Sensors 2020, 20, 1877. [Google Scholar] [CrossRef] [Green Version]
  30. Tmaura, T.; Zakaria, N.A.; Kuwae, Y.; Sekine, M.; Minato, K.; Yoshida, M. Quantitative analysis of the fall-risk assessment test with wearable inertia sensors. In Proceedings of the 2013 35th Annual International Conference of the IEEE Engineering in Medicine and Biology Society (EMBC), Osaka, Japan, 3–7 July 2013; pp. 7217–7220. [Google Scholar]
  31. Fakhrulddin, S.S.; Gharghan, S.K. An Elderly First Aid System Based-Fall Detection and Unmanned Aerial Vehicle. In Proceedings of the IOP Conference Series: Materials Science and Engineering, Thi-Qar, Iraq, 15–16 July 2020; Volume 745, p. 012096. [Google Scholar]
  32. Noury, N.; Rumeau, P.; Bourke, A.; ÓLaighin, G.; Lundy, J. A proposal for the classification and evaluation of fall detectors. Irbm 2008, 29, 340–349. [Google Scholar] [CrossRef]
  33. Giorgi, G.; Galli, A.; Narduzzi, C. Smartphone-based IOT systems for personal health monitoring. IEEE Instrum. Meas. Mag. 2020, 23, 41–47. [Google Scholar] [CrossRef]
  34. Wu, F.; Zhao, H.; Zhao, Y.; Zhong, H. Development of a wearable-sensor-based fall detection system. Int. J. Telemed. Appl. 2015, 2015, 576364. [Google Scholar] [CrossRef] [Green Version]
  35. Pandya, B.; Pourabdollah, A.; Lotfi, A. Fuzzy logic web services for real-time fall detection using wearable accelerometer and gyroscope sensors. In Proceedings of the 13th ACM International Conference on PErvasive Technologies Related to Assistive Environments, Corfu, Greece, 30 June–3 July 2020; pp. 1–7. [Google Scholar]
  36. Tyagi, S.; Agarwal, A.; Maheshwari, P. A conceptual framework for IoT-based healthcare system using cloud computing. In Proceedings of the 2016 6th International Conference-Cloud System and Big Data Engineering (Confluence), India, Noida, 14–15 January 2016; pp. 503–507. [Google Scholar]
  37. Rajan, S.P.; Rajamony, S. Viable investigations and real-time recitation of enhanced ECG-based cardiac telemonitoring system for homecare applications: A systematic evaluation. Telemed. e-Health 2013, 19, 278–286. [Google Scholar] [CrossRef]
  38. Elsayad, A.S.; Eldesouky, A.I.; Salem, M.M.; Badawy, M. A Deep Learning H2O Framework for Emergency Prediction in Biomedical Big Data. IEEE Access 2020. [Google Scholar] [CrossRef]
  39. Selvaraj, S.; Sundaravaradhan, S. Challenges and opportunities in IoT healthcare systems: A systematic review. SN Appl. Sci. 2020, 2, 139. [Google Scholar] [CrossRef] [Green Version]
  40. Djelouat, H.; Amira, A.; Bensaali, F.; Boukhennoufa, I. Secure compressive sensing for ECG monitoring. Comput. Secur. 2020, 88, 101649. [Google Scholar] [CrossRef]
  41. Saji, M.; Sridhar, M.; Rajasekaran, A.; Kumar, R.A.; Suyampulingam, A.; Prakash, N.K. IoT-Based Intelligent Healthcare Module. In Advances in Smart System Technologies; Springer: Berlin/Heidelberg, Germany, 2020; pp. 765–774. [Google Scholar]
  42. Safdar, Z.; Farid, S.; Qadir, M.; Asghar, K.; Iqbal, J.; Hamdani, F.K. A Novel Architecture for Internet of Things Based E-Health Systems. J. Med. Imaging Health Inform. 2020, 10, 2378–2388. [Google Scholar] [CrossRef]
  43. Butpheng, C.; Yeh, K.H.; Xiong, H. Security and Privacy in IoT-Cloud-Based e-Health Systems—A Comprehensive Review. Symmetry 2020, 12, 1191. [Google Scholar] [CrossRef]
  44. Zou, N.; Liang, S.; He, D. Issues and challenges of user and data interaction in healthcare-related IoT. Library Hi Tech. 2020, 38, 769–782. [Google Scholar] [CrossRef]
  45. Ray, P.P. Home Health Hub Internet of Things (H 3 IoT): An architectural framework for monitoring health of elderly people. In Proceedings of the 2014 International Conference on Science Engineering and Management Research (ICSEMR), Chennai, India, 27–29 November 2014; pp. 1–3. [Google Scholar]
  46. Woo, M.W.; Lee, J.; Park, K. A reliable IoT system for personal healthcare devices. Future Gener. Comput. Syst. 2018, 78, 626–640. [Google Scholar] [CrossRef]
  47. Baali, H.; Djelouat, H.; Amira, A.; Bensaali, F. Empowering technology enabled care using IoT and smart devices: A review. IEEE Sens. J. 2017, 18, 1790–1809. [Google Scholar] [CrossRef]
  48. Ahouandjinou, A.S.; Assogba, K.; Motamed, C. Smart and pervasive ICU based-IoT for improving intensive health care. In Proceedings of the 2016 International Conference on Bio-engineering for Smart Technologies (BioSMART), Dubai, United Arab Emirates, 4–7 December 2016; pp. 1–4. [Google Scholar]
  49. Prajapati, B.; Parikh, S.; Patel, J. An Intelligent Real Time IoT Based System (IRTBS) for Monitoring ICU Patient. In Proceedings of the International Conference on Information and Communication Technology for Intelligent Systems, Ahmedabad, India, 25–26 March 2017; pp. 390–396. [Google Scholar]
  50. Kakria, P.; Tripathi, N.; Kitipawang, P. A real-time health monitoring system for remote cardiac patients using smartphone and wearable sensors. Int. J. Telemed. Appl. 2015, 2015, 373474. [Google Scholar] [CrossRef] [PubMed] [Green Version]
  51. Acharya, R.; Kannathal, N.; Sing, O.W.; Ping, L.Y.; Chua, T. Heart rate analysis in normal subjects of various age groups. Biomed. Eng. Online 2004, 3, 1–8. [Google Scholar] [CrossRef] [Green Version]
  52. Benjamin, E.M. Self-monitoring of blood glucose: The basics. Clin. Diabetes 2002, 20, 45–47. [Google Scholar] [CrossRef] [Green Version]
  53. Mancini, G.; Berioli, M.G.; Santi, E.; Rogari, F.; Toni, G.; Tascini, G.; Crispoldi, R.; Ceccarini, G.; Esposito, S. Flash Glucose Monitoring: A Review of the Literature with a Special Focus on Type 1 Diabetes. Nutrients 2018, 8, 992. [Google Scholar]
  54. Li, Q.; Stankovic, J.A.; Hanson, M.A.; Barth, A.T.; Lach, J.; Zhou, G. Accurate, fast fall detection using gyroscopes and accelerometer-derived posture information. In Proceedings of the 2009 Sixth International Workshop on Wearable and Implantable Body Sensor Networks, Berkeley, CA, USA, 3–5 June 2009; pp. 138–143. [Google Scholar]
  55. Yi, Y.J.; Yu, Y.S. Emergency monitoring system based on a newly-developed fall detection algorithm. J. Inf. Commun. Converg. Eng. 2013, 11, 199–206. [Google Scholar] [CrossRef]
  56. Weiss, A.; Shimkin, I.; Giladi, N.; Hausdorff, J.M. Automated detection of near falls: Algorithm development and preliminary results. BMC Res. Notes 2010, 3, 62. [Google Scholar] [CrossRef] [Green Version]
  57. Bourke, A.K.; Lyons, G.M. A threshold-based fall-detection algorithm using a bi-axial gyroscope sensor. Med Eng. Phys. 2008, 30, 84–90. [Google Scholar] [CrossRef] [PubMed]
  58. Ahmad, S.; Iqbal, N.; Jamil, F.; Kim, D. Optimal Policy-Making for Municipal Waste Management Based on Predictive Model Optimization. IEEE Access. 2020, 8, 218458–218469. [Google Scholar] [CrossRef]
  59. Ahmad, S.; Jamil, F.; Iqbal, N.; Kim, D. Optimal Route Recommendation for Waste Carrier Vehicles for Efficient Waste Collection: A Step Forward Towards Sustainable Cities. IEEE Access. 2020, 8, 77875–77887. [Google Scholar] [CrossRef]
  60. Wahid, F.; Fayaz, M.; Aljarbouh, A.; Mir, M.; Amir, M. Energy consumption optimization and user comfort maximization in smart buildings using a hybrid of the firefly and genetic algorithms. Energies 2020, 13, 4363. [Google Scholar] [CrossRef]
  61. Olsson, A.E. Particle Swarm Optimization: Theory, Techniques and Applications; Nova Science Publishers, Inc. Hauppauge: New York, NY, USA, 2010. [Google Scholar]
  62. Tillett, J.; Rao, T.; Sahin, F.; Rao, R. Darwinian particle swarm optimization. In Proceedings of the 2nd Indian International Conference on Artificial Intelligence (IICAI-05), Pune, India, 20–22 December 2005; pp. 1474–1487. [Google Scholar]
  63. Ying Wah, T.; Gopal Raj, R.; Lakhan, A. A novel cost-efficient framework for critical heartbeat task scheduling using the Internet of medical things in a fog cloud system. Sensors 2020, 20, 441. [Google Scholar]
  64. Kleinfeld, R.; Steglich, S.; Radziwonowicz, L.; Doukas, C. glue.things: A Mashup Platform for wiring the Internet of Things with the Internet of Services. In Proceedings of the 5th International Workshop on Web of Things, Cambridge, MA, USA, 8 October 2014; pp. 16–21. [Google Scholar]
Figure 1. Conceptual Procedure of Proposed Closed Loop Healthcare Environment.
Symmetry 13 00357 g001
Figure 2. Proposed Flow of Task Level Management of Elderly Patient Health Monitoring System.
Symmetry 13 00357 g002
Figure 3. Intelligent Task Mapping Architecture for Elderly Patient Health Monitoring.
Symmetry 13 00357 g003
Figure 4. Elderly Patient Health Monitoring Application.
Symmetry 13 00357 g004
Figure 5. Task Level Management of Elderly Patient Health Monitoring Services.
Symmetry 13 00357 g005
Figure 6. Visualization of Anomaly Detection using E-PHMS Application.
Symmetry 13 00357 g006
Figure 7. Statistical Analysis of Heart Rate and Blood Glucose Level Data.
Symmetry 13 00357 g007
Figure 8. Correlation Between Features of Prepared Dataset.
Symmetry 13 00357 g008
Figure 9. Visualization of P o p Objective Function Results.
Symmetry 13 00357 g009
Figure 10. Visualization of CSI Objective Function Results.
Symmetry 13 00357 g010
Figure 11. Round Trip Time based Analysis of E-PHMS.
Symmetry 13 00357 g011
Figure 12. Reliability Results in Percentage of E-PHMS.
Symmetry 13 00357 g012
Figure 13. Task Deployment Latency with Respect to Patient Activity.
Symmetry 13 00357 g013
Figure 14. Fault effect on response time.
Symmetry 13 00357 g014
Figure 15. Comparison based on Task Dropping Rate.
Symmetry 13 00357 g015
Figure 16. Comparison based on Response Time over Time.
Symmetry 13 00357 g016
Figure 17. Comparison based on Average Latency of Task Deployment.
Symmetry 13 00357 g017
Table 1. Summary of Existing Health Monitoring Platforms.
PlatformOpen SourceEdge ComputingSensing ResourcesApplicationsAdvantagesDisadvantages
Personal health monitoring [16]NoNoBP, body weight (BW), PO, GM, AMChronic disease progressionalert emergencies using phone and cost effectiveNo fault tolerance and low reliability
Home health hub internet of things (H3IoT) [45]YesNoECG, EMG, EEG, BW, PO, BT, BPelderly patient health monitoringmobility, simple design,easy to use, and delay tolerantNo support for emergencies of critical elderly patients
Heart Rate Monitoring [17]YesNoHR sensorCardiovascular diseasecontinuous heart monitoring using smart homeCostly and scalability issues
Heart Rate Monitoring Personal IoT healthcare [46]NoNoPersonal healthcare devicesOneM2M-based health monitoringprovides effective health monitoring servicesbyzantine fault-tolerant algorithm
Heart Rate Monitoring Smart health Platform [20]YesNoBT, HR, AMHeart problem and noise detectionprovides remote patient monitoringHigh cost
Abnormality Detection in health data [21]NoNoECG,BT, HRDetecting abnormalities in heart rateLow cost and reducing labour of performing cardiac testsuse of Bluetooth which is unreliable most of the time
Technology-enabled care (TEC) [47]NoYesECG, BP, EEG, PO, ISconnected health or technology-enabled careHarvesting ambient energy and reduce power gapsgel in electrodes cause skin irritation and require high power consumption
Health and Safety [24]YesYeswearable sensorsconnected health and safety applicationsprovide critical tasks due to IoT edge architecturescalability issues
IoT-based ICU [48]NoNoECG, PO, BT, cameraHeart problem and fever detectionAutomatic Detection of risk SituationsCostly
health parameter monitoring [25]yesNoBTFever and hypothermiaCost effective and open sourcescalability issues
m-Health Monitoring [26]NoNoGMDiabetes mellitusprescription of diet and fitness and therapeutic servicesNo clinical validation
Intelligent real-time IoT-based health monitoring system [49]NoNoICU wearable sensorsconnected health or technology-enabled carespare more time in the efficient decisionyet to be deployed, accuracy not tested
Table 2. Summary of Symbols and Notations for the Objective Functions.
SymbolDescriptionSymbolDescription
S h e a l t h Health monitoring services T v a c a y Idle time of the health device
H t a s k A health task belonging to S h e a l t h VoListList of Virtual objects
TasklistTask list of all H t a s k TVoPairsTasks and Virtual objects pairs
H V o Health device virtual objectCSICumulative similarity index
H d e v i c e Health monitoring IoT device C M i n d e x Cumulative M i n d e x
PA Process for allocation of set of tasks P o p Operation plan of set of health devices
T d u r a t i o n Duration of T h e a l t h M i n d e x Task Device Mapping Index
T s t a r t t i m e Start time of T h e a l t h T f t Finish time of T h e a l t h
T d t m The cumulative delay time T w c f t s Worst-case finish time of T h e a l t h
Table 3. Health Tasks Parameters.
Task ID T d u r a t i o n T w c f t s Finish TimeTask Delay T d t m Task Title
16121046Get body Temperature
29151236Report body Temperature
3162821512Get Heart rate
4193123412Report heart rate
59131124Get position data
610131113Report position data
Table 4. Ordering of Health Devices Operation Plan.
P o p i = 0 n T d t m Task Name T v a c a y P o p Function
H d e v i c e 1 ( O P 1 , O P 4 ) 18Get body Temperature70.125
Report heart rate
H d e v i c e 2 ( O P 3 , O P 2 ) 8Get Heart rate
Report body Temperature
H d e v i c e 1 ( O P 4 , O P 1 ) 12Get body Temperature140.06
Report body Temperature
H d e v i c e 2 ( O P 2 , O P 3 ) 8Get Heart rate
Get position data
H d e v i c e 1 ( O P 1 , O P 4 ) 7Get position data40.2
Report position data
H d e v i c e 2 ( O P 2 , O P 3 ) 5Report body Temperature
Get position data
H d e v i c e 1 ( O P 4 , O P 1 ) 8Get Heart rate120.076
Report heart rate
H d e v i c e 2 ( O P 3 , O P 2 ) 5Get body Temperature
Get position data
Table 5. Task allocation on different Health Devices its impact on CSI.
Task Allocation M i n d e x i M i n d e x j CSI
( H d e v i c e 1 , H d e v i c e 2 , H d e v i c e 3 )0.40.10.5
( H d e v i c e 1 , H d e v i c e 3 , H d e v i c e 2 )0.20.40.6
( H d e v i c e 2 , H d e v i c e 1 , H d e v i c e 3 )0.10.30.4
( H d e v i c e 2 , H d e v i c e 3 , H d e v i c e 1 )0.50.30.8
( H d e v i c e 3 , H d e v i c e 1 , H d e v i c e 2 )0.50.40.9
( H d e v i c e 3 , H d e v i c e 2 , H d e v i c e 1 )0.40.20.6
Table 6. Implementation Environment of E-PHMS.
ComponentDescription
Operating SystemWindows 10
HardwareRaspberry PI,e-Health Sensor Platform 2.0
Memory16 GB
ServerMySql and Flask Webserver
Programming languagePython
Optimization methodsPSO, IPSO and DPSO
IDEPycharm
CPUIntel i8-2120 CPU @3.30 GHz(4 CPUs)
LibrariesMind Fusion Diagraming, bootstrap, jQuery, NLTK
ResourcesHeart sensor, body temperature sensor, glucometer sensor, body position sensor
Table 7. Statistics of Collected Sensing Data using E-PHMS.
S. NoAggregate FunctionHeart RateBody TemperatureBlood Blood Glucose Level
1Minimum(min)6296.34.00
2Maximum(max)89.098.56.89
3Standard deviation(sd)6.9470.640.76
4Average(avg)73.497.15.61
Table 8. Threshold for Anomaly Detection in Heart rate and Body Temperature Data [50,51,52].
Age RangeNormal Heart RateBradyarrhythmiaFeverTachycardiaHypothermia
17–3472–75Heart Rate ≤ 55Body Temperature ≥ 98.96Heart Rate ≥ 110Body Temperature < 95.9
35–6076–79Heart Rate ≤ 60Body Temperature ≥ 99.5Heart Rate ≥ 120Body Temperature < 95.18
Above 6070–73Heart Rate ≤ 65Body Temperature ≥ 98.42Heart Rate ≥ 100Body Temperature < 95
Table 9. Threshold for Anomaly Detection in Blood Glucose Level Data [53].
Blood Glucose Level Typebefore MealsAt Least 1.5 h after Meal
Non Diabetic4.0 ≤ blood glucose level ≤ 5.9blood glucose level < 7.8
Type 2 diabetes4.0 ≤ blood glucose level ≤ 7blood glucose level < 8.5
Type 1 diabetes4.0 ≤ blood glucose level ≤ 75.0 ≤ blood glucose level ≤ 9
Table 10. Performance Analysis of Fall Detection using Machine Learning Models
ClassifierAccuracyPrecisionRecallF1-Score
Decision Trees0.750.730.750.74
K-Nearest Neighbors0.830.820.820.82
Random Forests0.890.870.870.88
Artificial neural network0.950.930.920.89
Stochastic Gradient Decent0.790.750.790.70
Table 11. Comparison of E-PHMS with existing health and IoT platforms.
PlatformTask ManagementRemote AccessDevice ManagementEdge ComputingApplicationsScalability IssuesRelative Merits
H3IoT [45]NoYesYesNoelderly patient health monitoringYesSimple design,delay tolerant but no support for emergencies alert
HCCETS [63]Task SchedulingYesNoYesCritical Heartbeat TaskNoCost-efficient framework but not support fault-tolerant and energy cost of the system
Glue.thing [64]DIY approachYesyesYesMashup platform for IoT applicationsNoEffective for general purpose IoT applications but have limitations for critical tasks applications
Health parameter monitoring [25]NoYesNoNoFever and hypothermia detectionYesCost effective and open source but communication delay is more
DIY based Task orchestration [8]DIY approachYesYesYessmart home applicationsYesEasy to use for general public but not effective for critical tasks applications
Technology-enabled care (TEC) [47]NoNoYesNoTechnology Enabled CareYesHarvesting ambient energy and reduce power but causes cause skin irritation
IRTBS [49]NoNoYesYesconnected health or technology-enabled careNoTime efficient, not deployed in real environment
Proposed E-PHMSIntelligent Task MappingYesYesYesHealth monitoring and other critical tasks applicationsNoEffective for critical tasks applications but need to enhance the prediction module
Publisher’s Note: MDPI stays neutral with regard to jurisdictional claims in published maps and institutional affiliations.

