Article

Ship Detection and Tracking in Inland Waterways Using Improved YOLOv3 and Deep SORT

1
Department of Information Engineering, Wuhan University of Technology, Wuhan 430070, China
2
Department of Electronics, Quaid-i-Azam University, Islamabad 15320, Pakistan
*
Author to whom correspondence should be addressed.
Symmetry 2021, 13(2), 308; https://doi.org/10.3390/sym13020308
Submission received: 16 January 2021 / Revised: 4 February 2021 / Accepted: 9 February 2021 / Published: 12 February 2021

Abstract

:
Ship detection and tracking is an important task in video surveillance in inland waterways. However, ships in inland navigation are faced with accidents such as collisions. For collision avoidance, we should strengthen the monitoring of navigation and the robustness of the entire system. Hence, this paper presents ship detection and tracking of ships using the improved You Only Look Once version 3 (YOLOv3) detection algorithm and Deep Simple Online and Real-time Tracking (Deep SORT) tracking algorithm. Three improvements are made to the YOLOv3 target detection algorithm. Firstly, the Kmeans clustering algorithm is used to optimize the initial value of the anchor frame to make it more suitable for ship application scenarios. Secondly, the output classifier is modified to a single Softmax classifier to suit our ship dataset which has three ship categories and mutual exclusion. Finally, Soft Non-Maximum Suppression (Soft-NMS) is introduced to solve the deficiencies of the Non-Maximum Suppression (NMS) algorithm when screening candidate frames. Results showed the mean Average Precision (mAP) and Frame Per Second (FPS) of the improved algorithm are increased by about 5% and 2, respectively, compared with the existing YOLOv3 detecting Algorithm. Then the improved YOLOv3 is applied in Deep Sort and the performance result of Deep Sort showed that, it has greater performance in complex scenes, and is robust to interference such as occlusion and camera movement, compared to state of art algorithms such as KCF, MIL, MOSSE, TLD, and Median Flow. With this improvement, it will help in the safety of inland navigation and protection from collisions and accidents.

1. Introduction

In recent years, with the rapid development of computer vision and artificial intelligence, the intelligent video surveillance system has been gradually applied in various fields including in inland waterways. However, most inland navigations are still faced with accidents and ship collisions, hence it is important to detect and track ships in inland waterways in order to improve the safety of navigation. The core of an intelligent video surveillance system is the moving object detection algorithm and tracking algorithm.
There are many traditional detection methods proposed by researchers. These algorithms have three common processes, including region selection [1], feature extraction [2] and classification [3]. Region selection generally uses a sliding window method to traverse the image globally. This causes a lot of detection redundancy and has high time complexity. Feature extraction plays an important part in object detection [2]. After region selection, features are extracted from the target. Thus classical features such as scale-invariant feature transformations (SIFT) [4] and a histogram of oriented gradients (HOG) [5] need to be designed to represent the target. The last step is to map and classify features. The main classifiers include support vector machines (SVM) [6] and Adaboost [7]. In 2016, Kaido et al. [8] used support vector machine (SVM) and edge detection in the detecting of ships [9]. The author proposed a vessel number plate identification by using two cameras and identification of various vessels passing through the port. However, even with all the proposed algorithms, they still encountered drawbacks of efficiency and accuracy. To solve these problems, the use of machine vision and deep neural networks were proposed to increase efficiency and accuracy of object detection algorithms.
Using Convolutional Neural Network (CNN) as the basis of the algorithm has become the mainstream trend of classification and detection tasks. It is mainly divided into two routes—a two-step algorithm based on regional recommendations. It includes R-CNN [10], Fast R-CNN [11], and Faster R-CNN [12]. This route essentially inherits the ideas of traditional detection algorithms, firstly screening areas that may have targets and then performing feature extraction and classification; the other is end-to-end, that is, a one-step algorithm. It includes YOLO [13], YOLOv2 [14], YOLOv3 [15], and SSD [16].This route transforms the target detection problem into a regression problem, that is, the regression algorithm outputs both the probability of each category and the target location information [11]. A comparison is shown in Table 1 below.
Table 1 above shows different existing object detection CNN algorithms with their advantages and limitations. YOLO algorithm and SSD algorithm are observed to have more advantages compared with R-CNN family algorithms. YOLO [13] uses a single convolution neural network to calculate bounding boxes and the probability of these boxes. Improvements of YOLO algorithm have recently been released: YOLOv2 and YOLOv3, as proposed by [14,15] respectively.
Researchers have also proposed different ship detection algorithms using various CNN algorithms. Dong and Lin [17] improved Faster-RCNN (Faster Region Based Convolutional Neural Network) and introduced the box-based rotation device for detecting high resolution ship images. Fan et al. [18] Suggested ship detection by improving Faster R-CNN to detect Polarization Synthetic Aperture Radar (PSAR) ship images. Jiao et al. [19] proposed a densely connected multiscale neural network based on Faster-RCNN to detect multiscene SAR images. An et al. [20] suggested an improved RBox-based target detection framework to obtain accuracy recall rate and precision of the detection. Qi et al. [21] Improved Faster-RCNN by completing image downscaling to obtain useful information of ship images, which helps in the accurate and timely detection of ship images. Zhang et al. [22] Proposed a lightweight optimization network LFO net based on SSD for ship detection in SAR images. For ship detection, this method designed a simple lightweight network, proposing a bidirectional feature fusion module including semantic aggregation and feature reuse blocks, and used an attention mechanism to optimize features. They achieved better detection results than the SAR ship dataset, but some weak small targets and false alarms on land are difficult to eliminate. Song et al. [23] Proposed a sophisticated and automatic methodology to generate verified and robust training data by employing synthetic aperture radar (SAR) images and ship automatic identification system (AIS) data. They used Kalman filter for interpolation followed by recompensing Doppler frequency shift. They achieved high performance compared to manual training of the Synthetic Aperture Radar (SAR) images. Imani and Ghoreishi [24] Proposed a multi-fidelity Bayesian optimization (MFBO) framework that significantly scaled the learning process of a wide range of existing inverse reinforcement learning techniques. They achieved high performance in different demonstrated problems, but encountered limitations with problems associated with inland waterways. Sr et al. [25] Proposed a ship algorithm that utilized an improved YOLO and multi-feature ship detection method to detect ships. For this method the SIFT features were reduced by MDS (multi-dimensional scaling), and RANSAC (random sample consensus) was used to optimize SIFT feature matching and effectively eliminate mismatching. They achieved high accuracy and robustness but encountered limitations in tracking some other targets and reported the process to be time consuming. Huang et al. [26] Proposed an intelligent ship detection and classification using improved YOLOv3 algorithm. They produced a high accuracy of detection but encountered limitations of missing the detection of small ship targets and low accuracy in complex environments such as fog. Different researchers such as [12,27] proved that the neural network detection algorithms worked better than traditional object detecting algorithms.
Different YOLOv3 detection algorithms proposed by researchers have produced good results, but there exist some limitations still, such as missing targets and low accuracy. Therefore, it is necessary to conduct ship detection related experiments based on this algorithm. In this paper, a modified YOLOv3 detection has been proposed to solve the problem of speed and accuracy, combined with a Deep Sort algorithm [28] to help with ship detection and tracking.

1.1. Problem Statement

With the limitations and current state of the above-mentioned approaches and increase of collisions in inland waterways, there is a demand and need for more efficient solutions based on new technologies for ship detection and tracking in inland waterways. Although the model trained by the original algorithm of YOLOv3 works well, there are still many missing and wrong detection phenomena. In this context, the improvement of the original YOLOv3 algorithm to further improve the index, reduce false detections, enhance the ability of missing detections to resist the interference of shore objects, and the detection efficiency must be studied.

1.2. Motivation

Inland waterways have become major means of transportation in many parts of the world as reported by different researchers [8,17,21]. However, transportation in these waterways is faced with different challenges—such as collisions—which can result in accidents and death of people. Therefore, it is necessary to have a good detection and tracking algorithm to solve the existing problem. Deep Sort tracking algorithm and YOLOv3 detection algorithm are seen as good tracking algorithms, but they have some limitations such as missing detections of small target ships and less detection efficiency. Therefore, this article aims to solve this knowledge gap in order to create a more effective detection and tracking algorithm.

1.3. Contribution

Based on the discussion, this paper intends to achieve the following objectives. Improvement was made in YOLOv3 detection algorithm as follows.
  • Optimize the initial value of the anchor frame based on the Kmeans algorithm
  • Choice of classifier depending on dataset used
  • NMS algorithm optimization, Soft NMS algorithm is introduced.
After this improvement on the YOLOv3 detection algorithm, we used Deep Sort tracking algorithm to track ships in inland waterways. We also made some modifications to enable the extraction of features present on ship datasets.

1.4. Paper Organization

The other sections of the paper are arranged as follows; Section 2 describes the current methodology used, including the architecture and related principles of algorithm. Section 3 presents the result and discussion, and finally Section 4 presents the conclusion of the entire work.

2. Methods

2.1. Object Detection Method

2.1.1. Basic Principle of Existing YOLOv3 Algorithm

The YOLOv3 model draws on the concept of residual networks, which enables the model to be effectively deepened. The connection module connects the up-sampled feature map with the previous layer of the same dimension, and after multi-layer mapping, it outputs three feature maps of different sizes, which are output under different receptive field areas. The reason for this is to enhance the robustness of the model’s target scale change. The model adopts a fully convolutional network (FCN) structure [29], and does not have a pooling layer and a fully connected layer. Such a structure can not only adapt to image inputs of different sizes, but also reduces the loss of underlying features caused by the pooling layer.
There are three main stages involved in the YOLOv3 algorithm: area division, non-maximum suppression, and multi-scale prediction.
  • Area division
As shown in Figure 1, for area division, if the input of YOLOv3 is in the form of 416 × 416 × 3, the final output is a feature map similar to the form of 13 × 13 × 255, where 255 means that there are three candidate frames for each depth. Each box contains four box coordinate values, a target score, and the probability of each category. The final depth dimension of (3 × (5 + C)) can be obtained, where C represents the number of categories, and is set to 80 by default. The algorithm divides the image area according to a certain step size, for example, 32. Each depth of the final map corresponds to a grid. The width and height of the candidate frame are calculated from the offset of the anchor frame, as shown in Equations (1)–(4).
b x = σ ( t x ) + c x
b y = σ ( t y ) + c y
b w = p w e t w
b h = p h e t h
where b x , b y are the detection results, b w , b h presents the width and height of the detected box respectively, t x , t y are the predicted target center coordinates, t w , t h presents the width and height of the bounding box respectively. c x , c y is the upper left coordinate of the grid and P w , P h presents the width and height of the anchor box respectively.
2.
Multi-scale prediction
For multi-scale prediction, YOLOv3 draws on the idea of the FPN algorithm [29] to predict in three scales, that is, the detection layer is used to detect on three feature maps of different sizes, and the step size is 32, 16, and 8. This means that if the input is 416 × 416, the detection scales are 13 × 13, 26 × 26, and 52 × 52, respectively. The network down-samples the input image before the first detection layer. After one detection, the up-sampling with a factor of 2 is applied for expansion, it is connected with the layer with the same feature map size before the first detection, and then the first detection is performed. The second detection is the same as the third detection, which helps to detect small targets. A total of three candidate boxes are predicted on each grid output at each scale, and each candidate box is based on an anchor box, so there are a total of 9 size anchor boxes.
3.
Non-maximum suppression
Non-Maximum Suppression (NMS) is a key algorithm for target detection. It is used for the secondary screening detection frame during model prediction. The first screening removes the frames whose target score is lower than the target score threshold O t . According to the above theory, there are 10,647 candidate frames (13 × 13 + 26 × 26 + 52 × 52) × 3, so there must be a large number of redundant detection frames.

2.1.2. Improved YOLOv3

Although the model trained by the original algorithm of YOLOv3 works well, there are still many missing and wrong detection phenomena. Hence improvement of the original YOLOv3 algorithm to further improve the index, reduce false detections, enhance the ability of missing detections to resist the interference of shore objects, and the detection efficiency should be done. Figure 2 shows the schematic diagram of Improved YOLOv3 detection process.
Three improvements have been made to the YOLOv3 detection algorithm for the inland ship sector.
  • Optimize the initial value of the anchor frame based on the Kmeans algorithm
The original YOLOv3 algorithm uses 9 anchor frames, and each detection frame of each detection layer was offset based on a different anchor frame. The width and height values of each anchor frame were obtained based on the VOC data set. The VOC data set has various types of detection objects, including people, cattle, etc., and is not suitable for the ship data set used in this paper. The shape of the ship has larger width than its height, so it is not suitable to use the original width and height of the anchor frame.
Based on the shape characteristics of the ship, the Kmeans algorithm was used to optimize the initial value of the anchor box, which shortened the training time. Different cluster numbers, that is, the total number of anchor frames are shown in Table 2 below. Among them, the calculation method of average Intersection over union (avg IoU) was done by calculating IoU for each training set label and the center obtained by clustering, taking the largest IoU value as the value of this label, and finally average all the label values to get avg IoU.
We see that when the number of clusters reaches 9, the increase in avg IoU value has almost stagnated. And as the number of clusters increases, the risk of model over fitting also increases. Therefore, after weighing, we decided to still use 9 cluster centers.
Table 3 shows the specific width and height of the anchor frame. That the width of the anchor frame obtained by clustering is 1.1 to 3.5 times the height, which is in line with the actual ship situation.
2.
Choice of classifier
In the target detection based on deep learning, the classifier usually uses Softmax or Sigmoid [13,18]. YOLOv3 chose Sigmoid as the classifier based on multi-level categories. For example, the two categories of human and woman are not mutually exclusive, therefore Softmax could not be used. However, the ship data set used in this paper only has three categories, and there are no mutually exclusive categories. At the same time, considering that Sigmoid needs to build three classifiers in three categories, it theoretically causes redundancy, so the classification in the algorithm was replaced with Softmax as shown in Equation (5).
σ ( z ) j = e z j k = 1 K e z k
where σ ( z ) j represents the normalized value of the j-th component of the output Z vector, and K represents the length of the output vector.
3.
NMS algorithm optimization
In the original NMS algorithm, the threshold was set according to whether the intersection ratio of the candidate box and the box with the highest current target score is greater than or equal to the threshold. If it is greater than or equal to the threshold, the candidate boxes will be deleted directly. This method is too simple and direct, which can easily lead to the phenomenon of false detection and missing detection. For example, when two objects are covered with each other, the prediction box of the covered object is easily screened out by NMS algorithm.
Therefore, for the shortcomings of the non-maximum suppression algorithm, the Soft-NMS algorithm was introduced. The improvement idea of Soft-NMS is to smooth the rougher scoring function of the original NMS, instead of using the strategy of direct filtering. Table 4 shows the algorithm steps. Two smoothing functions are proposed in this paper, namely linear weighting function and Gaussian weighting. The specific formulas are shown in Equations (6) and (7) respectively.
s i = { s i ,                IoU ( , b i ) < N t s i ( 1 IoU ( , b i ) ) , IoU ( , b i ) N t
s i = s i e I o U ( , b i ) 2 σ , b i D
where N t is the set IoU threshold, s i is the target score of the candidate box b i .

2.2. Objects Tracking Method

Deep Sort algorithm was chosen as the tracking algorithm in this research, to help in tracking of objects. It adds apparent feature information matching to improve tracking performance. This extension enables the algorithm to track the target within a longer period of occlusion, effectively reducing the number of ID transformations.
The algorithm uses the classic Kalman filter algorithm to predict the position of the tracking target in the current frame and update the tracker parameters. [30] Proposed the Kalman filter in 1960, and it was used to solve many practical problems because of its high efficiency.
x ^ k = A x ^ k 1
P k = A P k 1 A T + Q
Equations (8) and (9) are used to predict the current position of the target, where x ^ k 1 is the shape information of the target k−1 frame, including eight components ( u , v , γ , h , x ˙ , y ˙ , γ ˙ , h ˙ ) , u and v are the center coordinates of the detection frame, γ is the length ratio, h is the height of the frame, and the remaining four components represent the velocity information of the first four components respectively. A is the state transition matrix, P k 1 is the estimation deviation of the target, and Q is the system noise.
K k = P k H T ( H P k H T + R ) 1
x ^ k = x ^ k + K k ( y k H x ^ k )
P k = ( I K k H ) P k
Equations (10)–(12) are used to update the state of the target, where K k is the Kalman gain, P k estimate covariance at time k, H is the transformation matrix between the measured value and the state variable, and covariance of the measurement noise. The algorithm uses a constant velocity motion and a linear observation mode filter to obtain the updated ( u , v , γ , h ) .
Deep Sort solves the matching problem by introducing the linear combination of motion information and feature information. Mahalanobis distance is used to calculate the distance between the prediction result and the detection result of Kalman filter to correlate the motion information, as shown in Equation (13).
d ( 1 ) ( i , j ) = ( d j y i ) T S i 1 ( d j y i )
where d j the position information of the j-th detection frame is, y i is the position prediction information of the i-th tracker by Kalman filter, and S i is the covariance matrix between the detection and tracking positions. When the calculated Mahalanobis distance is less than the set threshold, the association is considered successful, as shown in Equation (14), where χ is the indicator function and t ( 1 ) is the specified threshold.
b i , j ( 1 ) = χ [ d ( 1 ) ( i , j ) t ( 1 ) ]
During movement, rapid displacement is introduced in the image plane, which makes the Mahalanobis distance unsatisfactory in the case of tracking and occlusion, and ID conversion is prone to frequent phenomenon. Therefore, Deep Sort introduces a second indicator in the matching problem. It calculates the minimum cosine distance between the feature set and the feature descriptor of the detection result, as shown in Equation (15).
d ( 2 ) ( i , j ) = min { 1 r j T r k ( i ) | r k ( i ) i }
where r j is the feature descriptor of the jth detection-result. The two indicators complement each other by providing different aspects of the matching problem.
Mahalanobis distance provides information about possible object positions based on motion, which is particularly useful for short-term prediction. On the other hand, cosine distance considers the appearance information, which is very effective in the case of long-term occlusion. At this time, the motion is not so discriminative.
The linear combination of the last measurement methods is the final measurement, as shown in Equation (16).
c i , j = λ d ( 1 ) ( i , j ) + ( 1 λ ) d ( 2 ) ( i , j )
Lastly, Deep Sort introduces cascade matching, giving priority to tracking targets that appear more frequently. This means, for objects with same occlusion time can be allocated each time.
Furthermore, the feature extraction module of the Deep Sort algorithm was improved for inland river scenes. Fusion features based on HOG, SIFT (Scale-Invariant Feature Transform) and gray histogram features were extracted for ships. PCA (Principal Component Analysis) algorithm is considered to reduce the dimension of SIFT features resulting in less redundancy. PCA is mainly based on the idea of maximum variance, that is, the greater the variance of a certain dimension of data, the more useful information the dimension package contains. Deleting the dimension with less information will not result in less information.
Figure 3 below shows the cumulative ratio of variance under different principal components. When the number of principal components reaches 55, the cumulative variance ratio is higher than 95%, and the length of the one-dimensional vector after the feature matrix expansion is reduced by 57%, so 55 principal components were selected to represent each feature point.
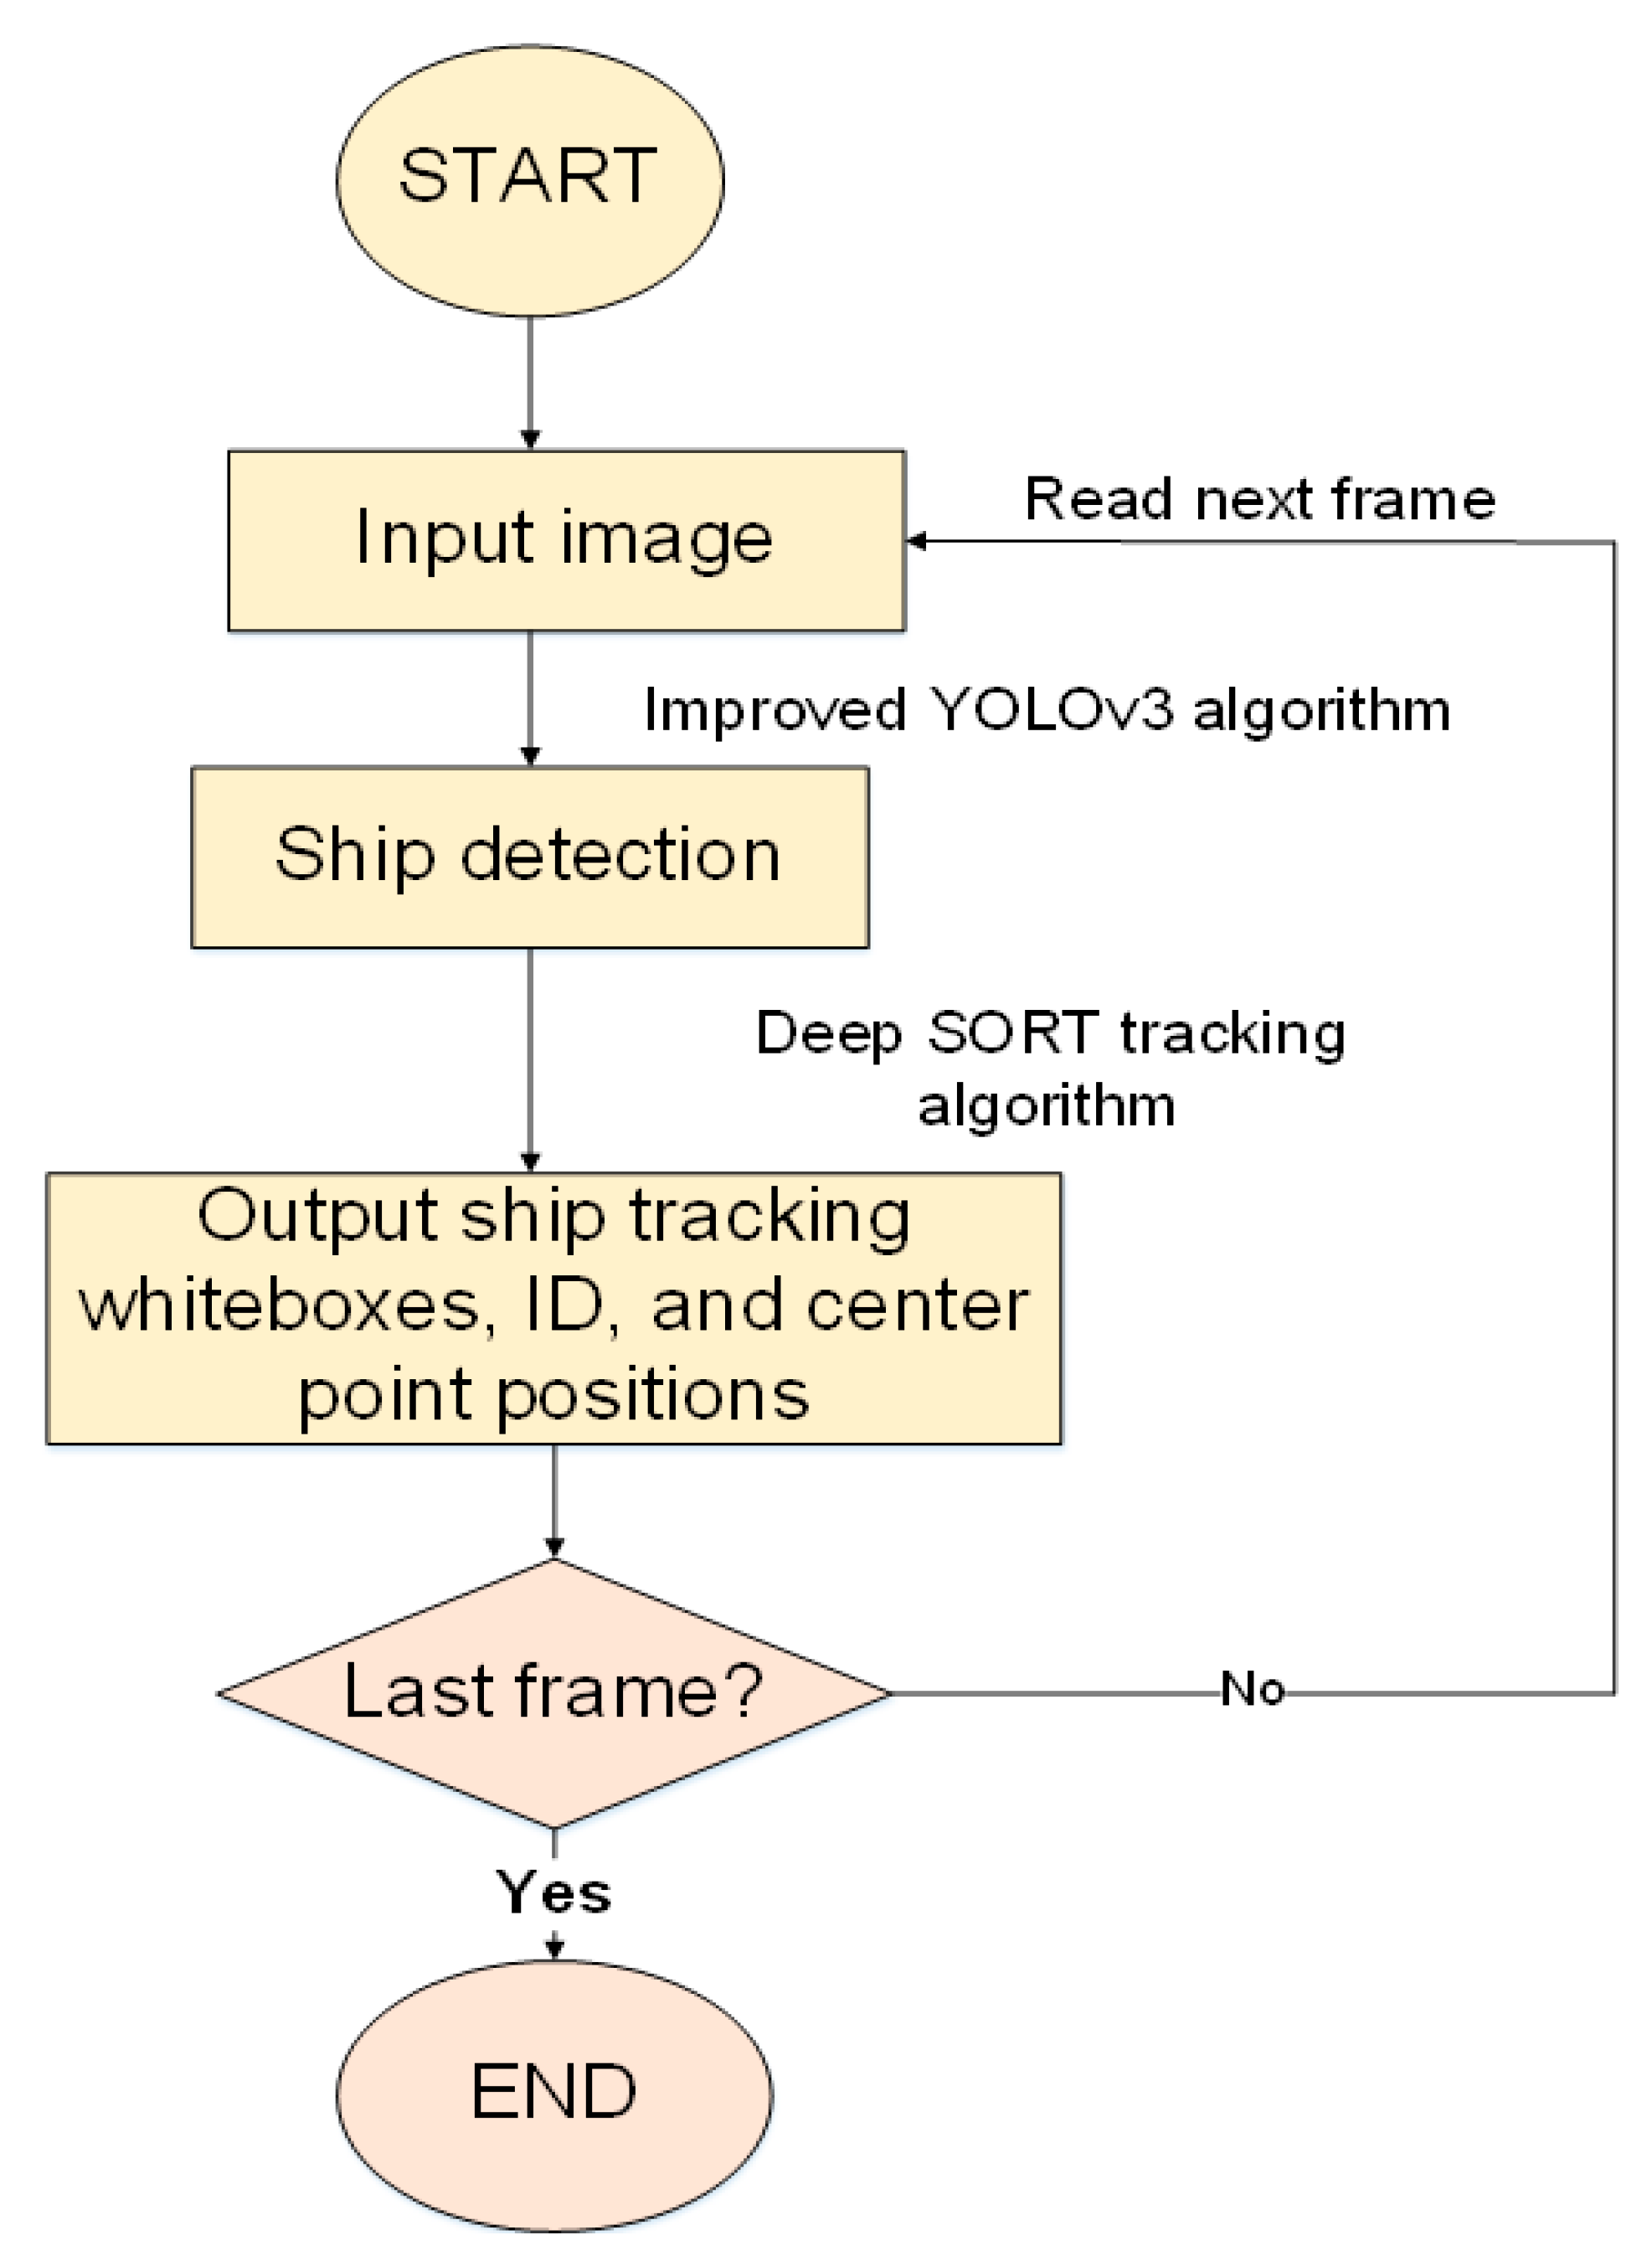
The three extracted features are respectively expanded into one-dimensional vectors and then spliced as the extracted features of Deep Sort. Figure 4 shows the flowchart of ship detection and tracking. It uses the improved YOLOv3 detection method and Deep Sort algorithm.

3. Results and Discussion

The experimental environment was a 64-bit Win10 Pro, the CPU is i5- 3230 M, the frequency is 2.60 GHz, and the memory is 6 GB. When experimenting with Deep Sort, an NVIDIA GeForce GTX 1070Ti GPU was used for acceleration.

3.1. Data Training

The dataset was collected from the Yangtze River which is found in Wuhan, China. Yangtze River is a waterway for a large number of domestic ships. The presence of many navigating ships is useful for taking images and video data for data sets. Therefore, different images and video were shot on both sides of the Yangtze River to create our dataset.
Because YOLOv3 model is trained based on VOC data set and has 80 categories, it was necessary to modify the convolution kernel depth of three detection layers when loading the model, that is, the original one was changed to 24. At the same time, when using transfer learning to load the pre-training model, we ignored the parameters detected in the pre-training model, and used the random initialization method to assign values separately.
For ship image preprocessing, guided filtering was used to eliminate any noise that could result from the captured video.
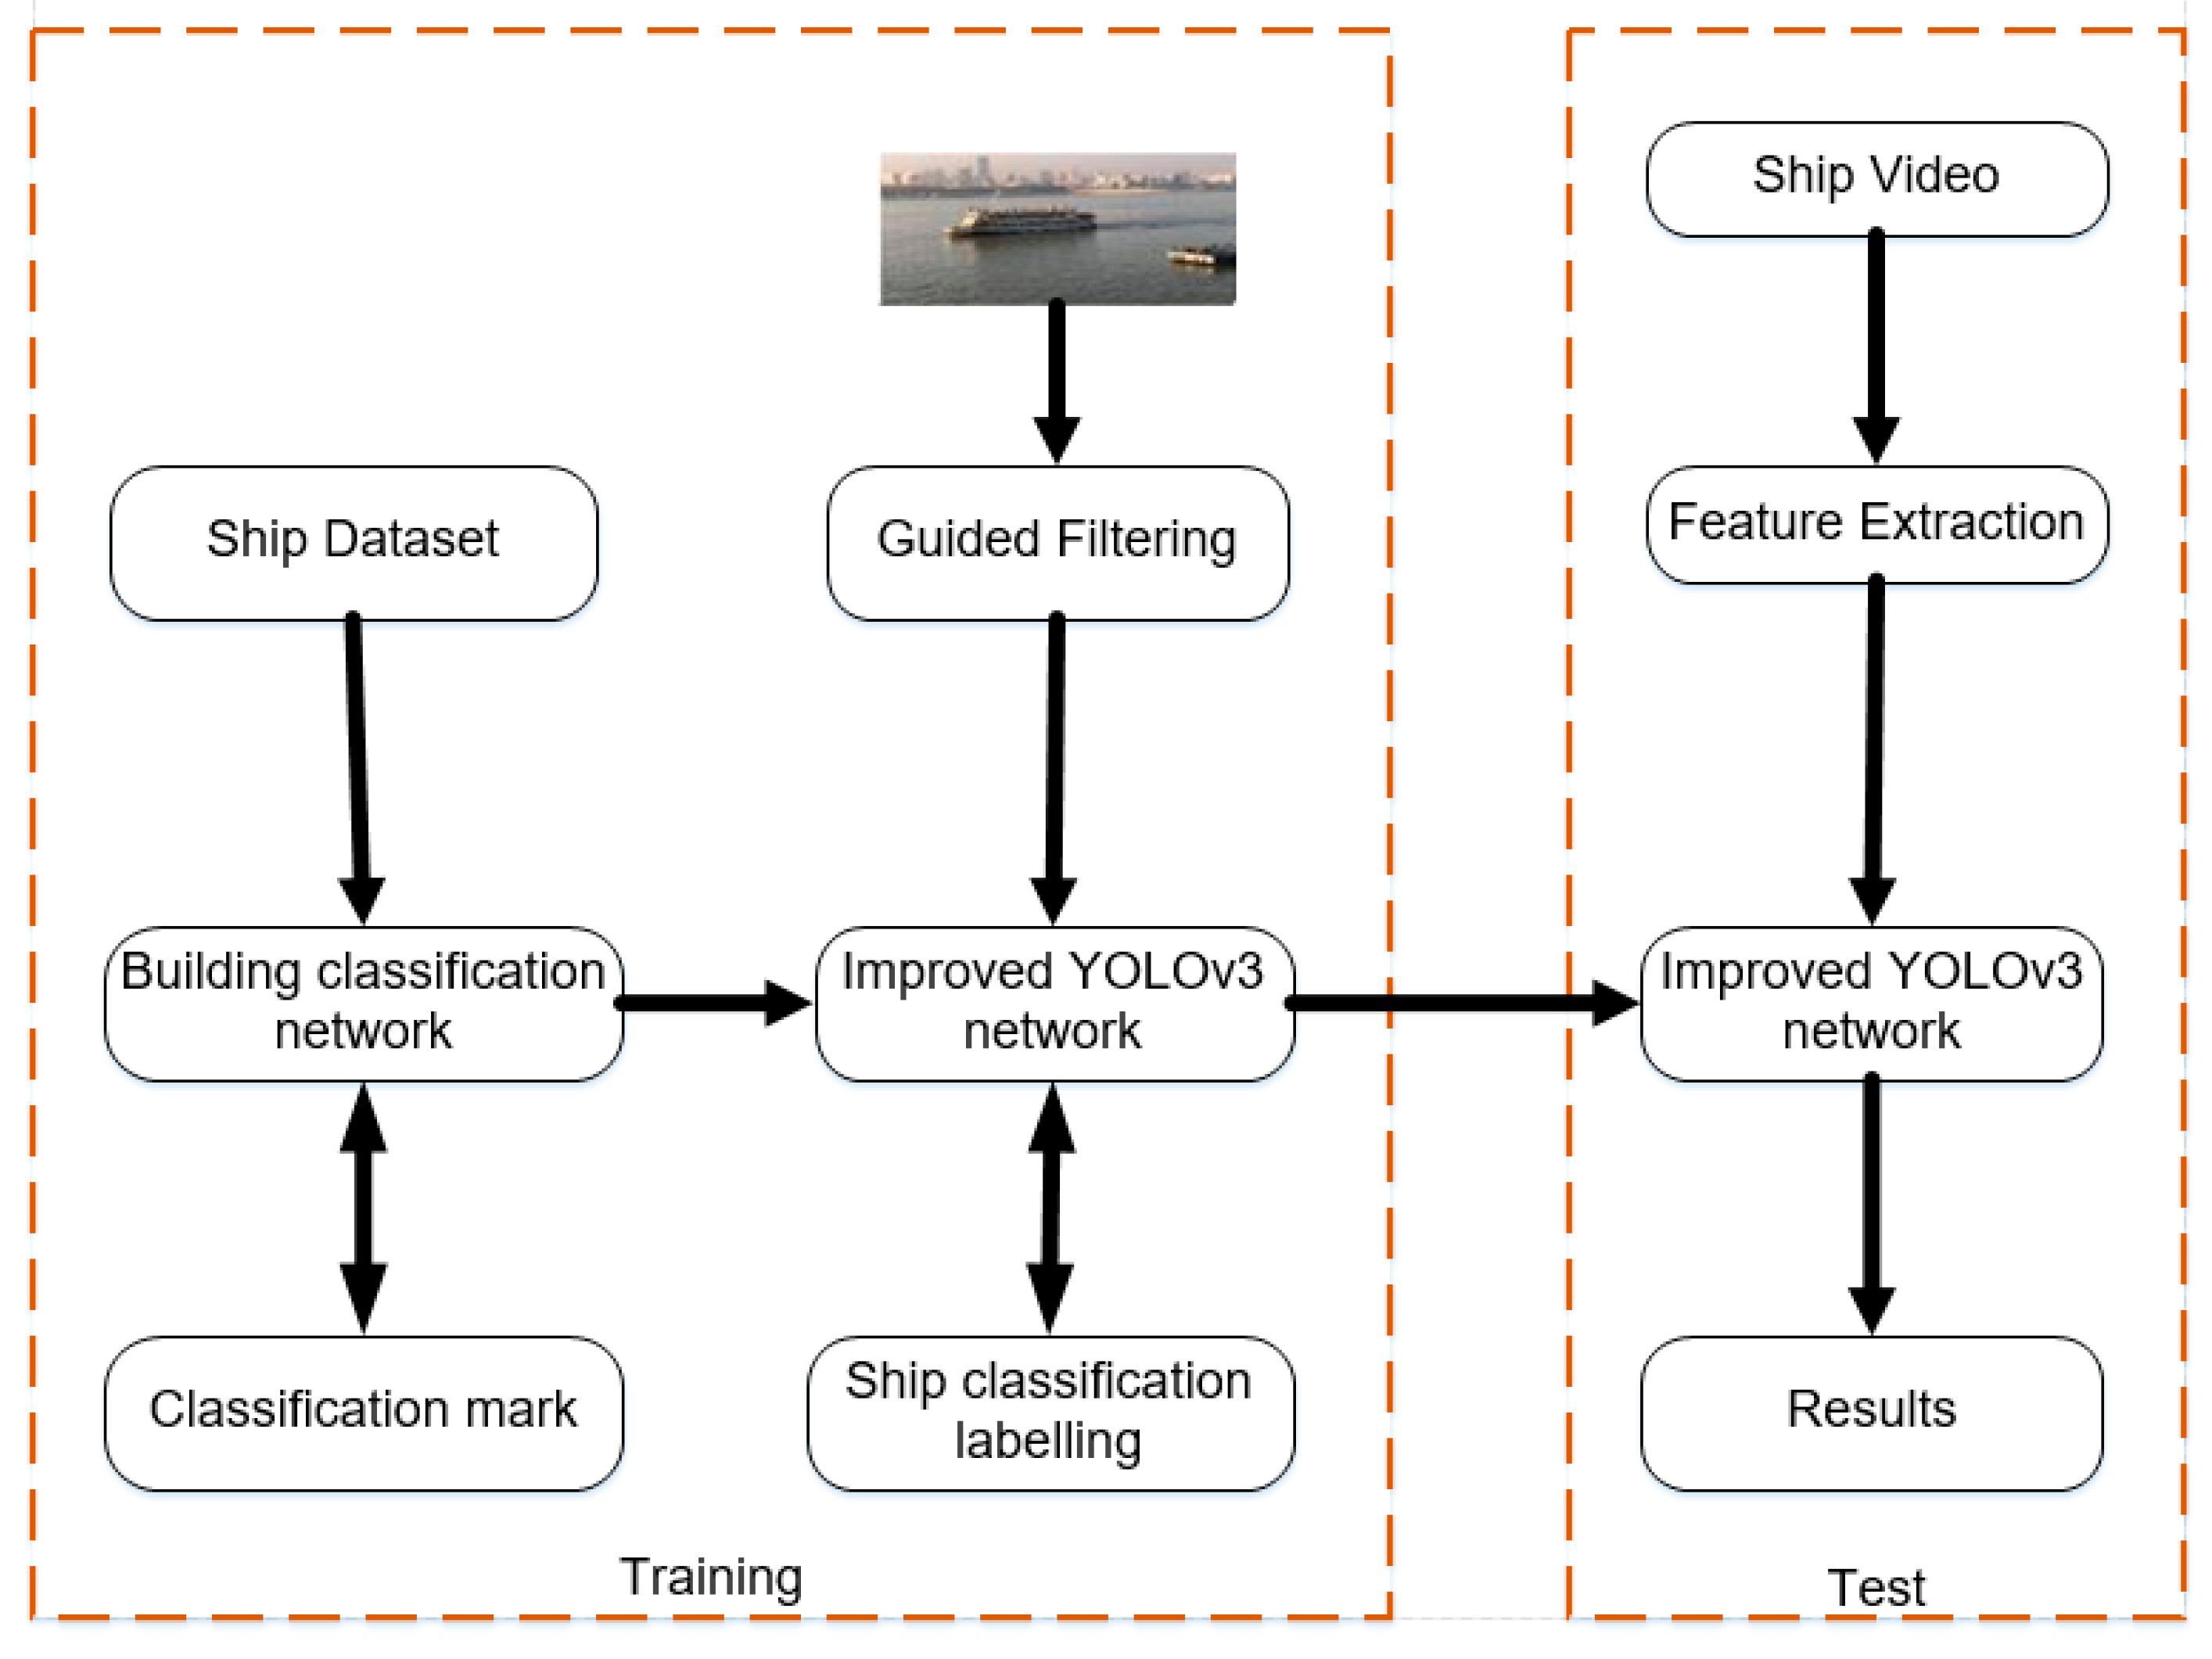
Due to the small number of pictures in the self-made data set used in this experiment, it was easy to over fit the training model. Therefore, the data amplification methods such as translation, rotation, shear, zoom, flip, HSV saturation and brightness were used to multiply the size of the training set. The flow chart of the training process is shown in Figure 5.

3.2. Validation

To evaluate the effectiveness of the proposed algorithm, the same data set was used in all proposed and classical algorithms to provide proper judgement.
Different evaluation parameters such as the Intersection over Union (IoU) and mAP were calculated to see the effectiveness and accuracy of improved YOLOv3 algorithm. Intersection over Union (IoU) is a measure based on the Jaccard similarity efficient. It is used to evaluate the overlap between the label box B g t and the predicted bounding box B p , as shown in Equation (17). The effectiveness of the predicted bounding box is determined according to whether the overlap area is greater than the specified threshold [31].
IoU = area ( B p B g t ) area ( B p B g t )
Precision and recall rate are common evaluation indicators to measure target detectors. They are shown in Equation (18) below. Where TP means true positive, FP is false positive, FN is false negative. The sum of TP and FP samples is all the samples predicted to be positive, and the sum of TP and FN samples is all the samples that are labeled as positive.
Precision = TP TP + FP Recall = TP TP + FN
mAP is an evaluation indicator used to detect the precision of the target detection algorithm by setting IoU threshold [15].
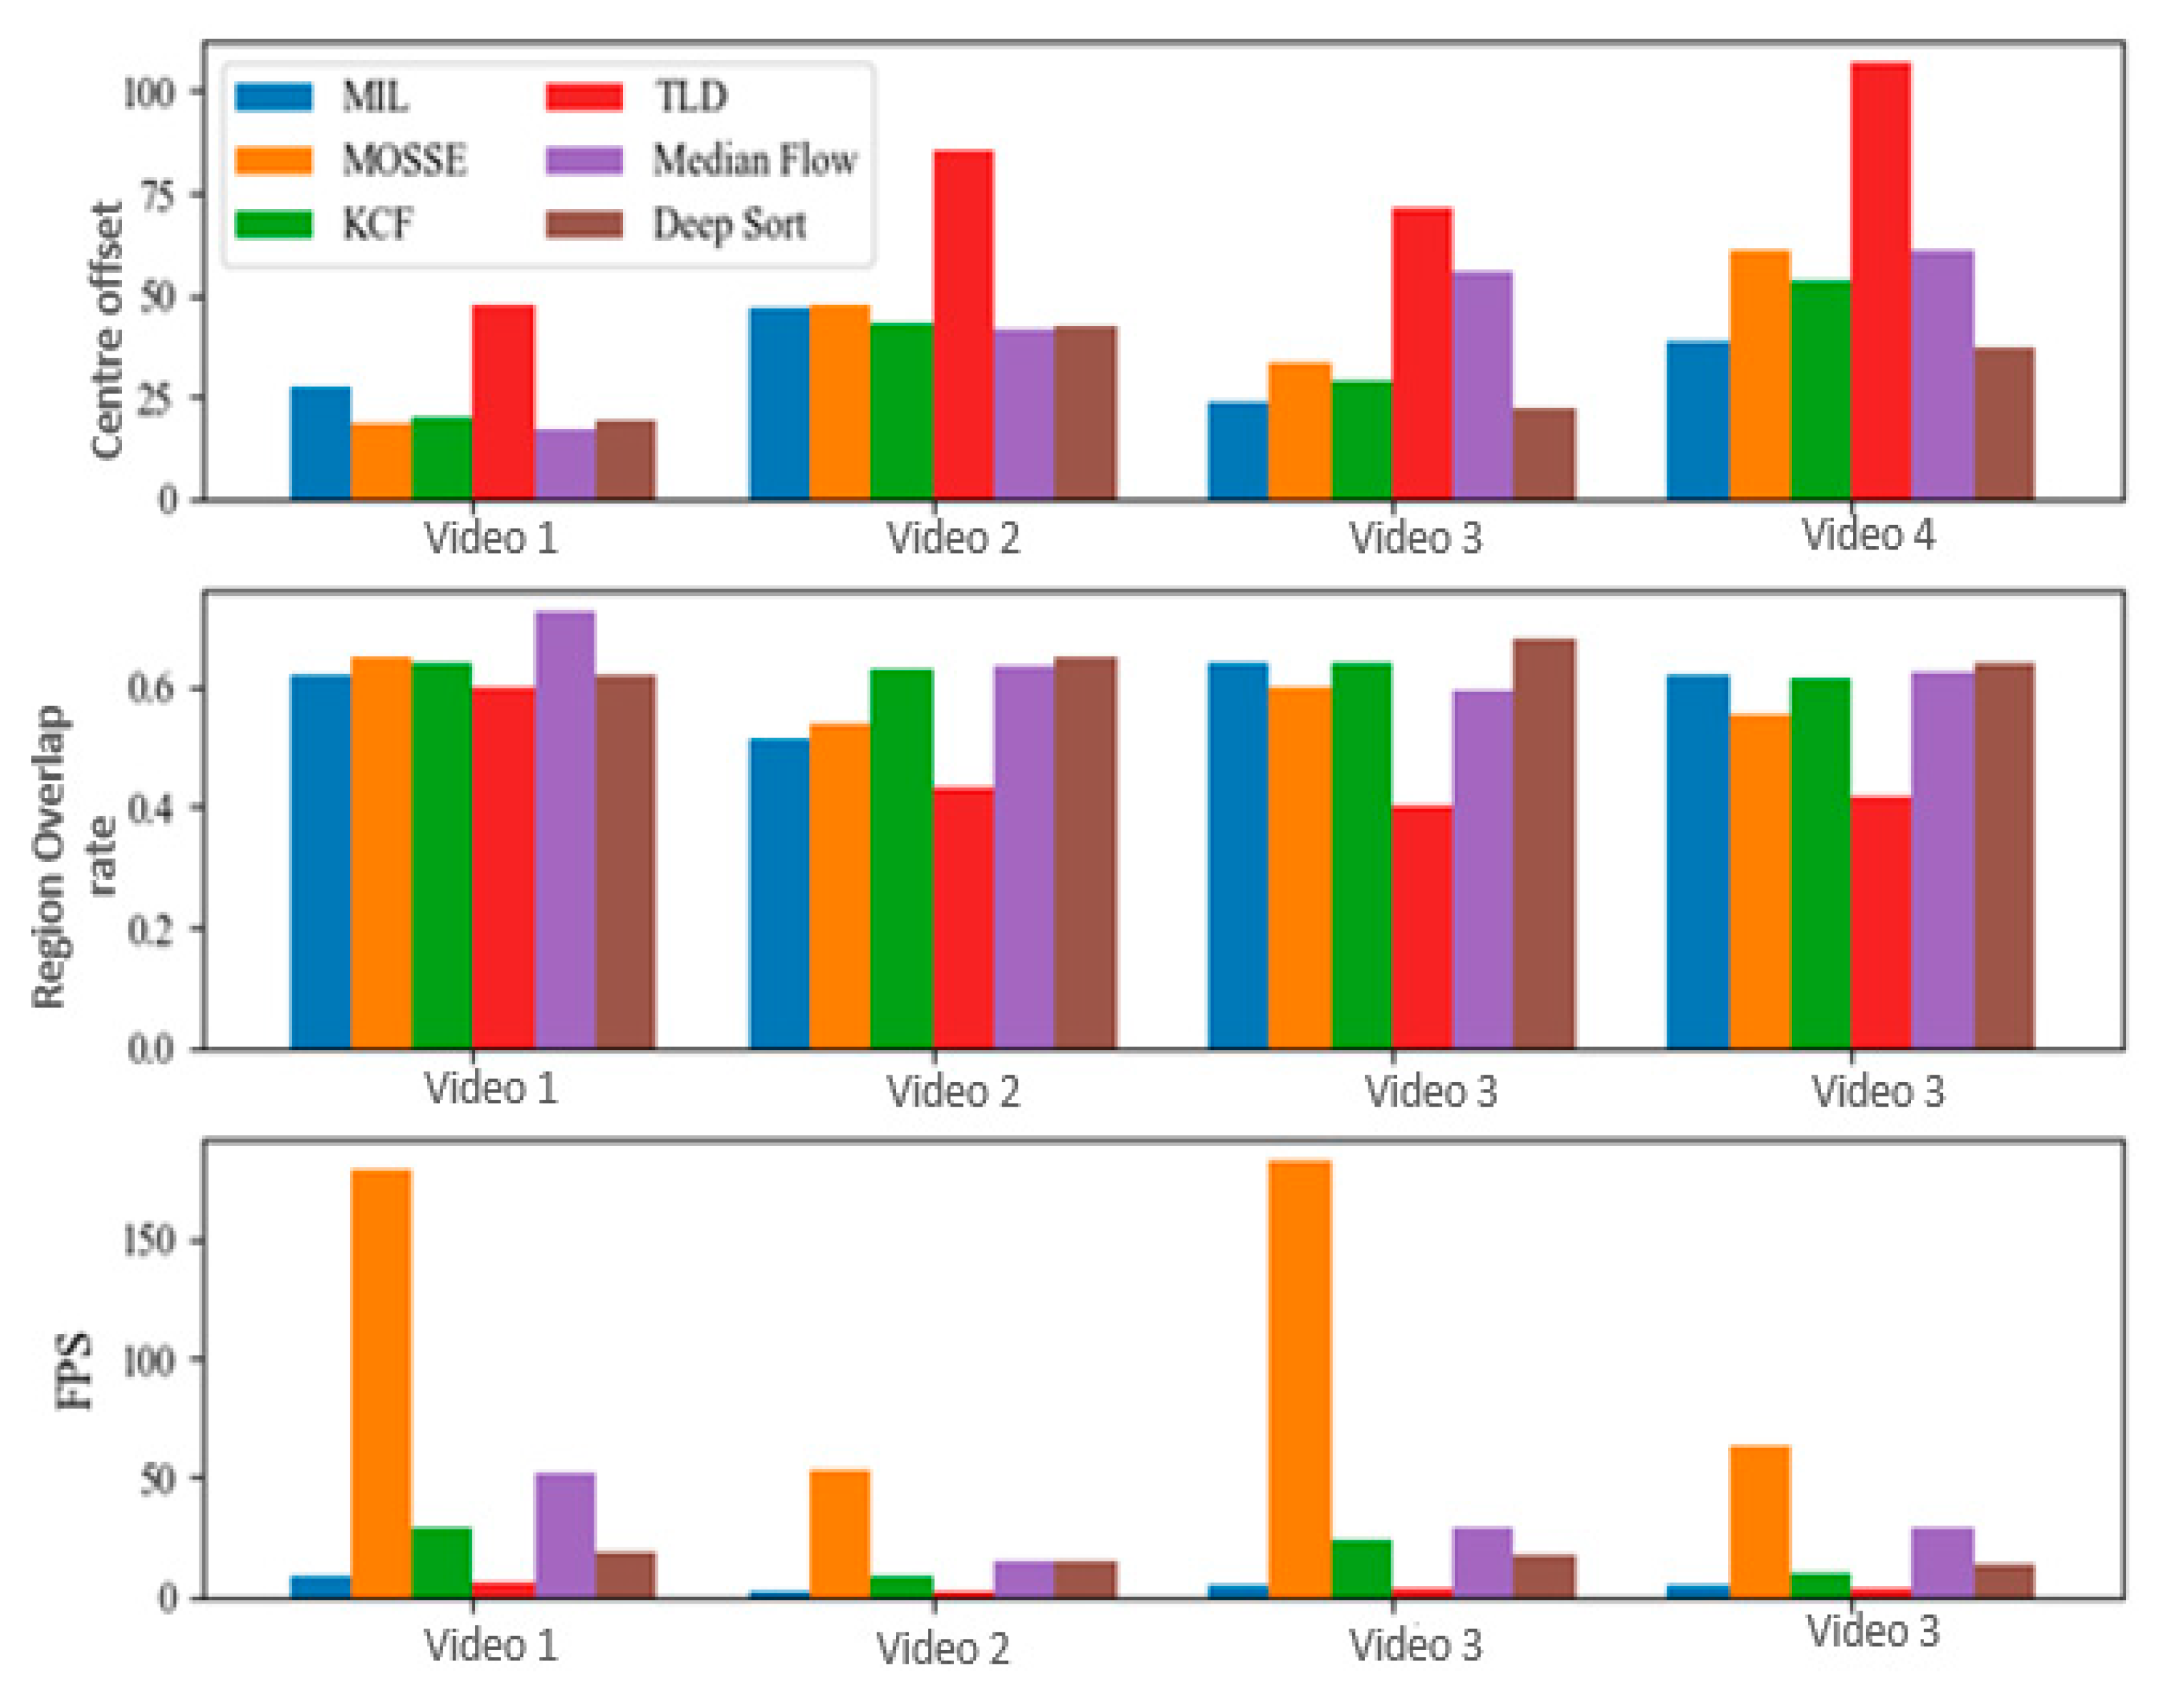
For tracking analysis three indicators are used, namely the center offset CE, the regional overlap rate RO, and FPS. The center offset index measures the center point of the tracking frame and the real frame of the algorithm, as shown in Equation (19), where ( x n m , y n m ) , ( x g n m , y g n m ) represent the center point of the nth tracking frame of the video and the center point of the real frame respectively, and N and M are the target number of the video frame respectively.
CE = 1 MN n = 1 N m = 1 M ( x n m x g n m ) 2 + ( y n m y g n m ) 2
Regional overlap rate (RO) calculates the average IoU of each valid frame, as in formula (20) to solve the problem of ship scale changing. Due to the consideration of the area factor, the center offset of this index is insufficient.
RO = 1 MN n = 1 N m = 1 M IoU ( f n m , f g n m )
FPS is the number of frames processed per second, used to measure the real-time performance of the algorithm.
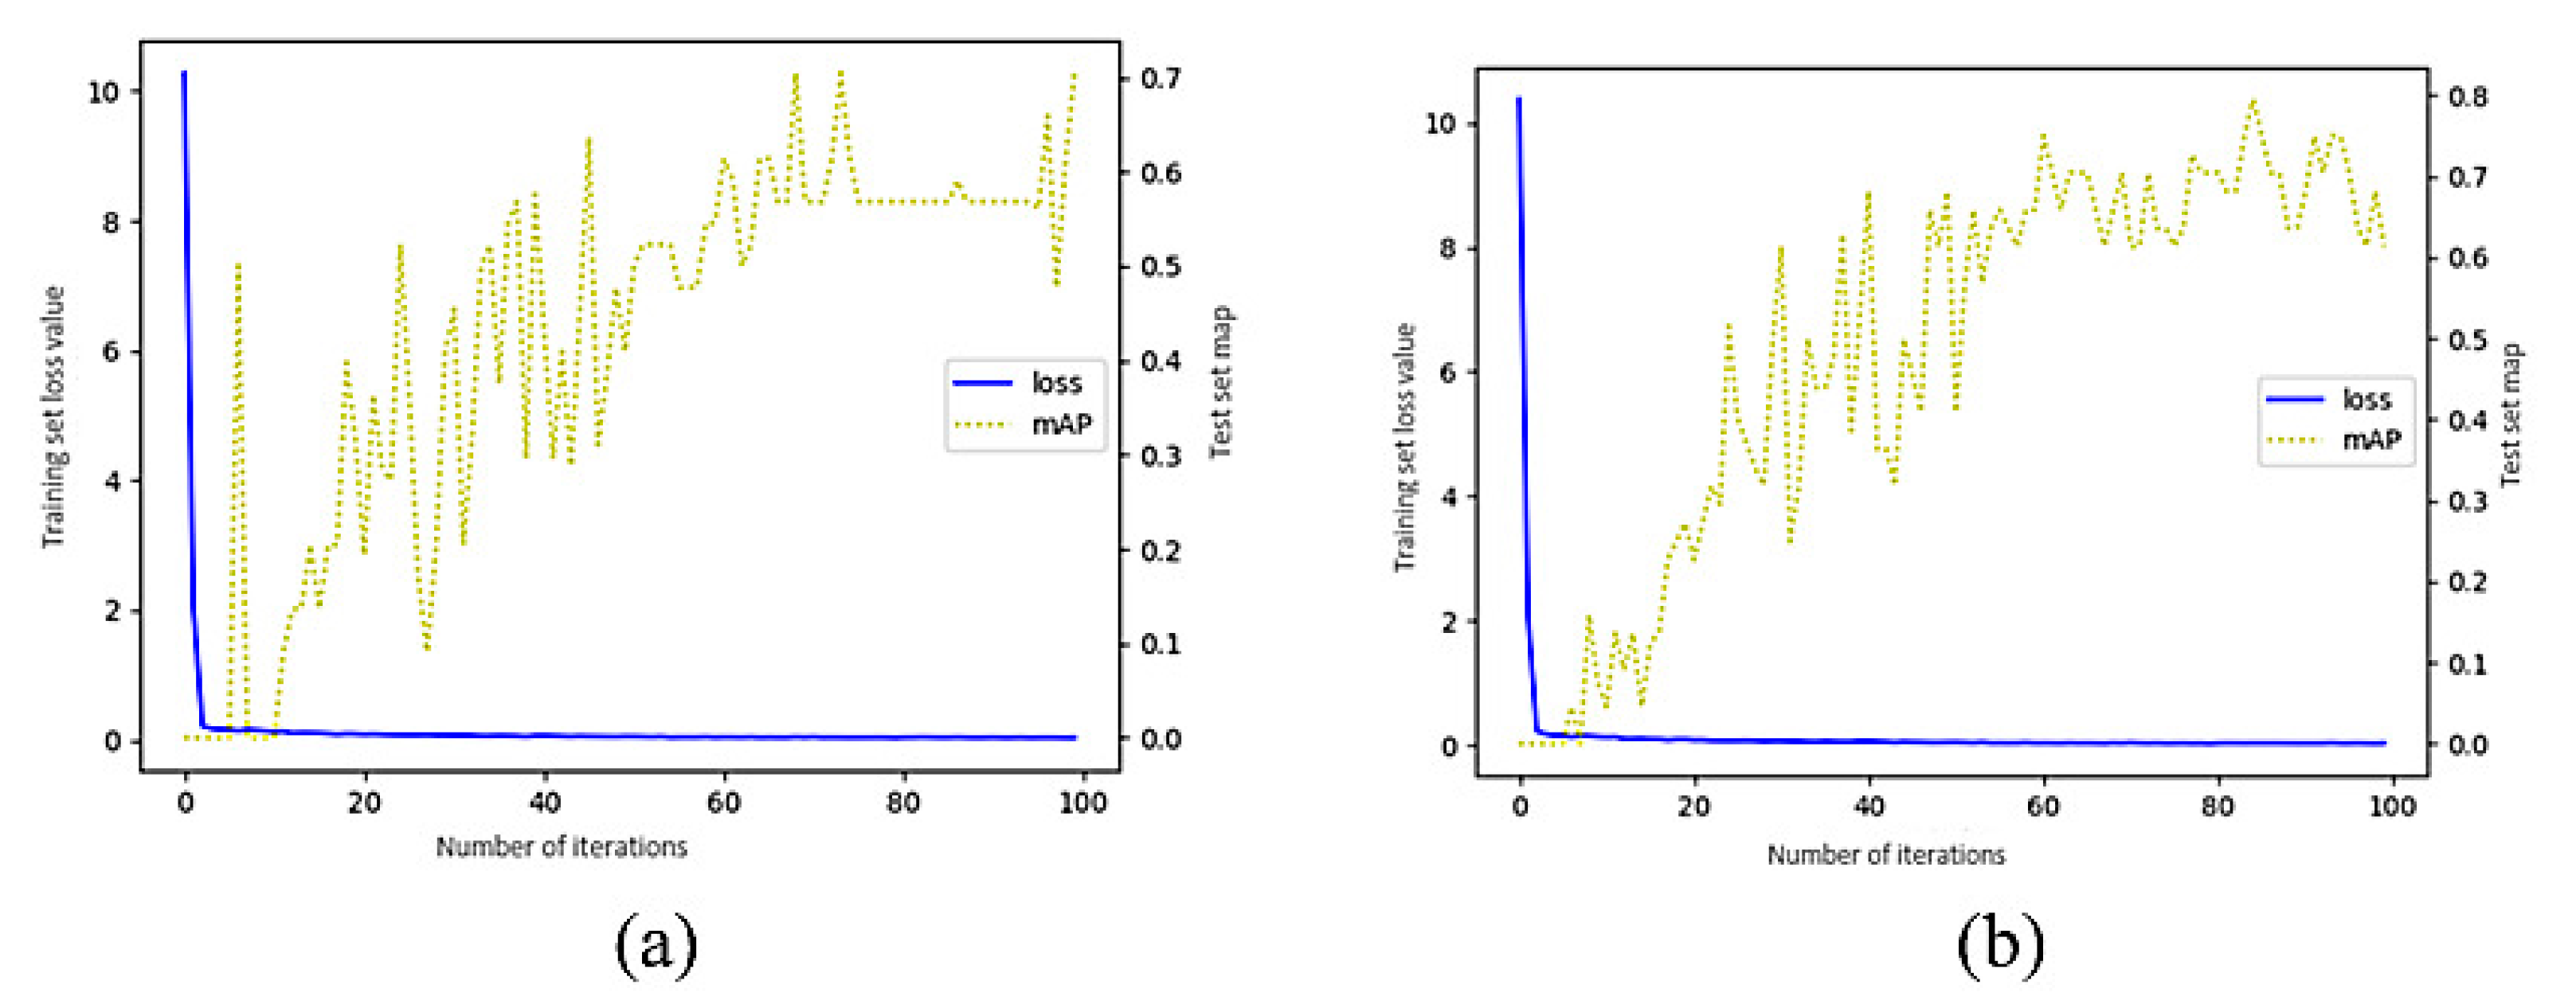
The loss value of training set and the change of map index of test set with iteration times in the process of model training for original and improved YOLOv3 algorithm are shown in Figure 6a,b respectively. The mAP index of test set is calculated based on the image input size of 608 × 608, IOU threshold of 0.45, and target score threshold of 0.4. It is observed in Figure 6b, that the change of loss value during the training process is basically the same, which rapidly drops to about 0.5 in the first few iterations and then decreases. mAP was also performed under the same hyper parameter settings, and the maximum value reached was about 0.8.

3.3. Experimental Result and Analysis

3.3.1. Contrast Experiment of Ship Detection in Real Time

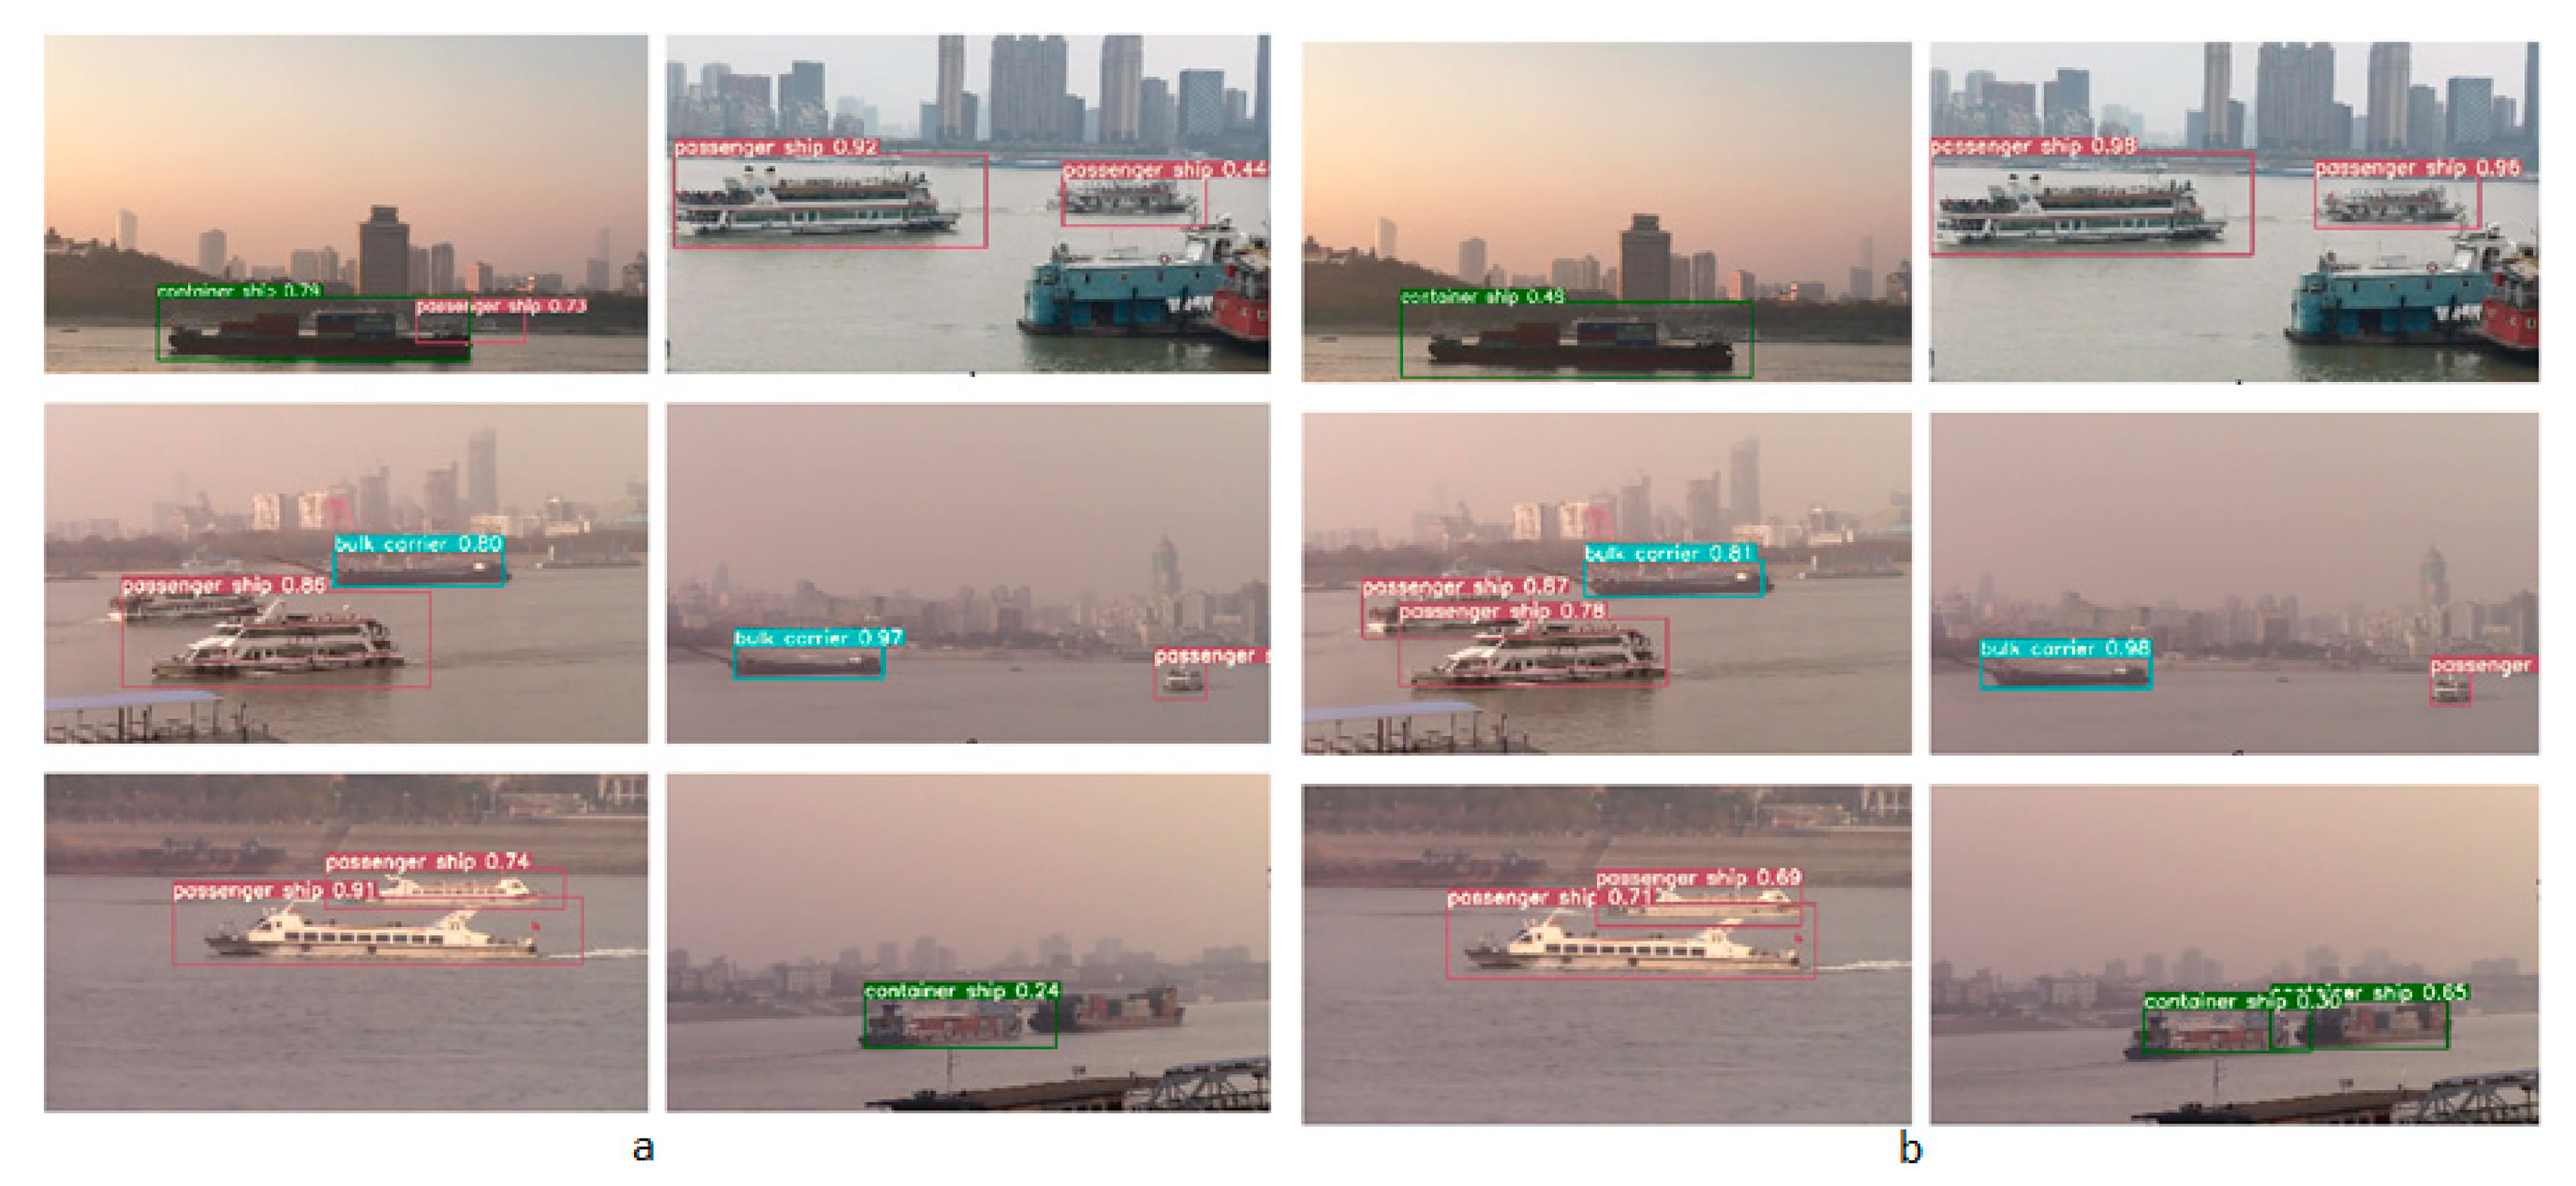
The experiment was done to detect the ships in real time using the original YOLOv3 algorithm and proposed ship YOLOv3 algorithm as shown in the Figure 7 below. The first frame in Figure 7a, mistakes the background for a passenger ship. The background interference in the first frame of Figure 7b is further reduced, and the improved algorithm successfully avoids background false detection. It can also can be seen from third frame of Figure 7a that the algorithm still missed detection, and two of the three ships were detected. At the same time, due to the small size of the container ships in the training set, the algorithm has poor recognition capabilities. The third frame in Figure 7b accurately detected 3 ships, and there was no mutual influence when the targets were very close. Only one container ship was detected in the last frame in Figure 7a, and the confidence level was low, only 0.24. However, the last frame in Figure 7b shows the algorithm’s enhancement of the ability to identify container ships.
Next, the experiment was quantitatively analyzed. YOLOv3 adapts the model structure of fully convolution, and the size of the input image is not limited. This is also the reason for the random scaling of the image in the data amplification. At the same time, the algorithm has hyper parameter IoU threshold N t and a target score threshold O t . Preliminary experiments show that N t has little effect on the experimental results in normal range, so it is necessary to compare different image sizes and index changes under O t .
The specific results of original YOLOv3 algorithm are shown in Table 5. The value outside the brackets in the table is the mAP index, and the value inside the brackets is the FPS. It can be seen that FPS is roughly inversely proportional to the image size. When O t equal to 0.5 and the image size is 352, the FPS is the highest, but the mAP is lower. When O t equal to 0.1 and the image size is 480, the mAP reaches 0.909, but the FPS is lower. Therefore, combining two factors, when O t equal to 0.2, the image size is 480 times higher detective performance.
Table 6 shows the quantitative result analysis of the Improved YOLOv3 algorithm. It can be seen that the overall mAP has been improved to a certain extent. When O t is equal to 0.1 and the image size is 480 × 480, the mAP reaches 0.955, which is about 0.05 higher than the highest value before the improvement.
From the study of this article it can be seen that the proposed YOLOv3 algorithm compared with the YOLOv3 algorithm, the mAP, and FPS of the improved algorithm are increased by about 5% and 2, respectively. The specific values are shown in Table 7. The detection and classification of ship target positions are better than the original YOLOv3 algorithm which proves that the improved algorithm can effectively detect ship targets from inland river ship images.

3.3.2. Experiment of Ship Tracking in Real Time

The conducted experiment involved a combination of an improved YOLOv3 network detecting algorithm and a Deep Sort tracking algorithm. The Deep Sort original model was originally used in the field of pedestrian detection. The parameters of the CNN feature extractor are trained based on the MOT16 data set, and each pedestrian is a category, which is difficult to achieve in the field of ships. Hence the original feature extractor of Deep Sort was changed to fit with ship dataset.
In order to measure the tracking effect of the tracking algorithm in various scenes, four representative ship videos were selected. These videos had the following scenes: partial occlusion, full occlusion, scale change, midway appearance, multiple targets, and camera movement. Table 8 lists the interference items in each category.
For each category of video, the Deep Sort algorithm was compared with the classical algorithms MIL [32], MOSSE [33], KCF [34], TLD [35], and Median Flow [36] respectively. The classical algorithm needs to locate the real target in the first frame, and considering that Deep Sort uses the improved YOLOv3, in order to maintain the similar environment outside the tracking algorithm to a large extent, the improved YOLOv3 algorithm was used to detect the first frame of each classical algorithm. The experimental results are shown in Figure 8.
According to the analysis in Figure 8, when there was no interference item in the ship video, the center offset of the tracking algorithm and the regional overlap rate index value had little difference due to easier detection and tracking.
In the case of occlusion, KCF, Deep Sort and median flow are the best, as they tracked the target successfully even when the target was occluded for a period of time. When there was a ship entering the picture in the middle of the video, the performance of the classical algorithms was very poor. This is because they rely on the detection of the first frame and do not perform the detection again in the subsequent tracking, so they cannot track the ship entering the picture in the middle of the video. As Deep Sort performs detection in every frame to correct the tracking result, it can delete the disappeared targets in a timely manner and add the targets that enter the screen halfway. When the video picture moves, the performance of MIL, Medium flow, and TLD algorithms is poor. When the target leaves the picture, the corresponding tracking box continues to exist and does not disappear or shrink. Figure 9 shows the algorithm tracking the video with partial occlusion and leaving the screen.
Next, the performance of the tracking algorithm was analyzed one by one: compared with other algorithms, MIL performance was slightly mediocre, and there was a certain gap between the data. It was faced with the problem of occlusion that resulted from the change of the viewpoints. The MIL tracker tended not to succeed in improving the tracking target even after the occlusion.
The speed of the MOSSE algorithm is the fastest in the experimental algorithm, and it performed well when tracking the target without interference, but when there was a certain interference, the performance dropped seriously, so it is suitable for ship tracking in simple scenes with high real-time requirements.
KCF has more frame per second (FPS) reduction in the case of more targets, and this is because of its fixed sized filters. It is suitable for tracking ships where there is no viewpoint change, scale change, and deformation. When these characteristics appeared it resulted in a track loss as seen in Figure 9 below.
Medium flow algorithm was relatively stable, except in the case of midway through the picture. Median Flow tracker achieved well on constant and slowly moving video sequences. Nevertheless, occasional occlusion stopped it from making an arrangement in bidirectional and the tracking failed.
In addition to the simple scene, the TLD algorithm had serious jitter in the tracking frame, and it easily lost the target or tracked another target by mistake. The FPS is also very low, so it was difficult to implement in real time. Especially, the TLD algorithm tracker can be a good choice in tracking a target that can disappear from one place and appear in another.
Deep Sort algorithm has a great performance advantage in complex scenes, and is robust to occlusion, camera movement, and other interference, but the performance of the algorithm depends on the support of GPU to a large extent, and the CPU performance is poor. Hence it can be used in applications which have a high speed demand and in complex scenes.
Although our proposed framework confers promising results, it renders complexity as compared to the existing techniques. First, our framework introduced soft NMS to the conventional YOLOv3. Second, larger memory usage was detected during execution. Nevertheless, the processing time was fairly the same with YOLOv3. The two challenges introduced by our algorithm have been depicted again in the improved Deep Sort; there, larger processing time of 53 s and memory usage of 1.68 GB was demonstrated contrary to the existing techniques such as MOSSE and MIL which used about 22 s and 1.4 GB memory size. However, with the advancement of graphic memory, the increased memory usage is no longer as much of a challenge.

4. Conclusions

In order to resolve the problem of ship collision in inland waterways, which can result in dangerous accidents, ship detection and tracking based on improved YOLOv3 detection and Deep Sort algorithms was proposed to detect and track ship targets. This involved two processes; the improvement of YOLOv3 detection algorithm, and then the use of Deep Sort tracking algorithm for the tracking of ship targets. For the YOLOv3 algorithm, it was improved in three parts.
Firstly, based on the shape characteristics of the ship, the Kmeans algorithm was used to optimize the initial value of the anchor box, which shortened the training time. Secondly, based on the characteristics of the ship’s fewer types with mutual exclusion, several sigmoid classifiers used in the original model were modified into a single Softmax classifier. Finally, for the shortcomings of the non-maximum suppression algorithm, the Soft-NMS algorithm was introduced.
The effectiveness of the proposed improved YOLOv3 algorithm in real-time detection was verified by various experiments. Compared with the YOLOv3 algorithm, the mAP and FPS of the improved algorithm increased by about 5% and 2, respectively. Hence after analysis it has proved that the improved detection algorithm has obvious improvement in detection effect and real-time performance.
For tracking of ships the Deep Sort tracking algorithm was used. Deep Sort uses the improved YOLOv3 detection algorithm for tracking of the ship. The validity of the improved algorithm was analyzed by comparing experiments of the improved Deep Sort and other classical tracking algorithms such as KCF, MIL, MOSSE, Median flow, TLD in multi-scene. Based on analysis, we see that the Deep Sort algorithm presented greater performance advantages in complex scenes, and was robust to interference such as occlusion and camera movement. Hence it can be used in real time performance. However, the performance of the algorithm depends to a large extent on the support of the GPU.
Despite the proposed algorithm in this paper obtaining sufficient results in real-time detection and tracking of ships, more work still needs to be carried out to improve the performance of our methods. Firstly, the categories of ship need to be increased in future, and the tracking of ships need to be analyzed more in order to ensure environmental safety and good port management in inland waterway transport. Secondly, more investigation should be done to depict the research gap in its mathematical options.

Author Contributions

Conceptualization, Methodology and writing original draft, L.L.; Methodology, validation, supervision, review, Y.J.; formal analysis, editing F.M.; review, M.A. All authors have read and agreed to the published version of the manuscript.

Funding

This work was supported by the National Science Foundation of China (Grant No. 51879211), and the National Key Research and Development Project of China (Grant No. 2020YFB1710800).

Institutional Review Board Statement

Not applicable.

Informed Consent Statement

Informed consent was obtained from all subjects involved in the study.

Data Availability Statement

The data presented in this study are available on request from the corresponding author. The data are not publicly available due to data are still used in proceeding project which is not allowed to share.

Conflicts of Interest

The authors declare no conflict of interest.

References

  1. Chen, J.; Chen, D.; Meng, S. A Novel Region Selection Algorithm for Auto-Focusing Method Based on Depth from Focus. In Proceedings of the Fourth Euro-China Conference on Intelligent Data Analysis and Applications, Cham, Swizerland, 1 October 2018; pp. 101–108. [Google Scholar]
  2. Tiwari, A.; Goswami, A.K.; Saraswat, M. Feature Extraction for Object Recognition and Image Classification. Int. J. Eng. Res. 2013, 2, 9. [Google Scholar]
  3. Du, C.-J.; He, H.-J.; Sun, D.-W. Chapter 4—Object Classification Methods. In Computer Vision Technology for Food Quality Evaluation, 2nd ed.; Sun, D.-W., Ed.; Academic Press: San Diego, CA, USA, 2016; pp. 87–110. ISBN 978-0-12-802232-0. [Google Scholar]
  4. Lowe, D.G. Distinctive Image Features from Scale-Invariant Keypoints. Int. J. Comput. Vis. 2004, 60, 91–110. [Google Scholar] [CrossRef]
  5. Dalal, N.; Triggs, B. Histograms of Oriented Gradients for Human Detection. In Proceedings of the 2005 IEEE Computer Society Conference on Computer Vision and Pattern Recognition (CVPR’05), San Diego, CA, USA, 20–25 June 2005; Volume 1, pp. 886–893. [Google Scholar]
  6. Vapnik, V. The Support Vector Method of Function Estimation. In Nonlinear Modeling: Advanced Black-Box Techniques; Suykens, J.A.K., Vandewalle, J., Eds.; Springer: Boston, MA, USA, 1998; pp. 55–85. ISBN 978-1-4615-5703-6. [Google Scholar]
  7. Schapire, R.E. Explaining AdaBoost. In Empirical Inference; Schölkopf, B., Luo, Z., Vovk, V., Eds.; Springer: Berlin/Heidelberg, Germany, 2013; pp. 37–52. ISBN 978-3-642-41135-9. [Google Scholar]
  8. Kaido, N.; Yamamoto, S.; Hashimoto, T. Examination of Automatic Detection and Tracking of Ships on Camera Image in Marine Environment. 2016 Techno-Ocean (Techno-Ocean) 2016. [Google Scholar] [CrossRef]
  9. Ferreira, J.C.; Branquinho, J.; Ferreira, P.C.; Piedade, F. Computer Vision Algorithms Fishing Vessel Monitoring—Identification of Vessel Plate Number. In Proceedings of the Ambient Intelligence—Software and Applications—8th International Symposium on Ambient Intelligence (ISAmI 2017), Porto, Portugal, 21–23 June 2017; De Paz, J.F., Julián, V., Villarrubia, G., Marreiros, G., Novais, P., Eds.; Springer International Publishing: Cham, Switzerland, 2017; pp. 9–17. [Google Scholar]
  10. Girshick, R.; Donahue, J.; Darrell, T.; Malik, J. Rich Feature Hierarchies for Accurate Object Detection and Semantic Segmentation. arXiv 2014, arXiv:13112524. [Google Scholar]
  11. Girshick, R. Fast R-CNN. arXiv 2015, arXiv:150408083. [Google Scholar]
  12. Ren, S.; He, K.; Girshick, R.; Sun, J. Faster R-CNN: Towards Real-Time Object Detection with Region Proposal Networks. arXiv 2016, arXiv:150601497. [Google Scholar] [CrossRef] [Green Version]
  13. Redmon, J.; Divvala, S.; Girshick, R.; Farhadi, A. You Only Look Once: Unified, Real-Time Object Detection. In Proceedings of the 2016 IEEE Conference on Computer Vision and Pattern Recognition (CVPR), Las Vegas, NV, USA, 27–30 June 2016; pp. 779–788. [Google Scholar]
  14. Redmon, J.; Farhadi, A. YOLO9000: Better, Faster, Stronger. In Proceedings of the 2017 IEEE Conference on Computer Vision and Pattern Recognition (CVPR), Honolulu, HI, USA, 21–26 July 2017; pp. 6517–6525. [Google Scholar]
  15. Redmon, J.; Farhadi, A. YOLOv3: An Incremental Improvement. arXiv 2018, arXiv:180402767. [Google Scholar]
  16. Liu, W.; Anguelov, D.; Erhan, D.; Szegedy, C.; Reed, S.; Fu, C.-Y.; Berg, A.C. SSD: Single Shot MultiBox Detector. In Computer Vision—ECCV 2016; Springer: Cham, Swizerland, 2016; Volume 9905, pp. 21–37. [Google Scholar] [CrossRef] [Green Version]
  17. Dong, Z.; Lin, B. Learning a Robust CNN-Based Rotation Insensitive Model for Ship Detection in VHR Remote Sensing Images. Int. J. Remote Sens. 2020, 41, 3614–3626. [Google Scholar] [CrossRef]
  18. Fan, W.; Zhou, F.; Bai, X.; Tao, M.; Tian, T. Ship Detection Using Deep Convolutional Neural Networks for PolSAR Images. Remote Sens. 2019, 11, 2862. [Google Scholar] [CrossRef] [Green Version]
  19. Jiao, J.; Zhang, Y.; Sun, H.; Yang, X.; Gao, X.; Hong, W.; Fu, K.; Sun, X. A Densely Connected End-to-End Neural Network for Multiscale and Multiscene SAR Ship Detection. IEEE Access 2018, 6, 20881–20892. [Google Scholar] [CrossRef]
  20. An, Q.; Pan, Z.; Liu, L.; You, H. DRBox-v2: An Improved Detector with Rotatable Boxes for Target Detection in SAR Images. IEEE Trans. Geosci. Remote Sens. 2019, 57, 8333–8349. [Google Scholar] [CrossRef]
  21. Qi, L.; Li, B.; Chen, L.; Wang, W.; Dong, L.; Jia, X.; Huang, J.; Ge, C.; Xue, G.; Wang, D. Ship Target Detection Algorithm Based on Improved Faster R-CNN. Electronics 2019, 8, 959. [Google Scholar] [CrossRef] [Green Version]
  22. Zhang, X.; Wang, H.; Xu, C.; Lv, Y.; Fu, C.; Xiao, H.; He, Y. A Lightweight Feature Optimizing Network for Ship Detection in SAR Image. IEEE Access 2019, 7, 141662–141678. [Google Scholar] [CrossRef]
  23. Song, J.; Kim, D.; Kang, K. Automated Procurement of Training Data for Machine Learning Algorithm on Ship Detection Using AIS Information. Remote Sens. 2020, 12, 1443. [Google Scholar] [CrossRef]
  24. Imani, M.; Ghoreishi, S.F. Scalable Inverse Reinforcement Learning Through Multi-Fidelity Bayesian Optimization. IEEE Trans. Neural Netw. Learn. Syst. 2021. [Google Scholar] [CrossRef] [PubMed]
  25. Sr, Y.Z.; Sr, J.S.; Sr, L.H.; Sr, Q.Z.; Sr, Z.D. A Ship Target Tracking Algorithm Based on Deep Learning and Multiple Features. In Proceedings of the Twelfth International Conference on Machine Vision (ICMV 2019), Amsterdam, The Netherlands, 31 January 2020; Volume 11433, p. 1143304. [Google Scholar]
  26. Huang, Z.; Sui, B.; Wen, J.; Jiang, G. An Intelligent Ship Image/Video Detection and Classification Method with Improved Regressive Deep Convolutional Neural Network. Complexity 2020, 2020, 1520872. [Google Scholar] [CrossRef]
  27. Schmidhuber, J. Deep Learning in Neural Networks: An Overview. Neural Netw. Off. J. Int. Neural Netw. Soc. 2015, 61, 85–117. [Google Scholar] [CrossRef] [Green Version]
  28. Wojke, N.; Bewley, A.; Paulus, D. Simple Online and Realtime Tracking with a Deep Association Metric. arXiv 2017, arXiv:170307402. [Google Scholar]
  29. Lin, T.-Y.; Dollár, P.; Girshick, R.; He, K.; Hariharan, B.; Belongie, S. Feature Pyramid Networks for Object Detection. arXiv 2017, arXiv:161203144. [Google Scholar]
  30. Kalman, R.E. A New Approach to Linear Filtering and Prediction Problems. J. Basic Eng. 1960, 82, 35–45. [Google Scholar] [CrossRef] [Green Version]
  31. Li, K.; Huang, Z.; Cheng, Y.; Lee, C. A Maximal Figure-of-Merit Learning Approach to Maximizing Mean Average Precision with Deep Neural Network Based Classifiers. In Proceedings of the 2014 IEEE International Conference on Acoustics, Speech and Signal Processing (ICASSP), Florence, Italy, 4–9 May 2014; pp. 4503–4507. [Google Scholar]
  32. Babenko, B.; Yang, M.; Belongie, S. Visual Tracking with Online Multiple Instance Learning. In Proceedings of the 2009 IEEE Conference on Computer Vision and Pattern Recognition, Miami, FL, USA, 20–25 June 2009; pp. 983–990. [Google Scholar]
  33. Bolme, D.; Beveridge, J.R.; Draper, B.A.; Lui, Y.M. Visual Object Tracking Using Adaptive Correlation Filters. In Proceedings of the 2010 IEEE Computer Society Conference on Computer Vision and Pattern Recognition, San Francisco, CA, USA, 13–18 June 2010; pp. 2544–2550. [Google Scholar]
  34. Henriques, J.F.; Caseiro, R.; Martins, P.; Batista, J. High-Speed Tracking with Kernelized Correlation Filters. IEEE Trans. Pattern Anal. Mach. Intell. 2015, 37, 583–596. [Google Scholar] [CrossRef] [PubMed] [Green Version]
  35. Kalal, Z.; Mikolajczyk, K.; Matas, J. Tracking-Learning-Detection. IEEE Trans. Pattern Anal. Mach. Intell. 2012, 34, 1409–1422. [Google Scholar] [CrossRef] [PubMed] [Green Version]
  36. Kalal, Z.; Mikolajczyk, K.; Matas, J. Forward-Backward Error: Automatic Detection of Tracking Failures. In Proceedings of the 2010 20th International Conference on Pattern Recognition, ICPR ’10, Istanbul, Turkey, 23–26 August 2010; pp. 2756–2759. [Google Scholar]
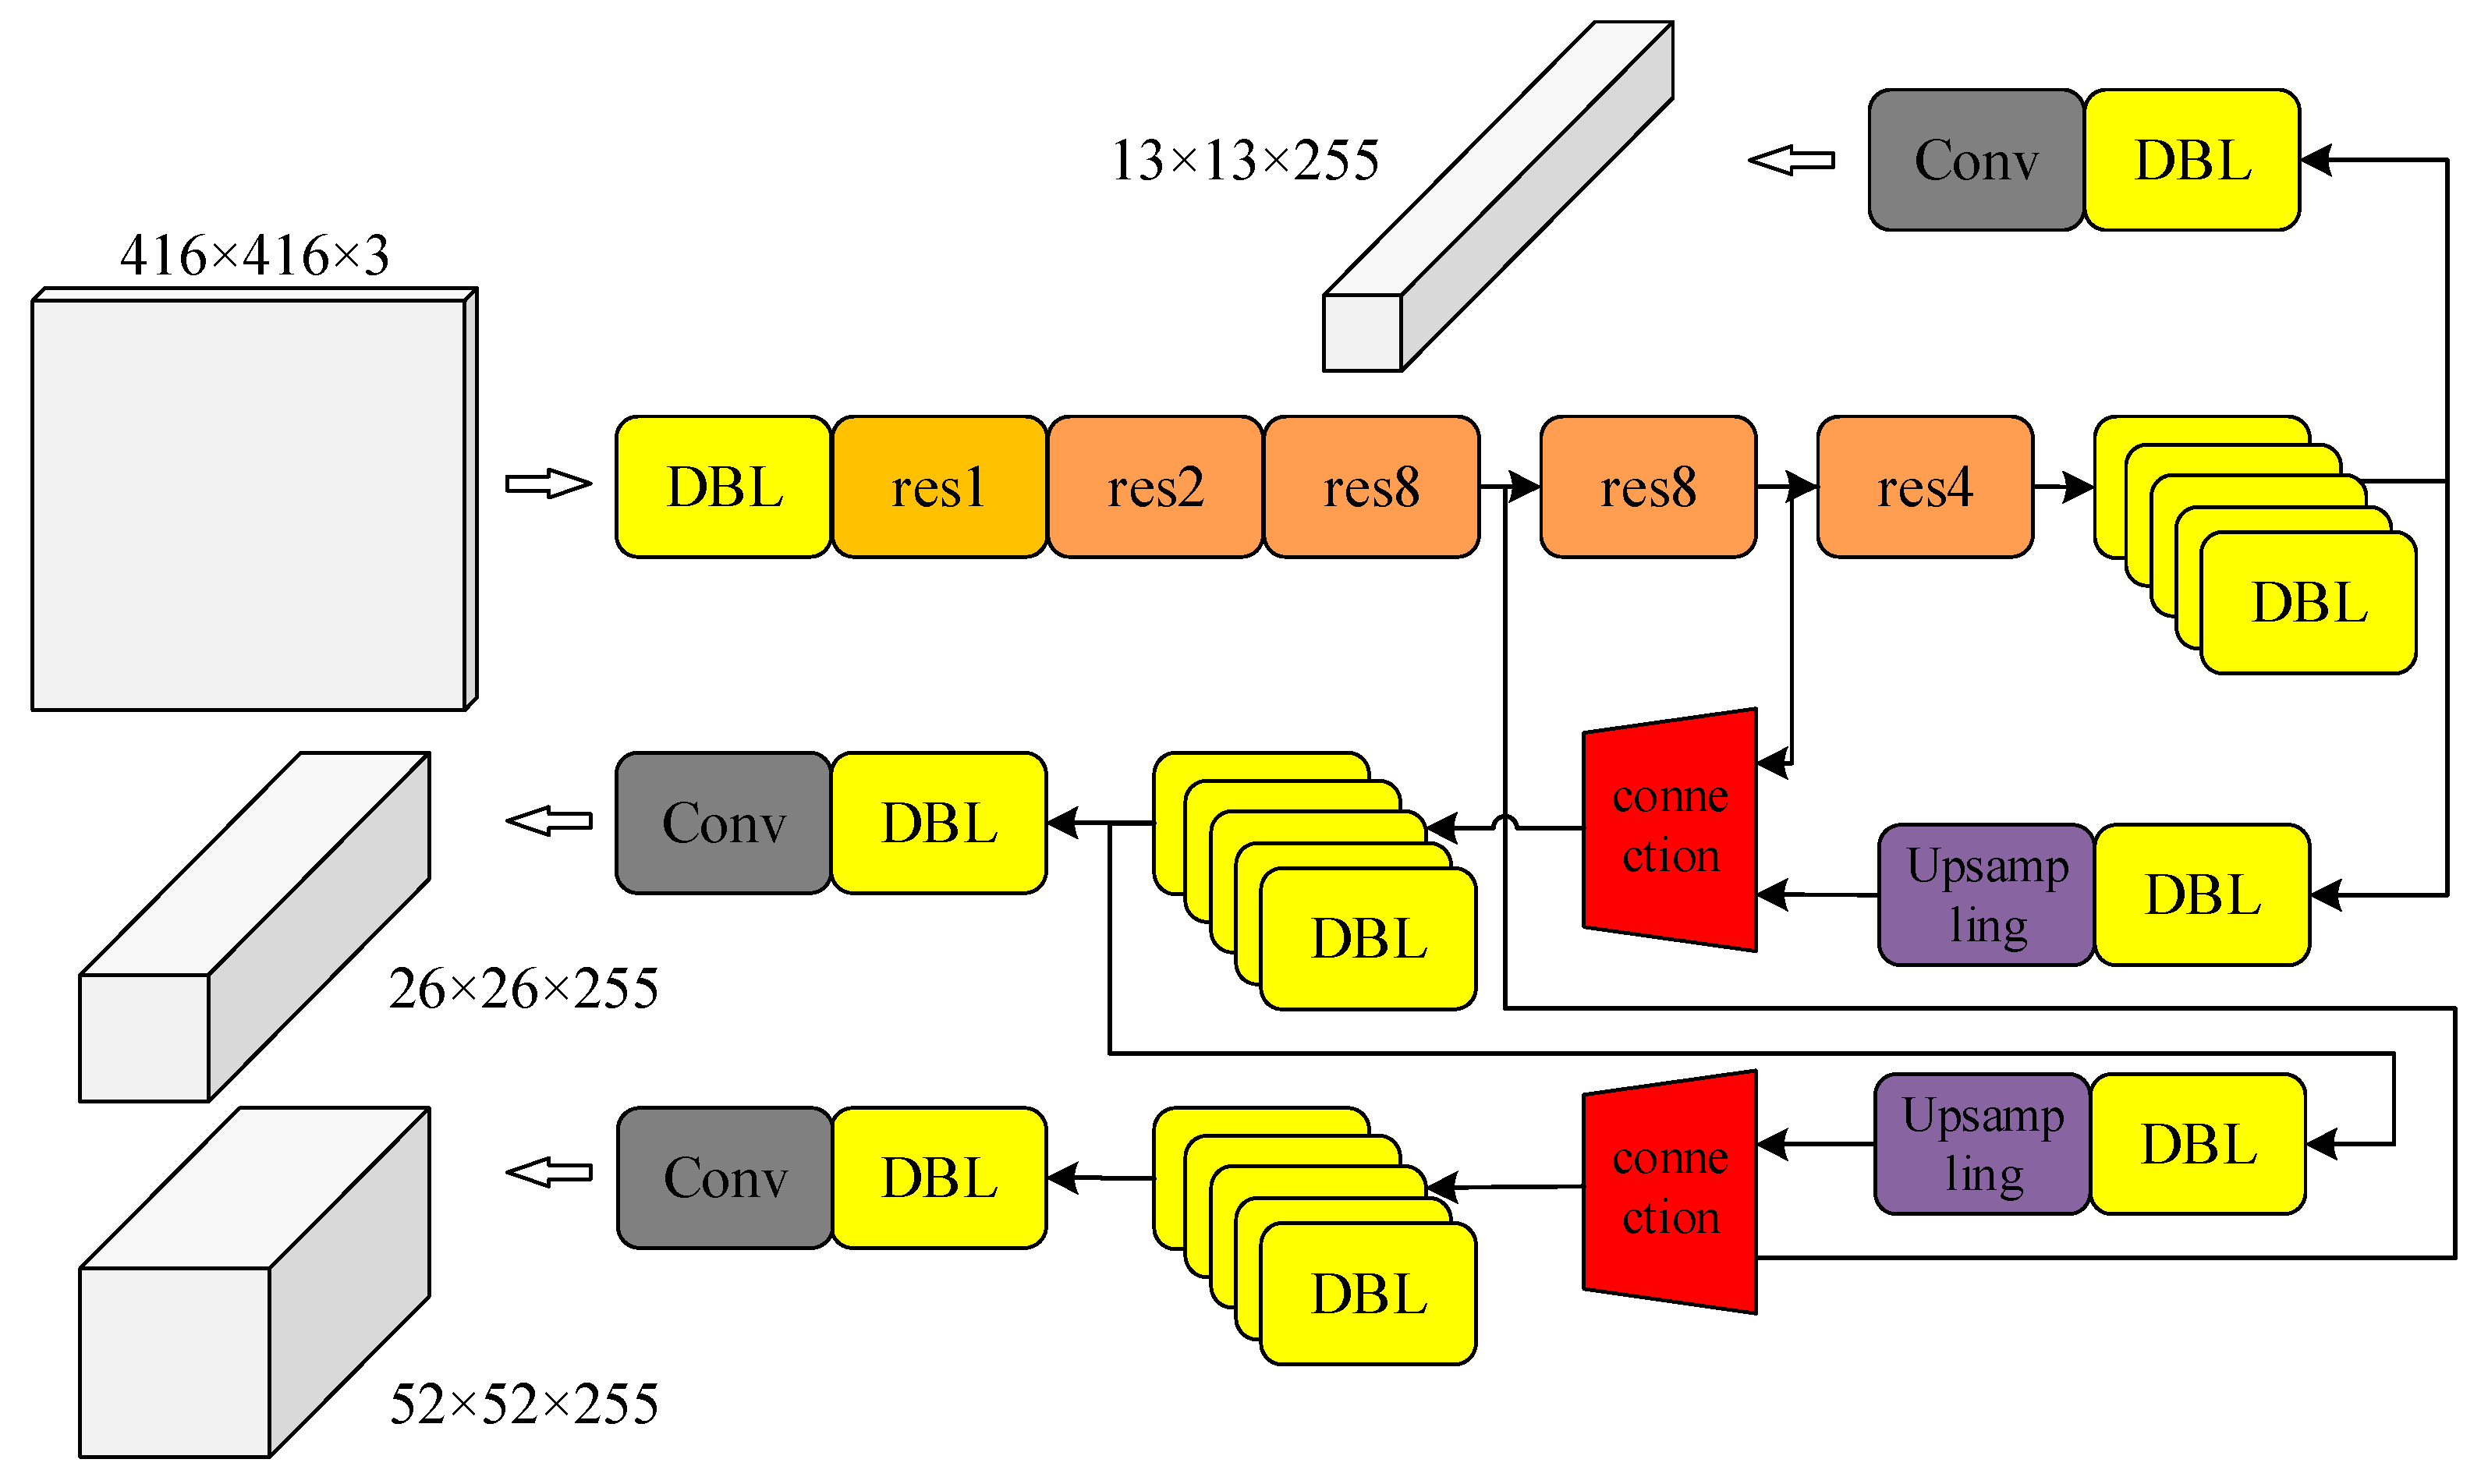
Figure 1. Schematic diagram of YOLOv3 model structure.
Symmetry 13 00308 g001
Figure 2. Schematic diagram of Improved YOLOv3 detection process.
Symmetry 13 00308 g002
Figure 3. Cumulative ratio of principal component variance.
Symmetry 13 00308 g003
Figure 4. Flowchart for ship detection and tracking.
Symmetry 13 00308 g004
Figure 5. Flow chart of the training and testing process.
Symmetry 13 00308 g005
Figure 6. Index changes during training. (a) Shows index changes on original YOLOv3 and (b) shows index changes on improved YOLO v3.
Symmetry 13 00308 g006
Figure 7. Part of the detection results based on the (a) YOLOv3 detection algorithm and (b) Improved YOLOv3 algorithm.
Symmetry 13 00308 g007
Figure 8. Tracking algorithm indicators.
Symmetry 13 00308 g008
Figure 9. Tracking situation of the video frame that the ship entered halfway.
Symmetry 13 00308 g009
Table 1. Comparison of various object detection algorithms.
Object Detection AlgorithmAdvantageLimitation
Region with CNN features(R-CNN) [10]
In 2014, Ross Girshick suggested R-CNN and acquired a mean average precision (mAP) of 53.3%with improvement more than 30% over the prior best outcome on PASCAL VOC 2012.
It improves the quality of candidate bounding boxes and take a deep architecture to extract high-level features [10].Training of R-CNN is expensive because the features are extracted from different region proposals and stored on the disk. Also it takes much time to process relatively small training set such as VGG16.
Fast Region with CNN features (Fast R-CNN) [11]
In 2015, Ross Girshick suggested Fast R-CNN that uses bounding boxes and multiple task on classification [11].
It saves the extra expense on storage space.
The Fast R-CNN is faster than R-CNN because the convolution process is completed once per image and a feature map is produced from it.
It’s also slow and time consuming because it uses selective search algorithm to find the regional proposal, hence affects the performance of the network.
Faster R-CNN [12]
In 2016, Ren et al. introduced Faster R-CNN which uses a separate network to predict regional proposals instead of using selective search algorithm.
Ability of an object to be trained in an end to end way. Also, a frame rate of 5 FPS (FramePer Second) on a GPU is achieved with state-of-the-art object detection accuracy on PASCAL VOC 2007 and 2012 [12].Its time consuming.
It is not trained to deal with objects with extreme shapes.
It does not produce object instaces instead produce objects with background.
YOLO (You Only Look Once) [13]
In 2016, Redmon et al. proposed You Only Look Once (YOLO) in this, instead of using regions to localize object it uses convolution neural network to suggest bounding boxes and probability of those boxes.
It is fast compared to prior algorithms because it uses only one step for object detection.It has spatial constraints which result in difficulty with dealing with small objects in groups.
Because of many downsampling operations it result to difficulty in generating configuration.
Sometime shows less accuracy.
Single Shot Detector(SSD) [16]
In 2016, Liu et al. suggested Single Shot MultiBox Detector (SSD).It uses default anchor boxes with different aspect ratios and scales to generate the output space of bounding boxes instead of fixed grid used in YOLO [16].
It is fastIt has less accuracy
Table 2. Avg IoU with different cluster numbers.
No of Clusters35679101112
avg IoU(%)66.9870.3973.7075.0178.6479.0179.1279.15
Table 3. The width and height of the anchor frame obtained by K-means clustering.
Width75109123130142200232235308
Height315584119425712971103
Table 4. Soft-NMS algorithm steps.
Soft-NMS Algorithm
Algorithm: Candidate box = { b 1 , , b N } , Target score corresponding to the candidate box S = { s 1 , , s N }
Set IoU threshold N t
Output: D , S
1. 
Initialize the selected candidate frame set D
2. 
while do
3. 
    m arg max S
4. 
    b m
5. 
    D D ; B B
6. 
  for b i in B do
7. 
           s i s i f ( I o U ( , b i ) )
8. 
  end
9. 
end
Table 5. Test set indicators for original YOLOv3 Algorithm.
Image Size352416480544608
O t 0.10.773(17.5)0.795(17.6)0.909(15.5)0.864(16.4)0.811(14.7)
0.20.727(18.7)0.795(18.4)0.864(18.6)0.886(17.1)0.856(15.7)
0.30.750(19.0)0.750(19.3)0.841(18.6)0.727(17.0)0.750(16.2)
0.40.682(19.7)0.568(19.6)0.841(18.5)0.614(17.7)0.705(16.9)
0.50.636(19.9)0.432(19.4)0.750(17.8)0.500(17.3)0.545(16.9)
Table 6. Test set indicators for proposed Algorithm.
Image Size352416480544608
O t 0.10.826(18.1)0.909(18.9)0.955(17.8)0.864(17.0)0.841(15.0)
0.20.864(19.3)0.864(19.2)0.932(17.6)0.864(14.1)0.742(14.4)
0.30.750(19.4)0.818(18.8)0.886(17.0)0.682(17.2)0.705(16.5)
0.40.659(19.7)0.750(19.1)0.705(18.5)0.727(15.8)0.568(17.0)
0.50.682(20.0)0.682(19.5)0.614(18.6)0.545(17.6)0.477(13.7)
Table 7. Detection algorithm indicators.
AlgorithmmAPFPS
YOLOv3 algorithm [15]0.90915.5
Proposed Algorithm0.95517.8
Table 8. Disturbances in each category.
Video Sequence NumberPartial OcclusionIn MiddleMultiple TargetCamera Shake
1
2
3
4
Publisher’s Note: MDPI stays neutral with regard to jurisdictional claims in published maps and institutional affiliations.