Article

The Enhanced-Earned Value Management (E-EVM) Model: A Proposal for the Aerospace Industry

by
Joaquín López Pascual
1,*,
Juan Carlos Meléndez Rodríguez
2 and
Salvador Cruz Rambaud
3
1
Departamento de Economía de la Empresa, Universidad Rey Juan Carlos, 28032 Madrid, Spain
2
Departamento de Organización de Empresas y Marketing, Universidad Complutense de Madrid, Campus de Somosaguas, 28223 Madrid, Spain
3
Departamento de Economía y Empresa, Universidad de Almería, La Cañada de San Urbano, s/n, 04120 Almería, Spain
*
Author to whom correspondence should be addressed.
Symmetry 2021, 13(2), 232; https://doi.org/10.3390/sym13020232
Submission received: 30 December 2020 / Revised: 20 January 2021 / Accepted: 26 January 2021 / Published: 30 January 2021
(This article belongs to the Section Computer)

Abstract

:
The framework of this paper is the aerospace industry, which is one of the world’s leading sectors, thus playing a noteworthy role in current society. This makes it especially important to try to optimize the management of the aerospace sector. Therefore, the main objective of this paper is to propose the so-called Enhanced-Earned Value Management (hereinafter, E-EVM) model, able to explore the simultaneous evaluation of many projects, from which the management of the project can take advantage. Additionally, this model considers the possibility of forecasting pending tasks, measurable in time units or cost units, until the end of the project. The main contribution of E-EVM methodology is its capacity to detect both delayed and advanced projects by converting times (hours) into monetary units (EUR). Empirically, this enhanced model has been applied to a real case study in the aerospace industry composed of thousands of subprojects and the results provide the project manager with valuable information to make decisions in a short term. Through computer graphic representation techniques, the visualization of project deployment can be improved. Finally, the E-EVM model can be used even in big projects where a very large volume of information must be simultaneously treated and also, it will be suitable to apply pattern recognition concerning the project performance.

1. Introduction

The continuous search for cost reduction in manufacturing and production processes is an ongoing task for company managers, whose impact on their financial management is significant. This cost reduction can be obtained, among other initiatives, through the implementation of business management tools which help us to identify project risks and potential deviations, to implement mitigation measures and to make predictions about the future of the project [1].
In this context, Earned Value Management (hereinafter, EVM) is a powerful and effective tool able to administer and manage the performance of a given project. This methodology integrates the management of the scope or set of tasks to be carried out and the associated cost and time, which are the three basic parameters of any project [2]. Managing these three parameters requires regular monitoring and follow-up in order to detect the project’s performance. In this way, the EVM provides an “early” indicator of its status so that the person in charge of the project can decide about the strategy to execute it, by respecting the budget and agreed planning.
Table 1 shows the relevant literature of application of the EVM methodology to different representative sectors. Observe that existing studies have been focused on implementing the EVM, especially in aerospace and building and construction industries. However, additional analyses have been carried out in other fields such as agriculture and the environment.
The main findings of the previous studies reaffirmed that the EVM contributes positively to project cost monitoring and indeed provides elements of effective cost management. Taking into account that the literature suggests further research to explore how improve project management through new tools which refine and improve EVM, the objective of this paper is to present the so-called E-EVM model from both a theoretical and empirical point of view.
Usually, research in the management of the aerospace sector has been focused on EVM. However, in this manuscript, we present an original application of the so-defined E-EVM model to a case study in the context of the aerospace industry. This improvement is necessary for a global project whose activities have been broken down into thousands of subprojects which is, in fact, a very common practice in the aerospace industry. As indicated, this feature entails a novel aspect for aerospace industry research.
Our main conclusions focus on two fundamental findings. First, we offer a “double vision” of EVM which increases the accuracy of project information by obtaining more precise estimations of the resources needed to finalize the project. Second, we can set up a continuous improvement strategy by frequently applying the E-EVM-defined model. Finally, the conclusions obtained in this paper can help in revisiting the existing literature on EVM and support a very deep updated revision of the literature.
The structure of this paper is as follows. Section 1 describes the framework research problem, the fields of application of the EVM model, and the main objective of this paper. Section 2 presents EVM methodology and reviews the empirical research by using this model. Section 3 contextualizes the EVM in the aerospace industry and describes how EVM methodology has been linked to this sector for a long time. Moreover, it revises the existing literature on this topic by including the latest papers concerning earned value management and some extended models. In Section 4, the new Enhanced-Earned Value Management (E-EVM) model is presented by highlighting its main benefits and contribution, and specifically how the treatment of high amount of information has been implemented in this model. Section 5 displays an empirical application of this new model to a simulated case. Finally, Section 6 summarizes and concludes.

2. The Earned Value Management

The concept of “earned value” in project management was defined in the 1960s; although it was recognized as an important technique, widely used in US Government contracts, it failed to awaken interest outside the USA because of its specific requirements and its cumbersome, prescriptive bureaucracy. In essence, as highlighted by Webb [3], the earned value allows the project manager to have a view of the actual project performance in terms of both value generated and schedule progress, more accurately than that provided by any other approach.
Vanhoucke [4] also indicated the importance of having some parameters or indicators of the project performance in order to identify possible problems and to look for a solution or mitigate the measure of such problem. Moreover, special attention should be paid to those activities which can significantly influence the final performance of the project. In effect, the project manager can demonstrate a responsible attitude, paying special attention to those “critical” activities by reducing planned deviations.
EVM is probably one of the most important, and at the same time one of the least understood, systems of project management. Its importance lies in the fact that it has shown to be a fundamental monitoring and control technique, and that it has not yet been successfully replaced by another similar tool or technique. The existing literature on the EVM extensions has deployed other models with a high degree of acceptance and impact:
  • The Earned Schedule Management (ESM) model [5,6,7] presents a “new” version able to measure the performance of the project in terms of time and a part of the measurement in cost units.
  • Another EVM extension describes the so-called Earned Duration Management (EDM) model [8] in which the measurement of cost performance and planning are separated by introducing new parameters to check efficiency and to improve forecasting at the end of the project.
  • Finally, the so-called Quality Earned Value Management (QEVM) model [9] introduces the quality parameter in the EVM model, by calculating or measuring the actual development or performance of a given project from the point of view of quality criteria.
As a result of the extensive literature previously reviewed, it is beyond any doubt that there are still limitations of EVM [10] which prevent it from becoming a universally accepted best practice. There are a lack of models capable of enhancing the prediction accuracy of earned values and actual costs before execution of projects. Webb points out that this technique has been recognized to be useful for projects of almost any size, and not just for millionaire government projects [3].
Particular emphasis has been given to risk management which is recognized as a difficult subject of increasing importance in current management projects, especially in product innovation. Since then, earned value has been applied across a range of industries and in different ways [11,12].
Moreover, we focus on research related to possible extensions and applications of EVM in response to some of the constraints identified. For example, before project execution, EVM tries to improve PV forecasting [13]. Several scholars [14,15] point out that in recent years, factors such as cost, time, and quality have been linked to the success of project management.
In addition, some authors [16] attempted to apply the former method to an actual cement factory construction project, helping project engineers have realistic expectations of the method and providing suggestions to overcome some practical problems if the method is to be applied in real industrial projects.
In this way, Basu [17] tries to establish the key role of quality in the “iron triangle” by highlighting the importance of implementing the people-related “organization quality” amongst key stakeholders to deliver the success criteria of a project.
The forecasting of EV metrics is fundamental in project management improvement by [18] pointing out the accuracy of estimating final cost and duration.
Several scholars [19] consider that a functional distinction can be made between a top down (the use of a project control system which generates project-based performance metrics to give a general overview of the project performance) and a bottom up (control system in which detailed activity information needs to be available constantly during the project control process), by proposing the combination of elements of top down and bottom up control.
Research is normally focused on improving the final cost and the duration estimates rather than improving the use of the planned value to predict the earned and actual cost values. However, the authors in [13] propose a straightforward method for improving the predictive power of the PV before executing a project.
On the other hand, the authors in [20] proposed two new metrics combining EVM with Project Risk Management, allowing project managers to have better control and monitoring. These indexes allow project managers to analyze whether the project over-runs are within the expected variability or, on the contrary, there are some structural and systemic changes over the project life cycle.
Another innovative proposal [21] consists of the integration of a graphical tool extending the Earned Value Management methodology.
According to [22], a cost uncertainty analysis is vital in order to provide decision makers with a comprehensible model including different factors affecting funding exposure, and finally, estimate the cost of project.
A novel control metric for projects which uses cost and/or time incentives was introduced by [23]. The Earned Incentive Metric (hereinafter, EIM) measures the deviation in the accrual of incentives rather than the time and cost performance relative to the planned schedule.
More recently, differently conducted research studies [24] presented a new evaluation model of the EVM for the construction industry, blended with risk analysis, to improve the project’s future performance forecasting defined under uncertain conditions by using linguistic variables represented by interval-valued triangular fuzzy numbers. Other works [25] consider that construction projects demand specific requirements along the life cycle of a project.
Even though EVM has several advantages, it has not been widely used in the construction services sector in Poland [26]. A new research work proposed by [27] is to provide new awareness for the integration of linear and Taguchi-based methods to control quality, cost, schedule, and risk.
More recently, the authors in [28] presented a new EVM tool, the so-called Duration Estimate at Completion (DEAC) model, whose main goal is forecasting the time estimate at completion. The DEAC model uses the actual time spent on each activity, either in progress or upon completion, where the performance is measured in time units. Finally, another recent research work [29] considers the growing awareness of the importance of the role of project management for sustainable development in order to investigate the existing conceptual and methodological overlap between the bodies of knowledge of EVM and sustainability in project management.
As indicated, the EVM model needs improvement addressed to projects in the aerospace sector, motivated by the high number of subprojects integrated into the whole projects. This is why the next section is going to describe the aerospace sector and to review the empirical research in this sector.

3. The EVM in the Aerospace Industry

3.1. The Aerospace Industry

Among all sectors, aerospace is one of the most important industries in the world. Until now, its technological and industrial development has been driven almost exclusively by the US and Europe, specifically through their main companies (Boeing and Airbus, respectively). This means that global aeronautical production is concentrated in a small number of countries.
An important milestone in the evolution of the European aeronautical sector was the creation of the Airbus Industry Consortium in 1970, with the aim of manufacturing a commercial aircraft which would lead to competition with Boeing. This process culminated in 2000 with the emergence of EADS (European Aeronautic, Defence and Space Company). In the last forty years, European aeronautics has been characterized by an increasing collaboration among several countries in the development of programs, by an accelerated process of national and international mergers, acquisitions, and alliances, a progressive consolidation of the sector, and a rise in the civil with respect to the military aeronautics.
In this way, France, the United Kingdom, and Germany represent more than 70% of the sector in terms of income and employment, Spain occupying fifth place in the European ranking. According to the Spanish Association of Technological Defence, Aeronautical and Space Companies [30] (hereinafter, TEDAE), in 2018 a turnover equivalent to EUR 11,838 million was generated, contributing to 6.1% of the GDP in Spain. Moreover, this sector is one of the most “technological” industries as 75% of employees have an academic profile in some engineering or technical discipline related to the sector, generating almost 57,000 direct jobs.
The aerospace sector, considered a strategic industry “supervised” by governments, encompasses all activities related to the design, manufacture, marketing, and maintenance of aircrafts [31] (airplanes, helicopters, drones, missiles, etc.) and space products (satellites, equipment, communication, etc.). Despite the relevance of aircraft manufacturing (44% civil aviation and 32% military products) [30], we cannot forget that land and ground communication equipment represents 15% and that the remaining 8% corresponds to space products. Moreover, there are a series of differentiating features (civil and military branch, interdependent but separate, high technological requirements, long-term business cycle, high capital needs, etc.) which make it a sector with numerous specificities requiring detailed study.
The aerospace sector is a technology-based industry where innovation, technological components, and knowledge have been applied in a massive way [32]. Some scholars [31] also indicate that the structure of the sector has undergone a profound transformation in recent decades, with an increasing degree of concentration due to the dominance and competition by Airbus and Boeing, especially in the civil branch. The changes produced in the buyers and suppliers, as well as the entry of new companies, has increased the level of competition between the two main manufacturers, spreading throughout the entire value chain of the industry and especially affecting suppliers.

3.2. The EVM in the Airspace Industry

In this subsection, we are going to highlight the main uses of EVM in the aerospace industry. As previously indicated, the majority of companies belonging to this sector apply EVM methodology to obtain a more efficient project management. Our literature review research shows two clear examples about the application of EVM methodology to this sector. First of all, the Swedish group IG JAS for the Saab JAS 39 Gripen light combat aircraft project [33,34]. Secondly, the use of EVM is that carried out by the National Aeronautics and Space Administration (NASA), managing projects with budgetary restrictions in a more efficient way [35,36].
In 2004, according to Putz et al. [37], NASA’s Exploration Systems Mission Directorate (hereinafter, ESMD) decided to implement a specific monthly EVM report on relatively small projects (USD 1M to 10M budget). This implementation was not easy due to the highly specialized language and the absence of a suitable tool. The ESMD used NASA’s Program Management Tool (hereinafter, PMT) in order to implement a complete set of EVM reporting capabilities. This tool was used by managers for project planning and reporting, and the data entry templates were modified to generate an EVM reporting system. This new tool (PMT-EVM module) reduced the time to collect the cost and schedule the data to only one or two days. Consequently, project managers had more time to undertake the analysis of deviations in order to design the corresponding action plan to mitigate them.
Therefore, Hunter et al. [38] pointed out that, as a consequence of the high competition and the pressure to be competitive, the different federal agencies needed to manage the projects with more level of detail or granularity.
Dibert and Velez [39] described how EVM has been implemented in the project management and software development which would be implemented in the manufacture of the new aircraft. This methodology has been used, as well, by large aerospace companies such as Airbus and Boeing. In 1999, the Boeing Company published a manual on Integrated Performance Management (IPM) practice whose scope was the implementation of EVM in all Boeing organizations [40], also collaborating with the National Defence Industrial Association (NDIA) to write the EVMS industry standard.
Boeing has incorporated EVM into its internal processes and has considered the EVMS (Earn Value Management System) in government and commercial environments since October 2000. According to the company [40], this is an initiative in continuous process, consisting of a structured approach to documentation improvement, whose main objective is achieving an ongoing best business practice. In the forthcoming future, Boeing wants to improve and implement systems and processes in a constant search for enhanced decision-making data for all managerial levels.
The importance that Boeing assigns to EVM can also be verified in [41], where EVM is mixed with analysis of the critical path through the theory of constraints.
Bombardier Inc. also used EVM concepts for project management. This company is located in Montreal (Canada) and is currently considered one of the largest aeronautical manufacturers in the world, after Boeing and Airbus. Bombardier Aerospace’s most commercially successful products are regional transportation products such as the CRJ100/200 and CRJ700/900/1000. In fact, Laporte et al. [42] have applied the EVM method for development projects in the railway sector with significant improvements in its performance.
Additional publications which advocate for the implementation of EVM in the aerospace industry have been deployed by [43], where EVM methodology is applied in a Flight Test Program to track and measure its efficiency. Even more, it proposes a new approach by the management of a database.

4. Defining the Enhanced-Earned Value (E-EVM) Model

Meléndez-Rodríguez and López-Pascual [44,45] defined two major improvements of the E-EVM model. The first one is the use of units of time (hours) instead of units of cost (EUR) as the main input. In this way, Estimation at Completion (parameter EAC) can be used to estimate the project’s completion in units of time. However, it is possible to manage hours and euros by simply applying an hourly rate which, with E-EVM, provides two inputs: the time necessary to complete the project and its estimated cost [45].
The second improvement is the introduction of projects divided into a high number of subprojects whose evolution is necessary to be continuously followed.

4.1. EVM Background and First improvement of the E-EVM Model

The EVM uses a cost and schedule planning as a baseline, given by the Planned Value (denoted by PV) and defined as the time-phased budged package. Moreover, it considers two parameters to monitor the project: the Actual Cost (represented by AC) and the Earned Value (denoted by EV), where AC is the actual time cost and EV is the work carried out [2]. On the one hand, the EV is given by the following equation:
E V : = Project progress × P V .
The technique of EV requires evaluating of the variance between the parameters EV, AC, and PV. In this way, Cost Variance (denoted by CV) is employed to identify if the project evolves more or less, according to the planned value:
C V : = E V A C .
If CV is negative, then the project cost is greater than the budgeted one, whilst if it is positive, then the project cost is under the budget. On the other hand, the so-called Schedule Variance (represented by SV) is the indicator which represents the advance in the project schedule:
S V : = E V P V .
The interpretation of SV is similar to that of CV. In effect, a positive value of SV means that the project is ahead of the planned schedule, and a negative value means that the project is delayed with respect to the planned schedule.
On the other hand, the Cost Performance Index (denoted by CPI) and the Schedule Performance Index (represented by SPI) evaluate the project’s efficiency by cost and schedule, respectively:
C P I : = E V A C
and
S P I : = E V P V .
The main acronyms and definitions of EVM are given in the Practice Standard for Earned Value Management of PMI [46]. Additionally, this model provides a projection of the so-called Estimate at Completion (denoted by EAC) which may differ from the original project budget, called the Budget at Completion (BAC). That parameter allows analysis of the PV by means of an estimate of the cost (AC) and schedule estimation (derived from EV) from the current time. Three different ways to compute EAC:
  • The projected cost according to the initial budget:
    E A C : = A C + ( B A C E V ) .
Depending on whether it is below or above the initial budget, the cost of the remaining work will be carried out as originally budgeted.
2.
The projected cost according to the current CPI:
E A C : = A C + B A C E V C P I .
Depending on the efficiency in the use of resources, the costs of remaining work of the project will maintain the same level of efficiency in the future.
3.
The projected cost according to the CPI and the SPI:
E A C : = A C + B A C E V C P I × S P I .
In this case, the EAC of the work will be calculated according to the ratio of efficiency, which takes into account both the rate of cost performance (CPI) and the index of schedule performance (SPI), the schedule delays, and the costs.
Finally, we can define the following two parameters:
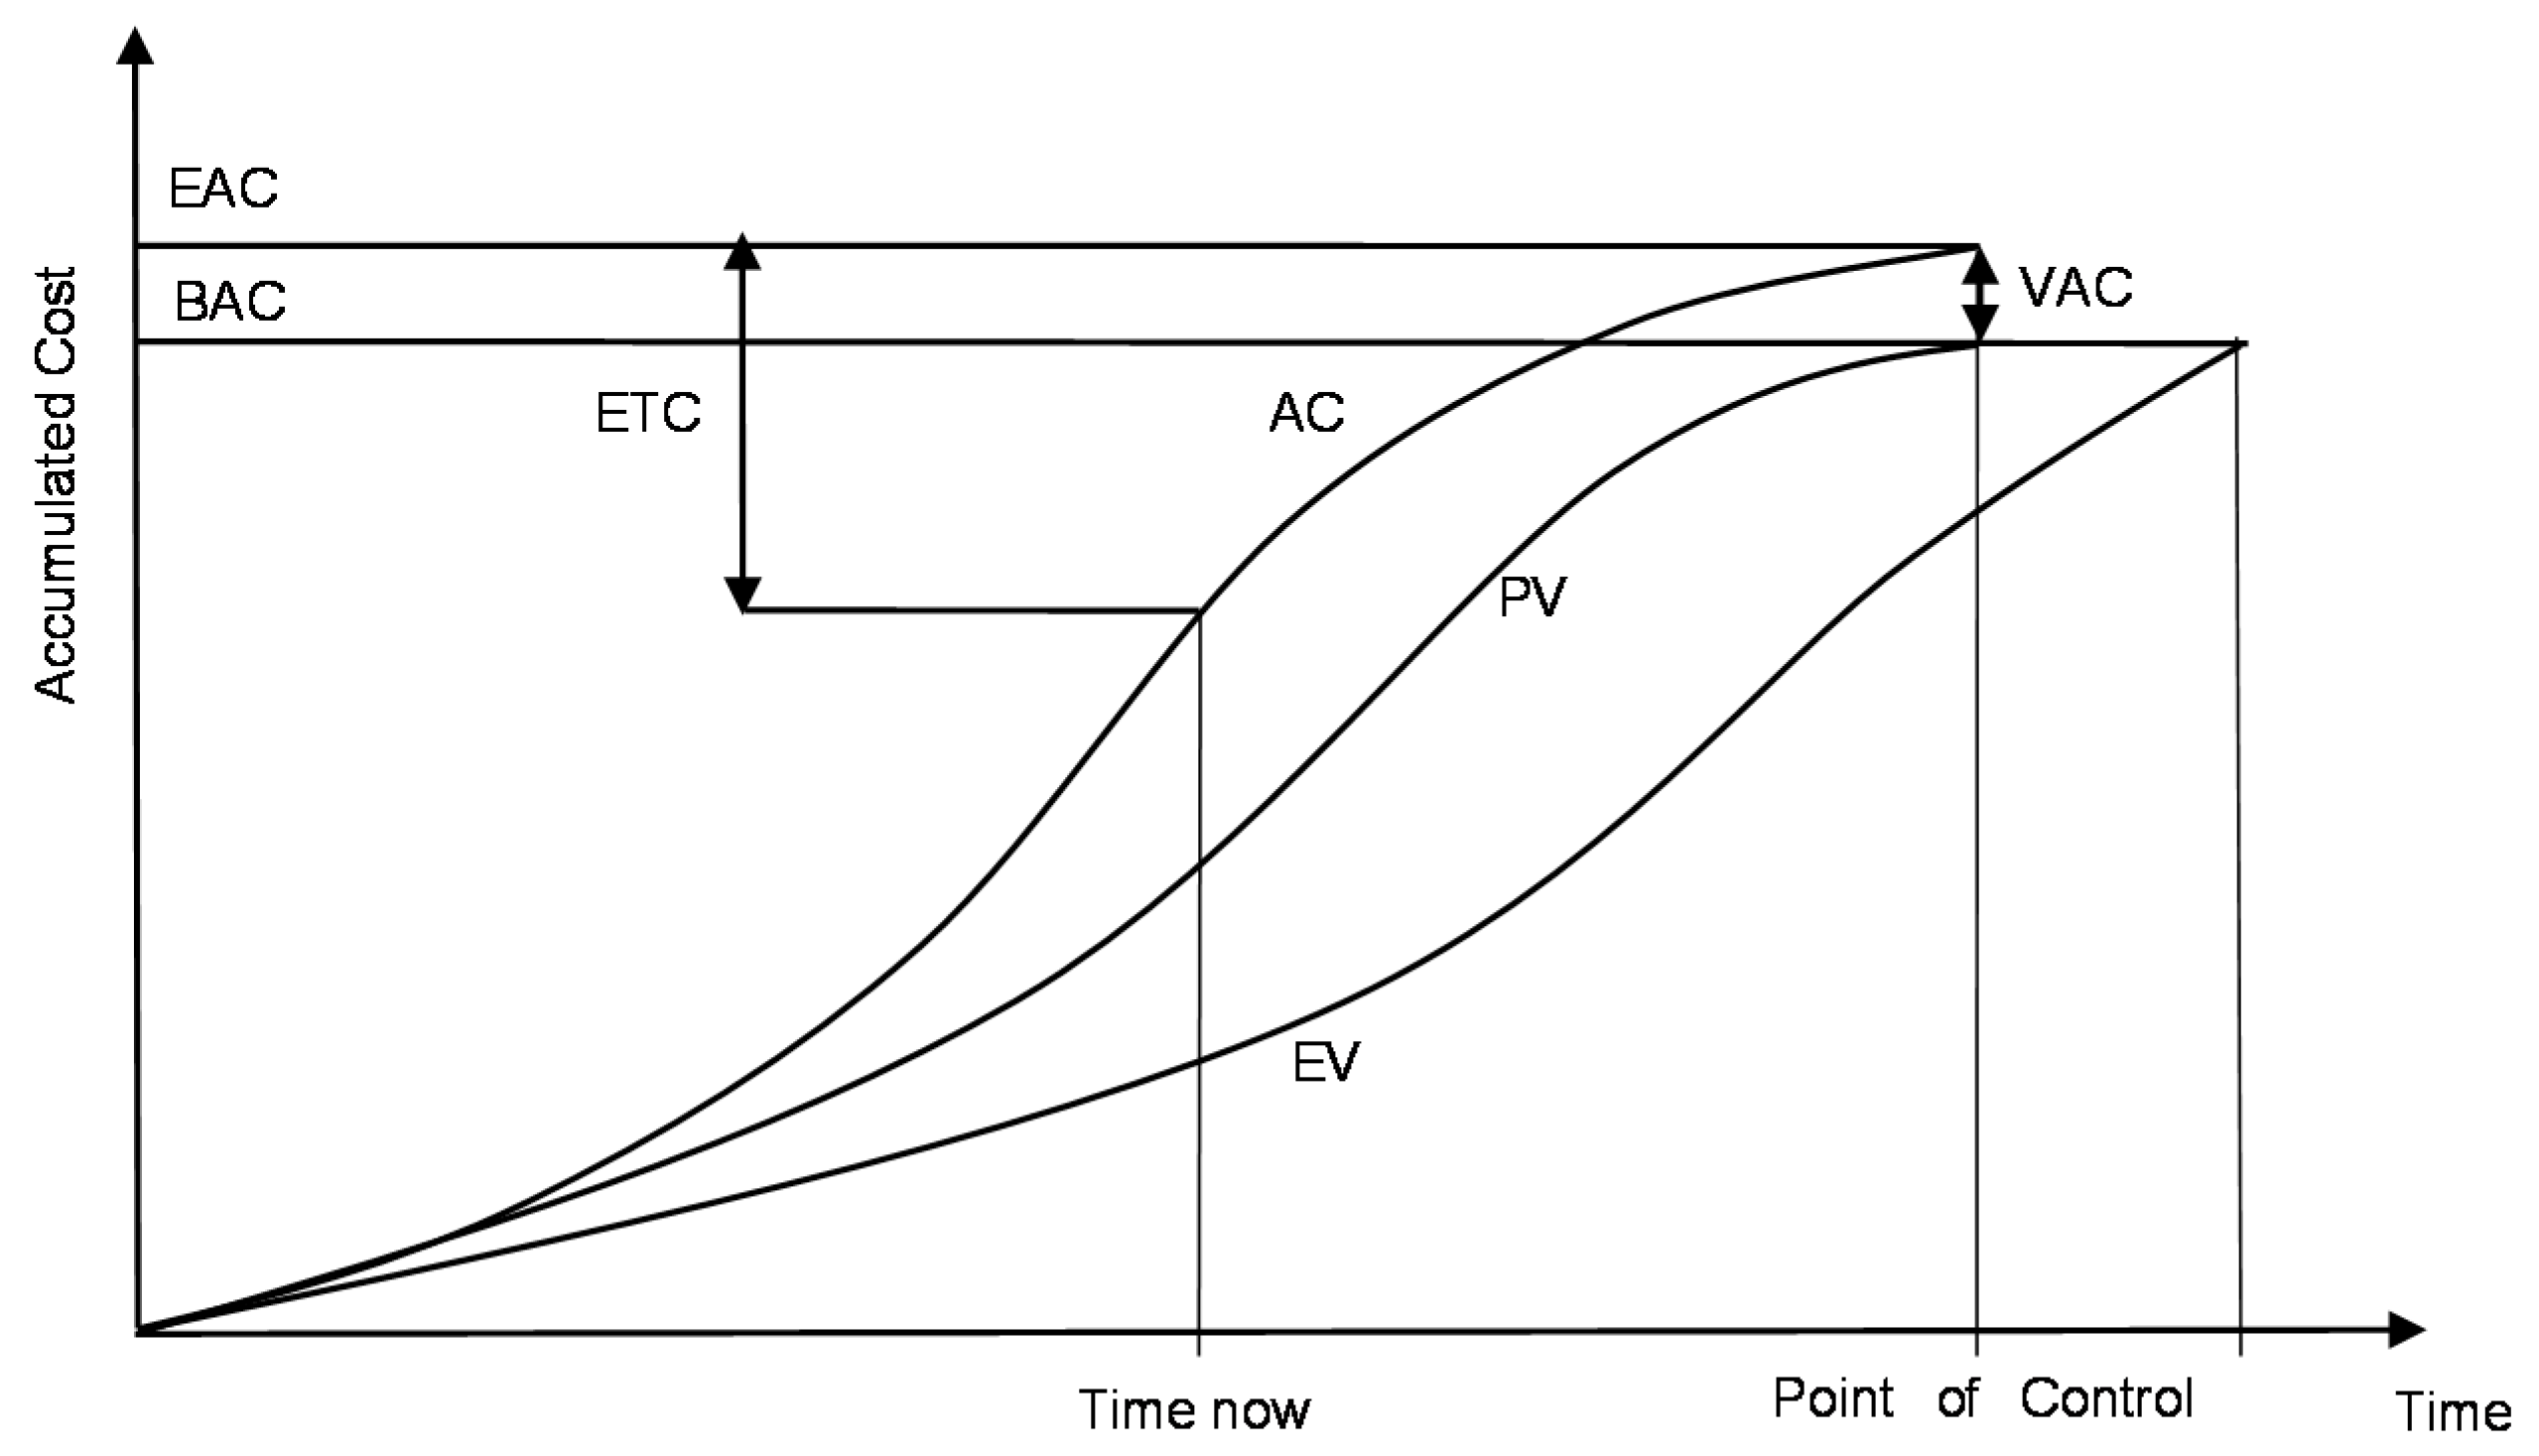
  • The Estimate to Complete (ETC):
    E T C : = E A C A C .
  • The Variance at Completion (VAC):
    V A C : = B A C E A C .
The first improvement introduced by Meléndez-Rodríguez and López-Pascual [45] is the use of unit of time (hours) instead of unit of cost (EUR) as the main input. Therefore, the EAC parameter can be measured in units of time. Through the easy application of an hourly rate, it is possible to manage hours and euros without any constraint, offering this E-EVM both inputs: the time necessary to complete the project and its estimated cost. This implies that what is really relevant for this model variant is the deliverable (in our case study, it might be an airplane or a wing). This is highly relevant because projects usually face problems regarding their completion on time.
In this way, project management acquires this “double vision” so useful for managers since they can apply corrective measures focused either on the duration of activities or on its budget. The use of one or another view does not present any difficulty.

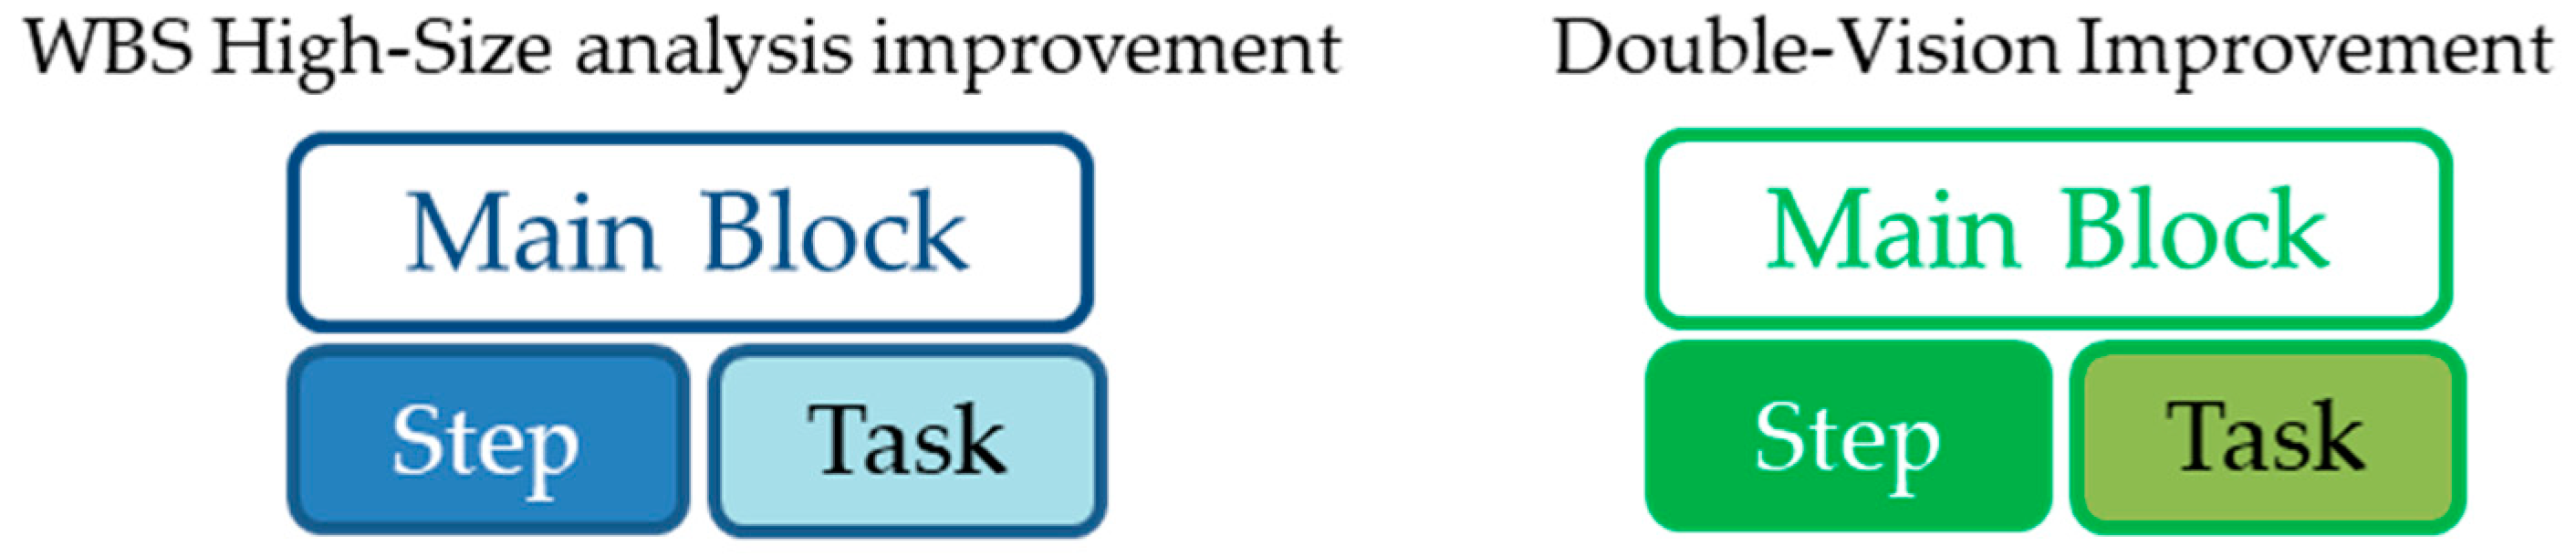
4.2. The Second Improvement of the E-EVM Model

The second enhancement incorporated in the E-EVM model is the introduction of those projects which have been divided into lot of subprojects. Indeed, this adds a complication because of the generation of set information for each i-th project, which is used as an input of the system. This step gives rise to an increase in the capability to analyze and take decisions over a big amount of information, not possible before without this new approach. Meléndez-Rodríguez and López-Pascual already introduced this new concept in [44].
Figure 1 shows a scheme of the model, where the input parameters PV, AC, EV, and BAC have been specified as well as its outputs.
The system evaluates the i projects simultaneously and needs, as input information, the planned values (PV), the current costs (AC), the percentage of progress (i.e., the earned values) (EV), and the final budget at the end of the project (BAC). The output information is a qualitative report of the situation or performance of all projects, as well as graphic information which facilitates its rapid understanding and makes the decision process more efficient.
In this case, the same criteria are maintained as defined in Section 3.1, i.e., the input information of each project is quantified in units of time, that is, in hours.
The use of Microsoft Project (hereinafter, MSP) software allows management of the data able to generate the traditional project plan (i.e., work breakdown structure (WBS), task, duration, and predecessor). The link between the MSP and the E-EVM model is designed to support the level of data granularity required to properly produce the modified parameters [47].
There are different commercial software packages to be used in the project management, as described by Webb [3]. As most projects have been planned by using a conventional project planning package, Cobra incorporates an “Integration Wizard”. This feature connects directly to Open Plan, Primavera Project Planner, or Microsoft Project (MSP) in order to pick up schedule date information. In this research, we have decided to use MSP to facilitate the integration with the E-EVM model and to ease the gathering of activity status information, which can also be obtained directly from the planning tool.
The way to manage the uncertainty could be by using the approach by [48]. In this research, it is stated that the EVM model is not a probabilistic method, but there exists the possibility of its use mutually with the Program Evaluation and Review Technique (PERT) methodology as a single mechanism for the control of the project. The time control is based on a comparison of planned and actual duration of the work. The advantage of PERT is not only to detect deviations of the completion of each subproject. Additionally, we assess the updated status of the overall project, managing the risk and controlling the critical path, in which an assessment has received the actual duration of the work and calculated the new range of the deadline for the project, taking into account the already completed works. Moreover, PERT methodology allows calculation of the probability of completing the project on time.
Using PERT through MSP software allows us to expand the EVM method to account for the possibility of the probabilistic nature of the cost [48,49].
A different approach to the management of risk and uncertainty was already described in [20]. These concepts are at the very core of project management, and so project managers used them to find delays and over-costs not expected before in the planned values. Consequently, project managers need methodologies to take decisions under uncertainty. Some researchers explored a new approach in [50] by using the Monte Carlo simulation to obtain the “universe” of possible different project runs. With this approach, we are solving some of the key limitations of the EVM, described by Nizam [10].
The case study analyzed in this paper is based on a wider global project whose activities have been broken down into 4000 subprojects, and each one of them will be managed by its WBS. In the aerospace sector, it is very common for the degree of disaggregation of large new product development projects to be quite high [51]. Thus, a project for the development and execution of a new product can have thousands of “subprojects” to manage, monitor, and control.
It is interesting to mention that this model has been defined and conceived as a cyclical model to be used in different iterations. In other words, the results of each iteration are considered input information for the next iteration. In this way, the project leader will always have the most up to date information available to him/her. The frequency between the iteration and the iteration of the model is a decision of the project manager which depends on different factors: degree of maturity of the project, stage of the life cycle model, etc. This approach is fully aligned with the concept of “continuous improvement”, very common in the industrial sectors, especially in the aerospace sector.
As a final view and further clarification, in Table 2, it can be seen that the E-EVM model is different from the conventional EVM model. This table shows all the input variables are calculated for each of the i projects and solve several limitations of the EVM model: cost and time units are simultaneously managed, no limitation in the level of disaggregation of the WBS, entire global provision of a graphical making-process tool, and also an iterative application along the life cycle project model.

5. Results

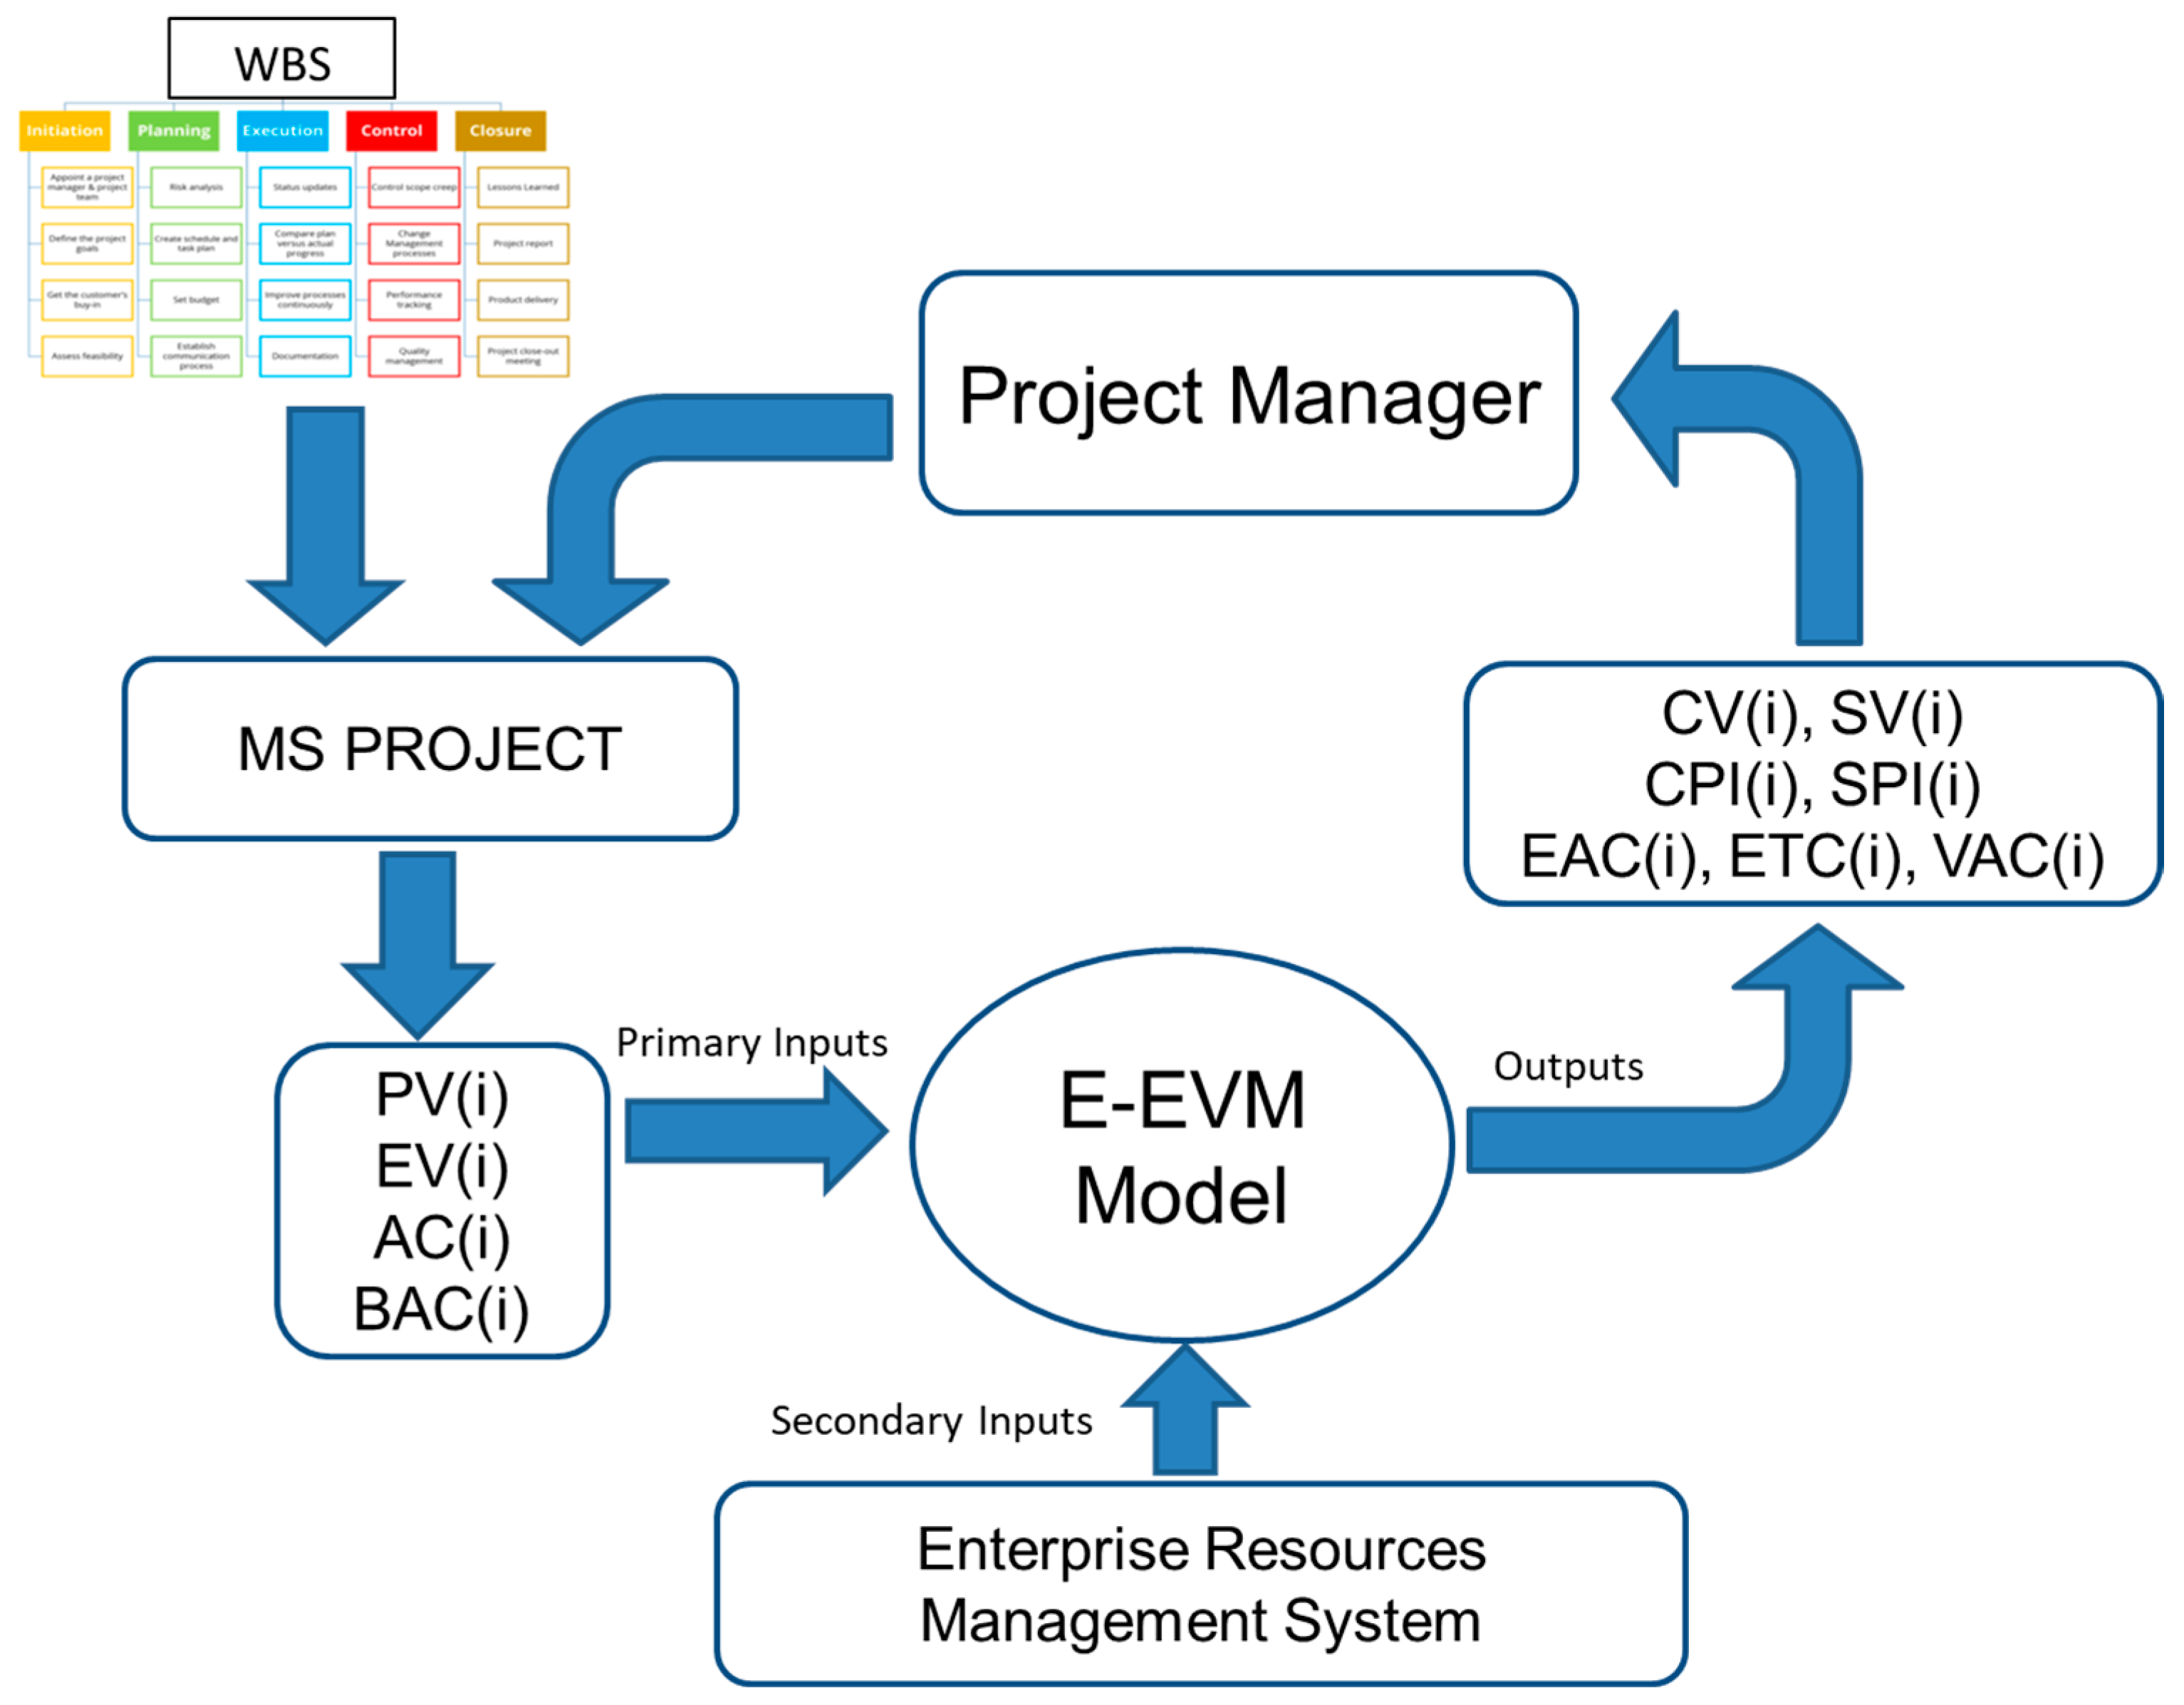
5.1. General Procedure E-EVM Models

This section focuses on demonstrating the results after the description of the new E-EVM model in Section 4. As indicated, this is a simulation of a big aerospace project where the WBS has been disaggregated into 4000 subprojects. The projects are measured in hours as the unit cost which allows us to know the times without using the ESM [5,6,7], EDM [8], or EVM [9] models.
In Table 3, the main parameters of project performance have been selected.
In order to facilitate comprehension of the whole procedure, a set up “color” code system has been proposed in Figure 2. Colors green and blue are linked directly to the two improvements implemented in the E-EVM model. The first improvement, that is to say, the use of units of time (hours) instead of units of cost (EUR) will be assigned to the green color. Moreover, the second one, that is to say, the disaggregation into subprojects, will be assigned to the blue color. Obviously, this color system will provide with a more visual and intuitive system for the follow up of the whole process.
The general procedure followed is shown in Figure 3, where different stages have been defined with the colors previously mentioned. A distinction can be made between the projections, main parameters, control limits and subprojects out of the range of computation, in blue, and the cost versus time computation and overall project output, in green, which means that they are linked to double vision.
In order to understand Figure 3, the notation requires some explanation:
  • N(i): Set of subprojects i, for every i belonging to the WBS.
  • AC, PV, EV, BAC, and hourly rate: Set of inputs of each subproject i.
  • CV(i); CPI(i); SV(i); SPI(i); EAC(i); ETC(i); and VAC(i): Set of output of each subproject i (column vectors).
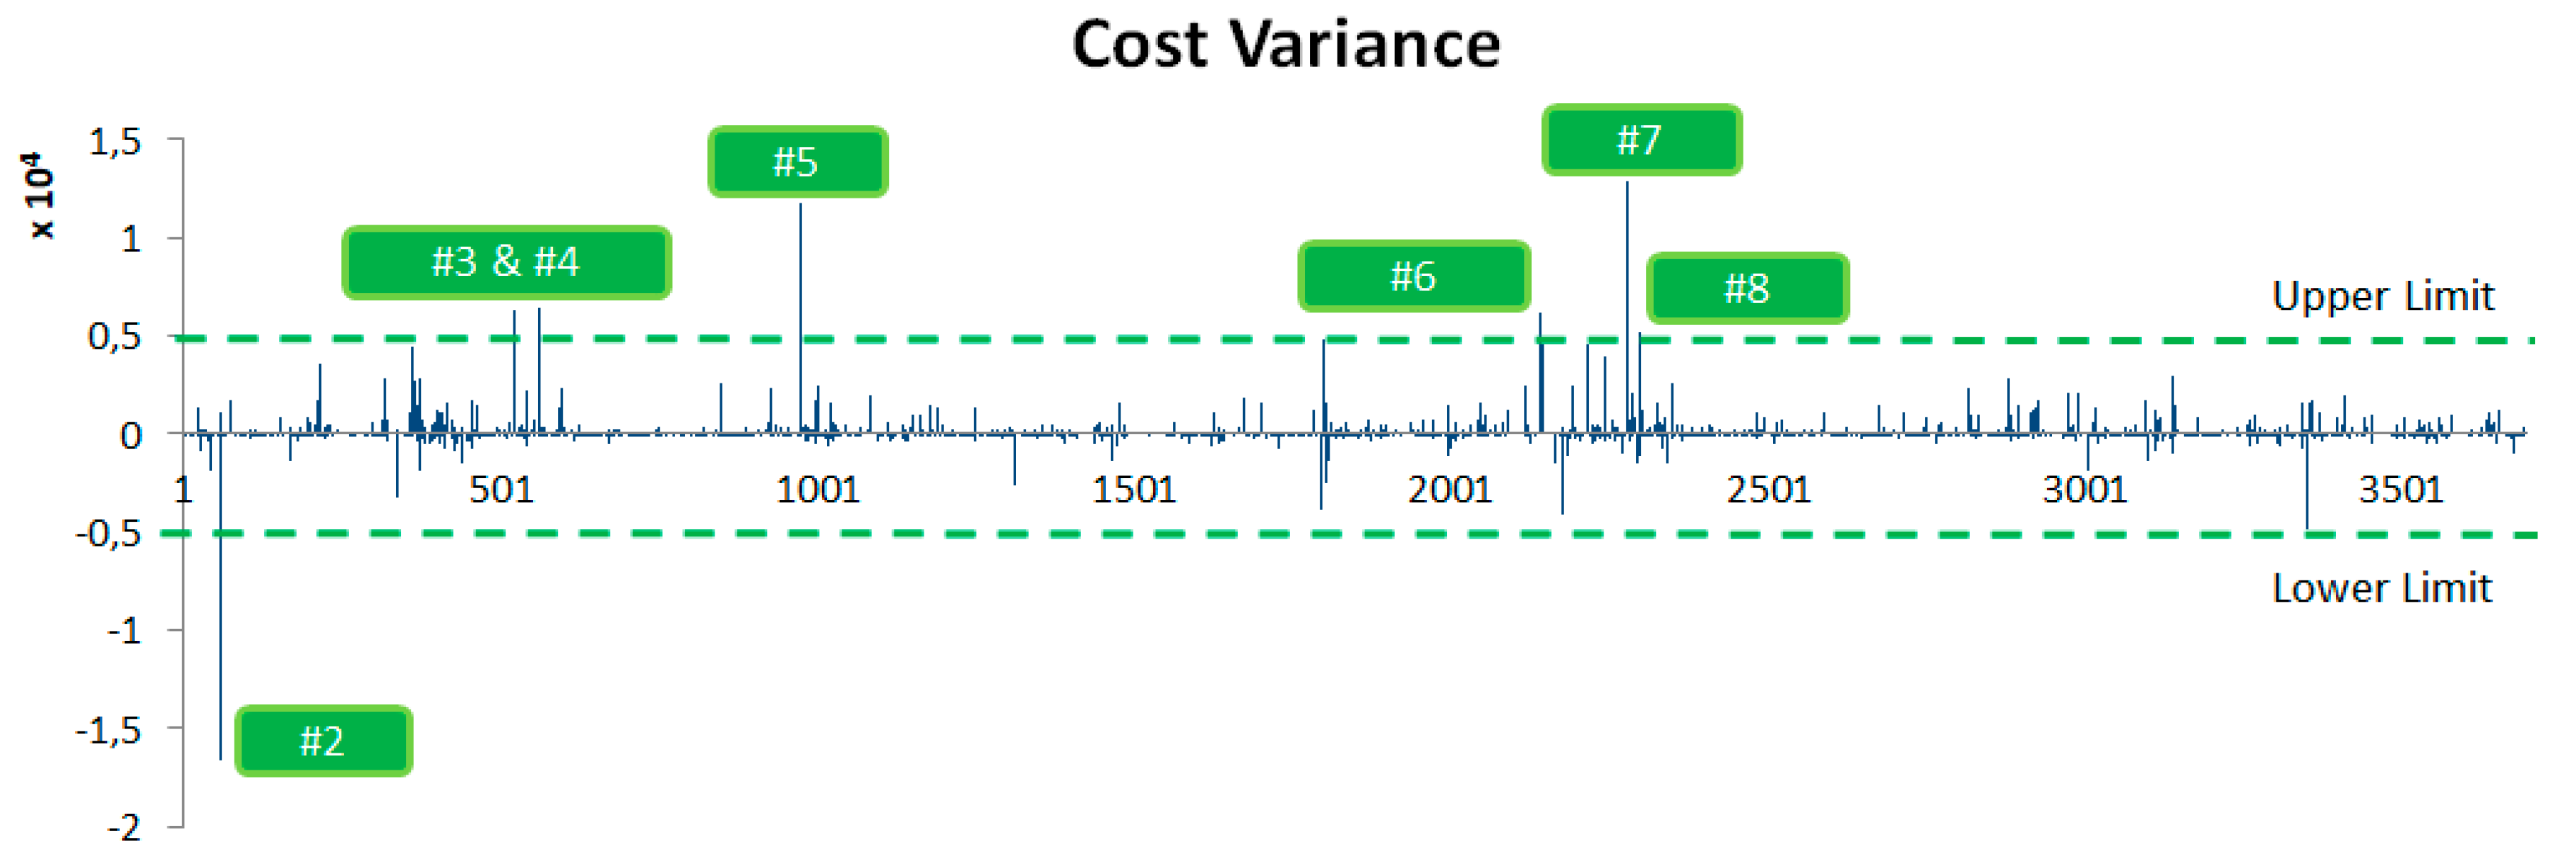
  • UpL_CV and LoL_CV: Upper and lower limit of Cost Variance.
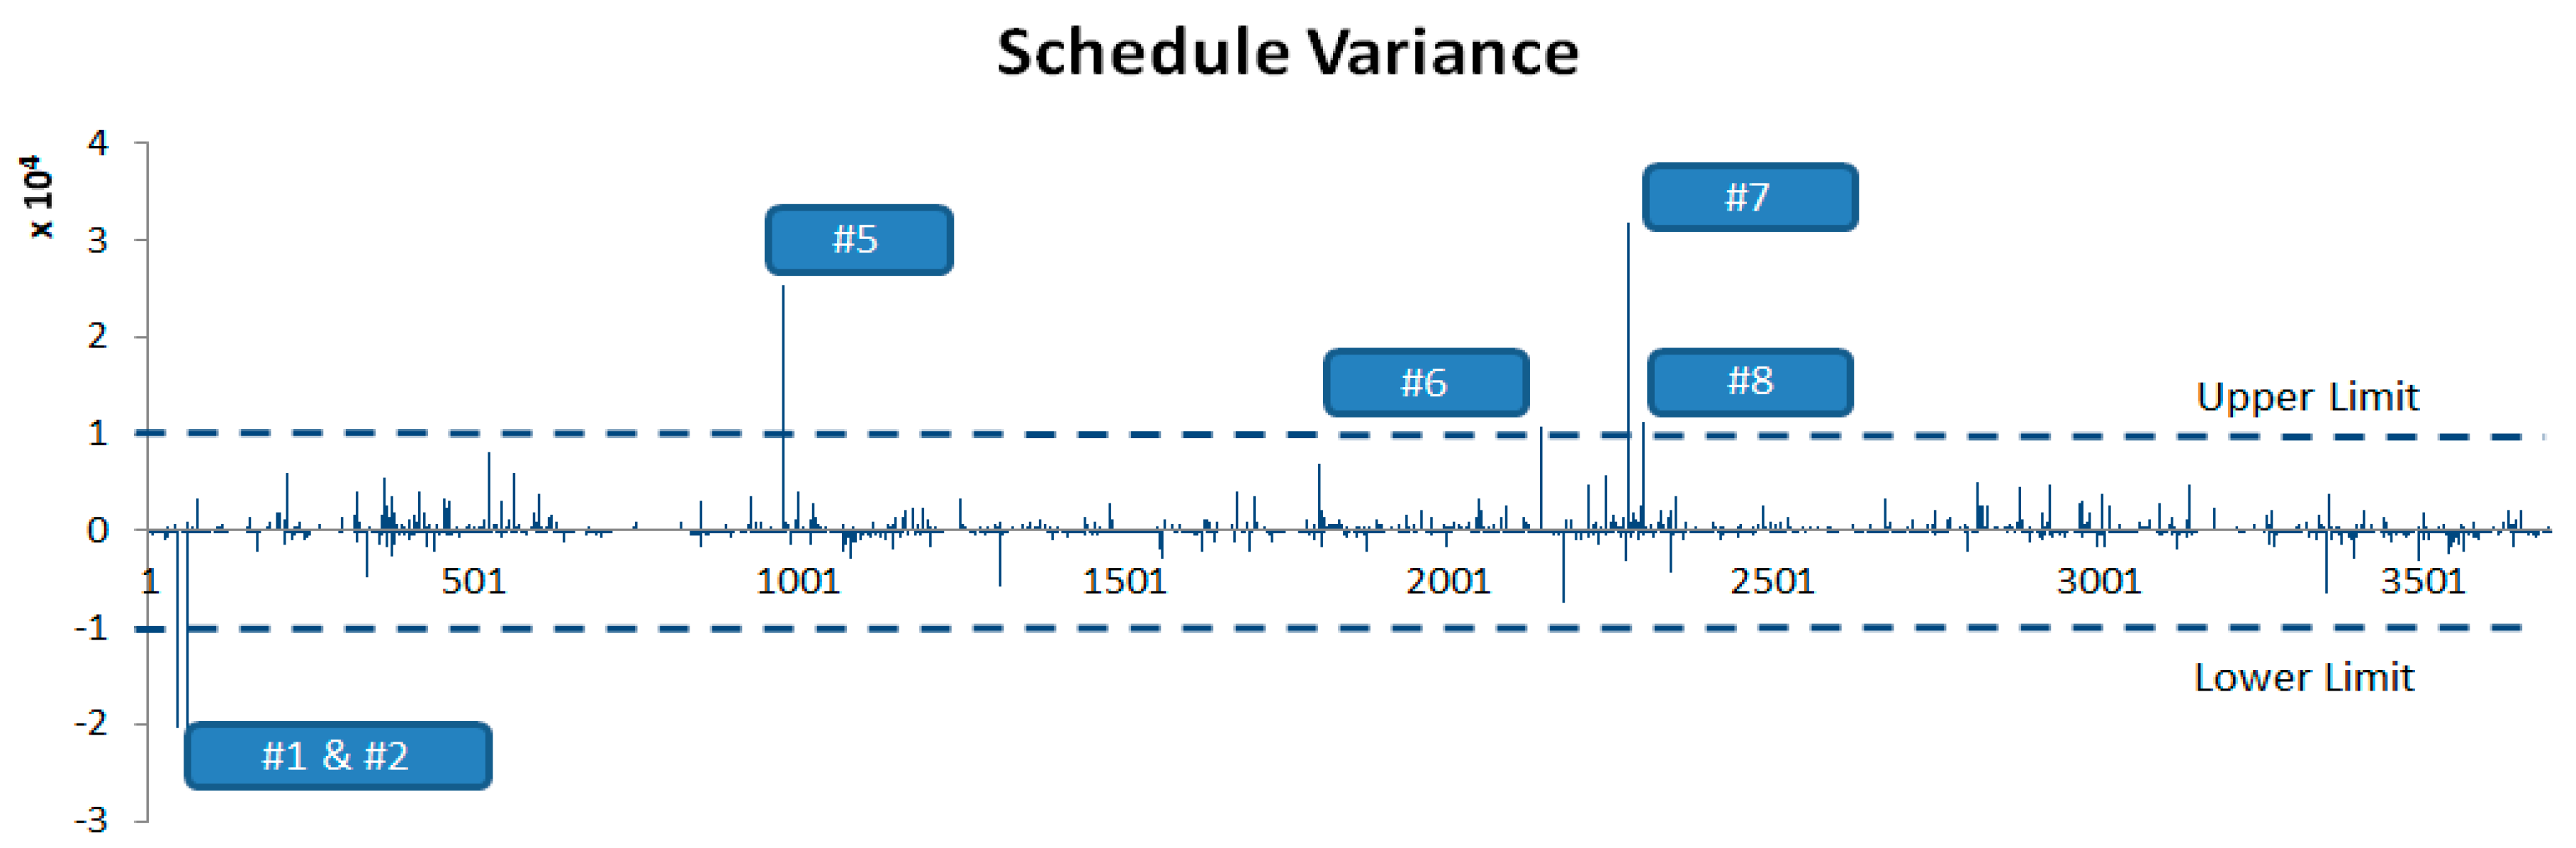
  • UpL_SV and LoL_SV: Upper and lower limit of Schedule Variance.

5.2. Analysis of Results (Second Improvement)

Following the former general procedure and running the algorithm described previously, results can be derived. The system provides a project status overview and addresses subprojects problems, which have worse outcomes.
The dataset used in this model has two layers, primary and secondary inputs, as shown before in the Figure 1. The four primary inputs are the planned values (PV), the current costs (AC), the percentage of progress (EV), and the final budget at the end of the project (BAC) for each i subprojects. Secondary inputs are the average hourly rates (EUR/h) of each functional area, milestones, detailed planning, and WBS for each i subprojects. In this second layer, pre-processing analysis to convert program and operational data into computational data is needed, this being the main difficulty dealing with the dataset construction. It is beyond any doubt that this pre-processing task requires a very detailed knowledge of the project, and some project management skills focused on scope, chronogram, and cost management.
Additionally, the E-EVM model is a cyclical model running lots of iterations. At the end, this case study was managing more than 1 million data which clearly shows the dimension of the dataset.
Figure 4 simulates Cost Variance (CV) by identifying projects with current cost above and under the established limits.
It is necessary to point out that, in this case, the upper and the lower limit have been defined for the value equivalent to 5000 h. Strictly speaking, this is a decision of the project manager and different criteria could be considered, among which we could indicate:
  • A percentage of the subproject with the highest associated cost.
  • A penalty set for contracting with the end customer.
  • Reference of a possible variable financial compensation assigned to the project leader.
Table 4 only shows the subprojects where Cost Variance parameters are out of the as defined limits.
Figure 5 simulates Schedule Variance (SV), where the projects with a current schedule behind or ahead of the planned time have been identified.
The upper and lower limits have also been established by the project manager by adopting a value equivalent to 10,000 h.
Table 5 shows the parameters of the projects whose Schedule Variance values are out of the limits defined by the project manager.

5.3. Double-Vision Results (First Improvement)

Once the analysis of the WBS has been applied, it is now time to make a forecast about the end of the project by taking into account the main deviations identified in the former section. Figure 6 shows the main estimators of EVM.
The average hourly rate for each functional area is an input of the general procedure described in Section 4.1, as the values defined by the finance department of each company. Table 6 shows the fictional values used in this paper.
By applying these hourly rates to the ETC parameter (previously computed in Table 4 and Table 5), an accurate, necessary budget forecast can be made in order to finish pending activities of the subprojects identified out of limits in the CV and SV analysis (see Table 7).
The ETC (hours) column shows the amount of hours needed to complete each subproject, whilst the ETC (EUR) column shows the same concept but in monetary units after applying the corresponding hourly rate. On the other hand, VAC shows the variance at completion of the subprojects compared to the initial budget. As indicated, we have proposed this improvement which will allow a project manager to work on the project with a “double” vision, both in units of time (hours) and in monetary units (EUR).

6. Conclusions, Limitations, and Future Research

Usually, research on the management of the aerospace sector has been focused on EVM. However, in this manuscript, we have presented an original application of the so-defined E-EVM model to a case study, showing real results for the aerospace industry. This improvement is based on a global project whose activities have been broken down into 4000 subprojects which is, in fact, very common practice in the aerospace industry. As indicated, this feature entails a novel aspect for aerospace industry research which has not been tested in another relevant industrial sector.
Our main conclusions focus on three fundamental items. First of all, the implementation of a technique to manage a large-size WBS to E-EVM can reduce the decision-making process time and can also be applied to the entire project as it has been focused on the subprojects’ expected performances. Secondly, we offer a “double vision”, defined in this paper, which increases the accuracy of the project’s information by obtaining more precise estimations of the resources needed to finalize the project. Finally, we can set up a continuous improvement strategy by applying our E-EVM-defined model, cyclically. The conclusions obtained in this paper can help in revisiting the existing literature on Earned Value Management and support a very deep updated revision of the literature.
This article has both theoretical and practical implications, making a contribution to the empirical literature on project management, specifically on the EVM model originally introduced by Webb [3] and Anbari [2], introducing a novel approach labelled as E-EVM. Additionally, it presents some new elements, not previously included in the existing models, such as the block diagram, the algorithm implemented, and also the numerical cost results which will allow managers to improve their decision-making process.
As the design of this research has not given answers to all limitations of the EVM model (e.g., the agency problem, the risk of artificially over “cooking” some performance indexes, such as the SV and SPI), it is desirable and feasible to further explore these limitations as pointed out by some scholars [10]. In effect, further research about may incorporate Bayesian Inference methodology [52] in order to increase the precision of the decision-making process with the introduction of expert opinions. Bayes’ Theorem offers us the possibility of including the opinion and knowledge of experts in a certain subject in a mathematical model. The research clearly identifies the need to deepen the real case study by integrating Bayesian inference.
There have been many innovative applications in recent years [53,54,55,56,57]. Another future research should be focused on quality because the aerospace sector is an industry where quality is of vital relevance. Furthermore, the production systems are very demanding and most of them are designed to manufacture according to the objective of “zero defects”. The main objective for future research should be to review the case study in order to incorporate the measurement of compliance with the formerly established requirements.
Finally, we would also like to delve into the study of the possible application of learning curves to the model. In effect, further research is needed to explore the “learning curves” effect on the performance project as the aerospace sector applies these curves in its production process. Answering these questions will contribute to a greater understanding of E-EVM.

Author Contributions

The individual contribution of each author has been as follows: writing, conceptualization, and methodology supervision, J.L.P.; writing, formal analysis, software, data and validation, J.C.M.R.; writing, conceptualization, formal analysis, S.C.R. All authors have read and agreed to the published version of the manuscript.

Funding

This research received no external funding.

Data Availability Statement

Data is contained within the article.

Conflicts of Interest

There are no conflicts of interest.

Abbreviations

The following abbreviations are used in this manuscript:
E-EVMEnhanced-Earned Value Management
EVMEarned Value Management
ESMEarned Scheduled Management
EDMEarned Duration Model
QEVMQuality Earned Value Model
TEDAETechnological Defence, Aeronautical and Space Companies
GDPGross Domestic Product
EIMEarned Incentive Metric
WBSWork Breakdown Structure
MSPMicrosoft Project
PERTProgram Evaluation and Review Technique
CCPMCritical Chain Project Management

References

  1. Meléndez, J.C.; Galán, J.L. La Subcontratación en el Sector Aeronáutico: Una Aproximación a la Realidad Andaluza. Master’ Thesis, Universidad Pablo de Olavide, Sevilla, Spain, June 2007. [Google Scholar]
  2. Anbari, F.T. Earned value project management method and extensions. Proj. Manag. J. 2003, 34, 12–23. [Google Scholar] [CrossRef]
  3. Webb, A. Using Earned Value: A Project Manager’s Guide; Gower Publishing Ltd.: Aldershot, UK, 2003. [Google Scholar]
  4. Vanhoucke, M. Using activity sensitivity and network topology information to monitor project time performance. Omega 2010, 38, 359–370. [Google Scholar] [CrossRef]
  5. Lipke, W. Schedule is Different. The Measurable News, March 2003; 10–15. [Google Scholar]
  6. Lipke, W.; Zwikael, O.; Henderson, K.; Anbari, F. Prediction of project outcome. The application of statistical methods to earned value Management and earned schedule performance indexes. Int. J. Proj. Manag. 2009, 27, 400–407. [Google Scholar] [CrossRef]
  7. Lipke, W. Earned Schedule–Ten Years After. The Measurable News, March 2013; 15–21. [Google Scholar]
  8. Khamooshi, H.; Golafshani, H. EDM: Earned Duration Management, a new approach to schedule performance management and measurement. Int. J. Proj. Manag. 2014, 32, 1019–1041. [Google Scholar] [CrossRef]
  9. Dodson, M.; Defavari, G.; de Carvalho, V. Quality: The third element of Earned Value Management. Procedia Comput. Sci. 2015, 64, 932–939. [Google Scholar] [CrossRef] [Green Version]
  10. Nizam, A.; Elshannaway, A. Review of earned value management (EVM) methodology, its limitations, and applicable extensions. J. Manag. Eng. Integr. 2019, 12, 59–70. [Google Scholar]
  11. Webb, A. Project Management for Successful Product Innovation; Gower Publishing Ltd.: Aldershot, UK, 2000; p. 433. [Google Scholar]
  12. Webb, A. Managing Innovate Projects; Chapman & Hall: London, UK, 1993; p. 379. [Google Scholar]
  13. Chen, H.L.; Chen, W.T.; Lin, Y.L. Earned value project management: Improving the predictive power of planned value. Int. J. Proj. Manag. 2016, 34, 22–29. [Google Scholar] [CrossRef]
  14. Atkinson, R. Project management: Cost, time and quality, two best guesses and a phenomenon, its time to accept other success criteria. Int. J. Proj. Manag. 1999, 17, 337–342. [Google Scholar] [CrossRef]
  15. Babu, A.J.G.; Suresh, N. Project management with time, cost, and quality considerations. J. Oper. Res. 1996, 88, 320–327. [Google Scholar] [CrossRef]
  16. Khang, D.B.; Myint, Y.M. Time, cost and quality trade-off in project management: A case study. Int. J. Proj. Manag. 1999, 17, 249–256. [Google Scholar] [CrossRef]
  17. Basu, R. Managing quality in projects: An empirical study. Int. J. Proj. Manag. 2014, 32, 178–187. [Google Scholar] [CrossRef]
  18. Chen, H.L. Improving forecasting accuracy of project earned value metrics: Linear modeling approach. J. Manag. Eng. 2014, 30, 135–145. [Google Scholar] [CrossRef]
  19. Colin, J.; Vanhoucke, M. A comparison of the performance of various project control methods using earned value management systems. Expert Syst. Appl. 2015, 42, 3159–3175. [Google Scholar] [CrossRef]
  20. Pajares, J.; López-Paredes, A. An extension of the EVM analysis for project monitoring: The cost control index and the schedule control index. Int. J. Proj. Manag. 2011, 29, 615–621. [Google Scholar] [CrossRef]
  21. Acebes, F.; Pajares, J.; Galán, J.M.; López-Paredes, A. Beyond earned value management: A graphical framework for integrated cost, schedule and risk monitoring. Procedia Soc. Behav. Sci. 2013, 74, 181–189. [Google Scholar] [CrossRef] [Green Version]
  22. Khodakarami, V.; Abdi, A. Project cost risk analysis: A Bayesian networks approach for modeling dependencies between cost items. Int. J. Proj. Manag. 2014, 32, 1233–1245. [Google Scholar] [CrossRef]
  23. Kerkhove, L.P.; Vanhoucke, M. Extensions of earned value management: Using the earned incentive metric to improve signal quality. Int. J. Proj. Manag. 2017, 35, 148–168. [Google Scholar] [CrossRef]
  24. Moradi, N.; Mousavi, S.M.; Vahdani, B. An earned value model with risk analysis for project management under uncertain conditions. J. Intell. Fuzzy Syst. 2017, 32, 97–113. [Google Scholar] [CrossRef]
  25. Mahdi, I.; Abd-Elrashed, I.; Ahmed, S.; Lamisse, R. Difficulties of implementing earned value management in construction sector in Egypt. Int. J. Eng. Res. Stud. 2018, 5, 15. [Google Scholar]
  26. Araszkiewicz, K.; Bochenek, M. Control of construction projects using the Earned Value Method—Case study. Gruyter 2019, 2. [Google Scholar] [CrossRef]
  27. Khesal, T.; Abbas, S.; Mohammad, K.; Masoud, G.; Soltani, R. Integrated cost, quality, risk and schedule control through earned value management(EVM). J. Eng. Des. Technol. 2019, 17, 183–203. [Google Scholar] [CrossRef]
  28. Sackey, S.; Lee, D.; Kim, B. Duration estimate at completion: Improving earned value management forecasting accuracy. KSCE J. Civ. Eng. 2020, 24, 693–702. [Google Scholar] [CrossRef]
  29. Koke, B.; Moehler, R.C. Earned green value management for project management: A systematic review. J. Clean. Prod. 2019, 230, 189–197. [Google Scholar] [CrossRef]
  30. TEDAE, Spanish Association of Technological Defence. Aeronautical and Space Companies. In Activities Report; TEDAE, Spanish Association of Technological Defence: Madrid, Spain, 2018. [Google Scholar]
  31. Galán, J.L.; García, J.I. El sector aeronáutico andaluz: Una industria estratégica e innovadora en transformación. In Círculo de Innovación Empresarial; Fundación BBVA: Madrid, Spain, 2015. [Google Scholar]
  32. Guerras, L.A.; Navas, J.E. La Dirección Estratégica de la Empresa. Teoría y Aplicaciones, 4th ed.; Thomson-Civitas Editorial: Roma, Italy, 2007. [Google Scholar]
  33. Silver, A. The Gripen programme. Air Space Eur. 1999, 1, 20–23. [Google Scholar]
  34. Antvik, S. Earned value management in Sweden-Experiences and examples: The Gripen project. In Proceedings of the Project Managment Institute Annual Seminars & Symposium, San Antonio, TX, USA, 3 October 2002; Project Management Institute: Newtown Square, PA, USA, 2002. [Google Scholar]
  35. Abba, W. How earned value got to primetime: A short look back and a glance ahead. In Proceedings of the Project Management Institute Annual Seminars & Symposium, San Antonio, TX, USA, 7 September 2000; Project Management Institute: Newtown Square, PA, USA, 2000. [Google Scholar]
  36. Atkins, K.L.; Martin, B.D.; Vellinga, J.M.; Rick, A.P. STARDUST: Implementing a new manage-to-budget paradigm. Acta Astronaut. 2003, 52, 87–97. [Google Scholar] [CrossRef]
  37. Putz, P.; Maluf, D.; Bell, D.G.; Gurram, M.M.; Hsu, J.; Patel, H.N.; Swanson, K.J. Earned value management at NASA: An integrated, lightweight solution. Aerosp. Conf. IEEEAC 2007, 2, 1–8. [Google Scholar]
  38. Hunter, H.; Fitzgerald, R.; Barlow, D. Improved cost monitoring and control through the Earned Value Management System. Acta Astronaut. 2014, 93, 497–500. [Google Scholar] [CrossRef]
  39. Dibert, J.C.; Velez, J.C. An Analysis of Earned Value Management Implementation within the F-22 System Program Office’s Software Development; Naval Postgraduate School: Monterey, CA, USA, 2006. [Google Scholar]
  40. Robinson, R. Earned value management. The Boeing Company Single EVMS. In Proceedings of the 13th Annual International Conference, Istanbul, Turkey, 13–17 April 2001. [Google Scholar]
  41. Christ, D.K. Theory of Constraints Project Management in Aircraft Assembly; The Boeing Company: Chicago, IL, USA, 2001. [Google Scholar]
  42. Laporte, C.Y.; Doucet, M.; Roy, D.; Drolet, M. Improvement of software engineering performances an experience report at bombardier transportation–Total transit systems signalling group. In Proceedings of the 17th Annual International Symposium, International Council on Systems Engineering, San Diego, CA, USA, 24–28 June 2007. [Google Scholar]
  43. Locksley, R.H.; Rice, C.B. Establishing a program for applying Earned Value Metrics to flight test. IEEE Aerosp. Conf. 2000, 2, 1–8. [Google Scholar]
  44. Meléndez Rodríguez, J.C.; Lopez Pascual, J.; Cañamero, P.; García, F.P. Big Data and Earned Value Management in Airspace Industry. Book Chapter Big Data Management; Springer International Publishing: Berlin/Heidelberg, Germany, 2017; pp. 257–267. [Google Scholar] [CrossRef]
  45. Meléndez Rodríguez, J.C.; López Pascual, J.; Cañamero, P.; García, F.P. An overview of earned value management in airspace industry. In Proceedings of the Tenth International Conference on Management Science and Engineering Management. Advances in Intelligent Systems and Computing; Springer: Berlin/Heidelberg, Germany, 2017; Volume 502, pp. 1465–1477. [Google Scholar] [CrossRef]
  46. 5th Edition PMBOK® Guide-Chapter 7: Earned Value Management (Part 1). 2013. Available online: https://4squareviews.com/2013/05/09/5th-edition-pmbok-guide-chapter-7-earned-value-measurement-part-1/ (accessed on 15 December 2020).
  47. Richardson, G.L. EVM2—A new look at the earned value management model. Am. J. Manag. 2017, 17, 71. [Google Scholar]
  48. Mishakova, A.; Vakhrushkinaa, A.; Murgula, V.; Sazonova, T. Project control based on a mutual application of pert and earned value management methods. Procedia Eng. 2016, 165, 1812–1817. [Google Scholar] [CrossRef]
  49. Bovteev, S.V.; Petrochenko, M. Method “Earned Value Management” for timescale controlling in construction projects. Appl. Mech. Mater. 2015, 725, 1025–1030. [Google Scholar] [CrossRef]
  50. Acebes, F.; Pajares, J.; Galán, J.M.; López-Paredes, A. A new approach for project control under uncertainty. Going back to the basics. Int. J. Proj. Manag. 2014, 32, 423–434. [Google Scholar] [CrossRef]
  51. Association for Project Management. Earned Value Management Handbook; Association for Project Management: Buckinghamshire, UK, 2013; ISBN 10-1-903494-47-8. [Google Scholar]
  52. Caron, F.; Ruggeri, F.; Merli, A. A bayesian approach to improve estimate at completion in earned value management. Proj. Manag. J. 2013, 44, 3–16. [Google Scholar] [CrossRef]
  53. Sunarti, N.; Mastan, Z.; Cin, L. The application and challenges of earned value management (EVM) as cost monitoring tool in the construction industry. Int. J. Eng. Technol. 2018, 7, 96. [Google Scholar] [CrossRef]
  54. De Marco, A.; Narbaev, T. Earned value-based performance monitoring of facility construction projects. J. Facil. Manag. 2013, 11, 69–80. [Google Scholar] [CrossRef] [Green Version]
  55. Chin Keng, T.; Shahdan, N. The application of Earned Value Management (EVM) in costruction project management. J. Technol. Manag. Bus. 2015, 2, 2289–7224. [Google Scholar]
  56. Sruthia, M.D.; Aravindanb, A. Performance measurement of schedule and cost analysis by using earned value management for a residential building. Mater. Today Proc. 2020, 33, 524–532. [Google Scholar] [CrossRef]
  57. Hendiania, S.; Bagherpoura, M.; Mahmoudib, A.; Liaoc, H. Z-number based earned value management (ZEVM): A novel pragmatic contribution towards a possibilistic cost-duration assessment. Comp. Ind. Eng. 2020, 143, 106430. [Google Scholar] [CrossRef]
Figure 1. A scheme of the enhanced-earned value management (E-EVM) model. Source: Own elaboration.
Symmetry 13 00232 g001
Figure 2. Color code legend. Source: Own elaboration.
Symmetry 13 00232 g002
Figure 3. E-EVM blocks diagram model. Source: Own elaboration.
Symmetry 13 00232 g003
Figure 4. Cost variance—complete graphical analysis. Source: Own elaboration.
Symmetry 13 00232 g004
Figure 5. Schedule variance—complete analysis. Source: Own elaboration.
Symmetry 13 00232 g005
Figure 6. EVM reporting graph. Source: Own adaptation from [29].
Symmetry 13 00232 g006
Table 1. Literature on Earned Value Management (EVM) application to industrial sectors. Source: Own elaboration.
SectorReferenceMain topicsPublication
Aerospace(a) 13, 28
(b) 14, 15, 16, 17, 20, 21, 23, 27
(c) 18, 25, 25
Subcontracting management, aircraft manufacturing and assembly, spacecrafts manufacturing, flight test, general application.(a) 1990–2000
(b) 2001–2010
(c) 2011–
Software development and computational research(a) 32
(b) 14, 6, 19, 22
(c) 35, 37, 39, 50
Simulation, statistical methods, embedded software, critical path method application, network dataset, graphical framework, incentive metrics, work breakdown structure improvement.(a) 1990–2000
(b) 2001–2010
(c) 2011–
Products(a) 5
(b) 57
High technology products and manufacturer equipment.(a) 2003
(b) 2020
Army forces8New schedule approach applied to us coast guard.2014
Miscellaneous(a) 26
(b) 31
(c) 36
EVM methodology revision.(a) 2019
(b) 1999
(c) 2011–
Chemical29Improving forecasting models.2016
Building construction(a) 30, 34, 38, 40, 41, 42, 43, 44, 51, 52, 53, 54, 55, 56Linear modeling in electrical sector, new quality models, cost risk analysis, Malaysia, Europe and Egypt real building cases, integrated cost, quality and risk models approach.(a) 2011–
Cement factory33Time, cost, and quality trade-off approach.1999
Oil and gas55Bayesian model approach.2013
Environment45Measurement of project sustainability and performance.2019
Table 2. EVM and E-EVM. Features and main characteristics. Source: Own elaboration.
CharacteristicsEVME-EVM
MetricsEV, AC, PVEV(i), AC(i), PV(i)
Performance indicator (variances)CV, SVCV(i), SV(i)
Performance indicator (indices)CPI, SPICPI(i), SPI(i)
Forecast methodEAC, ETC, VACEAC(i), ETC(i), VAC(i)
“Double” vision cost/time (first improvement)NoYes
InputsCost unitsCost and time units
OutputsCost unitsCost and time units
Large-size work breakdown structure (WBS; second improvement)NoYes
Scope of the model/applicabilityOne projecti projects
Continuous revision and improvement usageOne projecti projects
Decision-making processOne projecti projects
Table 3. Main EVM parameters. Source: Own elaboration.
ParameterConditionMeaning
Schedule Variance (SV)SV < 0Behind schedule
SV > 0Ahead of schedule
Schedule Performance Index (SPI)SPI < 1Non-efficient use of time
SPI > 1Efficient use of time
Cost Variance (CV)CV < 0Over budget
CV > 0Under budget
Cost Performance Index (CPI)CPI < 1Non-efficient use of resources
CPI > 1Efficient use of resources
Note: Boldface means unwanted conditions.
Table 4. Cost variance—complete quantitative analysis. Source: Own elaboration.
Subproject #ACPVEVBACCVSVCPISPIEACETCVAC
720,891180533,70330,82012,81231,8981.618.718,008−288312,812
515,100149326,80422,29511,70425,3111.818.010,591−450911,704
48447863014,69923,504625260691.71.717,25288056252
311,89510,14818,14317,860624879951.51.811,612−2836248
66754216012,95010,000619610,7901.96.03804−29506196
89301349914,55115,267525011,0521.64.210,0177165250
234,15037,80017,460113,189−16,690−20,3400.50.5129,87995,729−16,690
Note: Green font means CV with positive value, and red font means CV with negative value.
Table 5. Schedule variance—complete quantitative analysis. Source: Own elaboration.
Subproject #ACPVEVBACCVSVCPISPIEACETCVAC
720,891180533,70330,82012,81231,8981.618.718,008−288312,812
515,100149326,80422,29511,70425,3111.818.010,591−450911,704
89301349914,55115,267525011,0521.64.210,0177165250
66754216012,95010,000619610,7901.96.03804−29506196
234,15037,80117,461113,189−16,689−20,3400.50.5129,87895,728−16,689
113,65732,20411,86789,600−1790−20,3370.90.491,39077,733−1790
Note: Green font means SV with positive value, and red font means SV with negative value.
Table 6. Hourly rate (EUR/h) of main functions at the company. Source: Own elaboration. (*).
Functional AreaHourly Rate EUR/hFunction Code
Design office50DO
Operations45OP
Marketing and sales60MS
Quality75QL
Table 7. ETC “double” vision (hours and EUR). Source: Own elaboration.
Functional AreaSubproject #BACEACETC (Hours)ETC (EUR)VACStatus
DO189,60091,39077,7333,886,650−1790Over planned budget
DO2113,189129,87895,7284,786,400−16,689Over planned budget
OP317,86011,612−283−12,7356248Under planned budget
OP423,50417,2528805396,2256252Under planned budget
OP522,29510,591−4509−202,90511,704Under planned budget
MS610,0003,804−2950−177,0006196Under planned budget
QL730,82018,008−2883−216,22512,812Under planned budget
QL815,26710,01771653,7005250Under planned budget
Note: Green font means VAC with positive value, and red font means VAC with negative value.
Publisher’s Note: MDPI stays neutral with regard to jurisdictional claims in published maps and institutional affiliations.

