
QSPR Models for the Molar Refraction, Polarizability and Refractive Index of Aliphatic Carboxylic Acids Using the ZEP Topological Index

Abstract
:1. Introduction
2. Materials and Methods
- (i)
- the selection of the data set;
- (ii)
- generation of molecular ZEP index for carboxylic acids used in this work;
- (iii)
- building QSPR models within the selected data set;
- (iv)
- validation of the obtained QSPR models using the y-randomization test and the internal and external validation strategies.
2.1. Data Set
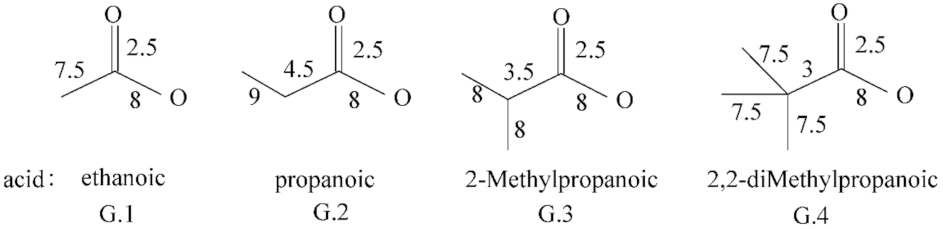
2.2. The ZEP Index
2.3. QSPR Model Building
2.4. Model Validation
3. Results and Discussion
3.1. QSPR Model Building for Molecular Refraction
3.1.1. Saturated Aliphatic Monocarboxylic Acids
3.1.2. Aliphatic Dicarboxylic Acids
3.1.3. Unsaturated Carboxylic Acids
3.1.4. Building the QSPR Model for Polarizability
3.1.5. Building QSPR Models for Refractivity Index
4. Conclusions
Funding
Informed Consent Statement
Conflicts of Interest
References
- Maguna, F.P.; Nunez, M.B.; Okulik, N.B.; Castro, E.A. Improved QSAR Analysis of the Toxicity of Aliphatic Carboxylic Acids. Russ. J. Gen. Chem. 2003, 73, 1792–1798. [Google Scholar] [CrossRef]
- Verma, R.P.; Kurup, A.; Hansch, C. On the role of polarisability in QSAR. Bioorg. Med. Chem. 2005, 13, 237–255. [Google Scholar] [CrossRef]
- Pyka, A.; Bober, K. Selected traditional structural descriptors and RM values for estimation and prediction of lipophilicity of homologous series of saturated fatty acids. J. Am. Oil Chem. Soc. 2006, 83, 747–752. [Google Scholar] [CrossRef]
- Sakuratani, Y.; Kasai, K.; Noguchi, Y.; Yamada, Y. Comparison of predictivities of log P calculation models based on experimental data for 134 simple organic compounds. QSAR Comb. Sci. 2007, 26, 109–116. [Google Scholar] [CrossRef]
- Shafiei, F. Relationship between Topological Indices and Thermodynamic Properties and of the Monocarboxylic Acids Applications in QSPR. J. Math. Chem. 2015, 6, 15–28. [Google Scholar] [CrossRef]
- Atkins, P.W. Physical Chemistry, 6th ed.; Oxford University Press: Oxford, UK; Melbourne, Australia; Tokyo, Japan, 1998; p. 654. [Google Scholar]
- Glasstone, S. Textbook of Physical Chemistry; Macmillan: London, UK, 1948; p. 543. [Google Scholar]
- Charles, K. Introduction to Solid State Physics, 8th ed.; John Wiley & Sons, Inc.: New York, NY, USA, 2005; p. 464. [Google Scholar]
- Ghose, A.K.; Crippen, G.M. Atomic physicochemical parameters for three-dimensional-structure-directed quantitative structure-activity relationships. 2. Modeling dispersive and hydrophobic interactions. J. Chem. Inf. Comput. Sci. 1987, 27, 21–35. [Google Scholar] [CrossRef]
- Miller, K.J.; Savchik, J.A. A new empirical Method to calculate Average Molecular Polarizabilities. J. Am. Chem. Soc. 1979, 101, 7206–7213. [Google Scholar] [CrossRef]
- Padrón, J.A.; Carrasco, R.; Pellón, R.F. Molecular descriptor based on a molar refractivity partition using Randic-type graph-teoretical invariant. J. Pharm. Pharmaceut. Sci. 2002, 5, 258–266. [Google Scholar]
- Naef, R.A. Generally Applicable Computer Algorithm Based on the Group Additivity Method for the Calculation of Seven Molecular Descriptors: Heat of Combustion, LogPO/W, LogS, Refractivity, Polarizability, Toxicity and LogBB of Organic Compounds; Scope and Limits of Applicability. Molecules 2015, 20, 18279–18351. [Google Scholar] [CrossRef] [PubMed] [Green Version]
- Verma, R.P.; Hansch, A.C. A comparison between two polarisability parameters in chemical-biological interactions. Bioorg. Med. Chem. 2005, 13, 2355–2372. [Google Scholar] [CrossRef]
- Hansch, C.; Kurup, A. QSAR of Chemical Polarizability and Nerve Toxicity. 2. J. Chem. Inf. Comput. Sci. 2003, 43, 1647–1651. [Google Scholar] [CrossRef]
- Wang, J.; Xie, X.Q.; Hou, T.J.; Xu, X.J. Fast Approaches for Molecular Polarizability Calculations. J. Phys. Chem. A 2007, 111, 4443–4448. [Google Scholar] [CrossRef] [Green Version]
- Sonar, A.N.; Pawar, N.S. Studies on viscosity, density and refractive index of substituted heterocyclic compounds in different media. Rasayan J. Cem. 2010, 3, 250–254. [Google Scholar]
- Granados, K.; Gracia-Fadrique, J.; Amigo, A.; Bravo, R. Refractive Index, Surface Tension, and Density of Aqueous Mixtures of Carboxylic Acids at 298.15 K. J. Chem. Eng. Data 2006, 51, 1356–1360. [Google Scholar] [CrossRef]
- Golovanov, I.B.; Zhenodarova, S.M. Quantitative structure-property relationship: XXVI. Toxicity of aliphatic carboxylic acids. Russ. J. Gen. Chem. 2006, 76, 40–44. [Google Scholar] [CrossRef]
- Weast, R.C. CRC Handbook of Physics and Chemistry, 68th ed.; CRC: Bwa Raton, FL, USA, 1987. [Google Scholar]
- Berinde, Z. Applications of Molecular Topology in The Study of Physico-Chemical Properties of Organic Compounds; Cub Press 22: Baia Mare, Romania, 2001. (In Romanian) [Google Scholar]
- Berinde, Z.; Berinde, M. On a matrix representation of molecular structures. Carpathian J. Math 2004, 20, 205–209. [Google Scholar]
- Berinde, Z.M. Comparing the molecular graph degeneracy of Wiener, Harary, Balaban, Randic and ZEP topological indices. Creat. Math. Inf. 2014, 23, 165–174. [Google Scholar] [CrossRef]
- Tropsha, A.; Gramatica, P.; Gombar, V.K. The Importance of Being Earnest: Validation is the Absolute Essential for Successful Application and Interpretation of QSPR Models. QSAR Comb. Sci. 2003, 22, 69–77. [Google Scholar] [CrossRef]
- Roy, P.P.; Roy, K. On some aspects of variable selection for partial least squares regression models. QSAR Comb. Sci. 2008, 27, 302–313. [Google Scholar] [CrossRef]
- Rücker, C.; Rücker, G.; Meringer, M. y-Randomization and Its Variants in QSPR/QSAR. J. Chem. Inf. Model. 2007, 47, 2345–2357. [Google Scholar] [CrossRef]
- Topliss, J.G.; Costello, R.J. Chance Correlations in Structure-Activity Studies Using Multiple Regression Analysis. J. Med. Chem. 1972, 15, 1066–1068. [Google Scholar] [CrossRef] [PubMed]
- Kiralj, R.; Ferreira, M.M.C. Basic Validation Procedures for Regression Models in QSAR and QSPR Studies: Theory and Application. J. Braz. Chem. Soc. 2009, 20, 770–787. [Google Scholar] [CrossRef] [Green Version]
- Consonni, V.; Ballabio, D.; Todeschini, R. Evaluation of model predictive ability by external validation techniques. J. Chemom. 2010, 24, 194–201. [Google Scholar] [CrossRef]

| Acid | ZEP | Rm | nD | P | ||||||
|---|---|---|---|---|---|---|---|---|---|---|
| Exp. | Pred. | Error | Exp. | Pred. | Error | Exp. | Pred. | Error | ||
| propanoic | 14.9568 | 17.51 | 17.76 | −0.25 | ||||||
| butanoic | 18.3959 | 22.14 | 22.33 | −0.19 | 1.411 b | 1.414 | −0.003 | 8.77 | 8.86 | 0.01 |
| 2-methylpropanoic | 18.2240 | 22.10 | 22.10 | 0.00 | 1.410 b | 1.414 | −0.004 | 8.76 | 8.78 | −0.02 |
| pentanoic | 21.8600 | 26.77 | 26.94 | −0.17 | 1.420 | 1.419 | 0.001 | 10.61 | 10.68 | −0.07 |
| 2-methylbutanoic | 21.6042 | 26.73 | 26.60 | 0.13 | 1.417 b | 1.418 | −0.001 | 10.59 | 10.55 | 0.04 |
| 2,2-dimethylpropanoic | 21.3494 | 26.74 | 26.26 | −0.47 | 1.419 | 1.418 | 0.001 | 10.60 | 10.42 | 0.18 |
| hexanoic | 25.3241 | 31.41 | 31.55 | −0.14 | 1.427 | 1.420 | 0.007 | 12.45 | 12.50 | −0.05 |
| 2-methylpentanoic | 25.2312 | 31.36 b | 31.43 | −0.07 | 1.425 | 1.421 | 0.004 | 12.43 b | 12.46 | −0.03 |
| 3-methylpentanoic | 25.1775 | 31.36 | 31.36 | 0.00 | 1.425 | 1.421 | 0.004 | 12.43 | 12.43 | 0.00 |
| 4-methylpentanoic | 25.0790 | 31.36 | 31.23 | 0.13 | 1.425 | 1.421 | 0.004 | 12.43 | 12.38 | 0.05 |
| 2,2-dimethylbutanoic | 24.9786 | 31.37 b | 31.09 | 0.28 | 12.44 b | 12.32 | −0.12 | |||
| 2,3-dimethylbutanoic | 25.0456 | 31.32 b | 31.18 | 0.14 | 12.42 | 12.36 | 0.06 | |||
| 2-ethylbutanoic | 25.3088 | 31.36 | 31.53 | 0.17 | 1.425 | 1.421 | 0.004 | |||
| heptanoic | 28.7882 | 36.04 | 36.16 | −0.12 | 1.429 | 1.425 | 0.003 | 14.28 | 14.32 | −0.04 |
| 2-Methylhexanoic | 28.6954 | 35.93 b | 36.04 | −0.11 | 14.24 b | 14.24 | 0.00 | |||
| 3-methylhexanoic | 28.6254 | 35.99 b | 35.95 | 0.04 | 14.26 b | 14.24 | 0.02 | |||
| 2,2-dimethylpentanoic | 28.4177 | 36.00 b | 35.67 | 0.33 | 1.423 b | 1.424 | −0.001 | 14.27 b | 14.13 | 0.14 |
| 3,3-dimethylpentanoic | 28.3330 | 36.01 | 35.56 | 0.45 | 1.431 b | 1.424 | 0.007 | |||
| 2,3-dimethylpentanoic | 28.6098 | 35.94 | 35.95 | −0.01 | 14.24 | 14.23 | 0.01 | |||
| 2,4-dimethylpentanoic | 28.4434 | 35.94 | 35.71 | 0.23 | 1.429 | 1.426 | 0.003 | 14.19 | 14.14 | 0.05 |
| 2-ethylpentanoic | 28.7567 | 35.95 | 36.12 | −0.17 | 14.25 | 14.31 | −0.06 | |||
| 2,2,3-trimethylbutanoic | 28.5568 | 35.96 b | 35.86 | 0.10 | 14.26 b | 14.20 | 0.06 | |||
| octanoic | 32.2523 | 40.67 | 40.77 | −0.10 | 1.433 b | 1.428 | 0.005 | 16.12 | 16.14 | −0.02 |
| 2-methylheptanoic | 31.9740 | 40.62 b | 40.41 | 0.21 | 1.430 b | 1.428 | 0.002 | 16.10 b | 16.00 | 0.10 |
| 2,4-dimethylhexanoic | 32.0167 | 40.59 | 40.46 | 0.13 | 1.432 b | 1.428 | 0.004 | 16.07 | 16.02 | 0.05 |
| 3,3-dimethylhexanoic | 31.7721 | 40.61 | 40.14 | 0.47 | ||||||
| 2-ethylhexanoic | 32.2208 | 40.63 | 40.73 | −0.10 | 1.435 | 1.428 | 0.007 | 16.10 | 16.12 | −0.02 |
| 2,3,4-trimethylpentanoic | 31.8740 | 40.53 b | 40.27 | 0.26 | 16.07 b | 15.94 | 0.13 | |||
| 2-propylpentanoic | 32.2047 | 40.63 | 40.71 | −0.08 | 1.435 | 1.428 | 0.007 | 16.10 | 16.12 | −0.02 |
| 2,2,3,3-tetramethylbutanoic | 31.4091 | 40.61 b | 39.65 | 0.96 | 16.10 b | 15.70 | 0.40 | |||
| nonanoic | 35.7164 | 45.30 | 45.39 | −0.09 | 1.439 b | 1.432 | 0.007 | 17.96 | 17.96 | 0.00 |
| 2-methyloctanoic | 35.6236 | 45.25 b | 45.26 | −0.01 | 1.439 | 1.432 | 0.007 | 17.94 b | 17.91 | −0.03 |
| 2,3-dimethylheptanoic | 35.5218 | 45.21 | 45.13 | 0.08 | 1.438 b | 1.432 | 0.006 | |||
| 2-ethylheptanoic | 35.6849 | 45.25 b | 45.34 | −0.09 | 17.94 b | 17.94 | 0.00 | |||
| 2,3,4-trimethylhexanoic | 35.4382 | 45.16 b | 45.02 | 0.14 | 17.90 b | 17.81 | 0.09 | |||
| decanoic | 39.1805 | 49.94 | 49.99 | −0.05 | 1.443 | 1.435 | .0008 | 19.79 | 19.78 | 0.01 |
| 2-methylnonanoic | 39.0877 | 49.88 b | 49.87 | 0.01 | 1.441 | 1.435 | 0.006 | 19.77 b | 19.73 | 0.07 |
| 2,2-dimethyloctanoic | 38.8101 | 49.89 b | 49.50 | 0.39 | 1.442 | 1.435 | 0.007 | |||
| 2-ethyloctanoic | 39.1490 | 49.88 b | 49.96 | −0.08 | 1.441 | 1.435 | 0.006 | 19.77 b | 19.76 | 0.01 |
| 2-propylheptanoic | 39.1329 | 49.88 b | 49.93 | −0.05 | 1.441 | 1.435 | 0.006 | |||
| undecanoic | 42.6446 | 54.57 | 54.61 | −0.04 | 1.445 | 1.439 | 0.006 | 21.63 | 21.60 | 0.03 |
| 2-methyldecanoic | 42.5518 | 54.51 b | 54.48 | 0.03 | 1.444 | 1.439 | 0.005 | 21.61 b | 21.55 | 0.06 |
| 2,2-dimethylnonanoic | 42.2742 | 54.52 b | 54.12 | 0.40 | 1.445 | 1.438 | 0.007 | |||
| 2-ethylnonanoic | 42.6131 | 54.51 b | 54.57 | −0.06 | 1.445 | 1.438 | 0.007 | 21.61 b | 21.58 | 0.03 |
| 2-propyloctanoic | 42.5970 | 54.51 b | 54.54 | −0.03 | 1.444 | 1.439 | 0.005 | 21.61 b | 21.57 | 0.04 |
| dodecanoic | 46.1087 | 59.18 | 59.22 | −0.04 | 23.42 | 23.42 | 0.00 | |||
| tridecanoic | 49.5728 | 63.81 | 63.83 | −0.02 | ||||||
| tetradecanoic | 53.0369 | 68.44 b | 68.44 | 0.00 | 27.13 b | 27.05 | 0.08 | |||
| pentadecanoic | 56.5010 | 73.07 b | 73.05 | 0.02 | 1.468 b | 1.453 | 0.015 | 28.97 b | 28.87 | 0.10 |
| hexadecanoic | 59.9651 | 77.70 b | 77.66 | 0.04 | 30.80 b | 30.69 | 0.11 | |||
| Bond | ||||||||
| wed | 2.5 | 8 | 9 | 8 | 7.5 | 6 | 5 | 4.5 |
| Bond | ||||||||
| wed | 4 | 3.5 | 3 | 2.5 | 2.25 | 2 | 1.75 | 1.5 |
| Acid | ZEP | Rm | |||
|---|---|---|---|---|---|
| Exp. | Pred. | Error | Croos | ||
| Training set | |||||
| Propandioic | 19.5651 | 19.07 | 19.05 | 0.02 | 19.04 |
| Butandioic | 23.0458 | 23.70 | 23.71 | −0.01 | 23.71 |
| Pentandioic | 26.5099 | 28.34 | 28.34 | 0.00 | 28.34 |
| Hexandioic | 29.9740 | 32.97 | 32.97 | 0.00 | 32.97 |
| Heptandioic | 33.4381 | 37.60 | 37.60 | 0.00 | 37.60 |
| Octanedioic | 36.9022 | 42.24 | 42.23 | 0.01 | 42.23 |
| Nonanedioic | 40.3663 | 46.82 | 46.86 | −0.04 | 46.86 |
| Decanedioic | 43.8304 | 51.50 | 51.49 | 0.01 | 51.49 |
| Dodecanedioic | 50.7587 | 60.77 | 60.76 | 0.01 | 60.76 |
| Tetradecanedioic | 57.6868 | 70.03 | 70.02 | 0.01 | 70.02 |
| Test set | |||||
| Undecanedioic | 47.2945 | 56.13 b | 56.12 | 0.01 | |
| Tridecanedioic | 54.2228 | 65.39 b | 65.39 | 0.00 | |
| Pentadecanedioic | 61.1509 | 74.66 b | 74.65 | 0.01 | |
| Acid | ZEP | Rm | |||
|---|---|---|---|---|---|
| Exp. | Pred. | Error | Croos | ||
| Training set | |||||
| trans-2-Pentenoic | 20.9397 | 26.83 | 27.30 | −0.05 | 27.34 |
| 4-Pentenoic | 20.2379 | 26.50 | 25.93 | 0.57 | 25.87 |
| trans-2-Hexenoic | 24.3876 | 31.46 | 31.76 | −0.30 | 31.79 |
| trans-3-Hexenoic | 24.1064 | 31.46 | 31.41 | 0.05 | 31.41 |
| (E)-but-2-enoic | 17.1824 | 22.20 | 22.48 | −0.28 | 22.52 |
| propenoic | 13.3028 | 17.23 | 16.92 | 0.31 | 16.82 |
| 2-Octenoic | 31.0076 | 40.73 | 40.28 | 0.45 | 40.19 |
| 2-Octynoic | 30.8640 | 38.68 | 39.26 | −0.58 | 39.36 |
| 2-Propynoic | 12.5041 | 15.33 | 15.66 | −0.33 | 15.78 |
| 2-Nonynoic | 34.3281 | 43.31 | 43.73 | −0.42 | 43.87 |
| 2-Nonenoic | 34.4717 | 45.36 | 44.75 | 0.61 | 44.52 |
| 3-Butenoic | 16.3394 | 21.87 | 21.44 | 0.43 | 21.37 |
| Test set | |||||
| 2-Methyl-propenoic | 16.8167 | 21.96 b | 21.73 | 0.23 | |
| cis-2-Methyl-2-butenoic | 20.9397 | 27.26 b | 27.04 | 0.22 | |
| trans-2-Heptenoic | 27.5435 | 36.05 b | 35.53 | 0.52 | |
| trans-3-Heptenoic | 27.5544 | 36.05 b | 35.55 | 0.50 | |
| 3-heptynoic | 26.8731 | 34.20 b | 34.67 | −0.47 | |
| Acid | ZEP | Rm | ||
|---|---|---|---|---|
| Exp. | Pred. | Error | ||
| Octadecanoic | 66.8933 | 86.96 | 86.88 Equation (6) | 0.08 |
| 87.15 Equation (9) | −0.19 | |||
| 83.94 Equation (12) | 3.02 | |||
| Hexadecanedioic | 64.6150 | 79.29 | 79.28 Equation (10) | 0.01 |
| 81.07 Equation (12) | −1.78 | |||
| trans-5-octenoic | 31.0453 | 40.4 | 40.04 Equation (11) | 0.36 |
| 38.81 Equation (12) | 1.59 | |||
| (Z)-9-Octandecenoic | 65.6702 | 86.12 | 84.60 Equation (11) | 1.52 |
| 82.40 Equation (12) | 3.72 | |||
| Rm Monocarboxylic Acids | nD Monocarboxylic Acids | P Monocarboxylic Acids | Rm Dicarboxylic Acids | Rm Unsaturated Acids | |||||
|---|---|---|---|---|---|---|---|---|---|
| Iteration | Iteration | Iteration | Iteration | Iteration | Iteration | ||||
| 1 | 0.001 | 1 | 0.065 | 1 | 0.059 | 1 | 0.087 | 1 | 0.143 |
| 2 | 0.061 | 2 | 0.091 | 2 | 0.000 | 2 | 0.052 | 2 | 0.015 |
| 3 | 0.010 | 3 | 0.019 | 3 | 0.111 | 3 | 0.216 | 3 | 0.008 |
| 4 | 0.202 | 4 | 0.097 | 4 | 0.050 | 4 | 0.098 | 4 | 0.023 |
| 5 | 0.035 | 5 | 0.008 | 5 | 0.044 | 5 | 0.146 | 5 | 0.010 |
| 6 | 0.044 | 6 | 0.102 | 6 | 0.058 | 6 | 0.108 | 6 | 0.097 |
| 7 | 0.017 | 7 | 0.046 | 7 | 0.073 | 7 | 0.016 | 7 | 0.057 |
| 8 | 0.004 | 8 | 0.028 | 8 | 0.023 | 8 | 0.024 | 8 | 0.013 |
| 9 | 0.021 | 9 | 0.033 | 9 | 0.083 | 9 | 0.139 | 9 | 0.197 |
| 10 | 0.179 | 10 | 0.001 | 10 | 0.055 | 10 | 0.097 | 10 | 0.013 |
| Acid | ZEP | P | ||
|---|---|---|---|---|
| Exp. | Pred. | Error | ||
| 2-ethybutanoic | 25.3088 | 12.43 | 12.49 Equation (13) | −0.06 |
| 12.53 Equation (14) | −0.10 | |||
| 2,3-dimethylheptanoic | 35.5218 | 17.92 | 17.86 Equation (13) | 0.06 |
| 17.92 Equation (14) | 0.00 | |||
| 2-propilheptanoic | 39.1329 | 19.77 | 19.75 Equation (13) | 0.02 |
| 19.82 Equation (14) | −0.05 | |||
| tridecanoic | 49.5728 | 25.30 | 25.23 Equation (13) | 0.07 |
| 25.32 Equation (14) | −0.02 | |||
Publisher’s Note: MDPI stays neutral with regard to jurisdictional claims in published maps and institutional affiliations. |
© 2021 by the author. Licensee MDPI, Basel, Switzerland. This article is an open access article distributed under the terms and conditions of the Creative Commons Attribution (CC BY) license (https://creativecommons.org/licenses/by/4.0/).
Share and Cite
Berinde, Z.M. QSPR Models for the Molar Refraction, Polarizability and Refractive Index of Aliphatic Carboxylic Acids Using the ZEP Topological Index. Symmetry 2021, 13, 2359. https://doi.org/10.3390/sym13122359
Berinde ZM. QSPR Models for the Molar Refraction, Polarizability and Refractive Index of Aliphatic Carboxylic Acids Using the ZEP Topological Index. Symmetry. 2021; 13(12):2359. https://doi.org/10.3390/sym13122359
Chicago/Turabian StyleBerinde, Zoiţa Mărioara. 2021. "QSPR Models for the Molar Refraction, Polarizability and Refractive Index of Aliphatic Carboxylic Acids Using the ZEP Topological Index" Symmetry 13, no. 12: 2359. https://doi.org/10.3390/sym13122359
APA StyleBerinde, Z. M. (2021). QSPR Models for the Molar Refraction, Polarizability and Refractive Index of Aliphatic Carboxylic Acids Using the ZEP Topological Index. Symmetry, 13(12), 2359. https://doi.org/10.3390/sym13122359