Article

A Proposed Framework for Developing FMEA Method Using Pythagorean Fuzzy CODAS

by
Sara Almeraz-Durán
1,*,
Luis Asunción Pérez-Domínguez
1,*,
David Luviano-Cruz
1,*,
Jesús Israel Hernández Hernández
2,
Roberto Romero López
1 and
Delia J. Valle-Rosales
3
1
Departamento de Ingeniería Industrial y Manufactura, Universidad Autónoma de Ciudad Juárez, Av. Plutarco Elías Calles 1210 Fovissste Chamizal, Ciudad Juárez 32310, Mexico
2
Departamento de Ingeniería Eléctrica y Computación, Universidad Autónoma de Ciudad Juárez (UACJ), Av. Plutarco Elías Calles 1210 Fovissste Chamizal, Ciudad Juárez 32310, Mexico
3
Department of Industrial Engineering, New Mexico State University, Las Cruces, NM 88003, USA
*
Authors to whom correspondence should be addressed.
Symmetry 2021, 13(12), 2236; https://doi.org/10.3390/sym13122236
Submission received: 15 September 2021 / Revised: 4 November 2021 / Accepted: 18 November 2021 / Published: 23 November 2021

Abstract

:
The purpose of this research article is to develop a hybridization between the Failure Mode and Effect Analysis (FMEA) method and the Combinative Distance-Based Assessment (CODAS) method under Pythagorean Fuzzy environment. The traditional FMEA procedure is based on the multiplication between the parameters of severity, occurrence, and detectability where everyone has equal relative importance; therefore, different combinations of these parameters can generate the same result creating uncertainty in the analysis. In this mode, the hybridization proposed in this research deal with relative importance of each parameter; in the fact to have a more suitable combination which consider the level of knowledge of the experts in the assessment. Finally, a numerical case was carried out concerning the public transportation service to validate our proposal; the results show that 31 failure modes and potential risks can be evaluated using user perceptions, a dominant with high level of knowledge about the public transportation service and an apprentice or common user, as team of experts and exploiting the subjectivity of the information in a mathematical model. Also, we compare the results with a variation of the proposed model with the multi-criteria method multi-objective optimization method by relationship analysis (MOORA); it was observed that the convergence of the failure modes depends on the nature of the mathematical model even under the same conditions at the start.

1. Introduction

Failure Mode and Effect Analysis (FMEA) was proposed by the military of the United States of America in 1949 as a standard operational procedure [1,2]. Then, the technique was developmented as a formal methodology in the aerospace industry by NASA in 1963 to improve reliability requirements. The Apollo space mission was his first application where the impacts of the systems and the failures of the equipment, personnel and security systems were evaluated, as well as the maintainability and performance of the system [3,4]. In 1977, the Ford Motor Company adopted FMEA technique within the automotive industry to evaluate the security, reliability and to comply with regulations of the production processes and product design [5]. In addition, FMEA helps to, and to document potential failures of the system before the failure as an appropiate procedure of prevention before reaching the end customer. In the 1980s, FMEA became a military standard of the Department of Defense of the United States of America under the title “procedure for performing a failure mode, effects and criticality analysis”. In the 1990s, Ford, Chrysler, and General Motors developmented the first FMEA manual that was revised by the Automotive Industry Action Group (AIAG) in the following editions (second, third, and fourth edition). Nowadays, a new FMEA handbook was developed by the AIAG and Verband der Automobilindustrie (VDA) and published in June 2019 [2].
In addtion, according to Zavadskas et al. [6] multi-criteria decision-making are considered as complexity tools to symmetry the goals, risks, and constraints regard a problem. Besides, symmetry and asymmetry between fuzzy sets are common notions in decision-making problems [7,8]. In this mode, the symmetry related to the assesment obtained from MCDM method can be modelling [9]. In the same time, according to Liu [10], for the traditional FMEA, the risk associated with identified failure modes can be assessed and prioritized for proactive intervention and corrective actions, especially for the more serious aspects identified to improve reliability and security of a system, product, process, design or services thought the appraisal of the risk parameters of severity (S), occurrence (O), and detection (D) of failure to calculate the risk priority number (RPN) or criticality index [11], where the highest value is the most important risk, and so on. Therefore, we can consider the risk factors as decision criteria, possible causes of failure as decision alternatives, and the priority ranking of failure causes as decision goal as mentioned Liu [10] in his book to evaluate a problem.
Public transportation service: Experience has also shown that the application of the FMEA method is non-exclusive of private industry for automotive or aeronautical companies. This method can also be used to analyze the public policies in the cities with high population density through a mathematical methodology to avoid ambiguities in decision-making [12].
Despite the complex environment about the public transportation service, it can be deployed in failure modes and potential risks to facilitate the problem visualization and propose priority recommendations for the implementation of improvements the quality of service for captive users and attract potential users. Likewise the failure modes and potential risks describe the problems that must be addressed to improve the quality of service for captive users and attract potential users, suchs as the readiness can affect the user’s opinion (cualitative information) about the public transportation service when the route is modified outside the residential area, however, frequency low, the time travel increase and the accesibility is reduced as a consequence [13].
Nowadays, according to Tirachini and Cats [14], hygiene and sanitary protocols have gained importance within buses as a measure to protect people and mitigate the spread of the coronavirus disease (COVID-19) pandemic. One user may consider the bus clean if there is no garbage, however for another user the cleaning should consider strict cleaning and disinfection protocols in every space and seat inside the bus. Furthermore, higher fares are not usually well accepted and users express complaints about the service in opposition to the new prices, in most cases they are mainly linked to the comfort, punctuality and convenience criteria [13,15].
On the other hand, according to literature review, there are three relevant gaps in traditional FMEA method that need to be addressed:
  • It assumes that the relative importance of the severity, occurrence and detection parameters are equal affecting the evaluation of failure modes [4,16].
  • The combination of the risk parameters produces the same value of RPN, as example of 2 , 3 , 4 and 6 , 1 , 4 according to [4,16].
  • It assumes that the level of knowledge is the same because the degree of knowledge of the decision-makers is not specified [16], and
  • The evaluation of the RPN parameters is limited to a quantitative (crisp) information [5].
The motivation of this work is to find a model that is able to take into consideration subjectivity that may exist among the criteria (failure modes) involved in FMEA method, and at the same time handle information related to stimate RPN parameters. In order to tackle the gaps mentioned above, in this study, we propose FMEA and the Combinative Distance-Based Assessment (CODAS) method under Pythagorean Fuzzy environment. The main contributions in this study are presented as following:
  • We develop a hybridization between FMEA method and the Combinative Distance-Based Assessment (CODAS) method under Pythagorean Fuzzy environment.
  • We calculate the vector of weights of the risk parameters with the mathematical model of the Pythagorean Fuzzy CODAS methods.
  • We introduce the linguistic terms based on the Pythagorean fuzzy numbers are the best to evaluate every failure mode for severity, occurence, and detection.
The remainder of this paper is organized as follows. In Section 2 introduces a brief literature review on MCDM based FMEA techniques. The proposed methodology is detailed in Section 3. In Section 4 a numerical case concludes to illustrate its applicability of the proposed methodology. In Section 5 the dicussiones are presented. Finally, Section 6 summarizes our work and provides some directions for future research.

2. A Brief Literature Review on MCDM Based FMEA Techniques

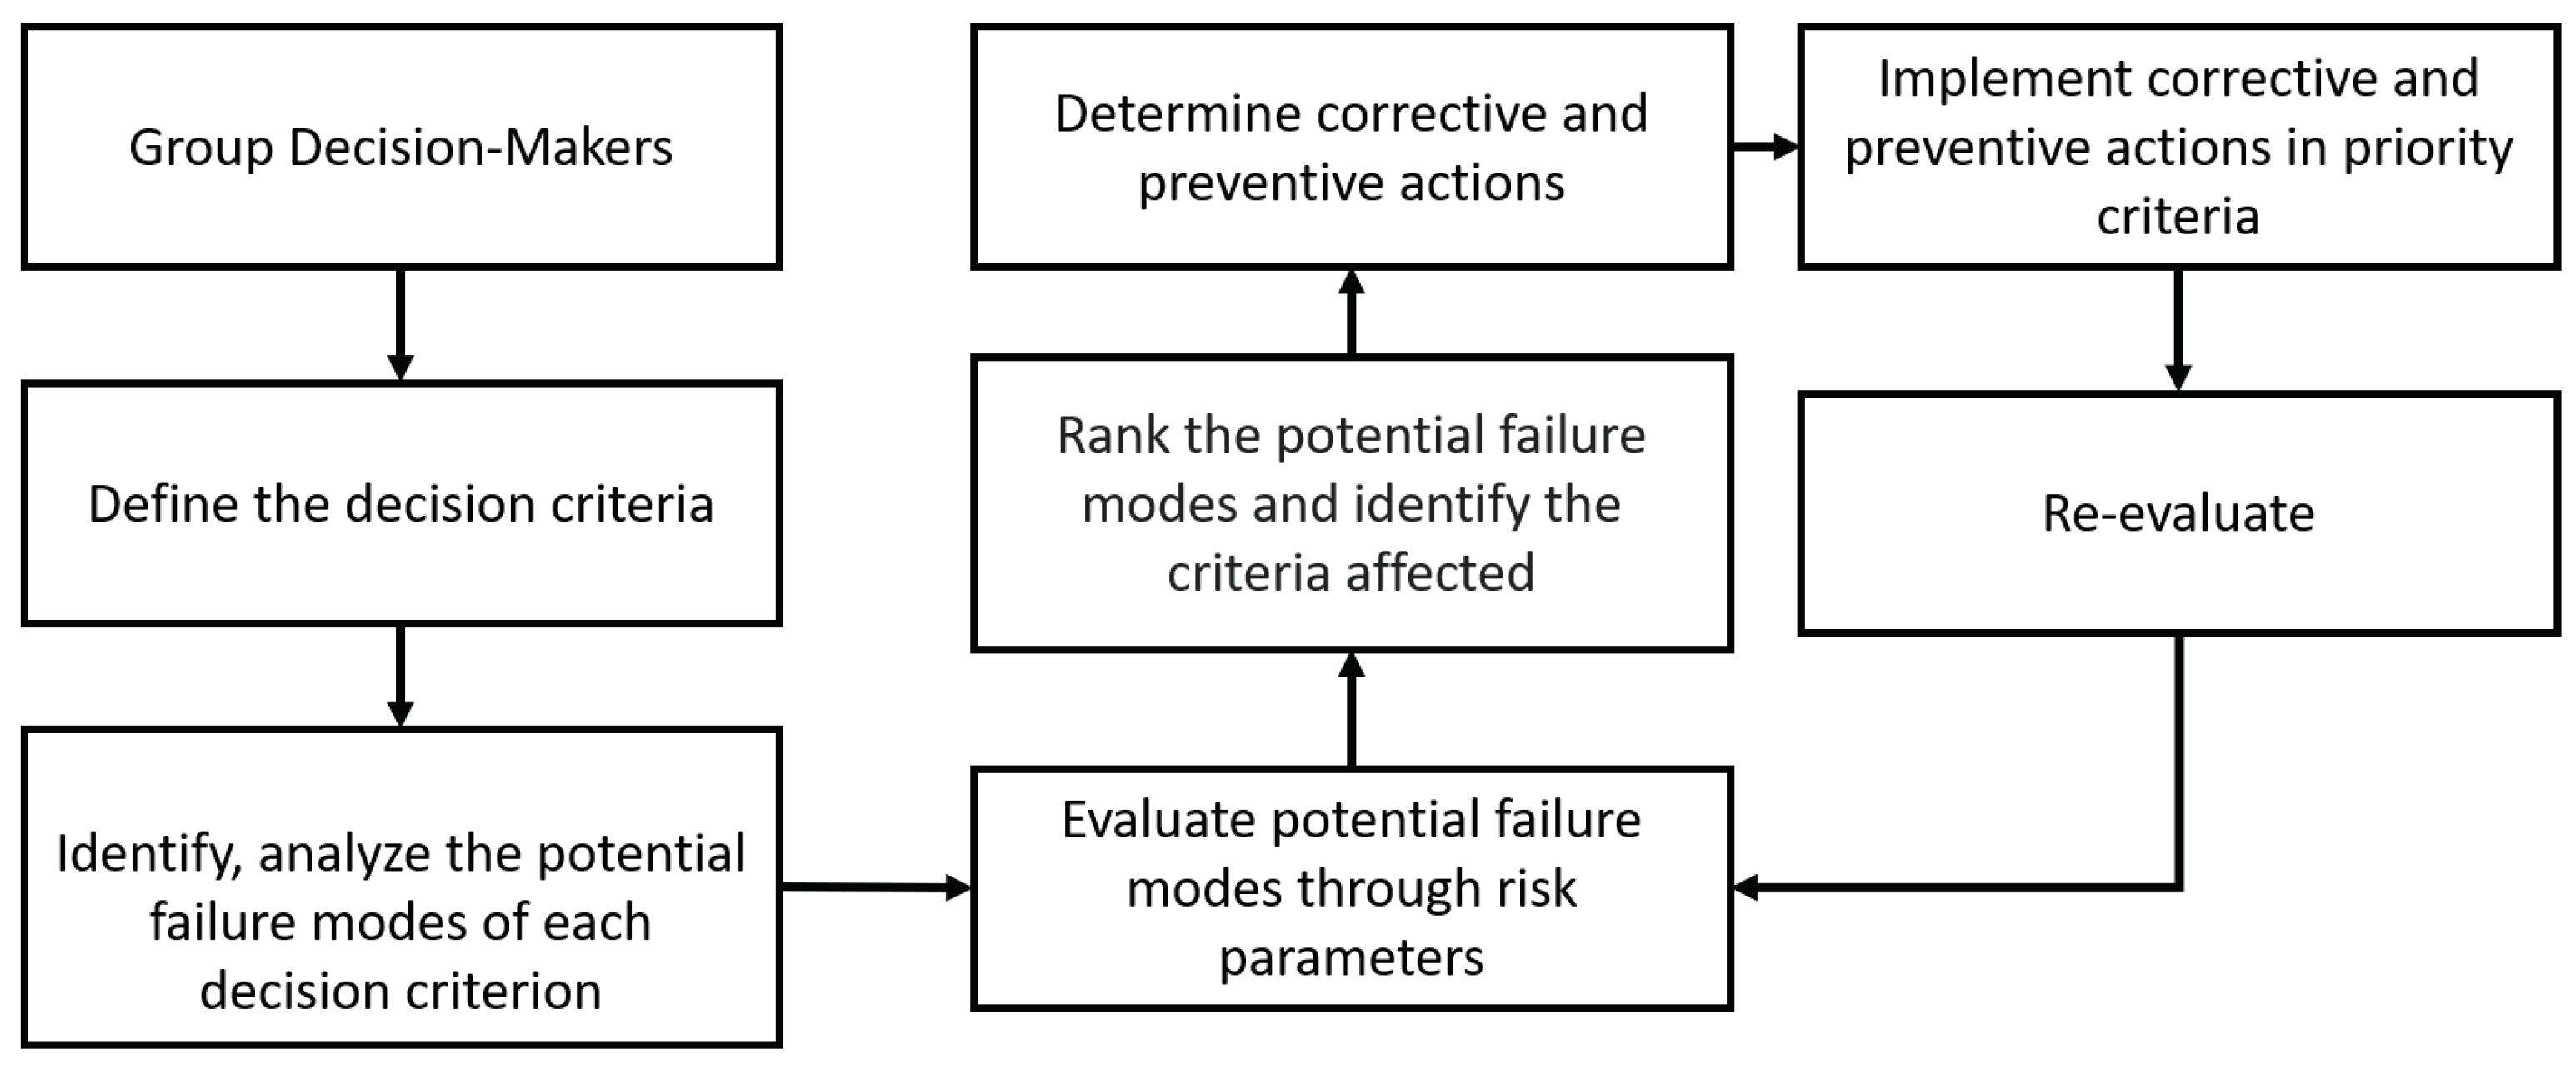
In general, traditional FMEA procedure consists in: (1) define the scope of the analysis, (2) integrate a multidisciplinary team, (3) understand the system to be analyzed, (4) design brainstorms of the failure modes of each item and their effects, (5) determine the scores of the parameters severity, occurrence, and detection for failure modes, (6) calculate the RPN, (7) rank failure modes, (8) prepare the report of FMEA with a resume of the analysis with results, and (9) calculate the RPN revised with the failure modes that were reduced or eliminated [17].
The relative importance of the parameters of severity, occurrence, and detection is considered equal which causes the combination of the parameters can give the same results of the RPN affecting the adequate evaluation of failure modes [4]. This way of calculating the RPN generates uncertainty in the results which can vary and generate error (or omissions) of the failure modes, and therefore implement unnecessary actions. The correct application of the quality tools can affect the results of the project, especially the importance of the degree of knowledge of the team combined with the reliability of the information that will be managed.
In this sense, the traditional FMEA tends to respond positive based on a good team integration that will define, analyze and evaluate the failure modes and their potential effects. The traditional FMEA is basically a technique of prevention of the risks that can make failure in a product, design, service, or process. This technique allows to clarify all the ways in which a potential failure can occur in a real case through the conventional RPN that is a crisp number as the result of the multiplication between the risk parameters of severity (S), occurrence (O), and detection (D). But Liu et al. [18], applied the fuzzy set theory into a FMEA, it means that the evaluation of the risk parameters were evaluated using intuitionistic fuzzy hybrid TOPSIS approach because the fuzzy logic models the uncertain, imprecise, unspecific, and fuzzy situations [3]. Liu et al. [18] calculate the relative importance of the risk parameters when FMEA team give their opinions to aggregated them using the IFWA operator, then the IFW-TOPSIS calculates which fault is closest to the ideal point.
In this regard, it is advisable to adopt decision makers, experts in the areas of interest and the opinion of the client or users specifying the level of knowledge, from each area of the project within the risk analysis and analyze the problem under a Pythagorean fuzzy (PF) environment to manage uncertainty and improve the definition of projects. Also, multi-criteria decision-making (MCDM) can bring certainty for FMEA, and which consider the relative importance of risk factors and prioritize the identified failure modes using mathematical models to reduce the error of the calculation [19].
Albeit, a team of four experts in [5] documented and identified failure modes and effects of reheat valve system in nuclear steam turbine using fuzzy weighted TOPSIS with triangular fuzzy numbers to approach the solution; also, the vector of weights of the risk parameter were calculated with entropy method. Likewise, Liu et al. [16] proposed a novel approach for FMEA using fuzzy AHP in the evaluations of FMEA team to calculate the vector of weights of risk factors, likewise, they applied entropy method for objective weights of risk parameters. Then, they applied fuzzy VIKOR evaluation of each failure mode integrated on the vector of weights. Liu et al. [3] used an extension of VIKOR method under fuzzy environment with trapezoidal fuzzy numbers to capture the vagueness of the information of the general anesthesia process in FMEA of 5 decision makers. Nazam et al. [20] proposed a combination between fuzzy AHP to calculate the criteria weights and fuzzy TOPSIS to assessment the compromised criteria level with subcriteria of a green initiative in supply chain in the textile industry.

3. The Proposed Hybrid Pythagorean Fuzzy FMEA Model

3.1. Fuzzy CODAS Method

COmbinative Distance-based Assessment (CODAS) method developed by Keshavarz-Ghorabaee et al. [21] based in the comparison of the Euclidean distance, but when Euclidean distance are not comparable the Taxicab distance is used as a secondary with an adjustment index, τ , to evaluate the alternatives with the largest distance from the ideal negative point that is the most desirable situation [22]. Additionally, Ghorabaee et al. [23] used CODAS method with linguistic variables and trapezoidal fuzzy numbers to assessment of market segments.
Meanwhile, Badi et al. [24] selected the best place to install a desalination plant in Libya with evaluation on six parametrs as criteria. Panchal et al. [25] incorporated fuzzy AHP to fuzzy CODAS to solve problems of maintenance for industrial process. Later, Boltürk [26] integrated Pythagorean fuzzy sets to the CODAS method to select suppliers in a manufacturing firm. This type of fuzzy numbers are better than the intuitionistic fuzzy numbers to approach a degree of membership. Dahooei et al. [27] introduced the intuitionistic fuzzy logic with interval values to CODAS method to assessment 34 criteria of business intelligence information for enterprise system. Nevertheless, Pamučar et al. [28] proposed Linguistic Neutrosophic sets to evaluate problems with CODAS methology in a case of power station in Lybia that have four criteria and four experts. Peng and Garg [29], developed an algorithm using interval-valued fuzzy soft sets to integrate the CODAS method with Weighted Distance Approximation (WDBA), the problem were compared with MABAC and similarity with good correlation within them. Besides, the IVIF-CODAS method used by Roy et al. [30] to select sustaineble material in construction proyects with incomplete weight data. In addition, Yalcin and Yapıcı Pehlivan [31] presented a case study for personnel choice through linguistic terms of uncertainty (Hesitant Fuzzy Linguistic Term Sets, HFLTS); In an analogous case of application was implemented by [32] to appraise organizational and technological under industry 4.0 environment.
Furthermore, according to Ijadi Maghsoodi et al. [33] reported an application with SWARA and CODAS under classical sets to choose components for a dam construction. Thus, Buyukozkan and Göçer [34] developed a model of decision-making based in CODAS methods under intuitionistc fuzzy to determine and prioritize strategies of SCL (Smart City Logistic). Likewise, Laha and Biswas [35] appraise a bank institution using entropy method to estimate weights of the criteria and CODAS to evaluate the stability and grade of performance. Further, the combination with the Best-Worst Method (BWM) and COmbinative Distance-based ASsessment (CODAS) used by Ijadi Maghsoodi et al. [36] to address a site choice problem. Also, Dahooie et al. [37] developed a case of study with Interval-Valued Intuitionistic Fuzzy CODAS for Multiattribute Decision-Making Method. Also, Zhou et al. [38] presented an aggregation with Pythagorean fuzzy sets and CODAS applied to financial plan of multinational enterprises.

3.2. Basic Concepts of Pythagorean Fuzzy Set

The basic mathematics of Pythagorean Fuzzy Set (PFS) were introduced by Yager [39], as follows:
A Pythagorean Fuzzy Set contain information about the status of the information, the sum of the association and the not association must be equal or less than 1 otherwise to the IFS proposal by Atanassov [40] where the sum of the information are more than 1.
Definition 1.
Let a set X be a universe of discourse. A PFS A is represented as the next form equation: A ˜ = x , A μ A x , ν A x | x ϵ X .
See that μ A x and ν A x X 0 , 1 indicate the degree of membership and non-membership function of the fuzzy set P; μ A x ϵ 0 , 1 depict the membership degree of x ϵ X i n A . For all PFS it is necessary the next condition:
μ A x 2 + ν A x 2 1
Hence, the degree of uncertainty that is called indeterminacy grade or Pythagorean index degree, π A x , of x in A can be calculate in this way:
π A x = 1 μ A x 2 + ν A x 2
where μ A x 2 + ν A x 2 1 is for each x ϵ X .
Definition 2.
Consider two PFNs [38] as A ˜ = x , A μ A x , ν A x | x ϵ X and B ˜ = x , B μ B x , ν A x | x ϵ X the following basic operations are valid:
A ˜ i = μ A i , ν A i
A ˜ B ˜ = 1 1 μ A 2 1 μ B 2 , ν A · ν B
A ˜ B ˜ = μ A · μ B , 1 1 ν A 2 1 ν B 2 ·
ϵ A ˜ = A 1 1 μ A 2 ϵ , ν A ϵ , ϵ 0 a n d ϵ R

3.3. Our Proposed Framework and Modeling

This section describes the method proposed of Fuzzy FMEA integrated with pythagorean Fuzzy CODAS method, following the methodology show in Figure 1.
Step 1. Integrate a team of experts (DMs).
Where D M = D M 1 , D M 2 , …, D M k , …, D M l is a set of Decision Makers, calculate the weight of Decision Makers using the Equation (1):
ϵ k = μ k + π k μ k μ k + π k k = 1 l μ k + π k μ k μ k + π k
where k = 1 l ϵ k = 1 , and the expertise is based on the Linguistic Terms of the Table 1, the first column contains the Linguistic Terms for the Decision Makers.
Step 2. List all criteria of the passenger transportation system, then screening the criteria to have the most relevant for the study.
The criteria of set C j with j = 1, 2, …, n.
Step 3. Determine the importance of risk parameters using the using linguistic terms expressed by Pythagorean fuzzy numbers shown in Table 1, the group of DMs analyze the risk parameters to determine what is the contribution of each one to the analysis. The overall contribution of every Decision Maker design as D M k = μ k , ν k , π k with the corresponding weight for severity, occurrence, and detection is calculate using the concept proposed by Boran et al. [42].
The vector of weights of the risk parameters is calculated with the Equation (2). The Equations (3) and (4) show with detail the integration between the expertise of FMEA Team (vector of weight of DM’s) with risk parameters’ assessment by them. Then, calculate the crisp vector of weights with Equation (5); finally, construct the vector of weights of the risk parameters:
w ˜ j = PFWA = w ˜ j 1 , w ˜ j 2 , , w ˜ j k
w ˜ j = ϵ 1 · w ˜ j 1 ϵ 2 · w ˜ j 2 ϵ k · w ˜ j k
w ˜ j = 1 j = 1 l 1 μ i j 2 ϵ k , j = 1 l ν i j ϵ k
w ˜ j = μ k + π k μ k μ k + π k k = 1 l μ k + π k μ k μ k + π k
where k = 1 l w ˜ j = 1 .
Step 4. Identify and record the potential failure mode for every criteria.
Step 5. Assess of each potential failure mode for severity (S), occurrence (O), and detection (D). The assessment is established using linguistic terms expressed by Pythagorean fuzzy numbers shown in Table 2.
Step 6. Construct the Pythagorean fuzzy decision matrix for potential failure mode assessment.
Step 7. Calculate Aggregated Pythagorean Fuzzy decision Matrix (APFDM). The individual opinion of DMs in linguistic terms are transformed using the linguistic variables of the Table 3, then, all opinions of each DMs are incluided into the APFDM as follows:
x ˜ i j = APFDM x ˜ i j 1 , x ˜ i j 2 , , x ˜ i j k
x ˜ i j = ϵ 1 · x ˜ i j 1 ϵ 2 · x ˜ i j 2 ϵ k · x ˜ i j k
x ˜ i j = 1 j = 1 l 1 μ i j 2 ϵ k , j = 1 l ν i j ϵ k
where x ˜ i j 0 and x ˜ i j = μ A , ν A and 0 μ A x 2 + ν A x 2 1 .
X ˜ = x ˜ i j m x n = x ˜ 11 x ˜ 12 x ˜ 1 n x ˜ 21 x ˜ 22 x ˜ 2 n x ˜ m 1 x ˜ m 2 x ˜ m n
Step 8. Calculate the Pythagorean Fuzzy Normalized Matrix using lineal normalization.
η μ i j = x ˜ i j m a x i x ˜ i j , η ν i j = m i n i x ˜ i j x ˜ i j i f j N b
η μ i j = m i n i x ˜ i j x i j , η ν i j = x ˜ i j m a x i x i j i f j N c
where N b and N c represent the sets of benefit and cost criteria, respectively.
Step 9. Calculate Pythagorean Fuzzy Weighted Normalized Decision Matrix called R ¯ i j with Equations (12) and (13), and construct the matrix with Equation (14).
R ˜ i j = r ˜ i j = w ˜ j x ˜ i j
R ˜ i j = x , 1 μ x i 2 x w j , j = 1 l ν x i x w j x ϵ X
R ˜ i j = r ˜ i j m x n
Step 10. Determine the Pythagorean fuzzy negative ideal solution as given in the following Equations:
n s ˜ = n s ˜ j 1 x m
max i r ¯ μ i j , min i r ¯ ν i j i f j N b
min i r ¯ ν i j , max i r ¯ μ i j i f j N b
Step 11. Calculate Euclidean and Taxicab distances (Equations (18) and (19), respectively) from the negative ideal solution.
E i = j = 1 m u ¯ μ i j n s ¯ μ i j 2 + u ˜ ν i j n s ¯ ν i j 2
T i = j = 1 m u ¯ μ i j n s ¯ μ i j + u ¯ ν i j n s ¯ ν i j
Step 12. Construct the relative assessment matrix based on the Pythagorean fuzzy Euclidean and Taxicab distances as given in the following equations:
R a = h i k n x n
h i k = E i E k + ψ E i E k × T i T k
where k ϵ 1 , 2 , , n and τ denotes a threshold function to recognize the equality of the Euclidean distances and its given by Equation (22)
ψ x = 1 i f x τ 0 i f x < τ
If the difference between Euclidean distances of two potential failure mode is less than, these two potential failure mode are also compared by the Taxicab distance.
Step 13. Calculate the assessment score of each potential failure mode with Equation (23).
H i = k = 1 n h i k
Step 14. Rank the potential failure mode according to the decreasing values of assessment score ( H i ).

4. Numerical Case

Step 1. Integrate a team of experts (DMs). Two decision makers are the FMEA team to evaluate potential failure mode. Two decision makers are considered for evaluation. The set of DMs are shown in Table 3.
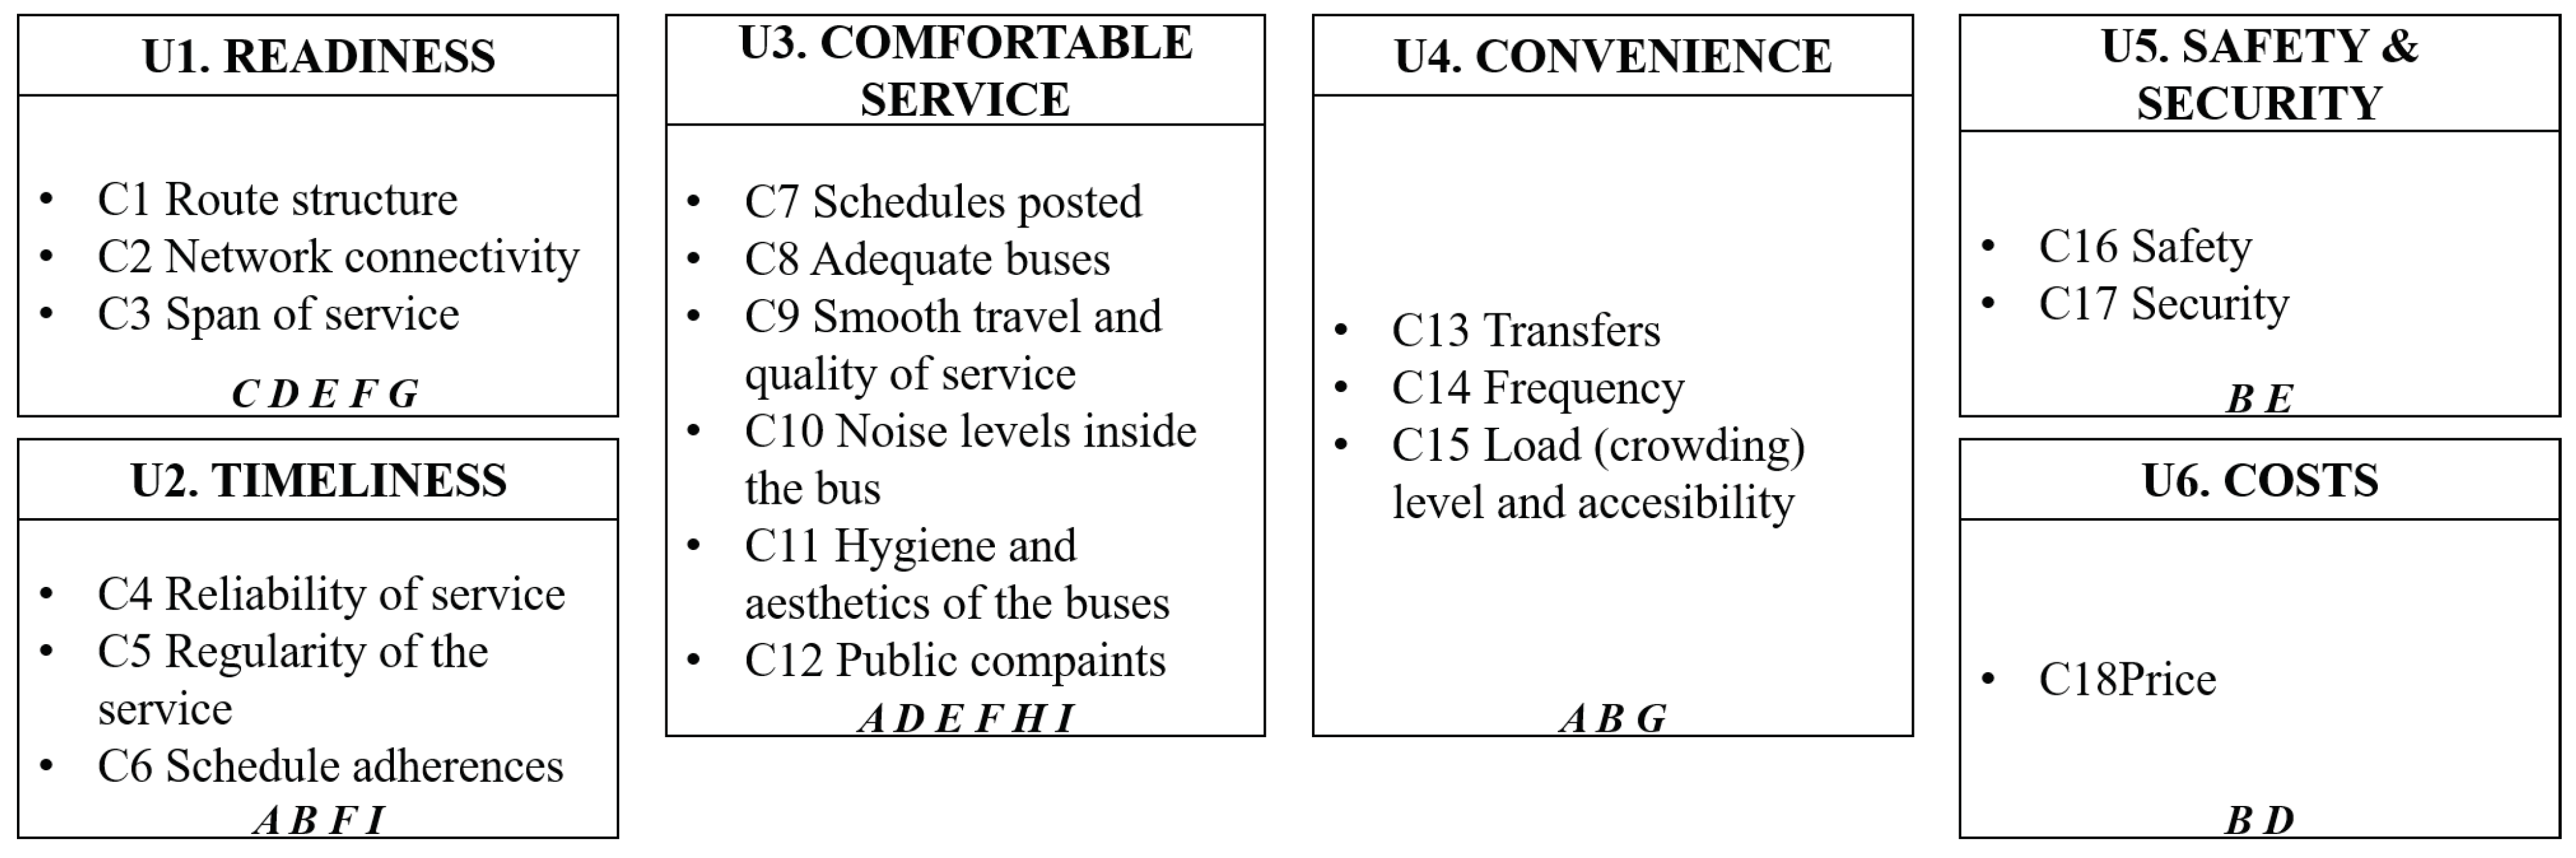
Step 2. List and screening criteria of the passenger transportation system. The criteria is shown in Figure 2. Criteria decision describe the main characteristics of passenger transport systems (public transportation) from the user’s point of view with the perspective of readiness, timeliness, comfortable service, convenience, safety and security, and tariff.
Step 3. Determine the importance of risk parameters. The importance of risk parameters is the best contribution to get better analysis of the public transportation or another application of FMEA method because the traditional FMEA method considered the severity, occurrence, and detection equal. This causes uncertainty about how and where to solve a specific problem. The DM’s evaluated the risk parameters as shown in Table 4. It is also important to consider the contribution in knowledge and experiences of the decision makers in this evaluation as can see in Table 4.
Step 4. Record the potential failure mode for every criteria.
In addition, in Table 5 the failure modes are presented.
Step 5. Assessment of each potential failure mode. Decision Makers evaluates the potential risk modes using the Linguistic Terms of the Table 2, theses terms will later be converted to numerical variables composed of Fuzzy Pythagorean Numbers.
Step 6. Construct the Pythagorean fuzzy decision matrix for potential failure mode assessment as shown in the Table 6. This table is expresed by Linguistic Terms, however, we can convert this terms into PFNs and express them in a matrix to do the calculations.
Step 7. Calculate Aggregated Pythagorean Fuzzy decision Matrix (APFDM). The individual opinion of DMs in linguistic terms are transformed using the linguistic variables to integrate the evaluations of both decision makers in the APFDM that is shown in Table 7.
Step 8. Calculate the Pythagorean Fuzzy Normalized Matrix using lineal normalization using Equations (10) and (11), then construct the Matrix with the result as shown in Table 8.
Step 9. Using Equation (13) calculate the Pythagorean Fuzzy Weighted Normalized Decision Matrix as shown in Table 9. This part integrate the contribution of the risk parameters with the normalization of the potential failure mode evaluated.
Step 10. Calculate with the Equations (16) and (17) the Pythagorean fuzzy negative ideal solution to define the reference of the worst solution. Results are shown in Table 10.
Step 11. Euclidean and Taxicab distances are calculated using Equations (18) and (19), respectively. From step 10, We calculate the distance for each risk parameter: severity (S), occurence (O), detection (D), then sum the calculated of the Euclidean Distance and the Taxicab Distance are shown in Table 11.
Step 12. The Sum of the Euclidean and Taxicab distances (See “Distance Sum” in Table 11) is necessary to construct the relative assessment matrix using the Equation (21) as shown in Table 12, also the threshold parameter ( τ ) is to compare the Euclidean distance as a primary measure, then Taxicab distance is used as a secondary measure.
Step 13. Using the relative assessment matrix, calculate the assessment score of each potential failure mode with the Equation (23). The results are shown in the Table 13.
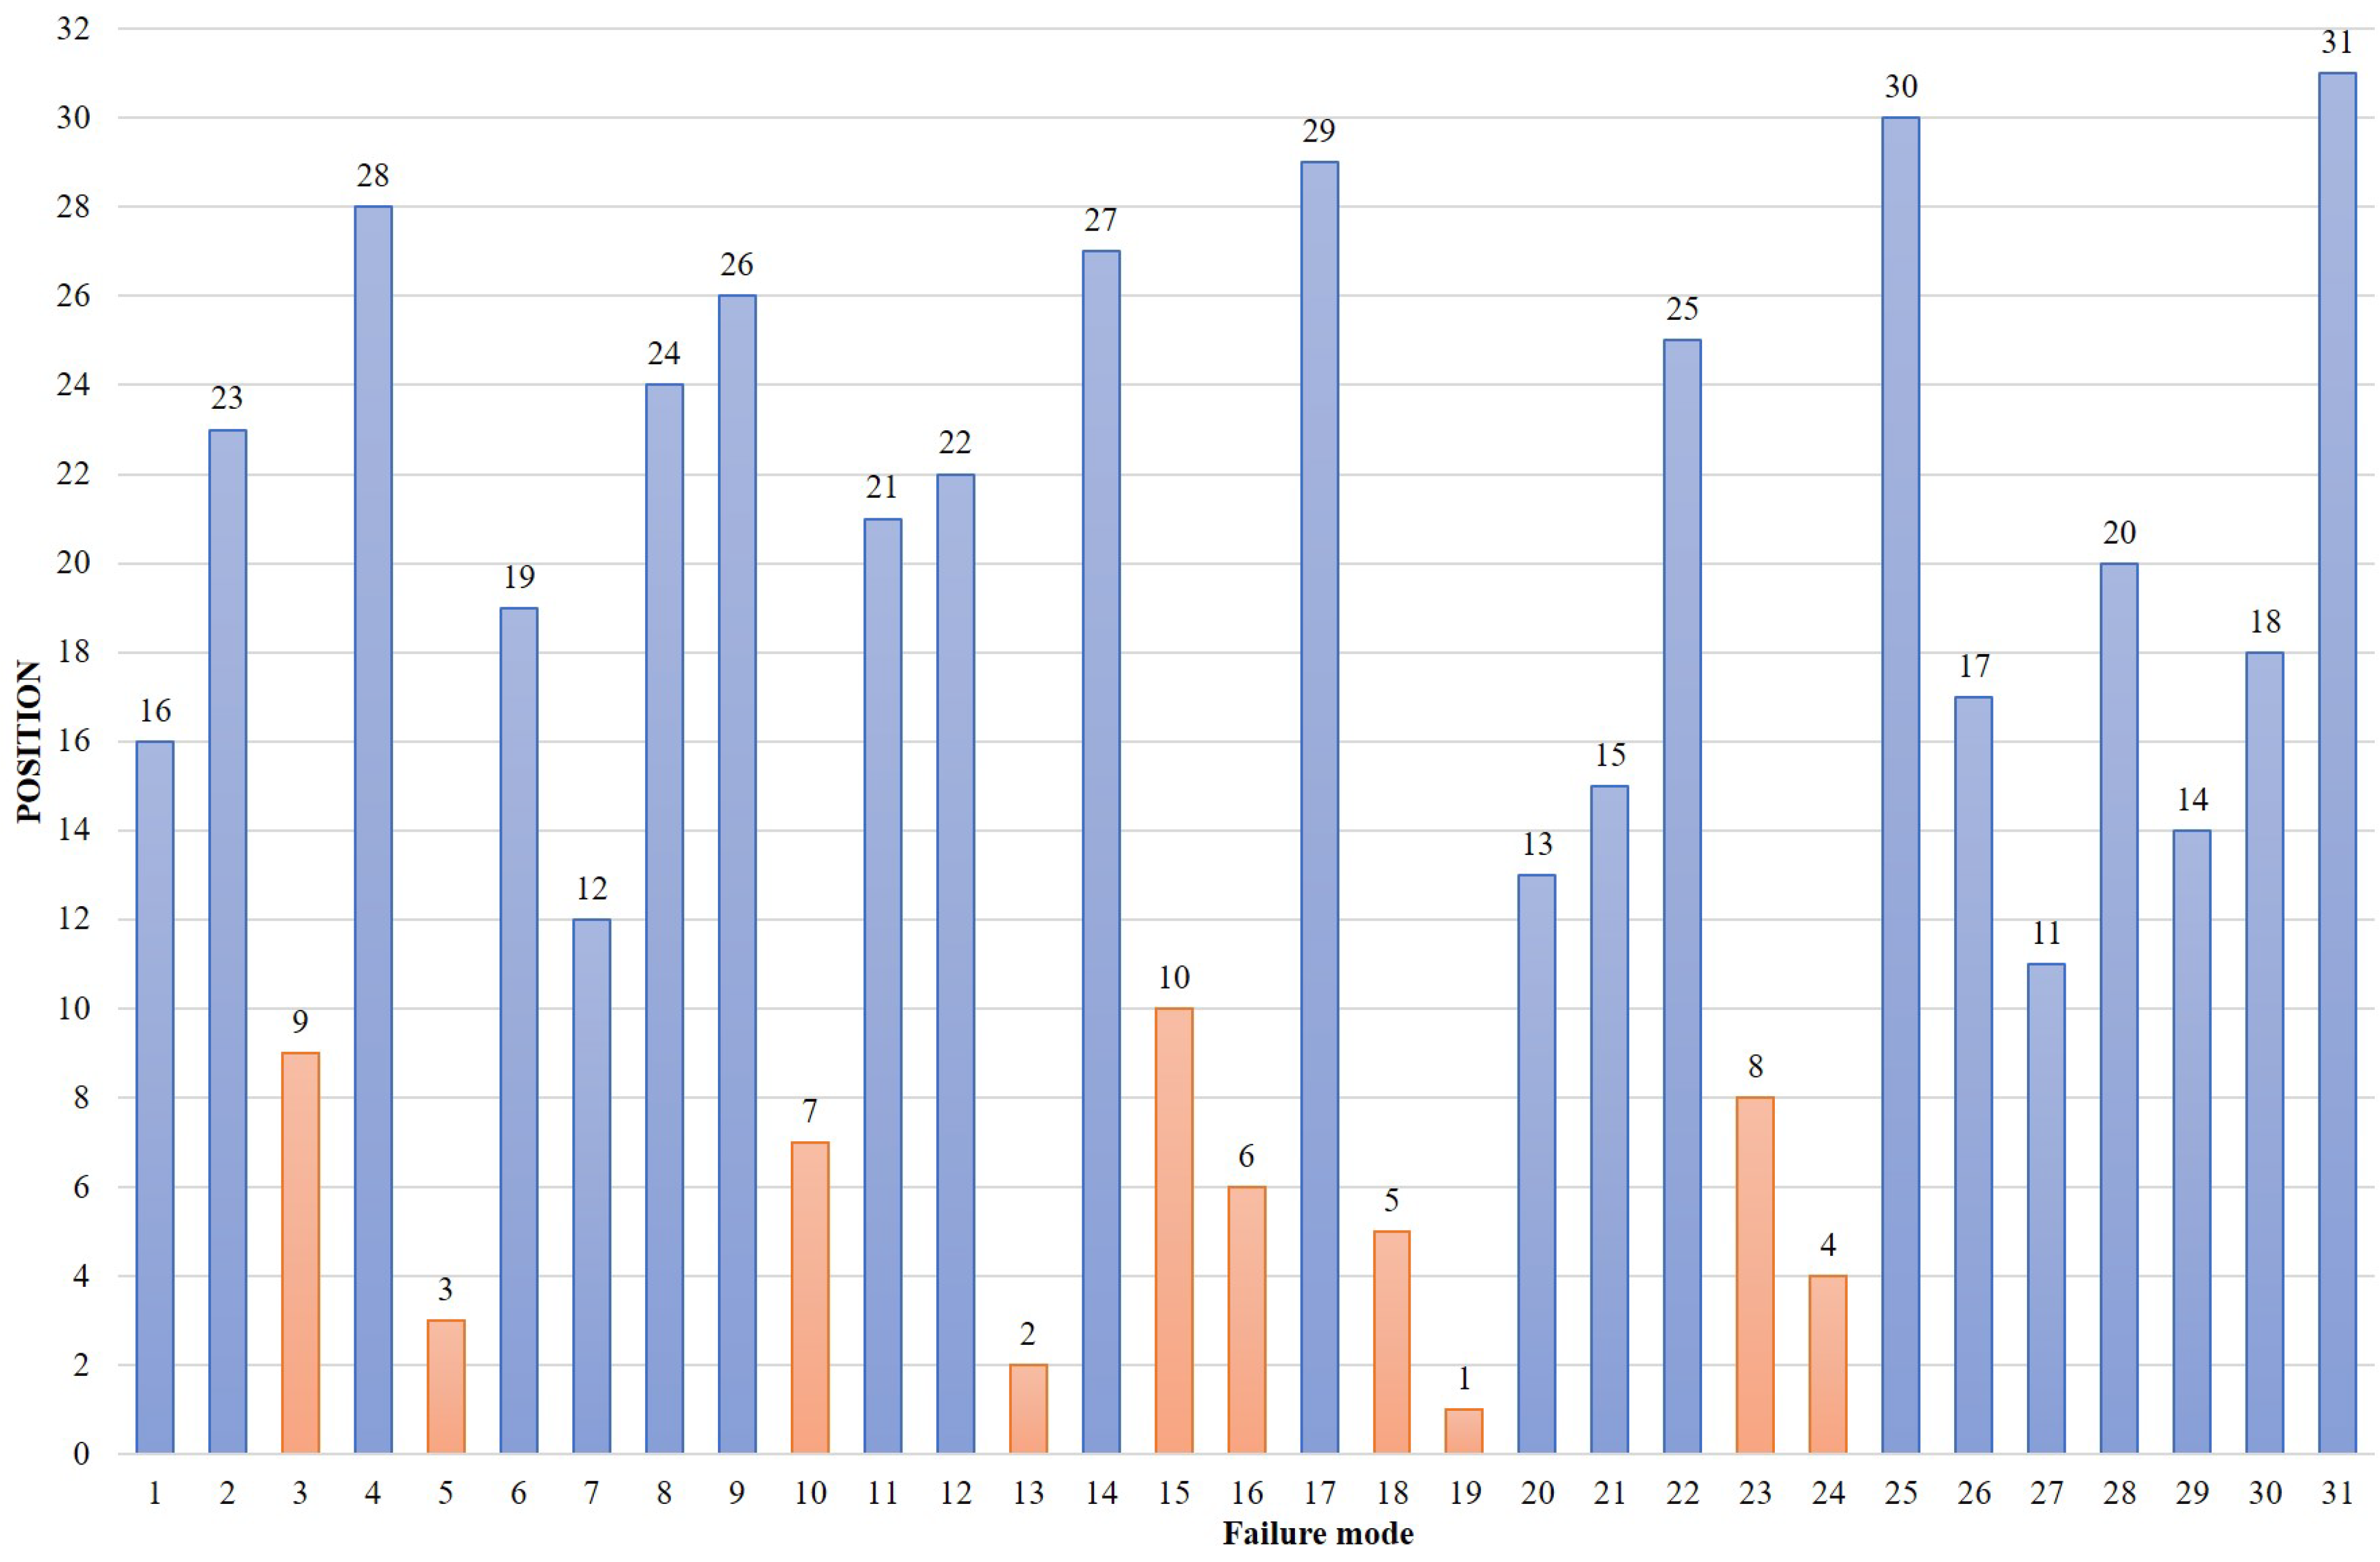
Step 14. Finally, the relative assesment is ordered from highest to lowest, that is, in descending order with the objective of detect priority potential failure modes. In the same way that the results are observed in the Table 13, ranking of potential failure modes can be observed in the following Figure 3.

Comparisons

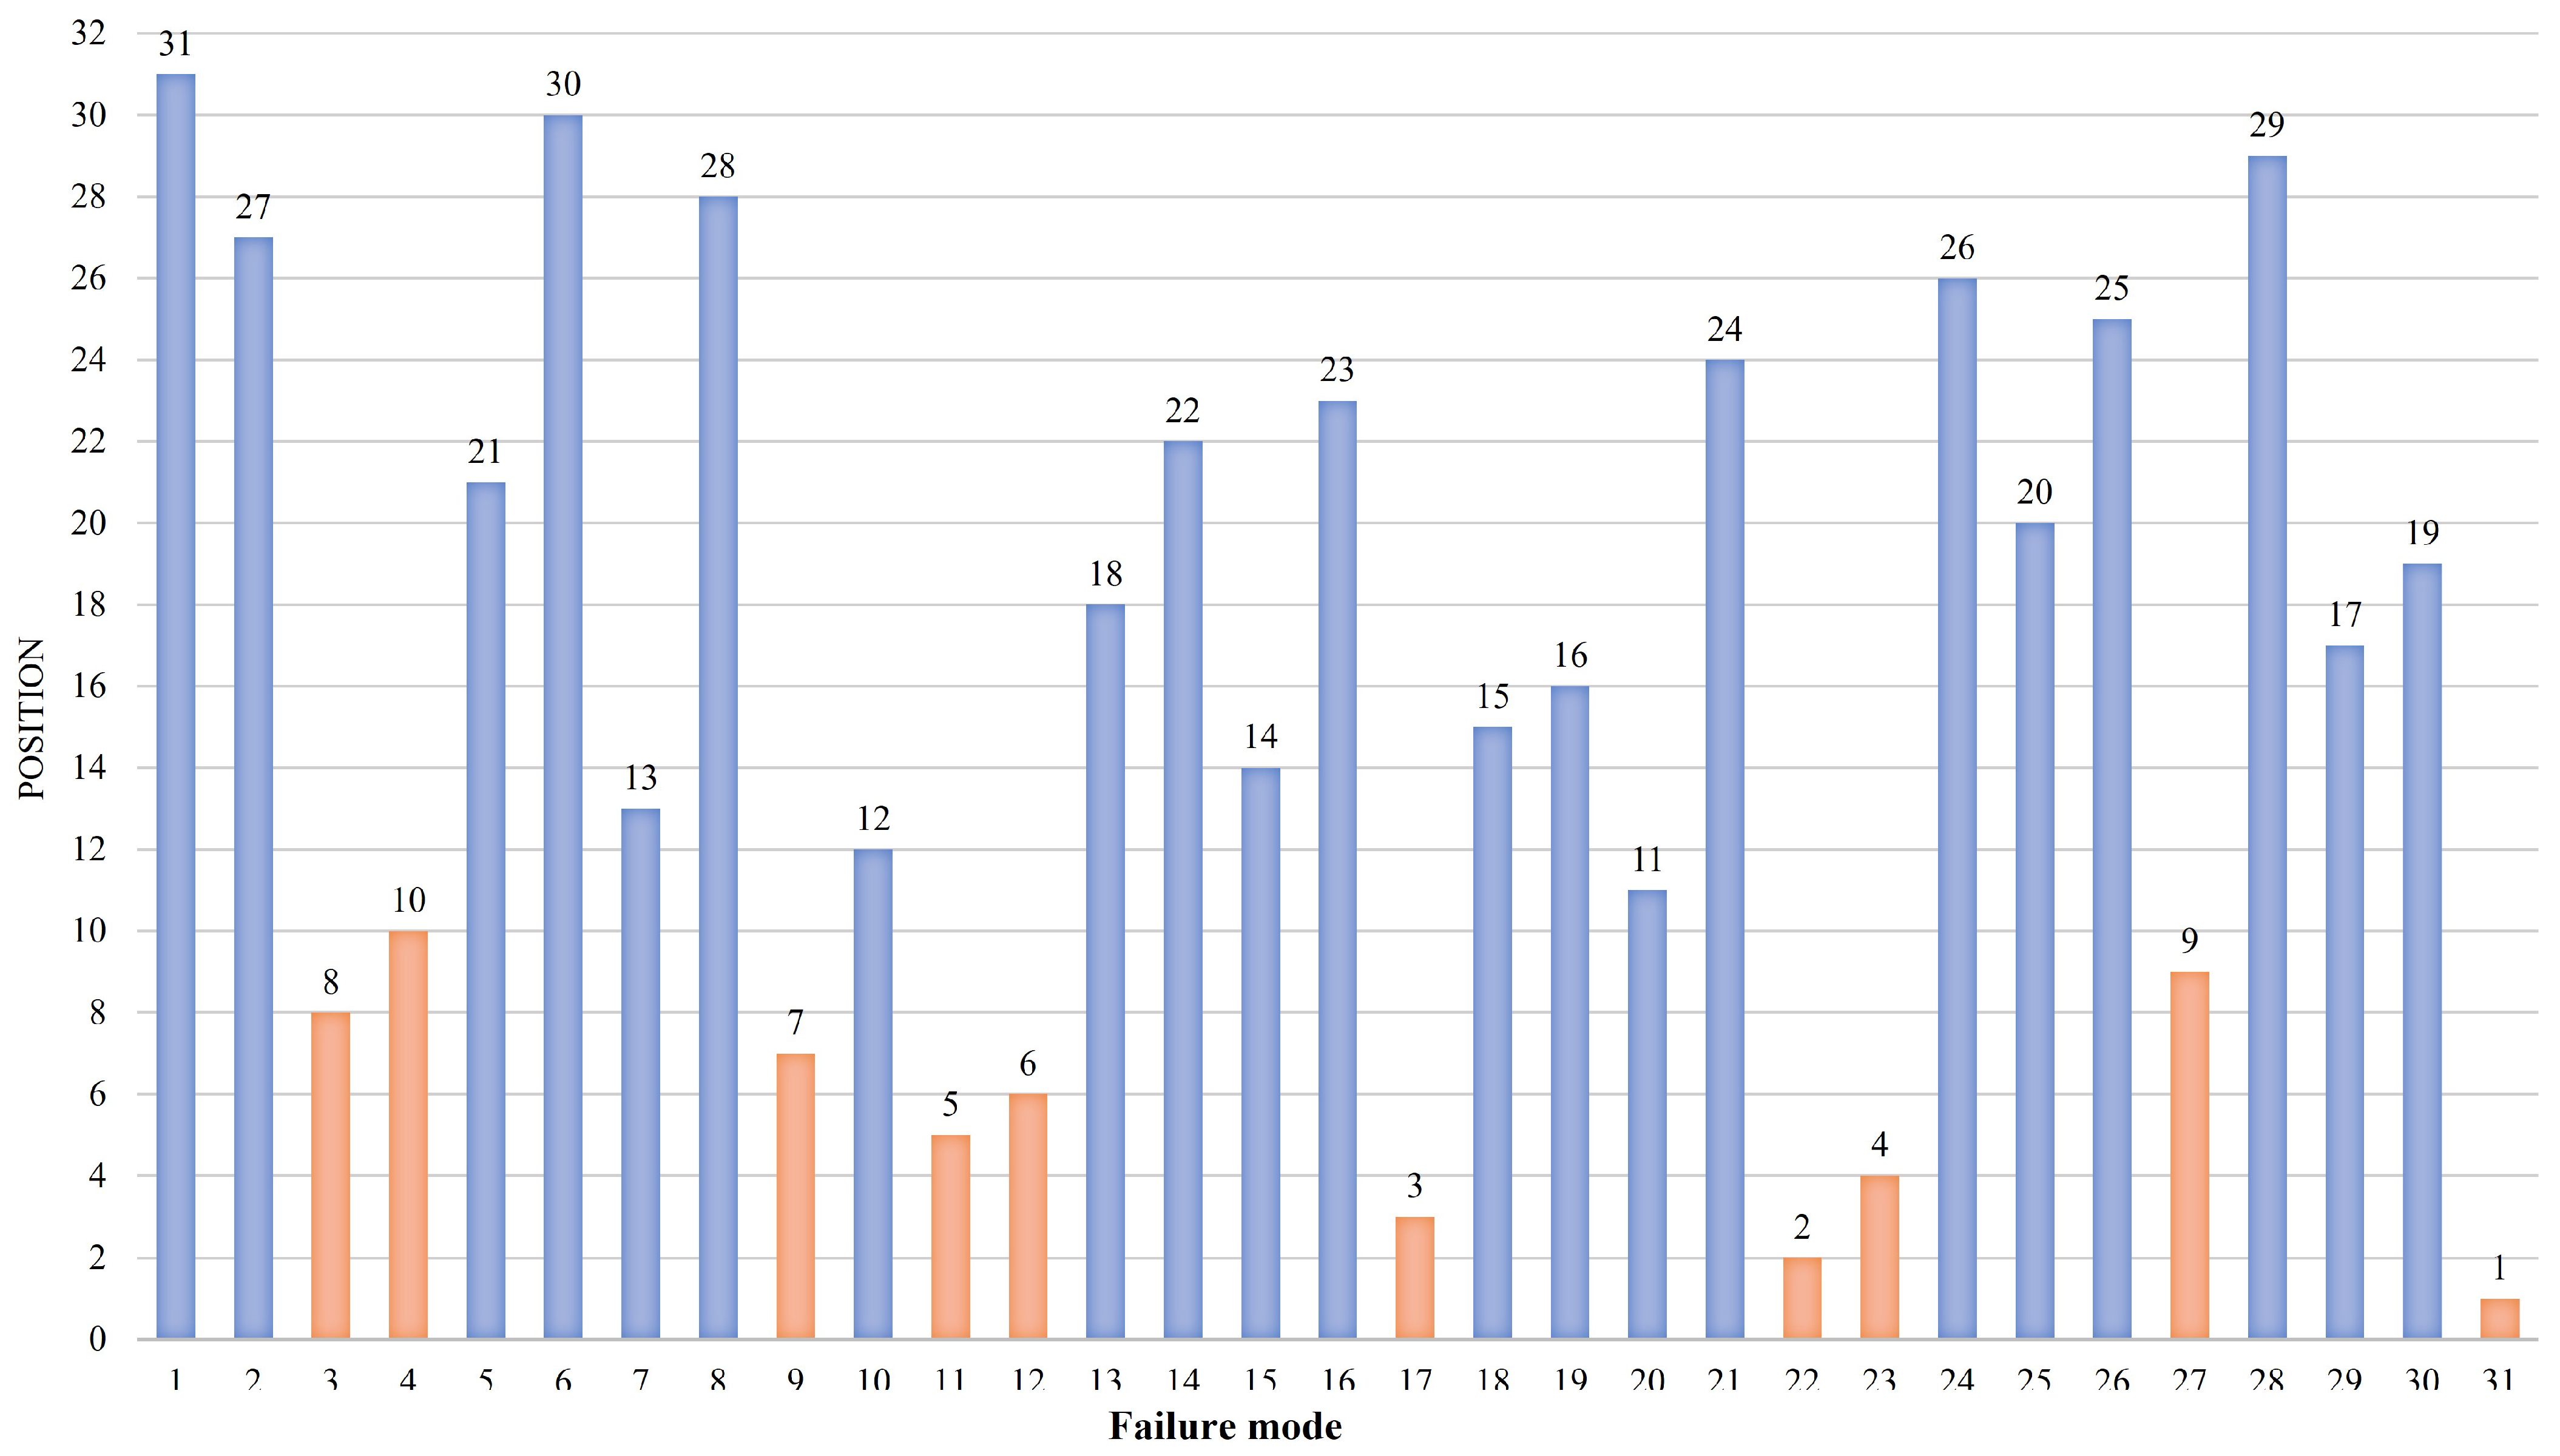
To compare the results versus the proposal, a variation with Multi-Objective Optimization Method by Ratio Analysis (MOORA) presented by Pérez-Domínguez et al. [41] was developmented for the same 31 failure modes under the same conditions and values, only the mathematics’ for convergence the analysis is different, the Table 14 and the Figure 4 shows the results for variation with Pythagorean Fuzzy MOORA.

5. Discussions

It is important to remember that FMEA is, in essence, a tool for the prevention of risks and their effects. Then, the first failure modes are listed:
  • (MF19) Bad driving makes the operation risky for the driver, the user and the general public. The recommendation is to implement defensive bus driving training programs.
  • (MF13) Buses do not comply with international standard (polluting gases). The recommendation is to adopt the most current international standards when designing tenders or bus acquisitions. That the main requirement is to introduce policies of care to the environment.
  • (MF05) ecrease in the required operational fleet is a result of the design of the itineraries. It is recommended to include parameters according to the demand of users measured in the attention of the Origin-Destiny Matrix, also include the fleet with reliable available and the traffic rules allowed locally and within the organization.
  • (MF24) Reduce the number of buses arbitrarily over a significant period of time. This failure mode response to the realiability or maintability of the buses and the schedule program.
  • (MF18) Users in wheelchairs or with reduced mobility cannot access the bus. The bus configuration is not adequate in dimensions this responds to the accesibility criterion in the senses of having characteristics (dimensions) of the adequate buses that permits to the people in wheelchairs into the buses without assistant.
While the variation with PF MOORA is based on the normalization of your data, the results are measured comparando los valores of the Euclidean distance between them, and the proposed method which is based on PF-CODAS, uses the Taxicab distance allowing to measure the response closest to the ideal that is the reason of their differences position in ranking.
The development of the numerical case make allowed to visualize how FMEA was integrated into Pythagorean Fuzzy CODAS method to prioritize failure modes through the calculation of the vector of weights of the risk parameters (severity, occurrence and detection), compared with traditional method where the risk parameters are equal, which generates uncertainty when multiplying the risk parameters to calculate the Risk Priority Number.
Also, the introduction of Pythagorean fuzzy sets helps the multidisciplinary team to express their opinions and assessments due to the introduction of labels or linguistic terms based on natural language.
The results of the method applied help to detect using the ranking, priorities in the failure modes evaluated to improve the performance of the transport service with technical recommendations and to eliminate arbitrariness when making decisions

6. Conclusions

This paper present a novel method that integrate the CODAS method in FMEA under Pythagorean Fuzzy environment in order to reduce the implication which are affected to the analysis when the risk parameters have the same importance, also We can observe that this way of assessment maximize the contributions of the evaluations of each of the people who take part of FMEA team.
A future work should involve screening the criteria using the Pythagorean Fuzzy CODAS method to help the DM’s to determine which criteria will be used to develop potential failure modes. Even the PF-CODAS method helps to screening the potential failure modes that will be evaluated by FMEA.

Author Contributions

Conceptualization, L.A.P.-D. and S.A.-D.; methodology, L.A.P.-D. and S.A.-D.; software, J.I.H.H.; validation, L.A.P.-D., S.A.-D. and D.L.-C.; formal analysis, L.A.P.-D. and S.A.-D.; investigation, L.A.P.-D. and S.A.-D.; resources, J.I.H.H.; data curation, L.A.P.-D., D.J.V.-R. and D.L.-C.; writing—original draft preparation, S.A.-D.; writing—review and editing, L.A.P.-D.; visualization, D.J.V.-R.; supervision, L.A.P.-D. and J.I.H.H.; funding acquisition, R.R.L. All authors have read and agreed to the published version of the manuscript.

Funding

This research was partially supported with resources by the Universidad Autonoma de Ciudad Juárez and the Consejo Nacional de Ciencia y Tecnología (CONACYT).

Institutional Review Board Statement

Not applicable.

Informed Consent Statement

Not applicable.

Acknowledgments

We would like to thank you to Universidad Autónoma de Ciudad Juárez via Industrial Engineering Master Coordination to brign full support in order this project can be prepared and National Council of Science and Technology (CONACYT) gives support under No. CVU: 960812.

Conflicts of Interest

The authors declare no conflict of interest.

Abbreviations

VDAVerband der Automobilindustrie
AIAGAutomotive Industry Action Group
SCLSmart City Logistic
MCDMMulticriteria Decision Methods
HFLTSHesitant Fuzzy Linguistic Term Sets
PFSPythagorean Fuzzy Sets
IFSIntuitionistic Fuzzy Sets
CODASCOmbinative Distance-based Assessment method
FMEAFailure Mode and Effect Analysis
PFPythagorean Fuzzy
COVID-19Coronavirus disease

References

  1. Standard, M. Procedures for Performing a Failure Mode, Effects and Criticality Analysis; Standard No. MIL-STD-1629A; Department of Defense: Washington, DC, USA, 1980.
  2. Belu, N.; Khassawneh, N.; Rahim, A. Implementation of Failure Mode, Effects and Criticality Analysis in the production of automotive parts. Qual. Access Success 2013, 14, 67–71. [Google Scholar]
  3. Liu, H.C.; Liu, L.; Liu, N.; Mao, L.X. Risk evaluation in failure mode and effects analysis with extended VIKOR method under fuzzy environment. Expert Syst. Appl. 2012, 39, 12926–12934. [Google Scholar] [CrossRef]
  4. Kutlu, A.C.; Ekmekçioğlu, M. Fuzzy failure modes and effects analysis by using fuzzy TOPSIS-based fuzzy AHP. Expert Syst. Appl. 2012, 39, 61–67. [Google Scholar] [CrossRef]
  5. Song, W.; Ming, X.; Wu, Z.; Zhu, B. Failure modes and effects analysis using integrated weight-based fuzzy TOPSIS. Int. J. Comput. Integr. Manuf. 2013, 26, 1172–1186. [Google Scholar] [CrossRef]
  6. Zavadskas, E.K.; Antucheviciene, J.; Turskis, Z. Symmetric and Asymmetric Data in Solution Models. Symmetry 2021, 13, 1045. [Google Scholar] [CrossRef]
  7. Ashraf, S. Fuzzy dissimilarity and generalization of Valverde’s theorem on T-indistinguishability relations. Fuzzy Sets Syst. 2015, 275, 144–154. [Google Scholar] [CrossRef]
  8. Gu, X.; Zhu, Q. Fuzzy multi-attribute decision-making method based on eigenvector of fuzzy attribute evaluation space. Decis. Support Syst. 2006, 41, 400–410. [Google Scholar] [CrossRef]
  9. Wu, J.; Chiclana, F. A risk attitudinal ranking method for interval-valued intuitionistic fuzzy numbers based on novel attitudinal expected score and accuracy functions. Appl. Soft Comput. 2014, 22, 272–286. [Google Scholar] [CrossRef] [Green Version]
  10. Liu, H.C. FMEA Using Uncertainty Theories and MCDM Methods; Springer: Singapore, 2016; pp. 13–27. [Google Scholar] [CrossRef]
  11. Mora, L.A. Mantenimiento—Planeación, Ejecución y Control; Grupo, A., Ed.; Alfaomega Grupo Editor: Benito Juárez, Mexico, 2009. [Google Scholar]
  12. Pérez-Dominguez, L.; Durán, S.N.A.; López, R.R.; Pérez-Olguin, I.J.C.; Luviano-Cruz, D.; Gómez, J.A.H. Assessment Urban Transport Service and Pythagorean Fuzzy Sets CODAS Method: A Case of Study of Ciudad Juárez. Sustainability 2021, 13, 1281. [Google Scholar] [CrossRef]
  13. Jamalul Shamsudin, N.; Abdul Khanan, M.; Umar, H.; Atan, S.; Din, A. Integrating network concepto into multi-criteria analysis for suggesting Bus Rapid Transit routes. Int. Arch. Photogramm. Remote. Sens. Spat. Inf. Sci. 2019, XLII-4/W16, 309–317. [Google Scholar] [CrossRef] [Green Version]
  14. Tirachini, A.; Cats, O. COVID-19 and public transportation: Current assessment, prospects, and research needs. J. Public Transp. 2020, 22, 1. [Google Scholar] [CrossRef]
  15. Keyvan Ekbatani, M.; Cats, O. Multi-criteria appraisal of multi-modal urban public transport systems. In Proceedings of the Transportation Research Procedia, 10, 2015; 18th Euro Working Group on Transportation, EWGT 2015, Delft, The Netherlands, 14–16 July 2015; Elsevier: Delft, The Netherlands, 2015; pp. 1–11. [Google Scholar]
  16. Liu, H.C.; You, J.X.; You, X.Y.; Shan, M.M. A novel approach for failure mode and effects analysis using combination weighting and fuzzy VIKOR method. Appl. Soft Comput. 2015, 28, 579–588. [Google Scholar] [CrossRef]
  17. General Motors Corp. Potential Failure Mode and Effects Analysis FMEA Reference Manual (4TH EDITION); AIAG: Southfield, MI, USA, 2008. [Google Scholar]
  18. Liu, H.C.; You, J.; Shan, M.M.; Shao, L.N. Failure mode and effects analysis using intuitionistic fuzzy hybrid TOPSIS approach. Soft Comput. 2014, 19, 1085–1098. [Google Scholar] [CrossRef]
  19. Liu, H.C.; Chen, X.Q.; Duan, C.Y.; Wang, Y.M. Failure mode and effect analysis using multi-criteria decision making methods: A systematic literature review. Comput. Ind. Eng. 2019, 135, 881–897. [Google Scholar] [CrossRef]
  20. Nazam, M.; Xu, J.; Tao, Z.; Ahmad, J.; Hashim, M. A fuzzy AHP-TOPSIS framework for the risk assessment of green supply chain implementation in the textile industry. Int. J. Supply Oper. Manag. 2015, 2, 548–568. [Google Scholar]
  21. Keshavarz-Ghorabaee, M.; Zavadskas, E.K.; Turskis, Z.; Antucheviciene, J. A new combinative distance-based assessment (CODAS) method for multi-criteria decision-making. Econ. Comput. Econ. Cybern. Stud. Res. Acad. Econ. Stud. 2016, 50, 25–44. [Google Scholar]
  22. Badi, I.; Abdulshahed, A. A case study of sypplier selection for a steelmaking company in Libya by using the combinative distance-based assessment (CODAS) model. Decis. Making Appl. Manag. Eng. 2018, 1, 1–12. [Google Scholar] [CrossRef]
  23. Ghorabaee, M.K.; Amiri, M.; Zavadskas, E.K.; Hooshmand, R.; Antuchevičienė, J. Fuzzy extension of the CODAS method for multi-criteria market segment evaluation. J. Bus. Econ. Manag. 2017, 18, 1–19. [Google Scholar] [CrossRef] [Green Version]
  24. Badi, I.; Ballem, M.; Shetwan, A. Site selection of desalination plant in Libya by using Combinative Distance-Based Assessment (CODAS) method. Int. J. Qual. Res. 2018, 12, 609–624. [Google Scholar] [CrossRef]
  25. Panchal, D.; Chatterjee, P.; Shukla, R.; Choudhury, T.; Tamosaitiene, J. Integrated fuzzy AHP-CODAS framework for maintenance decision in urea fertilizer industry. Econ. Comput. Econ. Cybern. Stud. Res. 2017, 51, 179–196. [Google Scholar]
  26. Boltürk, E. Pythagorean fuzzy CODAS and its application to supplier selection in a manufacturing firm. J. Enterp. Inf. Manag. 2018, 31, 550–564. [Google Scholar] [CrossRef]
  27. Dahooei, J.H.; Zavadskas, E.K.; Vanaki, A.S.; Firoozfar, H.R.; Keshavarz-Ghorabaee, M. An evaluation model of business intelligence for enterprise systems with new extension of CODAS (CODAS-IVIF). E+M. Ekon. Manag. Econ. Manag. 2018, 21, 171–187. [Google Scholar]
  28. Pamučar, D.; Badi, I.; Sanja, K.; Obradović, R. A Novel Approach for the Selection of Power-Generation Technology Using a Linguistic Neutrosophic CODAS Method: A Case Study in Libya. Energies 2018, 11, 2489. [Google Scholar] [CrossRef] [Green Version]
  29. Peng, X.; Garg, H. Algorithms for interval-valued fuzzy soft sets in emergency decision making based on WDBA and CODAS with new information measure. Comput. Ind. Eng. 2018, 119, 439–452. [Google Scholar] [CrossRef] [PubMed]
  30. Roy, J.; Das, S.; Kar, S.; Pamučar, D. An extension of the CODAS approach using interval-valued intuitionistic fuzzy set for sustainable material selection in construction projects with incomplete weight information. Symmetry 2019, 11, 393. [Google Scholar] [CrossRef] [Green Version]
  31. Yalcin, N.; Yapıcı Pehlivan, N. Application of the Fuzzy CODAS Method Based on Fuzzy Envelopes for Hesitant Fuzzy Linguistic Term Sets: A Case Study on a Personnel Selection Problem. Symmetry 2019, 11, 493. [Google Scholar] [CrossRef] [Green Version]
  32. Sansabas-Villalpando, V.; Pérez-Olguín, I.J.C.; Pérez-Domínguez, L.A.; Rodríguez-Picón, L.A.; Mendez-González, L.C. CODAS HFLTS Method to Appraise Organizational Culture of Innovation and Complex Technological Changes Environments. Sustainability 2019, 11, 7045. [Google Scholar] [CrossRef] [Green Version]
  33. Ijadi Maghsoodi, A.; Maghsoodi, A.; Poursoltan, P.; Antucheviciene, J.; Turskis, Z. Dam construction material selection by implementing the integrated SWARA-CODAS approach with target-based attributes. Arch. Civ. Mech. Eng. 2019, 19, 1194–1210. [Google Scholar] [CrossRef]
  34. Buyukozkan, G.; Göçer, F. Prioritizing the Strategies to Enhance Smart City Logistics by Intuitionistic Fuzzy CODAS. In Proceedings of the 2019 Conference of the International Fuzzy Systems Association and the European Society for Fuzzy Logic and Technology (EUSFLAT 2019), Prague, Czech Republic, 9–13 September 2019; Atlantis Press: Prague, Czech Republic, 2019; pp. 805–811. [Google Scholar]
  35. Laha, S.; Biswas, S. A hybrid unsupervised learning and multi-criteria decision making approach for performance evaluation of Indian banks. Accounting 2019, 5, 169–184. [Google Scholar] [CrossRef]
  36. Ijadi Maghsoodi, A.; Rasoulipanah, H.; Martínez López, L.; Liao, H.; Zavadskas, E.K. Integrating interval-valued multi-granular 2-tuple linguistic BWM-CODAS approach with target-based attributes: Site selection for a construction project. Comput. Ind. Eng. 2020, 139, 106147. [Google Scholar] [CrossRef]
  37. Dahooie, J.H.; Vanaki, A.S.; Mohammadi, N. Choosing the Appropriate System for Cloud Computing Implementation by Using the Interval-Valued Intuitionistic Fuzzy CODAS Multiattribute Decision-Making Method (Case Study: Faculty of New Sciences and Technologies of Tehran University). IEEE Trans. Eng. Manag. 2019, 67, 1–14. [Google Scholar] [CrossRef]
  38. Zhou, J.; Li, K.W.; Baležentis, T.; Streimikiene, D. Pythagorean fuzzy combinative distance-based assessment with pure linguistic information and its application to financial strategies of multi-national companies. Econ. Res.-Ekon. IstražIvanja 2020, 33, 974–998. [Google Scholar] [CrossRef]
  39. Yager, R.R. Pythagorean Membership Grades in Multicriteria Decision Making. IEEE Trans. Fuzzy Syst. 2014, 22, 958–965. [Google Scholar] [CrossRef]
  40. Atanassov, K.T. Intuitionistic fuzzy sets. Fuzzy Sets Syst. 1986, 20, 87–96. [Google Scholar] [CrossRef]
  41. Pérez-Domínguez, L.; Rodríguez-Picón, L.; Alvarado-Iniesta, A.; Luviano Cruz, D.; Xu, Z. MOORA under Pythagorean Fuzzy Set for Multiple Criteria Decision Making. Complexity 2018, 2018, 1–10. [Google Scholar] [CrossRef]
  42. Boran, F.E.; Genç, S.; Kurt, M.; Akay, D. A multi-criteria intuitionistic fuzzy group decision making for supplier selection with TOPSIS method. Expert Syst. Appl. 2009, 36, 11363–11368. [Google Scholar] [CrossRef]
  43. Peña, F.J.; Jiménez-Martín, A.; Mateos, A. Optimising TransMilenio BRT system operation: A mathematical model. Int. J. Oper. Res. 2016, 25, 416–436. [Google Scholar] [CrossRef]
  44. Kiciński, M.; Solecka, K. Application of MCDA/MCDM methods for an integrated urban public transportation system–case study, city of Cracow. Arch. Transp. 2018, 46, 71–84. [Google Scholar] [CrossRef]
  45. Ghaderi, F.; Pahlavani, P. A new multimodal multi-criteria route planning model by integrating a fuzzy-AHP weighting method and a simulated annealing algoritm. Int. Arch. Photogramm. Remote. Sens. Spat. Inf. Sci. 2015, 40, 203–209. [Google Scholar] [CrossRef] [Green Version]
  46. Lamus Cardona, J.D.; Lenis Ibarguen, S.A. Evaluación Multicriterio de la Accesibilidad de un Sistema de Buses de Tránsito Rápido BRT: Caso Masivo Integrado de Occidente MIO. Bachelor’s Thesis, Universidad del Valle, Palmira, Colombia, 2016. [Google Scholar]
  47. Duleba, S.; Mishina, T.; Shimazaki, Y. A dynamic analysis on public bus transport’s supply quality by using AHP. Transport 2012, 27, 268–275. [Google Scholar] [CrossRef]
  48. Mogaji, E. Impact of COVID-19 on transportation in Lagos, Nigeria. Transp. Res. Interdiscip. Perspect. 2020, 6, 100154. [Google Scholar] [CrossRef] [PubMed]
Figure 1. PF-FMEA methodology.
Symmetry 13 02236 g001
Figure 2. Passenger transportation system’s criteria. Source: A [43]; B [44]; C [13]; D [45]; E [46]; F [15]; G [47]; H [14]; I [48].
Symmetry 13 02236 g002
Figure 3. Ranking of potential failure modes with the proposal develomented.
Symmetry 13 02236 g003
Figure 4. Ranking of potential failure modes with MOORA aproach.
Symmetry 13 02236 g004
Table 1. Pythagorean Fuzzy Numbers for DMs and risk parameter assessment. Source: Pérez-Domínguez et al. [41].
DMs TermRisk Parameter Term μ ν
Apprentice (Ap)Very Unimportant (VU)0.100.90
Learner (Lr)Unimportant (U)0.350.60
Capable (Cp)Medium (M)0.500.45
Skillfull (S)Important (I)0.750.40
Dominant (D)Very Important (VI)0.900.10
Table 2. PFNs to evaluate the potential failure mode for the risk parameters. Source: adapted from Pérez-Domínguez et al. [41].
SeverityOccurrenceDetection μ ν
Absolutely severe (ASEV)Absolutely high (AH)Absolutely low (AL)0.100.99
Very severe (VSEV)Very high (VH)Very low (VL)0.100.97
Severe (SEV)High (H)Low (L)0.250.92
Fair (F)Fair (F)Fair (F)0.400.87
Fairly slight (FS)Fairly low (FL)Fairly high (FH)0.500.80
Slight (S)Low (L)High (H)0.600.71
Very Slight (VS)Very low (VL)Very high (VH)0.700.60
Extremely slight (ES)Extremely low (EL)Extremely high (EH)0.800.44
Absolutely slight (AS)Absolutely low (AL)Absolutely high (AH)0.990.01
Table 3. Decision Makers expertise.
DMKnowledgeWeight
1Dominant0.900
2Apprentice0.100
Table 4. Vector of weights.
Risk ParameterDM1DM2Vector of Weights
SeverityVIVI0.3506
OccurrenceII0.2991
DetectionVII0.3502
Table 5. Failure modes.
#CCriteria#FMFailure Mode
C1Route structure1Absence of transportation service
C2Network connectivy2Absence of transfers between routes of transportation
3Transportation service limited in main avenues and streets
C3Span of service4Drivers start late and finish service early
C4Reliability of service5Decrease in the required operational fleet
6Absence of GPS in buses
7Lack of knowledfe of the proper operation about the control center
C5Regularity of the service8Lack of a reliable system in the control center
C6Schedule adherences9Bad programming of the itineraries and schedules
C7Schedule posted10There is no visual information (updated) about itineraries at shelters/bus stations
11There is no visual information about route offered on buses
12There is no information about itineraries in web pages or social networks
C8Adequate buses13Buses do not comply with international standard (polluting gases)
14Lack of preventive maintenance of buses: reliable ecological
15Use of unsuitable oils and additives
16Acquire buses without considering accesibility of users in wheelchairs. Accessibility of buses:space to place a wheelchair.
17Non-ergonomic seats in buses
18Users in wheelchairs or with reduced mobility cannot access the bus. The bus configuration is not adequate in dimensions
C9Smooth travel and quality service19Bad driving, and without control of the safe operation of the bus
C10Noise levels inside the bus20Installation of unauthorized audio devices and speakers
C11Hygiene and easthetics of the buses21Waste accumulation on the edge and rear of the bus, as well as in stations
C12Public compaints22There is no a number to call for public complaints
C13Transfers23There is no connectivity in the structure of the transport network
C14Frequency24Reduce the number of buses arbitrarily over a significant period of time
25Increase the number of busesarbitrarily over a significant period of time
C15Load (crowding) level, including accesibility26Absence of ramps and enoughspace for users (average capacity)
28Driving withouth special capacitation to operate public transportation buses
C17Security29Absence of ilumination in bus stations/shelters
30Absence of security cameras on buses
C18Fare/price31Increase fare of the public service
Table 6. Assessment matrix of potential failure mode.
FMSeverityOccurrenceDetectionFMSeverityOccurrenceDetection
No.DM1DM2DM1DM2DM1DM2No.DM1DM2DM1DM2DM1DM2
1SEVSVHVHAHVL17VSEVFLFLVL
2SEVSVHAHHFH18VSEVSEVAHVHVLAL
3ASEVVSEVFVHVLAL19VSEVVSEVAHAHVLL
4SEVVSEVHVHVLF20FFSVHVHLF
5VSEVVSEVAHVHLVL21VSEVFAHVHFAL
6VSEVSEVAHAHVHH22VSEVSEVLowHALVL
7VSEVVSEVHFVLF23FSSEVVHVHALVL
8ASEVVSEVHFVHH24VSEVASEVAHAHFHF
9FVSEVVHHVLF25VSEVFHFLFF
10SEVFSAHVHALVL26VSEVFVHVHFHFH
11VSSVHAHHFH27ASEVASEVFHVLL
12VSFSAHVHHFH28VSEVVSEVAHHVHH
13ASEVASEVAHVHVLL29ASEVASEVHFLF
14VSEVFAHHLFH30VSEVVSEVFHFFH
15ASEVASEVHFVLL31FSEVELALVHH
16ASEVSEVAHAHLFH
Table 7. Aggregated Pythagorean Fuzzy decision Matrix.
FMSeverityOccurrenceDetection
No. μ ν π μ ν π μ ν π
10.3120.8960.3140.1000.9700.2220.9850.0160.171
20.3120.8960.3140.1000.9720.2130.5910.7190.366
30.1000.9880.1180.3820.8800.2830.1000.9720.213
40.2400.9250.2950.2400.9250.2950.1620.9600.231
50.1000.9700.2220.1000.9880.1180.2400.9250.295
60.1240.9650.2320.1000.9900.0990.6920.6100.387
70.1000.9700.2220.2700.9150.3000.1620.9600.231
80.1000.9880.1180.2700.9150.3000.6920.6100.387
90.3820.8800.2830.1240.9650.2320.1620.9600.231
100.2880.9070.3060.1000.9880.1180.1000.9880.118
110.6920.6100.3870.1000.9720.2130.5910.7190.366
120.6860.6180.3860.1000.9880.1180.5910.7190.366
130.1000.9900.0990.1000.9880.1180.1240.9650.232
140.1620.9600.2310.1240.9830.1370.2880.9070.306
150.1000.9900.0990.2700.9150.3000.1240.9650.232
160.1240.9830.1370.1000.9900.0990.2880.9070.306
170.1620.9600.2310.5850.7250.3640.2400.9250.295
180.1240.9650.2320.1000.9880.1180.1000.9720.213
190.1000.9700.2220.1000.9900.0990.1240.9650.232
200.4120.8630.2940.1000.9700.2220.2700.9150.300
210.1620.9600.2310.1000.9880.1180.3820.8810.278
220.1240.9650.2320.5790.7290.3660.1000.9880.118
230.4830.8110.3300.1000.9700.2220.1000.9880.118
240.1000.9720.2130.1000.9900.0990.4910.8070.328
250.1620.9600.2310.2880.9070.3060.4000.8700.288
260.1620.9600.2310.1000.9700.2220.5000.8000.332
270.1000.9900.0990.3880.8750.2900.1240.9650.232
280.1000.9700.2220.1240.9830.1370.6920.6100.387
290.1000.9900.0990.2700.9150.3000.2700.9150.300
300.1000.9700.2220.3880.8750.2900.4120.8630.294
310.3880.8750.2900.8550.3010.4230.6920.6100.387
Table 8. Pythagorean Fuzzy Normalized Matrix using lineal normalization.
FMSeverityOccurrenceDetectionFMSeverityOccurrenceDetection
No. μ ν μ ν μ ν No. μ ν μ ν μ ν
10.3200.9061.0000.9801.0001.000170.6190.9690.1710.7320.2430.017
20.3200.9061.0000.9820.6000.022180.8060.9751.0000.9980.1020.016
31.0000.9980.2620.8880.1020.016191.0000.9801.0001.0000.1260.016
40.4170.9340.4170.9340.1640.016200.2430.8711.0000.9800.2740.017
51.0000.9801.0000.9980.2430.017210.6190.9691.0000.9980.3880.018
60.8060.9751.0001.0000.7020.026220.8060.9750.1730.7360.1020.016
71.0000.9800.3710.9240.1640.016230.2070.8191.0000.9800.1020.016
81.0000.9980.3710.9240.7020.026241.0000.9821.0001.0000.4990.020
90.2620.8880.8060.9750.1640.016250.6190.9690.3470.9160.4060.018
100.3470.9161.0000.9980.1020.016260.6190.9691.0000.9800.5080.020
110.1450.6161.0000.9820.6000.022271.0001.0000.2580.8840.1260.016
120.1460.6241.0000.9980.6000.022281.0000.9800.8060.9930.7020.026
131.0001.0001.0000.9980.1260.016291.0001.0000.3710.9240.2740.017
140.6190.9690.8060.9930.2930.017301.0000.9800.2580.8840.4180.018
151.0001.0000.3710.9240.1260.016310.2580.8840.1170.3040.7020.026
160.8060.9931.0001.0000.2930.017
Table 9. Pythagorean Fuzzy Weighted Normalized Decision Matrix.
FMSeverityOccurrenceDetectionFMSeverityOccurrenceDetection
No. μ ν μ ν μ ν No. μ ν μ ν μ ν
10.1930.9661.0000.9941.0001.000170.3940.9890.0940.9110.1450.240
20.1930.9661.0000.9950.3810.263180.5550.9911.0000.9990.0600.236
31.0000.9990.1450.9650.0600.236191.0000.9931.0001.0000.0750.237
40.2550.9760.2360.9800.0980.237200.1450.9531.0000.9940.1640.241
51.0000.9931.0000.9990.1450.240210.3940.9891.0000.9990.2360.245
60.5550.9911.0001.0000.4600.278220.5550.9910.0950.9120.0600.235
71.0000.9930.2080.9770.0980.237230.1240.9331.0000.9940.0600.235
81.0000.9990.2080.9770.4600.278241.0000.9941.0001.0000.3090.252
90.1570.9590.5190.9920.0980.237250.3940.9890.1940.9740.2470.246
100.2100.9701.0000.9990.0600.235260.3940.9891.0000.9940.3150.253
110.0860.8441.0000.9950.3810.263271.0001.0000.1430.9640.0750.237
120.0870.8471.0000.9990.3810.263281.0000.9930.5190.9980.4600.278
131.0001.0001.0000.9990.0750.237291.0001.0000.2080.9770.1640.241
140.3940.9890.5190.9980.1760.242301.0000.9930.1430.9640.2550.246
151.0001.0000.2080.9770.0750.237310.1540.9580.0640.7010.4600.278
160.5550.9971.0001.0000.1760.242
Table 10. Pythagorean fuzzy negative ideal solution.
Risk Parameter μ ν
Severity0.0861.000
Occurrence0.0641.000
Detection1.0000.235
Table 11. Euclidean and Taxicab distances.
FMEuclideanTaxicabDistance Sum
No.SODSODEiTi
10.0130.8760.5850.0730.9300.7651.2141.768
20.0130.8760.3840.0730.9300.5921.1281.595
30.8360.0080.8830.9130.0460.9381.3141.898
40.0290.0300.8140.1450.1520.9000.9351.197
50.8360.8760.7310.9070.9350.8491.5632.691
60.2200.8760.2930.4600.9360.4971.1791.893
70.8360.0210.8140.9070.1210.9001.2931.928
80.8360.0210.2930.9130.1210.4971.0731.531
90.0070.2070.8140.0300.4470.9001.0141.378
100.0160.8760.8830.0930.9350.9401.3321.969
110.0240.8760.3840.1560.9300.5921.1331.678
120.0230.8760.3840.1520.9350.5921.1331.679
130.8360.8760.8560.9140.9350.9231.6022.773
140.0950.2070.6790.2980.4530.8170.9911.568
150.8360.0210.8560.9140.1210.9231.3091.958
160.2200.8760.6790.4670.9360.8171.3322.220
170.0950.0090.7310.2980.0590.8490.9141.206
180.2200.8760.8830.4600.9350.9381.4072.334
190.8360.8760.8560.9070.9360.9231.6022.766
200.0060.8760.6990.0120.9300.8301.2571.772
210.0950.8760.5840.2980.9350.7551.2471.988
220.2200.0090.8830.4600.0570.9401.0551.457
230.0060.8760.8830.0300.9300.9401.3291.899
240.8360.8760.4780.9080.9360.6741.4802.517
250.0950.0170.5670.2980.1040.7420.8241.144
260.0950.8760.4700.2980.9300.6671.2001.895
270.8360.0070.8560.9140.0420.9231.3041.880
280.8360.2070.2930.9070.4530.4971.1561.857
290.8360.0210.6990.9140.1210.8301.2471.864
300.8360.0070.5550.9070.0420.7341.1831.683
310.0060.0900.2930.0260.2990.4970.6240.822
Table 12. Evaluation distances matrix.
No.12345678910111213141516
10.0000.086−0.1000.279−0.3490.035−0.0790.1410.200−0.1180.0810.081−0.3880.223−0.095−0.118
2−0.0860.000−0.1860.194−0.434−0.051−0.1650.0560.114−0.204−0.005−0.005−0.4740.137−0.181−0.204
30.1000.1860.0000.379−0.2490.1350.0210.2410.300−0.0180.1810.181−0.2880.3230.005−0.018
4−0.279−0.194−0.3790.000−0.628−0.244−0.358−0.138−0.079−0.398−0.199−0.198−0.668−0.056−0.374−0.398
50.3490.4340.2490.6280.0000.3840.2700.4900.5490.2300.4290.430−0.0400.5720.2540.230
6−0.0350.051−0.1350.244−0.3840.000−0.1140.1060.165−0.1540.0450.046−0.4240.188−0.130−0.154
70.0790.165−0.0210.358−0.2700.1140.0000.2200.279−0.0400.1590.160−0.3100.302−0.016−0.040
8−0.141−0.056−0.2410.138−0.490−0.106−0.2200.0000.058−0.260−0.061−0.060−0.5300.082−0.236−0.260
9−0.200−0.114−0.3000.079−0.549−0.165−0.279−0.0580.000−0.318−0.119−0.119−0.5880.023−0.295−0.318
100.1180.2040.0180.398−0.2300.1540.0400.2600.3180.0000.1990.199−0.2700.3420.0240.000
11−0.0810.005−0.1810.199−0.429−0.045−0.1590.0610.119−0.1990.0000.000−0.4690.143−0.175−0.199
12−0.0810.005−0.1810.198−0.430−0.046−0.1600.0600.119−0.1990.0000.000−0.4690.142−0.176−0.200
130.3880.4740.2880.6680.0400.4240.3100.5300.5880.2700.4690.4690.0000.6110.2940.270
14−0.223−0.137−0.3230.056−0.572−0.188−0.302−0.082−0.023−0.342−0.143−0.142−0.6110.000−0.318−0.342
150.0950.181−0.0050.374−0.2540.1300.0160.2360.295−0.0240.1750.176−0.2940.3180.000−0.024
160.1180.2040.0180.398−0.2300.1540.0400.2600.3180.0000.1990.200−0.2700.3420.0240.000
17−0.300−0.215−0.400−0.021−0.649−0.265−0.379−0.159−0.100−0.419−0.220−0.219−0.689−0.077−0.395−0.419
180.1930.2790.0930.472−0.1560.2280.1140.3340.3930.0740.2730.274−0.1950.4160.0980.074
190.3880.4740.2880.6680.0400.4240.3100.5300.5880.2700.4690.4690.0000.6110.2940.270
200.0430.129−0.0570.323−0.3060.078−0.0360.1850.243−0.0750.1240.124−0.3450.266−0.052−0.075
210.0330.119−0.0670.313−0.3150.068−0.0460.1750.233−0.0850.1140.114−0.3550.256−0.062−0.085
22−0.159−0.074−0.2590.120−0.508−0.124−0.238−0.0180.041−0.278−0.079−0.078−0.5480.064−0.254−0.278
230.1150.2000.0150.394−0.2340.1500.0360.2560.315−0.0040.1950.196−0.2740.3380.020−0.004
240.2660.3510.1660.545−0.0830.3010.1870.4070.4660.1470.3460.347−0.1230.4890.1710.147
25−0.390−0.304−0.490−0.110−0.738−0.354−0.468−0.248−0.190−0.508−0.309−0.309−0.778−0.167−0.484−0.508
26−0.0140.072−0.1140.266−0.3620.022−0.0920.1280.186−0.1320.0670.068−0.4020.210−0.108−0.132
270.0900.175−0.0100.369−0.2590.1250.0110.2310.289−0.0290.1700.171−0.2990.313−0.005−0.029
28−0.0580.028−0.1580.221−0.407−0.023−0.1370.0830.142−0.1760.0230.023−0.4460.165−0.153−0.176
290.0330.119−0.0670.313−0.3150.068−0.0460.1750.233−0.0850.1140.114−0.3550.256−0.062−0.085
30−0.0310.054−0.1310.248−0.3800.004−0.1100.1100.168−0.1500.0490.050−0.4200.192−0.126−0.150
31−0.590−0.504−0.690−0.310−0.939−0.555−0.669−0.448−0.390−0.708−0.509−0.509−0.978−0.367−0.685−0.708
No.171819202122232425262728293031
10.300−0.193−0.388−0.043−0.0330.159−0.115−0.2660.3900.014−0.0900.058−0.0330.0310.590
20.215−0.279−0.474−0.129−0.1190.074−0.200−0.3510.304−0.072−0.175−0.028−0.119−0.0540.504
30.400−0.093−0.2880.0570.0670.259−0.015−0.1660.4900.1140.0100.1580.0670.1310.690
40.021−0.472−0.668−0.323−0.313−0.120−0.394−0.5450.110−0.266−0.369−0.221−0.313−0.2480.310
50.6490.156−0.0400.3060.3150.5080.2340.0830.7380.3620.2590.4070.3150.3800.939
60.265−0.228−0.424−0.078−0.0680.124−0.150−0.3010.354−0.022−0.1250.023−0.068−0.0040.555
70.379−0.114−0.3100.0360.0460.238−0.036−0.1870.4680.092−0.0110.1370.0460.1100.669
80.159−0.334−0.530−0.185−0.1750.018−0.256−0.4070.248−0.128−0.231−0.083−0.175−0.1100.448
90.100−0.393−0.588−0.243−0.233−0.041−0.315−0.4660.190−0.186−0.289−0.142−0.233−0.1680.390
100.419−0.074−0.2700.0750.0850.2780.004−0.1470.5080.1320.0290.1760.0850.1500.708
110.220−0.273−0.469−0.124−0.1140.079−0.195−0.3460.309−0.067−0.170−0.023−0.114−0.0490.509
120.219−0.274−0.469−0.124−0.1140.078−0.196−0.3470.309−0.068−0.171−0.023−0.114−0.0500.509
130.6890.1950.0000.3450.3550.5480.2740.1230.7780.4020.2990.4460.3550.4200.978
140.077−0.416−0.611−0.266−0.256−0.064−0.338−0.4890.167−0.210−0.313−0.165−0.256−0.1920.367
150.395−0.098−0.2940.0520.0620.254−0.020−0.1710.4840.1080.0050.1530.0620.1260.685
160.419−0.074−0.2700.0750.0850.2780.004−0.1470.5080.1320.0290.1760.0850.1500.708
170.000−0.493−0.689−0.344−0.334−0.141−0.415−0.5660.089−0.287−0.390−0.242−0.334−0.2690.289
180.4930.000−0.1960.1500.1600.3520.078−0.0730.5830.2060.1030.2510.1600.2240.783
190.6890.1960.0000.3450.3550.5480.2740.1230.7780.4020.2990.4460.3550.4200.978
200.344−0.150−0.3450.0000.0100.203−0.071−0.2230.4330.057−0.0460.1010.0100.0750.633
210.334−0.160−0.355−0.0100.0000.193−0.081−0.2330.4230.047−0.0560.0910.0000.0650.623
220.141−0.352−0.548−0.203−0.1930.000−0.274−0.4250.230−0.146−0.249−0.101−0.193−0.1280.430
230.415−0.078−0.2740.0710.0810.2740.000−0.1510.5040.1280.0250.1730.0810.1460.704
240.5660.073−0.1230.2230.2330.4250.1510.0000.6550.2790.1760.3240.2320.2970.856
25−0.089−0.583−0.778−0.433−0.423−0.230−0.504−0.6550.000−0.376−0.479−0.332−0.423−0.3580.200
260.287−0.206−0.402−0.057−0.0470.146−0.128−0.2790.3760.000−0.1030.045−0.0470.0180.576
270.390−0.103−0.2990.0460.0560.249−0.025−0.1760.4790.1030.0000.1480.0560.1210.679
280.242−0.251−0.446−0.101−0.0910.101−0.173−0.3240.332−0.045−0.1480.000−0.091−0.0270.532
290.334−0.160−0.355−0.0100.0000.193−0.081−0.2320.4230.047−0.0560.0910.0000.0650.623
300.269−0.224−0.420−0.075−0.0650.128−0.146−0.2970.358−0.018−0.1210.027−0.0650.0000.558
31−0.289−0.783−0.978−0.633−0.623−0.430−0.704−0.856−0.200−0.576−0.679−0.532−0.623−0.5580.000
Table 13. Ranking of potential failure mode of each criteria.
FM No.HiPositionFM No.HiPosition
10.2601617−9.05129
2−2.39823186.2405
33.36091912.3011
4−8.40128201.59913
511.0703211.29015
6−0.8311922−4.68225
72.70312233.8138
8−4.12524248.4984
9−5.9372625−11.81830
103.931726−0.15917
11−2.23721273.03711
12−2.2532228−1.53820
1312.3002291.29214
14−6.6552730−0.71518
153.2001031−18.02431
163.9326
Table 14. Ranking of potential failure moden of each criteria with PF MOORA variation.
FM No.HiPositionFM No.HiPosition
1−1.52631170.2513
2−0.21927180.01715
30.1088190.00316
40.09610200.09411
5−0.0392121−0.09124
6−0.45730220.3012
70.06013230.2324
8−0.4112824−0.20026
90.126725−0.03420
100.0941226−0.18225
110.1645270.1049
120.147628−0.45729
13−0.0091829−0.00217
14−0.0432230−0.01419
150.05414310.4221
160.06923
Publisher’s Note: MDPI stays neutral with regard to jurisdictional claims in published maps and institutional affiliations.

