Article

An Ordinal Consistency Indicator for Pairwise Comparison Matrix

Department of Marketing Management, Takming University of Science and Technology, Taipei 11451, Taiwan
Symmetry 2021, 13(11), 2183; https://doi.org/10.3390/sym13112183
Submission received: 24 October 2021 / Revised: 5 November 2021 / Accepted: 8 November 2021 / Published: 15 November 2021
(This article belongs to the Topic Multi-Criteria Decision Making)

Abstract

:
The pairwise comparison (PC) matrix is often used to manifest human judgments, and it has been successfully applied in the analytic hierarchy process (AHP). As a PC matrix is formed by making paired reciprocal comparisons, symmetry is a striking characteristic of a PC matrix. It is this simple but powerful means of resolving multicriteria decision-making problems that is the basis of AHP; however, in practical applications, human judgments may be inconsistent. Although Saaty’s rule for the consistency test is commonly accepted, there is evidence that those so-called “acceptable” PC matrices may not be ordinally consistent, which is a necessary condition for a PC matrix to be accepted. We propose an ordinal consistency indicator called SDR (standard deviation of ranks), derive the upper bound of the SDR, suggest a threshold for a decision-maker to assess whether the ordinal consistency of a PC matrix is acceptable, and reveal a surprising fact that the degree of ordinal inconsistency of a small PC matrix may be more serious than a large one. We made a comparative analysis with some other indicators. Experimental results showed that the ordinal inconsistency measured by the SDR is invariant under heterogeneous judgment measurements with a varied spectrum of scales, and that the SDR is superior to the two compared indicators. Note that the SDR not only works for a multiplicative PC matrix but can also be used for additive and fuzzy PC matrices.

1. Introduction

Since Thurstone’s eminent article was published, the pairwise comparison matrix (PC matrix for short) has been a well-known method used to help decision-makers to manifest experts’ subjective judgments [1]. The PC matrix has been successfully applied in methodologies of multicriteria decision-making, such as the analytic hierarchy process (AHP). AHP is a theory of measurement with ratio scales through pairwise comparisons and relies on the judgments of experts to derive a priority vector [2,3]. Decision-making is a mental activity that people often face. Sometimes, it is a complex and difficult task, especially when we are confronted with multiple, usually conflicting, criteria, and when we need to rank multiple alternatives in order to find the best one [4]. To simplify such a complex problem, we may decompose it into smaller and more easily tractable ones; in addition, due to the limit of our capability of handling multi-entities simultaneously, we may compare two entities at a time and express the degree of our preference of one entity over the other one.
The AHP perfectly provides us with a comprehensive framework that deals with problem decomposition in a systematic way, and by using a PC matrix, it enables us simultaneously to cope with the intuitive, the rational, and the irrational when we handle real world decisions and complexities [3]. A debate about the main criticisms of the AHP can be found [5]. Despite their long history, the PC and the AHP are still very attractive subjects for research. There are some survey and review papers about the PC and the AHP [6,7,8].
A PC matrix is presented as a square matrix A = [aij], where aij > 0, for every i, j = 1, n, manifest expert’s assessment based on relative comparisons of an entity i over another entity j. Here, an entity could be a criterion or an alternative. Several scales have been proposed to present subjective judgment [2,9,10,11]. It is worth noting that there is a general unified framework for PC matrices where entry aij of the matrix can be a preference ratio, i.e., multiplicative case, or a preference difference, i.e., additive case, or a value in the range of [0, 1] that measures the distance from the indifference, i.e., fuzzy case [12]. By using a logarithmic mapping and an exponential mapping, the multiplicative case and additive case are interchangeable [13]. In this study, we focus on the multiplicative case, but the results can also be used for additive and fuzzy PC matrices.
Since entry aij is an estimate of the underlying ratio (αi/αj), without surprising that aii = 1 for all i. A PC matrix is called reciprocal if a i j = 1 a j i ,   for all   i ,   j = 1 ,   2 ,   , n , and is called consistent if a i j a j k = a i k ,   for   all   i ,   j , k = 1 ,   2 ,   , n . All PC matrices discussed here are reciprocal because this is an essential and rational condition. As the pairwise comparisons that we consider are formed by making paired reciprocal comparisons, symmetry is a striking characteristic of a PC matrix. It is this simple, but powerful means of resolving multicriteria decision-making problems that is the basis of the AHP [14]; however, they are not necessarily consistent because this is a desirable property that is what we want to achieve, not only from the academic perspective but also from the decision-maker’s perspective. Although sometimes we need to deal with an incomplete PC matrix [15], hereinafter, a PC matrix means a complete reciprocal PC matrix.
Two theoretical issues relating to the usage of the PC matrix are of special interest: the choice of a prioritization technique and inconsistency evaluating [16]. There are several different methods commonly used to derive the estimated priority vector α = ( α 1 , α 2 , , α n ) of a PC matrix [17,18,19,20,21,22,23]. It is well known that if a PC matrix A is inconsistent, different prioritization methods may derive different estimates of priority vector α ; however, if A is consistent, different prioritization methods should derive the same estimate [18]. Unfortunately, the judgments of decision-makers may be inconsistent, especially in the situation of many entities involved.
This study is devoted to the second issue: inconsistency evaluating. The issue of inconsistency has attracted increasing attention from inception to recent years and resulted in various indicators of measurement have been proposed [16,24,25,26,27,28,29,30,31,32,33]; however, the usage of the indicators is justified only by some heuristics, and it is still unclear what they really “measure” [16]. Although a considerable number of studies have been performed, the discussion on inconsistency indicators is far from being over, and the ground is still fertile for debates [27]. Recently, there are some studies have been devoted to proposing a set of properties to characterize the inconsistency indicators [29,34,35].
There are two types of inconsistency: cardinal and ordinal. While cardinal consistency is a sufficient condition of a PC matrix to be considered acceptable, ordinal consistency is a necessary condition [36]. In other words, cardinal consistency guarantees ordinal consistency, and cardinal inconsistency does not imply ordinal inconsistency; however, ordinal inconsistency guarantees cardinal inconsistency [37]. It seems that only one inconsistency indicator is insufficient for describing the inconsistency of a PC matrix; thus, the improvement of the notion of inconsistency should be necessary [38]. Moreover, it has been confirmed that a relatively high percentage of comparison matrices satisfying Saaty’s rule of consistency test is ordinally inconsistent [37,39,40]. (Rule of “consistency ratio should be less than 0.1.”) However, Saaty’s rule of consistency is a test that is still commonly accepted; therefore, we focus on the ordinal inconsistency.
The remainder of this paper is organized as follows. In Section 2, a brief literature review is introduced. In Section 3, we present the proposed ordinal inconsistency indicator called SDR (standard deviation of ranks), derive the upper bound of the SDR that is a function of the size of the PC matrix, and suggest a threshold for the decision-maker to decide whether the ordinal consistency of a PC matrix is acceptable. In Section 4, some inconsistency indicators are compared and results are presented. Further, two kinds of PC matrices called CPC matrix (the “corner” PC matrix) and FPC matrix (the “full” PC matrix) are used to illustrate the superiority of the SDR [33]. Finally, the conclusion and discussion are given in Section 5.

2. Literature Review

Ever since Saaty’s [2,14] development of the analytic hierarchy process (AHP), many applications in practical decision-making have been reported [41,42,43,44,45,46,47,48]; however, the main challenge of using pairwise comparison is its lack of consistency, which in practice is very often the case; in other words, most PC matrices are inconsistent. There are several causes of inconsistency, including psychological reasons, type errors, and an insufficient model structure [49].
Detecting and rectifying the inconsistency of a PC matrix is an important and active research area. Consequently, there are various suggestions have been proposed [13,36,37,40,50,51,52,53,54]. Several inconsistency indicators have been proposed to estimate the deviation of experts’ judgments from a situation of complete consistency [12,16,26,27]. Cavallo and D’Apuzzo provided a consistency indicator that has a natural meaning, and it is easy to compute in the additive and multiplicative cases [12]. Brunelli et al. proved the proportionality between some consistency indicators [26]. Brunelli et al. investigated and analyzed 10 indicators from a numerical perspective. The results show that there is a strong or weak correlation between these indicators, and since each indicator is, in fact, a different definition, it has its own advantages and disadvantages. In addition, it also pointed out that there is no recognized standard that can be used to measure the appropriateness of different indicators. [26,27].
Saaty’s consistency indicator CI and CR rule of 0.1 have been widely debated [18,28,40,45,54,55,56]. For example, by using the numerical results of a simulation analysis, Xu et al. showed that it is impossible to find some proper critical values of CR for different matrix sizes, and argued that Saaty’s consistency test could be unreasonable [56]. Moreover, there is evidence that those so-called “acceptable” PC matrices may not be ordinally consistent [37,39,40].
However, relative to cardinal consistency, there are seldom studies devoted to ordinal consistency [36,54,57]. Genest and Zhang, based on a Gower plot [58], proposed a graphical method to detect the elements in a PC matrix that cause major ordinal and cardinal inconsistencies [57]. By using a Gower plot and two optimization models, Li and Ma proposed an iterative method to assist a decision-maker in detecting/adjusting ordinal and cardinal inconsistencies [54]. By using route matrices and digraphs, Yang et al. developed an adjustment procedure to help decision-makers correct the inconsistency [36].
In the next section, we introduce an ordinal consistency indicator that is quite different from the foregoing suggestions in that it is not only easy to understand but also easy to use to measure the degree of ordinal inconsistency of a PC matrix. Moreover, the proposed indicator not only works for multiplicative PC matrix but also can be used for an additive and fuzzy PC matrix, as we use only ordinal information instead of cardinal information.

3. The Proposed Indicator SDR

For an n × n PC matrix A = [ a i j ] , we first construct a corresponding rank matrix R:
R n × n = [ r i j ] ,     i ,   j = 1 ,   2 ,   ,   n .
Here, entry r i j is the rank of a i j in the i-th row of A. For example, a 4 × 4 PC matrix A as follows:
A = [ 1 2 1 2 1 4 5 3 6 1 4 1 3 1 5 1 6 1 3 1 3 1 ] .
We will have a corresponding rank matrix R as follows:
R = [ 4 3 4 3 2 1 2 1 4 3 3 4 2 1 2 1 ] .
Note that the proposed method is applicable to the additive and fuzzy PC matrices. Evidently, entry r i j belongs to { 1 ,   2 , , n } . Then an ordinal inconsistency indicator SDR (standard deviation of ranks) can be defined [59] as:
SDR [ A ] = 1 n σ j n .
The variable σ j is the standard deviation of the j-th column of the corresponding rank matrix R n × n . For the 4 × 4 PC matrix A mentioned above, we will obtain SDR [ A ] = 0.25 , as σ 1 = σ 2 = 0.5 and σ 3 = σ 4 = 0 . It is obviously that for a PC matrix A of order n, the minimum of SDR is 0, that is, A is completely ordinally consistent. Without surprise, the greater the SDR [ A ] , the greater the inconsistency of the PC matrix A. The worst situation of inconsistency will occur when all entries of a column with a different rank and all entries of a raw with a different rank, if without tie between two entities (When the result of a comparison is a tie, we can use a more detailed judgment, for example, the numbers from 1.1 to 1.9 [60]). For example,
R 4 × 4 = [ 1 2 2 1 3 4 4 3 3 4 4 3 2 1 1 2 ] .
Here, we have σ j = 1.29, for all j = 1, 2, 3, 4. Based on such an observation, it is easy to derive the following proposition.
Proposition 1.
For a PC matrix A of order n, the upper bound of S D R [ A ] is n ( n + 1 ) 12 .
Proof. 
It is well known that the standard deviation σ of n observations is
σ = i = 1 n ( x i   x   ¯ ) 2 ( n 1 ) .
Now, let x i = i , and use σ 1 ~ n to stand for the standard deviation of these n numbers, then we have
σ 1 ~ n = i = 1 n ( i n + 1 2 ) 2 ( n 1 ) .
Thus, it is easy to derive the following result: (Since i = 1 n i = n ( n + 1 ) 2 , and i = 1 n i 2 = n ( n + 1 ) ( 2 n + 1 ) 6 ).
σ 1 ~ n = n ( n + 1 ) 12 .
 □
Evidently, the upper bound of SDR [ A ] is a function of n, i.e., the size of a PC matrix A. This property is important, because one of the reasons why Saaty’s consistency check is criticized is that it cannot provide proper critical values for matrices of different sizes [29]. Table 1 lists the upper bounds of SDR [ A ] for a PC matrix A of size n from 3 to 15.
Figure 1 reveals that the upper bound of SDR [ A ] steadily increases as the size of PC matrix A increases.
We use NSDR [ A ] , which stands for the normalized SDR [ A ] (i.e., NSDR [ A ] = SDR [ A ] n ) ; thus, we will obtain the following proposition.
Proposition 2.
For a PC matrix A with order n 3 , the upper bound of N S D R [ A ] lies in the range of [ 1 12 , 1 3 ] .
Proof. 
By definition, the upper bound of NSDR [ A ] is ( n + 1 ) 12 n . Obviously, when n = 3 , the upper bound of NSDR [ A ] = 1 3 , and lim n ( n + 1 ) 12 n = 1 12 .  □
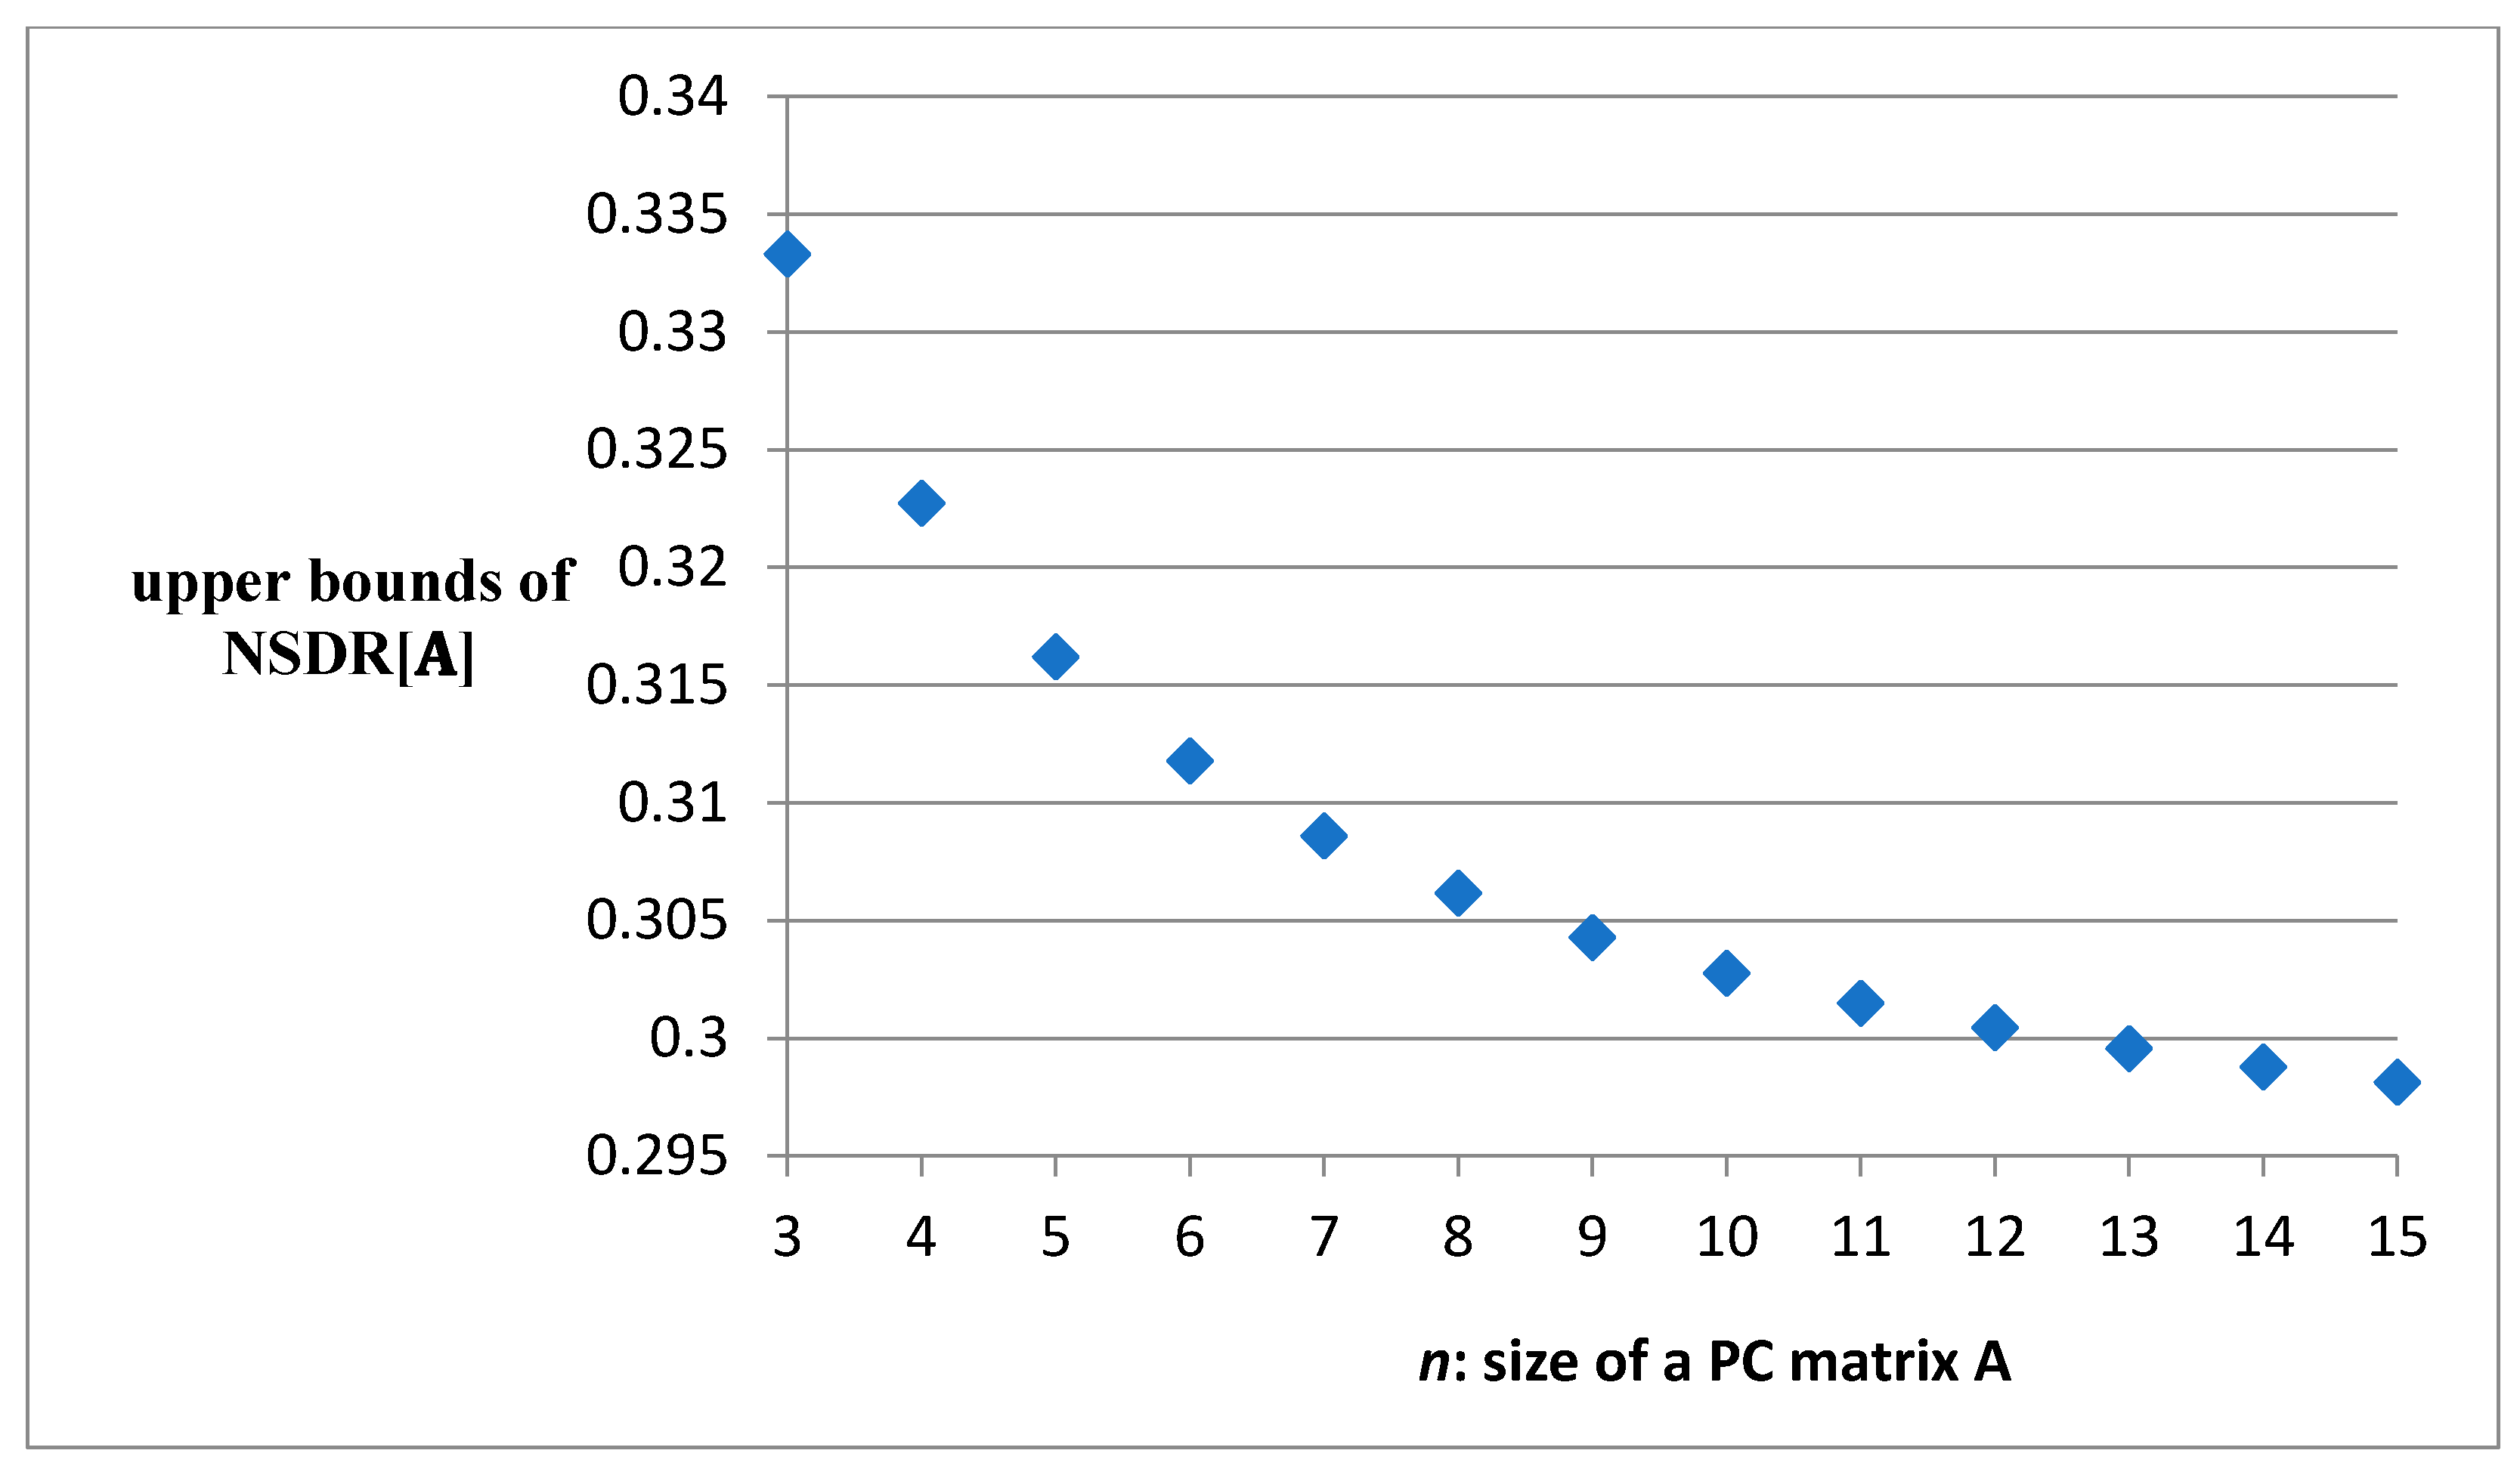
Figure 2 reveals a surprising fact that the upper bound of NSDR [ A ] declines as the size of PC matrix A increases.
Strictly speaking, a PC matrix A can be called ordinally consistent only if SDR [ A ] = 0 ; otherwise, it should be called ordinally inconsistent. However, in practice, we may use a threshold to decide whether a PC matrix of order n is acceptable or not, according to the following inequality:
SDR [ A ] δ σ 1 ~ n
Here, the Greek small letter δ stands for a threshold, where 0 δ 1 , and the choice of an adequate threshold depends on the decision-maker’s attitude. The more rigorous attitude is, the higher (i.e., a smaller value of δ ) the threshold is. Alternatively, we can set the threshold, in a statistical manner, to be under a certain percentile (denoted by p ) of the distribution of SDR [ A ] , for example, p = 0.05 or 0.1. Similarly, the choice of an appropriate percentile also depends on the decision-maker’s attitude. To provide such a threshold, we examined the distribution of SDR [ A ] by systematically generating possible PC matrices. That is, a total of ( 2 x 1 ) i = 1 n 1 i matrices, if we use an x-scales measurement for a PC matrix of size n. Here, the term of x-scales measurement means the decision-maker can choose 2x − 1 symmetric reciprocal values to present his/her assessment about the relative comparisons of two entities. (Saaty [2] suggested a widely used symmetric reciprocal 9-scales [ 1 9 , 1 8 , , 1 2 , 1 ,   2 , ,   8 ,   9 ] with a neutral value of 1). Therefore, if we use a 4-scale measurement for a 4 × 4 PC matrix, there are a total of (117,639 = 7 6 ) matrices. Experimental results show that there are only 1166 4 × 4 PC matrices, which is less than one percent (1166/117,639 = 0.00991) of all matrices, which are completely ordinally consistent, i.e., SDR [ A ] = 0 ; therefore, it is reasonable to set the threshold as in 5th or 10th percentile.
Table 2 summarizes the results of seven percentiles ( p = 0.01~0.5) for 3 × 3 PC matrix using three different judgment scale measurements (S: Saaty’s [2], I: Inverse linear [10], B: Balanced [11]) with varied spectrum of scales (from 3-scales to 9-scales). Note that we conducted the simulation by systematically generating possible PC matrices, and that a tie between two entities is allowed.
The results, presented in Table 2, show that the ordinal inconsistency of a PC matrix A measured by the SDR [ A ] is invariant under different judgment scale measurements with a varied spectrum of scales. This is because we use only ordinal information instead of cardinal information.

4. Comparisons

In this study, we made three different comparisons between the proposed indicator SDR and other indicators. Firstly, we examined the linear correlation via the Pearson correlation coefficient ( Correl ( X ,   Y ) = i = 1 n ( x i x ¯ ) ( y i y ¯ ) i = 1 n ( x i x ¯ ) 2 i = 1 n ( y i y ¯ ) 2 ), between pairs of some consistency indicators suggested in the literature. The results are reported in Table 3. (Since we conducted simulations by systematically generating possible PC matrices, the results are based on a 5-scale instead of Saaty’s 9-scale measurement). The notations used in Table 3 are followed a study of Brunelli et al. [26]; however, we conducted simulations by systematically generating possible PC matrices instead of generating random matrices or perturbed consistent matrices the way they adopted.
In Table 3, via figures in boldface, we can find that there is a strong linear correlation among the indicators of CI, CI*, GCI, and ICD. This result is consistent with the report of Brunelli et al. [26]. Note that there is no indicator that has a strong linear correlation with the SDR; this evidence makes the SDR unique among other indicators.
Secondly, to demonstrate the sensitivity of SDR in detecting ordinal inconsistency and to examine Saaty’s consistency test, we conducted a simulation as follows. For 4 × 4 PC matrix, there are only 955,505 matrices out of all possible matrices (24,137,569 =   17 6 ) with CI 0.1 , i.e., only 3.96% of 4 × 4 PC matrix satisfy Saaty’s rule; this result confirms a previous study [55]. Among these “acceptable” matrices, we further identified 1056 matrices that with 0.0999 CI 0.09999 , and compared their values of CI and SDR. Figure 3 shows the results.
Figure 3 indicates that these so-called “acceptable” PC matrices are ordinally inconsistent. This result coincides with several previous studies [37,40]; however, ordinally consistent is a necessary condition of a PC matrix to be considered as “acceptable”.
Thirdly, we compared CI, SDR, and Dissonance in their capability of measuring ordinal inconsistency of PC matrix. Dissonance is an ordinal consistency indicator suggested by Siraj et al.; they also proposed a congruence measure used for cardinally inconsistent judgments [40]. To make this comparison, we use two types of PC matrices that have been analyzed in literature [33]. Koczkodaj and Szwarc analyzed a kind of PC matrix called “corner PC matrix or CPC,” that with all ones except for two corners as follows:
CPC ( x ,   n ) = [ 1 1 1 1 x 1 x 1 1 1 ] .
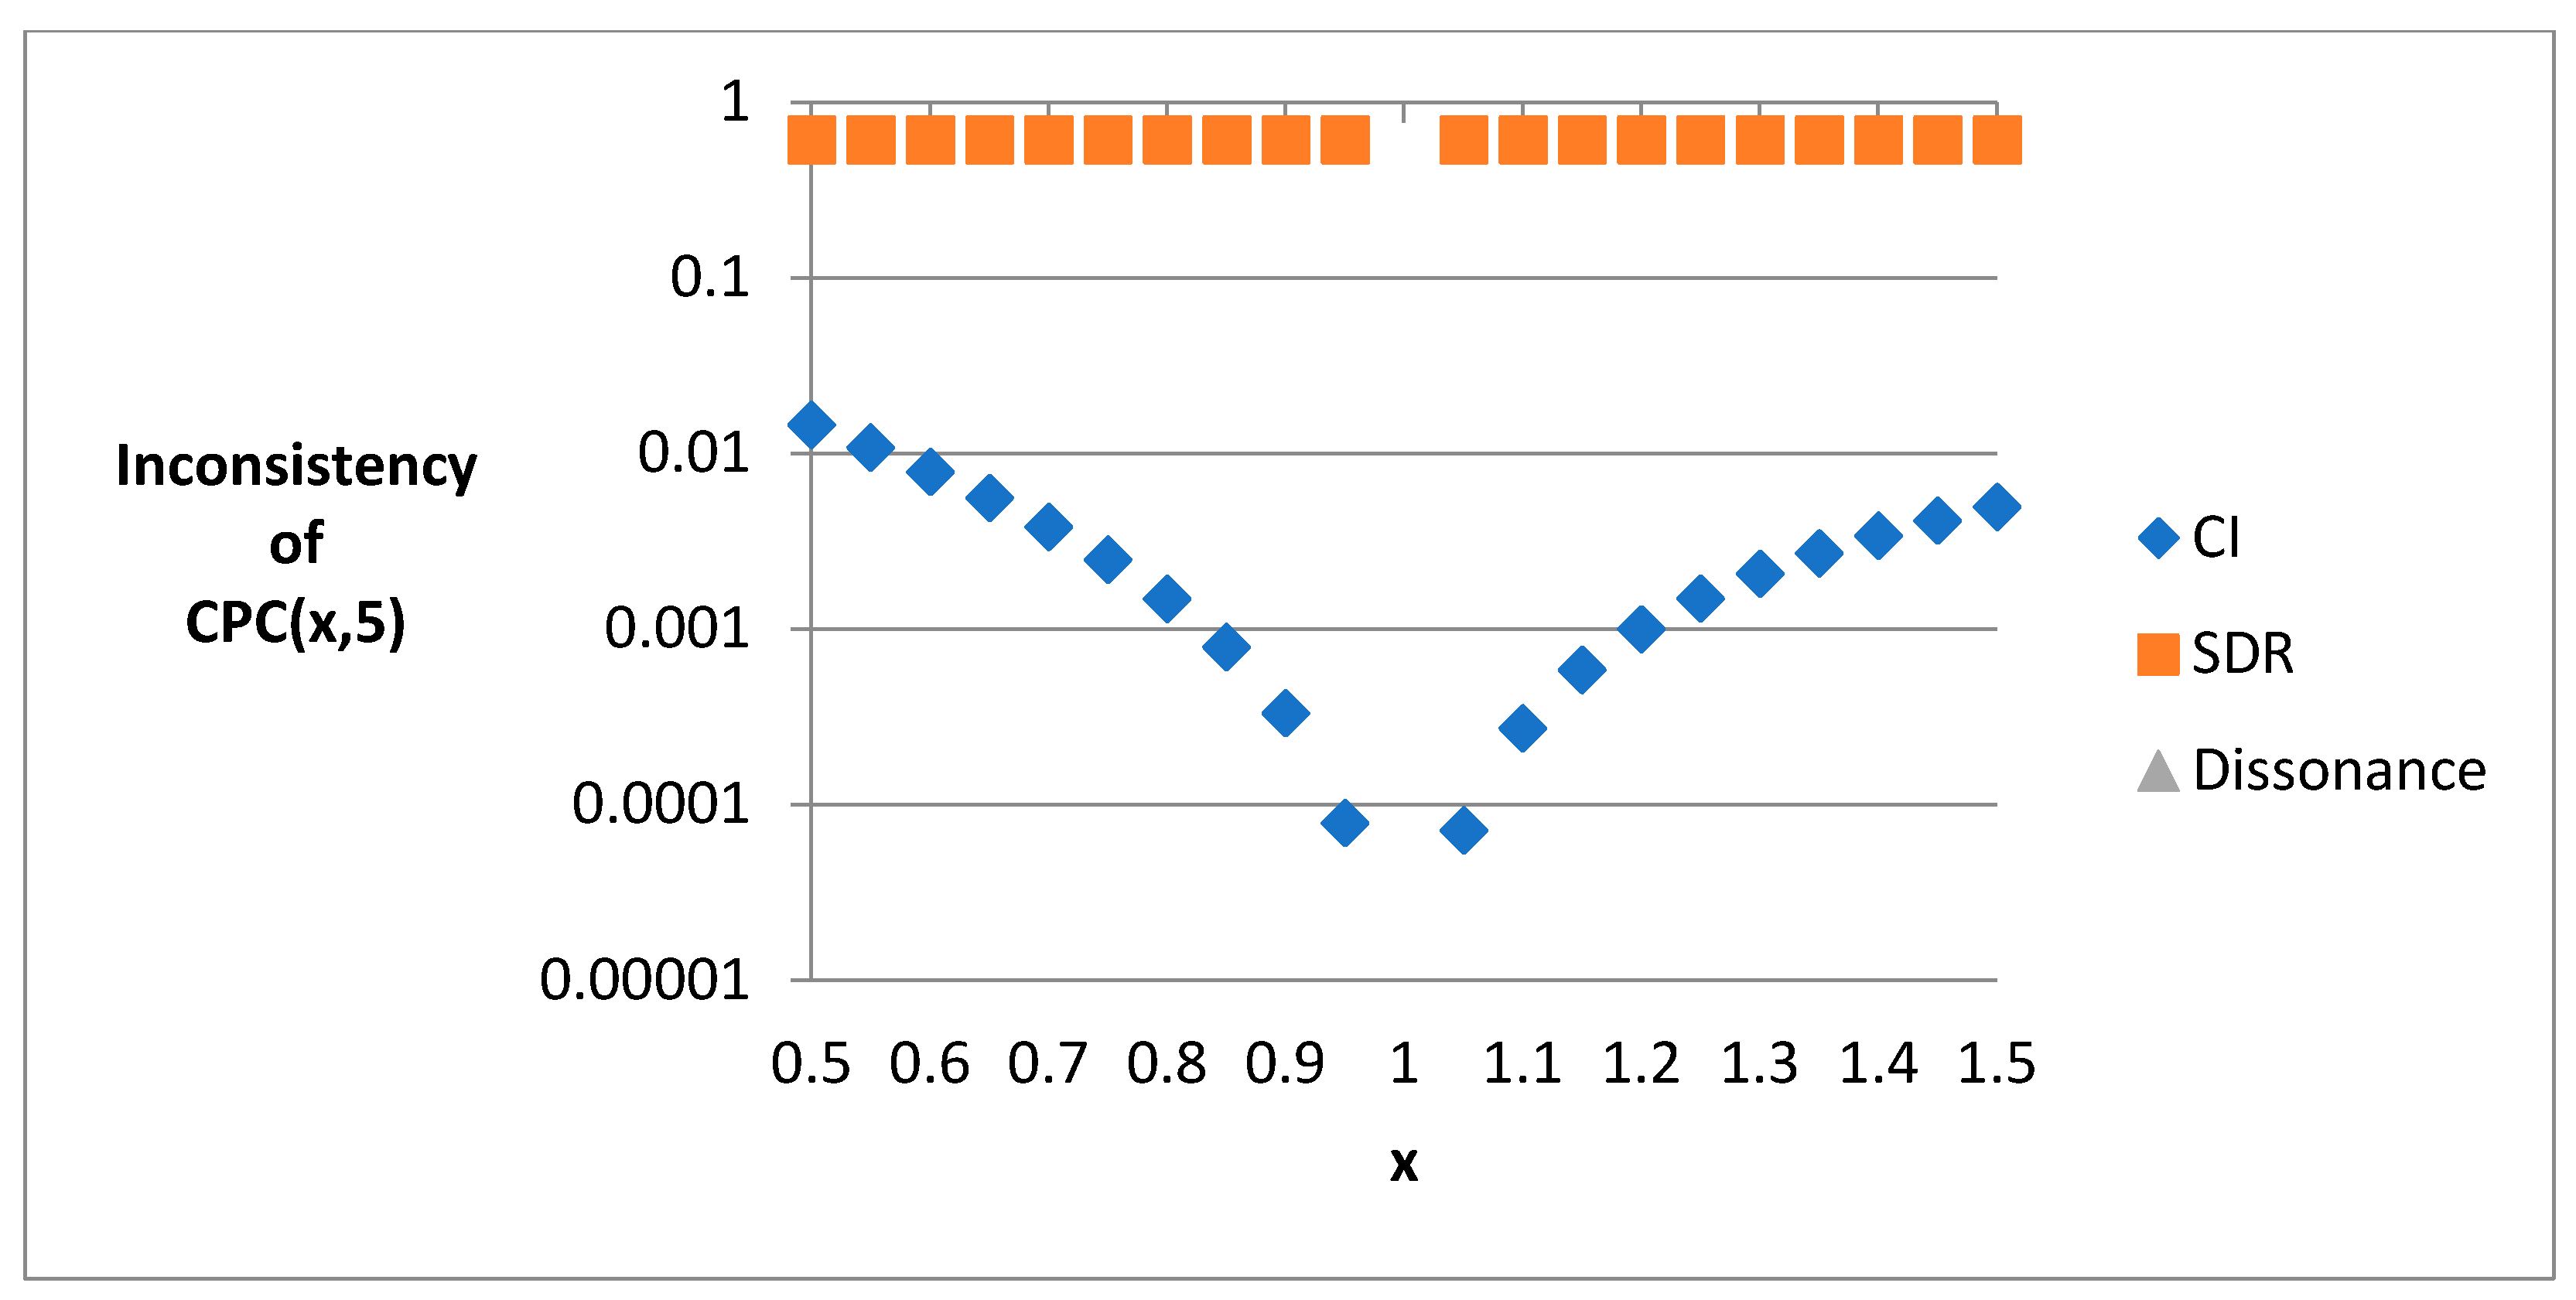
Trivially, the only possibility of this matrix to be consistent is when x = 1 . By using a distance-based inconsistency reduction algorithm, Koczkodaj and Szwarc proclaimed that x > 1.5 is suspiciously high and the PC matrix needs to be re-examined [29]. In fact, by using the SDR, we find that a matrix CPC(x, n) even with a small value of x less than 1.5 would be inconsistent. Figure 4 shows the values of CI, SDR, and Dissonance of the CPC(x, 5). Here, we set x from 0.5 to 1.5 with an increment of 0.05.
When x 1 , in contrast to the values of SDR and Dissonance (this refers to the overall dissonance ( Ψ ) [40]; note that since these values fall on the x-axis, they will be visible only in color). that are constants of 0.614738 and 0, respectively, the values of CI increasing from 0 to 0.00496 or 0.014654 depends on the values of x is 1.5 or 0.5, respectively. Note that the curve of CI asymmetric to x = 1 . The results show that the indicator SDR is superior to the two compared indicators in measuring the ordinal inconsistency of a PC matrix.
Koczkodaj and Szwarc analyzed another type of PC matrix, called FPC (the “full” PC matrix or the PC matrix full of x). The matrix FPC(x, n), with x > 1 , is defined as follows:
FPC ( x ,   n ) = [ 1 x x 1 1 x   x x   x x 1 x 1 x 1   x 1 1 x 1 x 1 ]
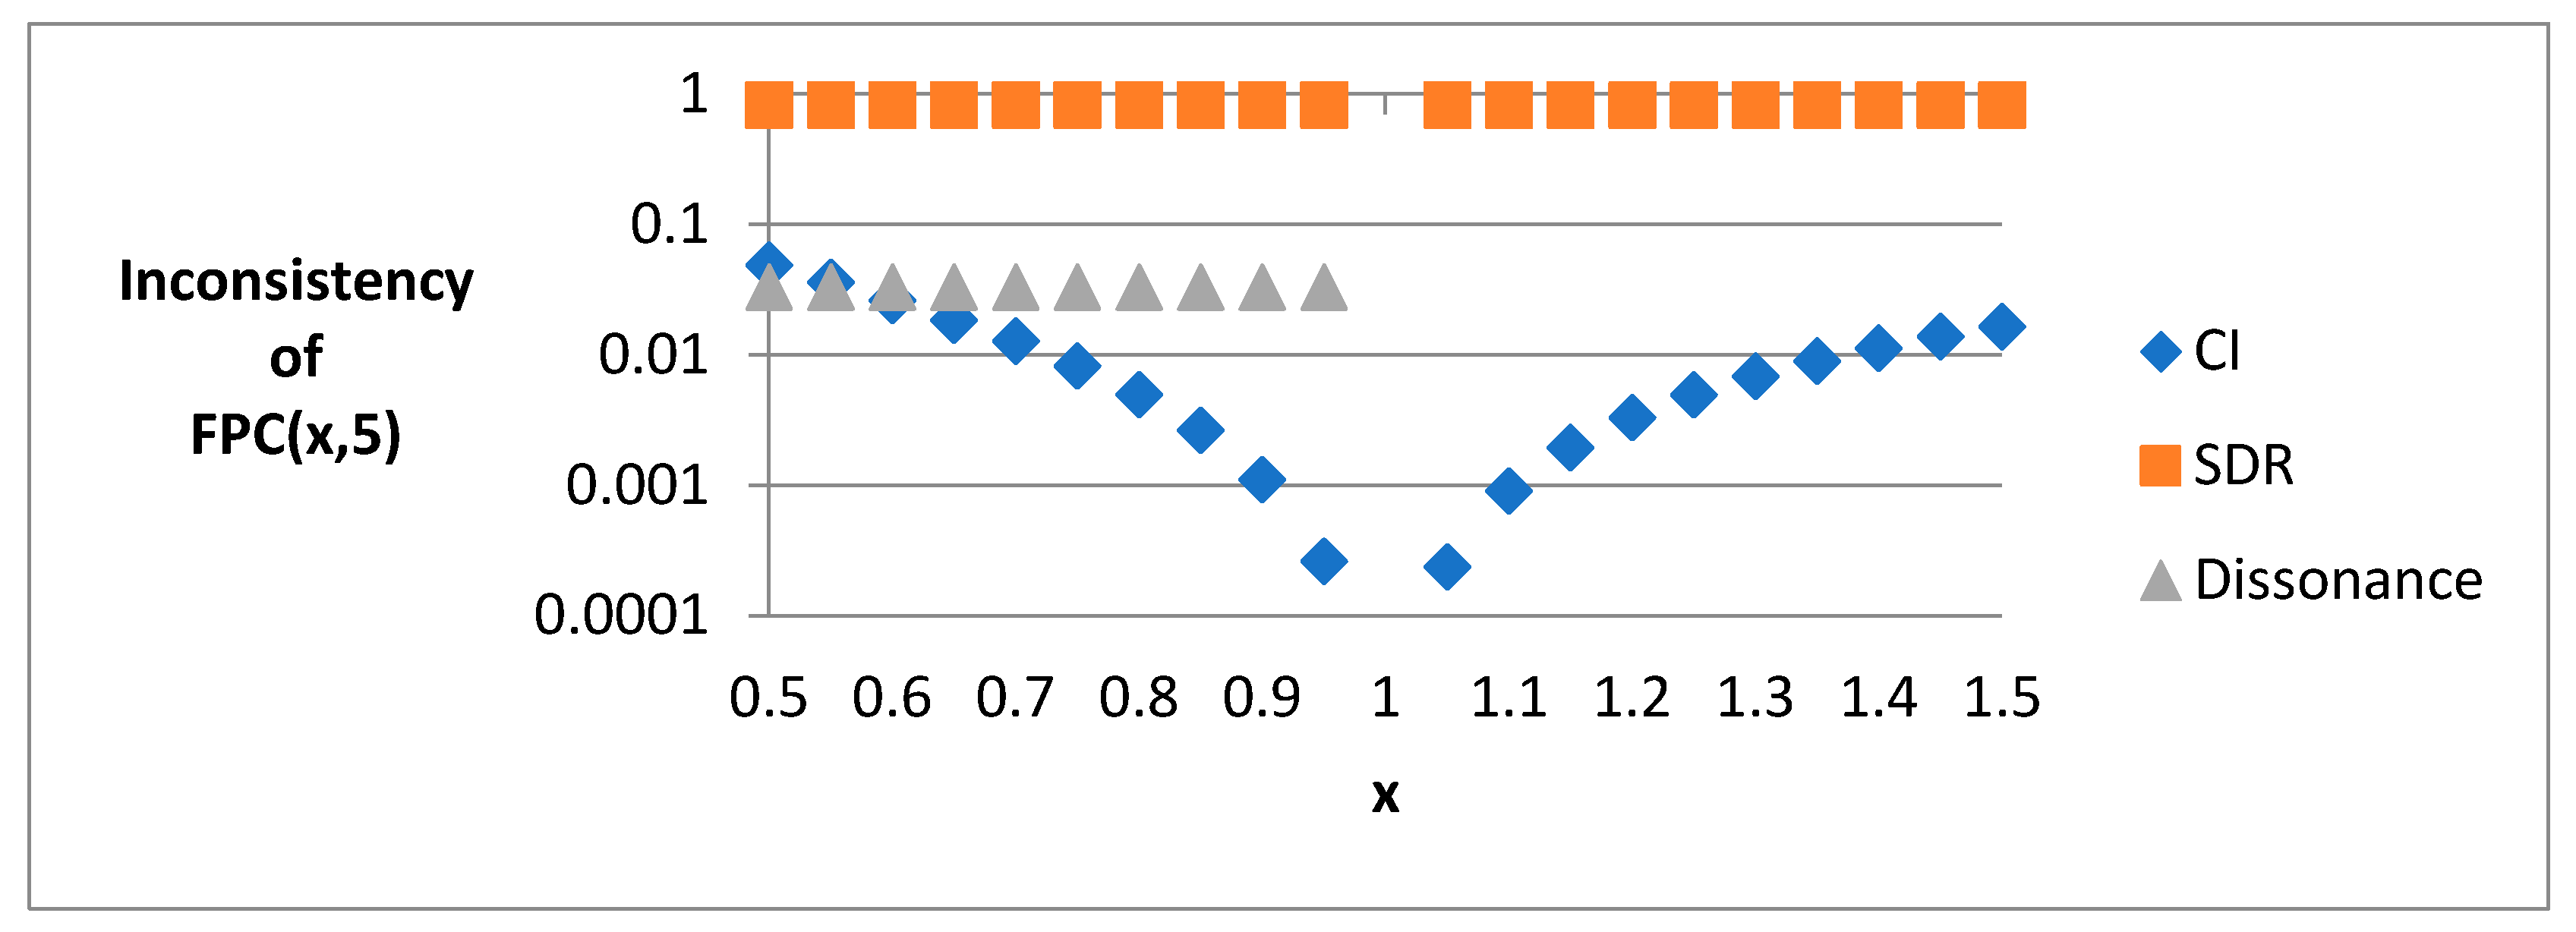
Similarly, the only possibility of this matrix to be consistent is when x = 1 ; however, unlike CPC(x, n), it has all erroneous triads. Figure 5 shows the values of CI, SDR, and Dissonance of the FPC(x, 5). Here, we also set x from 0.5 to 1.5 with an increment of 0.05.
The values of CI increasing from 0 to 0.0165 or 0.0487 depends on the values of x is 1.5 or 0.5, respectively. For indicator Dissonance, the values are zero, i.e., fall on the x-axis, with respect to x from 1 to 1.5, and are 0.03333 with respect to x from 0.95 to 0.5. All SDR [ A ] , on the other hand, are 0.614738 except when x = 1 , where SDR [ A ] = 0 as expected. From the results presented above, we can conclude that the indicator CI is not suitable for measuring ordinal inconsistency of a PC matrix, and that the proposed indicator SDR functions appropriately what its name implies; that is, it measures exactly what ordinal inconsistency means.

5. Conclusions

This study attempted to reinforce Saaty’s consistency test, as there is evidence that those so-called “acceptable” PC matrices may not be ordinally consistent. We propose an indicator called SDR [ A ] (standard deviation of ranks) to measure the ordinal inconsistency of a PC matrix A. The upper bound of SDR [ A ] , n ( n + 1 ) 12 , is a function of size n of the PC matrix A. This property is important, because it enables us to find proper values of ordinal inconsistency for different PC matrix sizes. Then, we suggest a threshold for the decision-maker to decide whether the ordinal inconsistency of a PC matrix is acceptable. Moreover, we derive the range of the upper bound of normalized SDR [ A ] (namely, NSDR [ A ] ), n + 1 12 n , of PC matrix A with size of n. The range, from 1 3 . to 1 12 , . reveals a surprising fact that the degree of ordinal inconsistency of a small PC matrix may be more serious than a large one. We made three different comparative analyses with some other indicators. The results show that the indicator SDR measures exactly what ordinal inconsistency means and that the SDR is superior to the two compared indicators. In practice, we suggest decision-makers not only to follow Saaty’s rule of 0.1 but also to check the SDR.
Since we use only ordinal information instead of cardinal information of a PC matrix in computing the SDR, it is worth noting that the ordinal inconsistency of a PC matrix measured by using the indicator SDR is invariant under heterogeneous judgment measurements with a varied spectrum of scales, and that the proposed SDR not only works for multiplicative PC matrix but can also be used for additive and fuzzy PC matrices. Finally, since it is somewhat difficult to analyze and derive the upper bound of SDR [ A ] . for a PC matrix A that a tie between two entities is allowed, we leave it as a topic for future research. Moreover, how we can use this ordinal consistency indicator to improve the cardinal consistency of a PC matrix seems worth investigating.

Funding

This research was supported in part by the Ministry of Science and Technology of Taiwan (Republic of China) under grant MOST 110-2410-H-147-002- and in part by the Takming University of Science and Technology under grant TM110-3.

Institutional Review Board Statement

Not applicable.

Informed Consent Statement

Not applicable.

Data Availability Statement

Acknowledgments

The author would like to thank the former President (So-De Shyu) and the current President (Chiuling Lu) for their support of this research. The author also would like to thank the anonymous referees for their comments that improved the quality of this manuscript to a great extent.

Conflicts of Interest

The author declares no conflict of interest.

References

  1. Thurstone, L.L. A law of comparative judgment. Psychol. Rev. 1927, 34, 273–286. [Google Scholar] [CrossRef]
  2. Saaty, T.L. A scaling method for priorities in hierarchical structures. J. Math. Psychol. 1977, 15, 234–281. [Google Scholar] [CrossRef]
  3. Saaty, R.W. The analytic hierarchy process—What it is and how it is used. Math. Model. 1987, 9, 161–176. [Google Scholar] [CrossRef] [Green Version]
  4. Kuo, T. A modified TOPSIS with a different ranking index. Eur. J. Oper. Res. 2017, 260, 152–160. [Google Scholar] [CrossRef]
  5. Smith, J.E.; von Winterfeldt, D. Anniversary article: Decision analysis in management science. Manag. Sci. 2004, 50, 561–574. [Google Scholar] [CrossRef]
  6. Emrouznejad, A.; Marra, M. The state of the art development of AHP (1979–2017): A literature review with a social network analysis. Int. J. Prod. Res. 2017, 55, 6653–6675. [Google Scholar] [CrossRef] [Green Version]
  7. Ishizaka, A.; Labib, A. Review of the main developments in the analytic hierarchy process. Expert Syst. Appl. 2011, 38, 14336–14345. [Google Scholar] [CrossRef] [Green Version]
  8. Koczkodaj, W.W.; Mikhailov, L.; Redlarski, G.; Soltys, M.; Szybowski, J.; Tamazian, G.; Wajch, E.; Yuen, K.K.F. Important Facts and Observations about Pairwise Comparisons. Fundam. Inform. 2016, 144, 291–307. [Google Scholar] [CrossRef] [Green Version]
  9. Dong, Y.; Xu, Y.; Li, H.; Dai, M. A comparative study of the numerical scales and the prioritization methods in AHP. Eur. J. Oper. Res. 2008, 186, 229–242. [Google Scholar] [CrossRef]
  10. Ma, D.; Zheng, X. 9/9-9/1 scale method of AHP. In Proceedings of the 2nd International Symposium on the AHP, Pittsburgh, PA, USA, 11–14 August 1991; Volume 1, pp. 197–202. [Google Scholar]
  11. Salo, A.A.; Hämäläinen, R.P. On the measurement of preferences in the analytic hierarchy process. J. Multi-Criteria Decis. Anal. 1997, 6, 309–319. [Google Scholar] [CrossRef]
  12. Cavallo, B.; D’Apuzzo, L. A general unified framework for pairwise comparison matrices in multicriterial methods. Int. J. Intell. Syst. 2009, 24, 377–398. [Google Scholar] [CrossRef] [Green Version]
  13. Koczkodaj, W.W.; Szybowski, J. The limit of inconsistency reduction in pairwise comparisons. Int. J. Appl. Math. Comput. Sci. 2016, 26, 721–729. [Google Scholar] [CrossRef] [Green Version]
  14. Saaty, T.L. Axiomatic foundation of the analytic hierarchy process. Manag. Sci. 1986, 32, 841–855. [Google Scholar] [CrossRef]
  15. Shekhovtsov, A.; Rehman, N.; Faizi, S.; Sałabun, W. On the Analytic Hierarchy Process Structure in Group Decision-Making Using Incomplete Fuzzy Information with Applications. Symmetry 2021, 13, 609. [Google Scholar]
  16. Grzybowski, A.Z. New results on inconsistency indices and their relationship with the quality of priority vector estimation. Expert Syst. Appl. 2016, 43, 197–212. [Google Scholar] [CrossRef] [Green Version]
  17. Barzilai, J. Deriving weights from pairwise comparison matrices. J. Oper. Res. Soc. 1997, 48, 1226–1232. [Google Scholar] [CrossRef]
  18. Choo, E.U.; Wedley, W.C. A common framework for deriving preference values from pairwise comparison matrices. Comput. Oper. Res. 2004, 31, 893–908. [Google Scholar] [CrossRef]
  19. Crawford, G.B. The geometric mean procedure for estimating the scale of a judgement matrix. Math. Model. 1987, 9, 327–334. [Google Scholar] [CrossRef] [Green Version]
  20. Golany, B.; Kress, M. A multicriteria evaluation of methods for obtaining weights from ratio-scale matrices. Eur. J. Oper. Res. 1993, 69, 210–220. [Google Scholar] [CrossRef]
  21. Saaty, T.L.; Vargas, L.G. Comparison of eigenvalue, logarithmic least squares and least squares methods in estimating ratios. Math. Model. 1984, 5, 309–324. [Google Scholar] [CrossRef] [Green Version]
  22. Saaty, T.L. Decision-making with the AHP: Why is the principal eigenvector necessary. Eur. J. Oper. Res. 2003, 145, 85–91. [Google Scholar] [CrossRef]
  23. Siraj, S.; Mikhailov, L.; Keane, J.A. Preference elicitation from inconsistent judgments using multi-objective optimization. Eur. J. Oper. Res. 2012, 220, 461–471. [Google Scholar] [CrossRef]
  24. Aguaròn, J.; Moreno-Jiménez, J.M. The geometric consistency index: Approximated thresholds. Eur. J. Oper. Res. 2003, 147, 137–145. [Google Scholar] [CrossRef]
  25. Barzilai, J. Consistency measures for pairwise comparison matrices. J. Multi-Criteria Decis. Anal. 1998, 7, 123–132. [Google Scholar] [CrossRef]
  26. Brunelli, M.; Canal, L.; Fedrizzi, M. Inconsistency indices for pairwise comparison matrices: A numerical study. Ann. Oper. Res. 2013, 211, 493–509. [Google Scholar] [CrossRef]
  27. Brunelli, M. Recent Advances on Inconsistency Indices for Pairwise Comparisons—A Commentary. Fundam. Inform. 2016, 144, 321–332. [Google Scholar] [CrossRef] [Green Version]
  28. Koczkodaj, W.W. A new definition of consistency of pairwise comparisons. Math. Comput. Model. 1993, 18, 79–84. [Google Scholar] [CrossRef]
  29. Koczkodaj, W.W.; Szwarc, R. On axiomatization of inconsistency indicators for pairwise comparisons. Fundam. Inform. 2014, 132, 485–500. [Google Scholar] [CrossRef] [Green Version]
  30. Lamata, M.T.; Peláez, J.I. A method for improving the consistency of judgements. Int. J. Uncertain. Fuzziness Knowl.-Based Syst. 2002, 10, 677–686. [Google Scholar] [CrossRef]
  31. Peláez, J.I.; Lamata, M.T. A new measure of consistency for positive reciprocal matrices. Comput. Math. Appl. 2003, 46, 1839–1845. [Google Scholar] [CrossRef] [Green Version]
  32. Golden, B.L.; Wang, Q. An alternate measure of consistency. In The Analytic Hierarchy Process; Springer: Berlin/Heidelberg, Germany, 1989; pp. 68–81. [Google Scholar]
  33. Stein, W.E.; Mizzi, P.J. The harmonic consistency indicator for the analytic hierarchy process. Eur. J. Oper. Res. 2007, 177, 488–497. [Google Scholar] [CrossRef]
  34. Brunelli, M.; Fedrizzi, M. Boundary properties of the inconsistency of pairwise comparisons in group decisions. Eur. J. Oper. Res. 2015, 240, 765–773. [Google Scholar] [CrossRef] [Green Version]
  35. Brunelli, M. Studying a set of properties of inconsistency indices for pairwise comparisons. Ann. Oper. Res. 2017, 248, 143–161. [Google Scholar] [CrossRef] [Green Version]
  36. Yang, W.E.; Ma, C.Q.; Han, Z.Q.; Chen, W.J. Checking and adjusting order-consistency of linguistic pairwise comparison matrices for getting transitive preference relations. OR Spectr. 2016, 38, 769–787. [Google Scholar] [CrossRef]
  37. Siraj, S.; Mikhailov, L.; Keane, J.A. A heuristic method to rectify intransitive judgments in pairwise comparison matrices. Eur. J. Oper. Res. 2012, 216, 420–428. [Google Scholar] [CrossRef]
  38. Bozóki, S.; Rapcsak, T. On Saaty’s and Koczkodaj’s inconsistencies of pairwise comparison matrices. J. Glob. Optim. 2008, 42, 157–175. [Google Scholar] [CrossRef] [Green Version]
  39. Kwiesielewicz, M.; Van Uden, E. Inconsistent and contradictory judgements in pairwise comparison method in the AHP. Comput. Oper. Res. 2004, 31, 713–719. [Google Scholar] [CrossRef]
  40. Siraj, S.; Mikhailov, L.; Keane, J.A. Contribution of individual judgments toward inconsistency in pairwise comparisons. Eur. J. Oper. Res. 2015, 242, 557–567. [Google Scholar] [CrossRef] [Green Version]
  41. Akarte, M.M.; Surendra, N.V.; Ravi, B.; Rangaraj, N. Web based casting supplier evaluation using analytical hierarchy process. J. Oper. Res. Soc. 2001, 52, 511–522. [Google Scholar] [CrossRef]
  42. Forman, E.H.; Gass, S.I. The analytic hierarchy process—An exposition. Oper. Res. 2001, 49, 469–486. [Google Scholar] [CrossRef]
  43. Golden, B.L.; Wasil, E.A.; Harker, P.T. The Analytic Hierarchy Process: Applications and Studies; Springer: Berlin/Heidelberg, Germany, 1989. [Google Scholar]
  44. Ho, W. Integrated analytic hierarchy process and its applications–A literature review. Eur. J. Oper. Res. 2008, 186, 211–228. [Google Scholar] [CrossRef]
  45. Shim, J.P. Bibliographical research on the analytic hierarchy process (AHP). Socio-Econ. Plan. Sci. 1989, 23, 161–167. [Google Scholar] [CrossRef]
  46. Vaidya, O.S.; Kumar, S. Analytic hierarchy process: An overview of applications. Eur. J. Oper. Res. 2006, 169, 1–29. [Google Scholar] [CrossRef]
  47. Vargas, L.G. An overview of the analytic hierarchy process and its applications. Eur. J. Oper. Res. 1990, 48, 2–8. [Google Scholar] [CrossRef]
  48. Zahedi, F. The analytic hierarchy process—a survey of the method and its applications. Interfaces 1986, 16, 96–108. [Google Scholar] [CrossRef]
  49. Sugden, R. Why be consistent? A critical analysis of consistency requirements in choice theory. Economica 1985, 52, 167–183. [Google Scholar] [CrossRef]
  50. Alonso, J.A.; Lamata, M.T. Consistency in the analytic hierarchy process: A new approach. Int. J. Uncertain. Fuzziness Knowl.-Based Syst. 2006, 14, 445–459. [Google Scholar] [CrossRef] [Green Version]
  51. Ergu, D.; Kou, G.; Peng, Y.; Shi, Y. A simple method to improve the consistency ratio of the pair-wise comparison matrix in ANP. Eur. J. Oper. Res. 2011, 213, 246–259. [Google Scholar] [CrossRef]
  52. Ishizaka, A.; Lusti, M. An expert module to improve the consistency of AHP matrices. Int. Trans. Oper. Res. 2004, 11, 97–105. [Google Scholar] [CrossRef]
  53. Kou, G.; Ergu, D.; Shang, J. Enhancing data consistency in decision matrix: Adapting Hadamard model to mitigate judgment contradiction. Eur. J. Oper. Res. 2014, 236, 261–271. [Google Scholar] [CrossRef] [Green Version]
  54. Li, H.L.; Ma, L.C. Detecting and adjusting ordinal and cardinal inconsistencies through a graphical and optimal approach in AHP models. Comput. Oper. Res. 2007, 34, 780–798. [Google Scholar] [CrossRef]
  55. Vargas, L.G. The consistency index in reciprocal matrices: Comparison of deterministic and statistical approaches. Eur. J. Oper. Res. 2008, 191, 454–463. [Google Scholar] [CrossRef]
  56. Xu, W.J.; Dong, Y.C.; Xiao, W.L. Is It Reasonable for Saaty’s Consistency Test in the Pairwise Comparison Method? In Proceedings of the 2008 ISECS International Colloquium on Computing, Communication, Control, and Management, Guangzhou, China, 3–4 August 2008; Volume 3, pp. 294–298. [Google Scholar]
  57. Genest, C.; Zhang, S.S. A graphical analysis of ratio-scaled paired comparison data. Manag. Sci. 1996, 42, 335–349. [Google Scholar] [CrossRef]
  58. Gower, J.C. The analysis of asymmetry and orthogonality. In Recent Developments in Statistics; Barra, J.-R., Brodeau, F., Romier, G., Van Cutsem, B., Eds.; North-Holland: Amsterdam, The Netherlands, 1977; pp. 109–123. [Google Scholar]
  59. Kuo, T. An Ordinal Consistency Indicator for Pairwise Comparison Matrix. In Proceedings of the 2018 NTCB Conference for International Management Practices, National Taipei University of Business, Taipei, Taiwan, 21 December 2018; pp. 49–50. [Google Scholar]
  60. Saaty, T.L.; Peniwati, K. Group Decision Making: Drawing Out and Reconciling Differences; RWS Publications: Pittsburgh, PA, USA, 2013. [Google Scholar]
Figure 1. Relation of the upper bound of the SDR [ A ] and the size of a PC matrix A.
Symmetry 13 02183 g001
Figure 2. Relation of the upper bound of the NSDR [ A ] and the size of a PC matrix A.
Symmetry 13 02183 g002
Figure 3. SDR vs. CI.
Symmetry 13 02183 g003
Figure 4. Ordinal inconsistency of twenty-one CPC(x, 5) matrices with different values of x.
Symmetry 13 02183 g004
Figure 5. Ordinal inconsistency of twenty-one FPC(x, 5) matrices with different values of x.
Symmetry 13 02183 g005
Table 1. The upper bounds of the SDR [ A ] for PC matrix A of size n = 3 ~ 15 .
n 3456789101112131415
σ 1 ~ n 11.291.581.872.162.452.743.033.323.613.894.184.47
Table 2. The thresholds of the SDR [ A ] for a 3 × 3 PC matrix A.
p = 0.010.050.10.20.30.40.5
3-scales
4-scales
5-scales
6-scales
7-scales
8-scales
9-scales
S0.000.000.000.190.190.390.53
I0.000.000.000.190.190.390.53
B0.000.000.000.190.190.390.53
Table 3. Linear correlation between pairs of consistency indicators.
CISDRCI*GCIHCIREGWKIICD
CI10.7430.9670.9980.9330.7980.9240.7130.946
SDR0.74310.6190.7720.7050.8550.8450.8290.705
CI*0.9670.61910.9510.90.7160.8390.610.882
GCI0.9980.7720.95110.930.8130.9380.7440.943
HCI0.9330.7050.90.9310.7650.9370.6460.89
RE0.7980.8550.7160.8130.76510.8420.6960.734
GW0.9240.8450.8390.9380.9370.84210.8030.867
KI0.7130.8290.610.7440.6460.6960.80310.619
ICD0.9460.7050.8820.9430.890.7340.8670.6191
Publisher’s Note: MDPI stays neutral with regard to jurisdictional claims in published maps and institutional affiliations.