Article

Channel Modeling and Analysis for the Sensor Network Inside Tower Buildings

1
The Key Laboratory of Dynamic Cognitive System of Electromagnetic Spectrum Space, Ministry of Industry and Information Technology, Nanjing University of Aeronautics and Astronautics, Nanjing 211106, China
2
State Key Laboratory of Integrated Services Networks, Xidian University, Xi’an 710000, China
3
The Beijing Institute of Astronautical Systems Engineering, Beijing 100076, China
*
Author to whom correspondence should be addressed.
Symmetry 2021, 13(11), 2154; https://doi.org/10.3390/sym13112154
Submission received: 11 October 2021 / Revised: 28 October 2021 / Accepted: 29 October 2021 / Published: 11 November 2021
(This article belongs to the Special Issue Propagation Model Driven Spectrum Twin and Its Applications)

Abstract

:
Symmetry-based channel digital twin is a great technology which can reproduce the communication channel of real scenes for performance evaluation of the wireless sensor network (WSN) inside tower buildings, based on the ray tracing (RT) method and machine learning (ML) theories, a cluster-based channel model is proposed in this paper. Meanwhile, an improved k-means method, which considers the weight of different dimensions in the multipath component distance (MCD) is presented for clustering, which has better clustering performance over the sparsity-based algorithm and traditional k-means algorithm. Moreover, the channel parameters such as cluster delay and cluster power are also investigated. On this basis, the communication performance of WSN, i.e., bit error rate (BER) and channel capacity are derived and analyzed. The simulation and analysis results show that the cluster model based on the RT method can get approximately equivalent channel impulse response (CIR), and the BER of proposed model is consistent with the simulated one. These results can provide reference for the node layout and optimization of WSN inside tower buildings.

1. Introduction

Wireless sensor networks (WSN) are widely used in various fields, such as military reconnaissance, health care, and industrial automation, due to their low cost, low power consumption, and easy of deployment in a large area [1,2,3,4]. Meanwhile, tower structure has been widely used in a lot of buildings and bridges due to its excellent anti-seismic performance and low cost [5]. However, the communication link interruption often occurs in these tower buildings, which is extremely important for some special applications like rocket lunching. Since there is large proportion of metal material inside the tower building, the radio signal experiences strong reflection and serious multipath effect [6]. In addition, the tower building has a typical semi-closed and hollow-carved structure, where the signal can directly pass through. Therefore, the propagation channel inside tower building is different from the indoor channel [7,8,9,10], outdoor channel [11,12,13] and outdoor to indoor (O2I) channel [14]. On the other hand, the field measurement in the tower building would consume a lot of manpower and material resources, how to efficiently and economically use theoretical modeling to evaluate the communication system has become an important topic. Symmetry-based digital twin technology can reproduce the communication channel of a real scene in virtual network space by establishing an accurate channel model, which could play an important role in system design, optimization, and evaluation of WSN.
Since the communication between different sensor nodes has limited time resolution, some research works approximated the rays with similar time-of-arrival (ToA) as one cluster [15,16,17]. Meanwhile, the clustering method has a great influence on the cluster-based channel model, which has gained a lot of attentions [18,19,20,21,22,23]. At the very beginning, a visual inspection method was employed to identify clusters in [18], but this method was only suitable for low dimensions or small number of rays. Due to the complexity of channel data, several machine learning (ML)-based algorithms were presented, i.e., sparsity-based algorithm [19], density-based spatial clustering of applications with noise (DBSCAN) algorithm [20], and k-means algorithm [22,23,24,25,26]. Note that both the sparsity-based algorithm and DBSCAN algorithm requires prior cluster information, i.e., initial clustering reference and density threshold. However, it is difficult to exact the prior information from the realistic channel data. Recently, the k-means algorithm is widely adopted for its easy implementation and robustness. For example, the authors in [24] conducted the clustering analysis of multidimensional wind speed data based on Euclidean distance, but the traditional Euclidean distance cannot be used in the channel clustering directly since it did not consider the characteristic of channel parameters. Furthermore, the authors in [26] presented a multipath component distance (MCD) for channel clustering based on multiple dimensions, i.e., time of arrival, azimuth angle of arrival (AAoA), and elevation angle of arrival (EAoA). However, the weight of different dimensions in the MCD was not taken into account.
On the other hand, the analysis of communication performance is important for the WSN node placement. Several related works can be addressed in [27,28,29,30,31,32,33]. In [27,28,29], the authors proposed three different optimization algorithms to optimize the number and location of WSN nodes. The bit error rate (BER) with different modulation modes were studied in [30,31,32]. The authors in [33] discussed the influence of channel clustering on the channel capacity. However, the adopted channel in these literatures is pure additive white Gaussian noise channels or fading channels under other scenarios. To the best of our knowledge, the analysis of communication performance inside tower buildings is rarely studied. This paper intends to fill this research gap. The main contributions and innovations of this paper are generalized as follows:
(1)
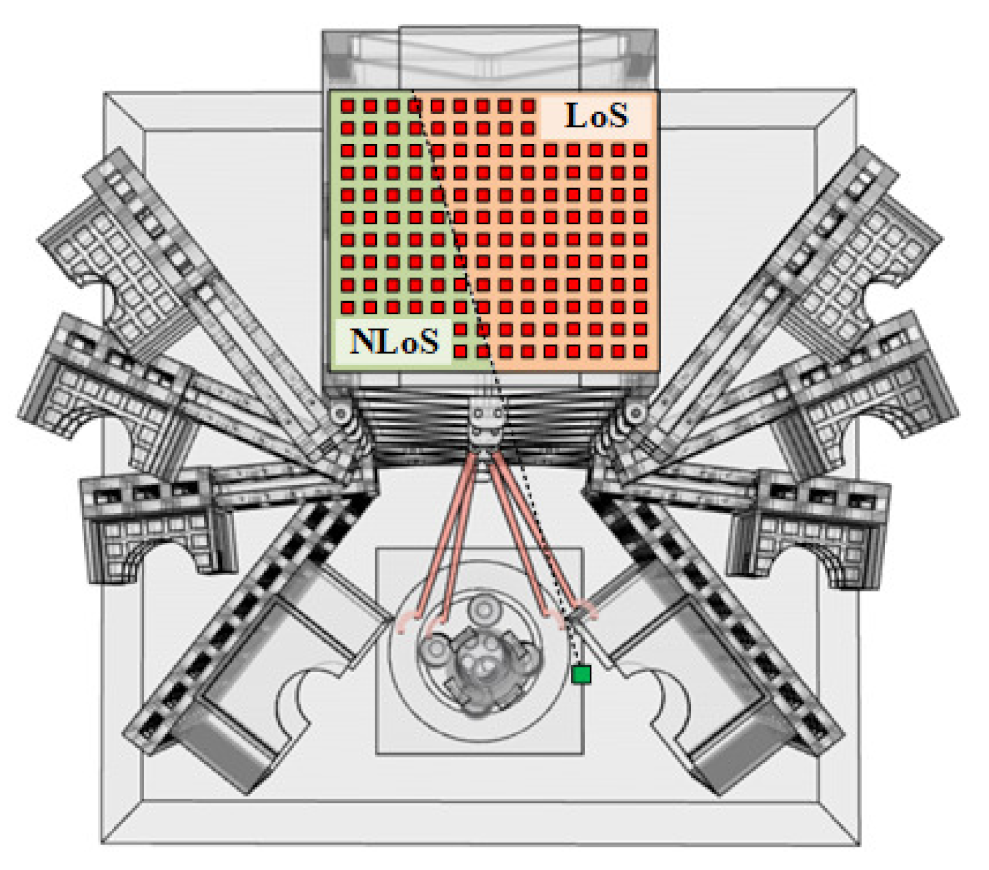
For performance evaluation of the WSN inside tower buildings, a cluster-based propagation channel model inside tower structure buildings is proposed based on the ray-based channel model, which greatly reduces the complexity to analyze the performance of the communication system.
(2)
An improved k-means algorithm is developed to cluster the channel, which could obtain approximately equivalent channel impulse response (CIR) with a ray-based channel model. The channel parameters such as cluster delay and cluster power are equivalently calculated according to the clustered rays. Moreover, the performance of WSN, i.e., BER and channel capacity are derived.
(3)
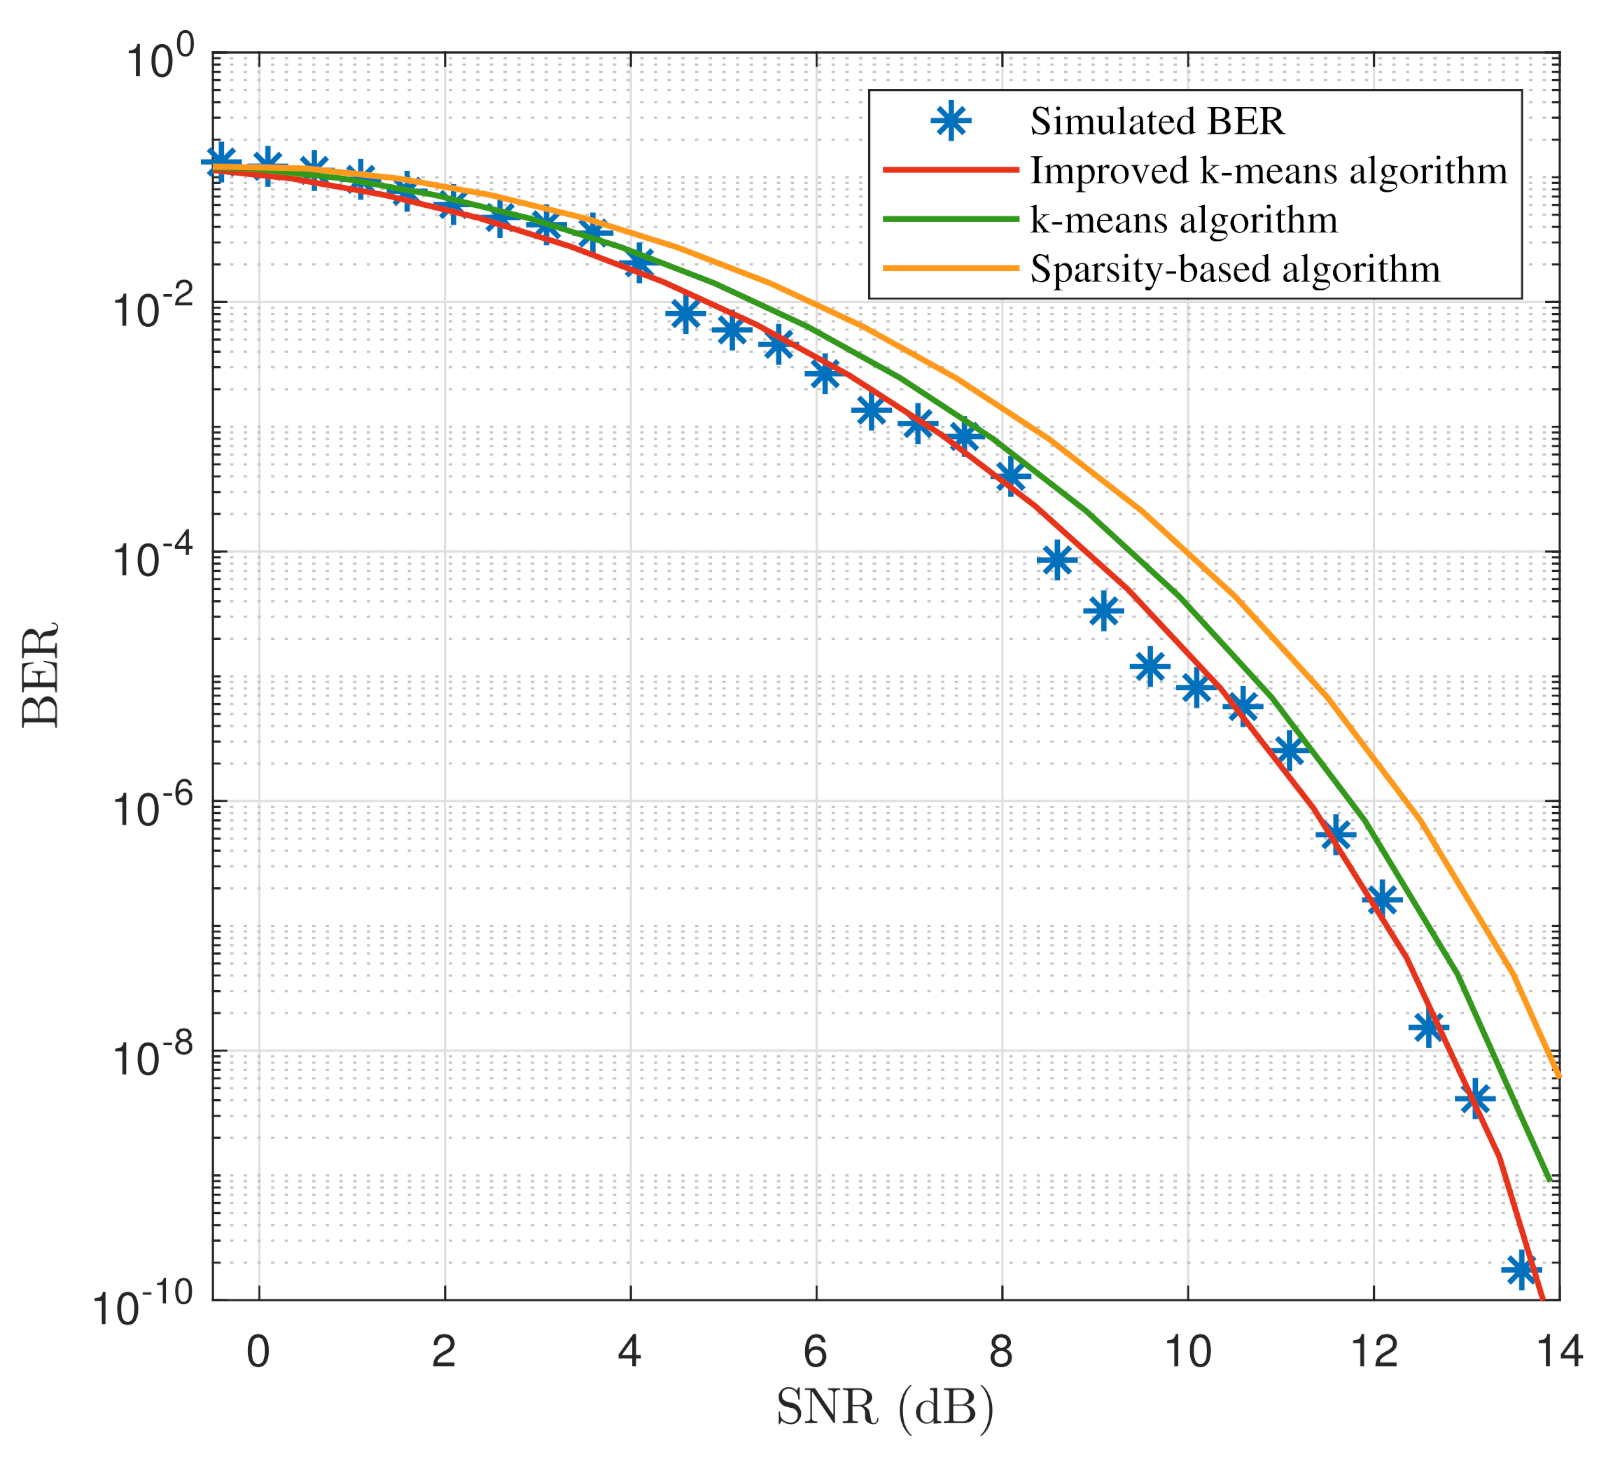
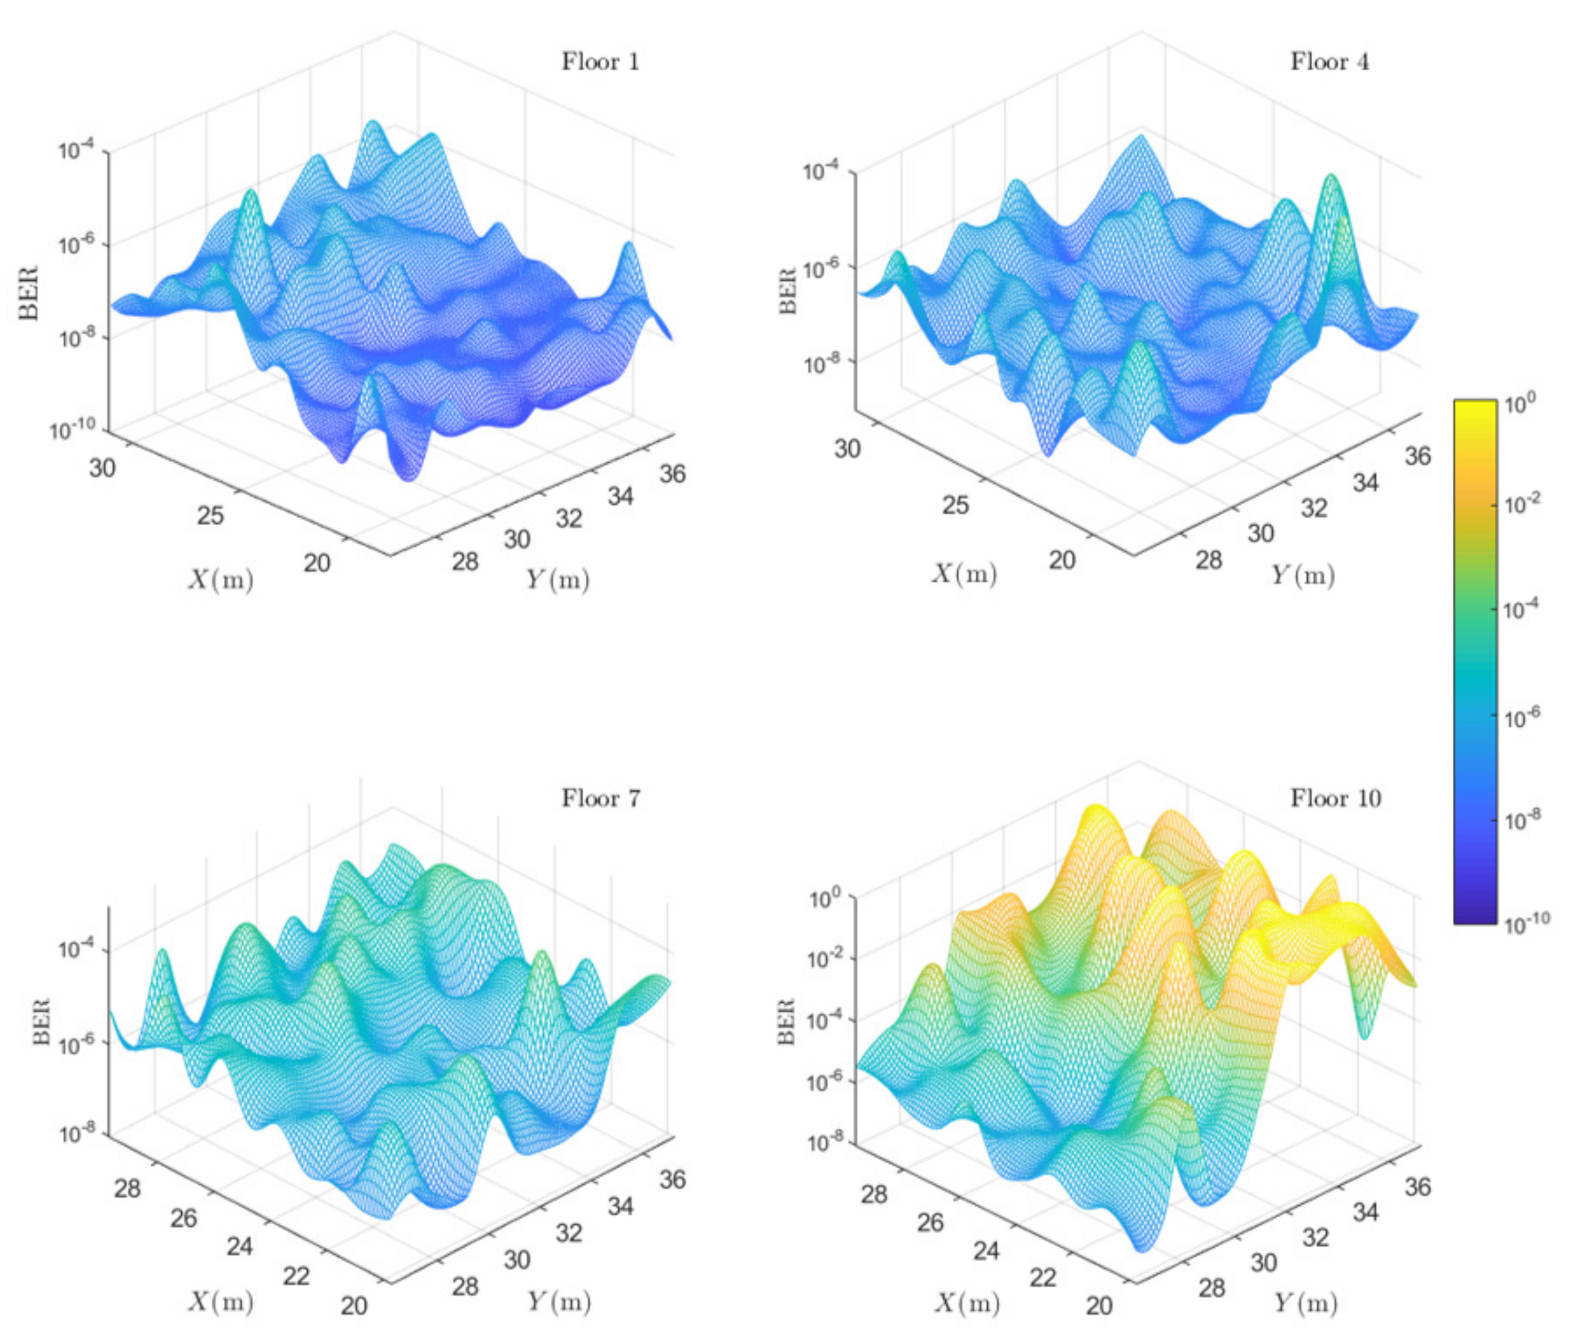
The simulation results for different positions at different heights of the reconstructed tower building at 1 GHz show that the cluster classification method and cluster parameter calculation method can get more approximate equivalent CIR, and the calculated BER on this basis is in good agreement with the theoretical results, which verifies the accuracy of the cluster model and theoretical derivation.
The rest of this paper is arranged as follows. In Section 2, a cluster-based channel model on the basis of the ray-based model is proposed. The improved k-means clustering algorithm and the cluster parameters of the channel are obtained and the performance analysis of the communication system is presented in Section 3. Simulation and validation results are conducted and analyzed in Section 4. Finally, some conclusions are given in Section 5.

2. Channel Model Inside Tower Buildings

Considering that the reflection on the metal surface of tower buildings has quasi-optical characteristic and the communication scenario of tower building is normally fixed, ray tracing (RT) method can be used to accurately model the channel inside tower building. RT method is a typical deterministic modeling method, where every possible propagation path is tracked, and channel parameters, i.e., power, delay, and angle of each ray can be calculated according to geometric optics theory and theory of diffraction [34]. The ray-based channel model can be modeled as a superposition of all effective rays as
h ( t , τ , α , β ) = m = 0 M a m e j ψ m δ t τ m δ α α m δ β β m
where M is the number of rays, a m , ψ m , and τ m denote the fading factor, random initial phase, and delay of m th ray, respectively, α m and β m denote the AAoA and EAoA, respectively [35].
However, it is complicated to analyze the communication performance of WSN by using (1) directly. In addition, the receiver in real communication system has limited time resolution due to the limited bandwidth. Therefore, ray-based model can be approximated as a cluster-based channel model to simplify the performance analysis. Thus, as shown in Figure 1, we rewritten the ray-based channel model as a superposition of several clusters as
h ( t , τ , α , β ) = n = 0 N a ¯ n e j ψ ¯ n δ t τ ¯ n δ α α ¯ n δ β β ¯ n
where N is the number of clusters, a ¯ n , ψ ¯ n , and τ ¯ n denote the fading factor, random initial phase, and delay of the n th cluster, respectively, α ¯ n and β ¯ n denote the AAoA and EAoA, respectively. It should be mentioned that the number of rays within different cluster is different.

3. Channel Clustering and Performance Analysis

3.1. ML-Based Channel Clustering

It is a key step to accurately cluster the propagation rays to several clusters for the cluster-based channel model. The existing k-means algorithm uses MCD instead of the traditional Euclidean distance to cluster the channel data. However, the different channel parameter has different effect weight on the MCD. In this paper, an improved k-means algorithm is used for clustering where the weight factors are introduced into the MCD as
M C D ( r i , r j ) = ξ ToA · M C D ToA ( r i , r j ) 2 + ξ AAoA · M C D AAoA ( r i , r j ) 2 + ξ EAoA · M C D EAoA ( r i , r j ) 2 1 2
where M C D ToA ( r i , r j ) 2 , M C D AAoA ( r i , r j ) 2 , and M C D EAoA ( r i , r j ) 2 denote the distance of ToA, AAoA, and EAoA of any two rays r i and r j , respectively, and ξ ToA , ξ AAoA , and ξ EAoA denote the weight coefficients of ToA, AAoA, and EAoA.
Moreover, it should be mentioned that the number of clusters k needs to be determined in advance for the traditional k-means algorithm. However, it is hard to manually determine the cluster number according to the complicated channel data. In this paper, the elbow method is used to determine the optimal number of clusters automatically [36]. The principle of elbow method is that with the increase of the number of clusters k, the value of SSE will follow the decreasing tendency. Before k reaches to the optimal number of clusters, SSE changes greatly with the increase of k. When SSE changes with the increase of k, i.e., the slope of SSE is low enough, the first corresponding k is chose as the optimal cluster number (also called elbow point). The SSE is defined as, and the elbow curve is determined by calculating the sum of squares of errors (SSE)
S S E k = i = 1 k m = 1 M i M C D r m , c i
where M i means there are M rays in kth cluster, r m and c i means mth ray in kth cluster and the centroid of this cluster, respectively. The centroid of this cluster c i can be calculated as
c i = 1 M k r i R i r i .

3.2. Cluster-Based Channel Parameters

After the ray-based channel is clustered into cluster-based one, it is an important step to calculate the equivalent cluster parameters according to the ray parameters. According to the law of energy conservation, the total power of nth cluster P ¯ n can be equal to the vector superposition of the ray powers, which can be expressed as
P ¯ n = a ¯ 2 n = 20 log 10 m = 0 M ( n ) 10 a n , m 2 10
where a n , m denotes the fading factor of mth ray within nth cluster. In addition, the delay of nth cluster τ ¯ n can be calculated based on the power weight of each ray, which can be expressed as
τ ¯ n = m = 0 M ( n ) a n , m 2 · τ n , m m = 0 M ( n ) a n , m 2 .
Taking a specific receiver inside tower building as an example, the ToA, AAoA, and EAoA of each ray are obtained from RT simulation data, and the channel data is clustered based on the improved clustering algorithm. With the Clustering number k varing from 2 to 10, the corresponding SSE is recorded in Table 1. It can be found that the SSE has the decrease trend with the increase of cluster number. According to the elbow method, we choose k = 7 is the optimal cluster number since the SSE would not change too much afterwards.
Meanwhile, the original rays, the clustering results of traditional k-means algorithm and improved k-means algorithm are shown in Figure 2, respectively. It can be found that the channel is well clustered with the optical clustering number k = 7 , and the improved k-means algorithm outperforms the traditional one. Meanwhile, the cluster delay τ ¯ n and power P ¯ n was calculated according to (6) and (7). It should be mentioned that the rays with same color belong to the same cluster.

3.3. Equivalent Performance Evaluation

BER is an important index to evaluate the performance of wireless communication system. Assuming that the transmitting signal is s ( t ) = Re s ˜ t exp j 2 π f c t , the propagation distance of nth path is x n , the received signal can be represented as
y ( t ) = n = 0 N Re s ˜ ( t x n c ) exp j 2 π f c t x n c + n ˜ ( t ) = Re y ˜ t exp j 2 π f c t + n ˜ ( t )
where c represents the speed of light and n ˜ ( t ) represents the additive environmental noise. The complex envelope of the received signal can be expressed as the superposition of paths with different cluster attenuation and cluster delay, which is expressed as
y ˜ ( t ) = n = 0 N a ¯ n exp j 2 π f c x n c s ˜ t x n c = n = 0 N a ¯ n exp j 2 π f c τ ¯ n s ˜ t τ ¯ n .
It is assumed that the instantaneous signal to noise ratio (SNR) of received signals is r and quadrature phase shift keying (QPSK) modulation is adopted in the wireless communication system, the BER of the system P e at this time can be expressed as
P e r = P 0 / 1 P 1 + P 1 / 0 P 0 .
Assuming the channel noise variance σ n 2 = 1 , and there are k terms of inter-symbol interference, which are denoted by z k , the BER of the system can be expressed as
P e = p ( y < 0 ) = E z [ Q ( s 0 + z k ) ]
where E z [ · ] is the expected value of the random variable z. Since it is difficult to implement the above equation directly, we use the trigonometric approximation to solve the performance of QPSK system with inter-symbol interference. Note that with the increase of the modulation code scheme M, the BER will increase, but the amount of information carried by a single symbol will also increase, and the infor-mation rate will be higher. The trigonometric series approximation of Q function can be expressed as
Q ^ ( x ) = i = 0 N T 1 c i e λ i x cos ( ω i x ) = Re [ i = 0 N T 1 c i e λ i x + j ω i x ]
where c i , λ i , and ω i are undetermined coefficients, N T denotes order and when N T 7 , it meets the requirement of general calculation precision. When σ n 2 = 1 , the effective SNR can be simplified to s 0 2 . In combination with (11) and (12), it can be deduced
P e Re i = 0 N T 1 c i e ( λ i + j ω i ) s 0 k = , k 0 cosh ( ( λ i + j ω i ) s k ) .
The channel capacity is another important evaluation index for the communication system, which represents the maximum amount of information that can be transmitted in the channel. According to Shannon’s theorem, when the transmission rate of the transmitted signal is lower than the capacity of the channel, there is a possible way to transmit the signal through the channel without error. Due to the influence of path loss and serious multipath fading inside tower building, the channel capacity would be greatly affected. The definition of channel capacity can be expressed as
C = 1 2 log 2 ( 1 + r )
where the system bandwidth is normalized, and the channel capacity unit is bit / s · Hz . The instantaneous SNR distribution of the received signal r can be expressed as
r = 10 lg n = 0 N P ¯ n σ n 2 .

4. Simulation Results and Validation

In order to verify the performance of the proposed clustering algorithms and the derivation of communication system performance, the RT simulation data were obtained based on the reconstructed 3D scenario of tower building which was completed with 3D design software SolidWorks and SketchUp at 1 GHz. As shown in Figure 1, the tower building has 11 floors with the height of 108.2 m. The TX antenna is placed on the edge of the tower building at the height of 5 m. 168 receiving antennas are uniformly placed at the heights of 3.5 m and 22 m, i.e., Floor 1 and Floor 4, and 132 receiving antennas are uniformly placed at the heights of 40 m and 58.5 m, i.e., Floor 7 and Floor 10, respectively. The electromagnetic simulation software used in this paper is Wireless Insite. The simulation parameters are listed in Table 2.
Take the sensors at the center of above four floors as an example, the equivalent CIRs are obtained by using a different clustering algorithm and proposed cluster parameter calculation method based on the RT simulation data as shown in Figure 3. It can be seen from the figure that, with the increase height of receiving antenna, the number of rays and the received power would decrease. Moreover, it can be seen that the line-of sight (LoS) path exists when the receiver is located on the first floor, while LoS path disappears when the receiver is located on the high floor. It should be mentioned that it is hard to compare the clustering performance by CIRs directly, thus the calculated communication performance, i.e., BER or channel capacity can be used to indirectly evaluate the performance of different clustering algorithm.
Take a sensor at the first floor as an example, QPSK modulation is used in the simulation, the BER curve of ray-based channel and the BER curves of cluster-based channel obtained by using three clustering algorithms are shown in Figure 4. According to (6) and (7), under the same SNR condition, the BER of cluster-based channel with improved k-means algorithm is smaller than that the ones of traditional k-means algorithm and sparsity algorithm. In addition, since different clustering algorithms are used to cluster rays received by receiver, cluster parameters, such as cluster delay and cluster power are different, and the theoretical BER derived is also different. As can be seen that the BER curve of the improved K-means algorithm is consistent with the simulated BER curve of RT algorithm, it can be considered that the clustering performance of improved K-means algorithm is better than other clustering algorithms.
The 3D BER curves at different positions of four different floor are shown in Figure 5. The transmitter is placed on the right side of the rocket, as shown in Figure 6. For the sensors on the first floor, it can be seen from Figure 5 that the LoS path exists at the right side of the sensors while disappears at the left side of sensors. Thus the BERs of sensors at the right side are better than the ones of left side. For the sensors on floors 4, 7, and 10, there is rarely LoS path. Therefore, the BERs of sensors at these floors are poorer than the one on the first floor. Since the sensors at the back of floor 10 are really far from the transmitter, the BER of which is much poorer. By studying the BER performance, the WSN can be placed in the position with low BER so as to optimize the layout of WSN inside the tower buildings.
In addition, the communication performance of different sensors varies greatly. In order to evaluate the communication performance of different sensors, the channel capacity at different positions of four different floor is also simulated and shown in Figure 7. For the sensors on the first floor, it can be seen that the channel capacity is the highest at coordinate (18.4, 33.3) due to the existence of LoS path, which is up to 24.27 bits/s/Hz. At the same bandwidth, the SNR generally decreases with the increase of height, and the channel capacity is positively correlated with the SNR, and it drops to 0.01 bits/s/Hz at coordinate (20.7, 34.3) of the tenth floor. As we can see, the performance of channel capacity and BER is relatively consistent and has great reference significance to set the receiver sensors.

5. Conclusions

In this paper, a cluster-based channel model has been proposed based on the RT and ML methods. Meanwhile, an improved k-means clustering has been developed to cluster the rays and the equivalent parameters, i.e., cluster delay and cluster power are also calculated. The communication performances, i.e., BER and channel capacity, have been derived and validated based on the reconstructed tower building at 1 GHz. The simulation results have shown that the improved k-means clustering algorithm outperforms the traditional ones and the BER is in good agreement with the simulated one. The proposed model and simulation method can be used to evaluate the performance of communication system inside the tower buildings and provide theoretical basis for the layout and optimization of WSN nodes. Note that channel model and analysis method are also suitable for the multi-scatterer scene.

Author Contributions

Conceptualization, W.X. and X.C.; methodology, K.M.; software, W.X. and Y.L.; validation, X.C., L.Y. and S.F.; formal analysis, X.C.; investigation, W.X. and K.M.; resources, X.C.; writing—original draft preparation, W.X.; writing—review and editing, X.C. and K.M.; supervision, X.C. All authors have read and agreed to the published version of the manuscript.

Funding

This research was funded in part by ISN State Key Laboratory fund (No. ISN22-11), and Open Foundation for Graduate Innovation of NUAA (No. KFJJ20200416).

Institutional Review Board Statement

Not applicable.

Informed Consent Statement

Not applicable.

Data Availability Statement

Not applicable.

Conflicts of Interest

The authors declare no conflict of interest.

References

  1. You, G.; Zhu, Y. Structure and Key Technologies of Wireless Sensor Network. In Proceedings of the Cross Strait Radio Science & Wireless Technology Conference (CSRSWTC), Fuzhou, China, 13–16 December 2020; pp. 1–2. [Google Scholar]
  2. Jawhar, Q.; Thakur, K.; Singh, K.J. Recent Advances in Handling Big Data for Wireless Sensor Networks. IEEE Potentials 2020, 39, 22–27. [Google Scholar] [CrossRef]
  3. Farsi, M.; Elhosseini, M.A.; Badawy, M.; Ali, H.A.; Eldin, H.Z. Deployment Techniques in Wireless Sensor Networks, Coverage and Connectivity: A Survey. IEEE Access 2019, 7, 28940–28954. [Google Scholar] [CrossRef]
  4. Qi, N.; Miridakis, N.I.; Xiao, M.; Tsiftsis, T.A.; Yao, R.; Jin, S. Traffic-aware two-stage queueing communication networks: Queue analysis and energy saving. IEEE Trans. Commun. 2020, 68, 4919–4932. [Google Scholar] [CrossRef] [Green Version]
  5. Zhaona, C. Analysis on Construction Technology and Quality Control Measures of Building Steel Structure. In Proceedings of the International Conference on Urban Engineering and Management Science(ICUEMS), Sanya, China, 29–31 January 2021; pp. 306–309. [Google Scholar]
  6. Huang, Z.; Li, Y.; Chen, R.; Yang, M. Clustering Analysis of Multipath Components in Urban Road Scenario for C-V2X Propagation Channels. In Proceedings of the International Symposium on Antennas, Propagation and EM Theory (ISAPE), Hangzhou, China, 3–6 December 2018; pp. 1–3. [Google Scholar]
  7. Ning, G.; Ma, S.; Guo, Y.; Wang, Q. Prediction of Indoor Wireless LAN Field Strength Distribution Based on Ray Tracing Method. In Proceedings of the 2019 4th International Conference on Mechanical, Control and Computer Engineering (ICMCCE), Hohhot, China, 24–26 October 2019; pp. 656–6563. [Google Scholar]
  8. Wen, J.; Zhang, Y.; Yang, G.; He, Z.; Zhang, W. Path Loss Prediction Based on Machine Learning Methods for Aircraft Cabin Environments. IEEE Access 2019, 7, 159251–159261. [Google Scholar] [CrossRef]
  9. Cuinas, I.; Sanchez, M.G. A Comparison of Empirical and Ray-Tracing Models for Indoor Radio-Wave Propagation [Wireless Corner]. IEEE Antennas Propag. Mag. 2020, 62, 107–115. [Google Scholar] [CrossRef]
  10. Li, Y.; Zhang, J.; Tang, P.; Tian, L. Clustering in the wireless channel with a power weighted statistical mixture model in indoor scenario. China Commun. 2019, 16, 83–95. [Google Scholar] [CrossRef]
  11. Zhu, Q.; Li, H.; Fu, Y.; Wang, C.H.; Tan, Y.; Chen, X.; Wu, Q. A Novel 3D Non-stationary Wireless MIMO Channel Simulator and Hardware Emulator. IEEE Trans. Commun. 2018, 66, 3865–3878. [Google Scholar] [CrossRef]
  12. Zhu, Q.; Zhao, Z.; Mao, K.; Chen, X.; Liu, W.; Wu, Q. A Real-Time Hardware Emulator for 3D Non-Stationary U2V Channels. IEEE Trans. Circuits Syst. Regul. Pap. 2021, 68, 3951–3964. [Google Scholar] [CrossRef]
  13. Kristem, V.; Bas, C.U.; Wang, R.; Molisch, A.F. Outdoor Wideband Channel Measurements and Modeling in the 3–18 GHz Band. IEEE Trans. Wirel. Commun. 2018, 17, 4620–4633. [Google Scholar] [CrossRef]
  14. Pratschner, S.; Blazek, T.; Groll, H.; Caban, S.; Schwarz, S.; Rupp, M. Measured User Correlation in Outdoor-to-Indoor Massive MIMO Scenarios. IEEE Access 2020, 8, 178269–178282. [Google Scholar] [CrossRef]
  15. He, R.; Ai, B.; Molisch, A.F.; Stuber, G.L.; Li, Q.; Zhong, Z.; Yu, J. Clustering Enabled Wireless Channel Modeling Using Big Data Algorithms. IEEE Commun. Mag. 2018, 56, 177–183. [Google Scholar] [CrossRef]
  16. Antonescu, B.; Moayyed, M.T.; Basagni, S. Outdoor mmWave Channel Propagation Models using Clustering Algorithms. In Proceedings of the International Conference on Computing, Networking and Communications (ICNC), Big Island, HI, USA, 17–20 February 2020; pp. 860–865. [Google Scholar]
  17. Bhaumik, S.; Prokes, A.; Chandra, A. Combined K-Means and Amplitude Clustering of Impulse Response for 60 GHz Vehicular Channels. In Proceedings of the International Symposium on Wireless Communication Systems (ISWCS), Lisbon, Portugal, 28–31 August 2018; pp. 1–5. [Google Scholar]
  18. Vuokko, L.; Vainikainen, P.; Takada, J.-I. Clusters extracted from measured propagation channels in macrocellular environments. IEEE Trans. Antennas Propag. 2005, 53, 4089–4098. [Google Scholar] [CrossRef]
  19. Ning, B.; Li, T.; Mao, K.; Chen, X.; Wang, M.; Zhong, W.; Zhu, Q. A UAV-aided channel sounder for air-to-ground channel measurements. Phys. Commun. 2021, 47, 101366. [Google Scholar] [CrossRef]
  20. Gan, M.; Xu, Z.; Mecklenbräuker, C.F.; Zemen, T. Cluster lifetime characterization for vehicular communication channels. In Proceedings of the European Conference on Antennas and Propagation (EuCAP), Lisbon, Portugal, 13–17 April 2015; pp. 1–5. [Google Scholar]
  21. Huang, C.; He, R.; Ai, B.; Yang, M.; Geng, Y.; Zhong, Z. Clustering Performance Evaluation Algorithm for Vehicle-to-Vehicle Radio Channels. In Proceedings of the European Conference on Antennas and Propagation (EuCAP), Copenhagen, Denmark, 15–20 March 2020; pp. 1–4. [Google Scholar]
  22. Lin, J.; Li, D.; Zhang, S.; Zhu, J. DOA Clustering-based Channel Estimation for Mitigating Pilot Contamination in Massive MIMO System. In Proceedings of the International Conference on Wireless Communications and Signal Processing (WCSP), Nanjing, China, 21–23 October 2020; pp. 945–950. [Google Scholar]
  23. Huang, Z.; Cheng, X. A General 3D Space-Time-Frequency Non-Stationary Model for 6G Channels. IEEE Trans. Wirel. Commun. 2020, 20, 535–548. [Google Scholar] [CrossRef]
  24. Yesilbudak, M. Clustering analysis of multidimensional wind speed data using k-means approach. In Proceedings of the IEEE International Conference on Renewable Energy Research and Applications (ICRERA), Birmingham, UK, 20–23 November 2016; pp. 961–965. [Google Scholar]
  25. Zhang, J.; Liu, L.; Fan, Y.; Zhuang, L.; Zhou, T.; Piao, Z. Wireless channel propagation scenarios identification: A perspective of machine learning. IEEE Access 2020, 8, 47797–47806. [Google Scholar] [CrossRef]
  26. Moayyed, M.T.; Antonescu, B.; Basagni, S. Clustering Algorithms and Validation Indices for mmWave Radio Multipath Propagation. In Proceedings of the Wireless Telecommunications Symposium (WTS), New York, NY, USA, 9–12 April 2019; pp. 1–7. [Google Scholar]
  27. Tingli, X.; Hongiun, W.; Yingchun, S. Hybrid WSN Node Deployment optimization Strategy Based on CS Algorithm. In Proceedings of the Information Technology, Networking, Electronic and Automation Control Conference (ITNEC), Chengdu, China, 15–17 March 2019; pp. 621–625. [Google Scholar]
  28. Han, Y.; Byun, H.; Yang, B.; Kim, J.H.; Lee, T.H. Optimization of Sensor Nodes Deployment Based on An Improved Differential Evolution Algorithm for Coverage Area Maximization. In Proceedings of the 2019 IEEE 4th Advanced Information Technology, Electronic and Automation Control Conference (IAEAC), Chengdu, China, 20–22 December 2019; pp. 250–254. [Google Scholar]
  29. Qi, N.; Xiao, M.; Tsiftsis, T.A.; Yao, R.; Mumtaz, S. Energy efficient two-tier network-coded relaying systems considering processing energy costs. IEEE Trans. Veh. Technol. 2018, 68, 999–1003. [Google Scholar] [CrossRef]
  30. Ranjan, K.A.; Sehgal, A.; Singh, P.K.; Singh, D.K. BER Based Impact Analysis of Jamming Signals for Fading Channels. In Proceedings of the International Conference on Automation and Computational Engineering (ICACE), Greater Noida, India, 3–4 October 2018; pp. 224–228. [Google Scholar]
  31. Dawa, M.; Kaddoum, G.; Herceg, M. A Framework for the Lower Bound on the BER of DCSK Systems Over Multi-Path Nakagami-m Fading Channels. IEEE Trans. Circuits Syst. II Express Briefs 2019, 67, 1859–1863. [Google Scholar] [CrossRef]
  32. Jihua, H.; Shikai, S.; Xingyuan, C. Modeling and Studying of the 16-QAM Based System over the Fading Channel. In Proceedings of the IEEE 3rd International Conference on Cloud Computing and Internet of Things (CCIOT), Dalian, China, 20–21 October 2018; pp. 214–216. [Google Scholar]
  33. Li, K.; Ingram, M.A.; Nguyen, A.V. Impact of clustering in statistical indoor propagation models on link capacity. IEEE Trans. Wirel. Commun. 2002, 50, 521–523. [Google Scholar]
  34. Li, S.; Liu, Y.; Yao, L.; Cao, W. Improved Channel Model and Analysis of the Effect of Bodies in Curved Tunnel Using Ray Tracing. IEEE Antennas Wirel. Propag. Lett. 2020, 19, 1162–1166. [Google Scholar] [CrossRef]
  35. Li, J.; Jiang, D.; Zhang, X. DOA Estimation Based on Combined Unitary ESPRIT for Coprime MIMO Radar. IEEE Commun. Lett. 2017, 21, 96–99. [Google Scholar] [CrossRef]
  36. Aslam, A.; Qamar, U.; Khan, R.A.; Saqib, P. Improving K-Mean Method by Finding Initial Centroid Points. In Proceedings of the 2020 22nd International Conference on Advanced Communication Technology (ICACT), Phoenix Park, Korea, 16–19 February 2020; pp. 624–627. [Google Scholar]
Figure 1. Propagation rays and clusters inside the tower buildings.
Symmetry 13 02154 g001
Figure 2. Clustering results of different algorithms: (a) Original rays of RT simulation data; (b) Traditional k-means algorithm and (c) Improved k-means algorithm.
Symmetry 13 02154 g002
Figure 3. Simulated and clustered CIRs: (a) Floor 1; (b) Floor 4; (c) Floor 7 and (d) Floor 10.
Symmetry 13 02154 g003
Figure 4. BER results of different methods.
Symmetry 13 02154 g004
Figure 5. BERs of different floors.
Symmetry 13 02154 g005
Figure 6. Vertical view of tower structure building.
Symmetry 13 02154 g006
Figure 7. Channel capacity of different floors.
Symmetry 13 02154 g007
Table 1. The Clustering Number and its Normalized SSE.
Clustering Number k2345678910
Normalized SSE value of k-means algorithm1.000.520.260.290.320.160.180.170.16
Normalized SSE value of improved k-means algorithm1.000.350.370.330.480.110.140.130.12
Table 2. Simulation Parameters.
ParameterValue
Frequency1 GHz
Transmitting power20 dBm
Antenna typeIsotropic antenna
Polarization typeVertical polarization
TX antenna location5 m
RX antenna location3.5 m, 22 m, 40 m, 58.5 m
Simulation materialMetal
Maximum number of reflections6
Maximum number of diffractions1
Publisher’s Note: MDPI stays neutral with regard to jurisdictional claims in published maps and institutional affiliations.

