Article

Effectiveness of Focal Loss for Minority Classification in Network Intrusion Detection Systems

Department of Electronic and Computer Engineering, National Taiwan University of Science and Technology, Taipei 10607, Taiwan
*
Author to whom correspondence should be addressed.
Symmetry 2021, 13(1), 4; https://doi.org/10.3390/sym13010004
Submission received: 30 November 2020 / Revised: 16 December 2020 / Accepted: 19 December 2020 / Published: 22 December 2020

Abstract

:
As the rapid development of information and communication technology systems offers limitless access to data, the risk of malicious violations increases. A network intrusion detection system (NIDS) is used to prevent violations, and several algorithms, such as shallow machine learning and deep neural network (DNN), have previously been explored. However, intrusion detection with imbalanced data has usually been neglected. In this paper, a cost-sensitive neural network based on focal loss, called the focal loss network intrusion detection system (FL-NIDS), is proposed to overcome the imbalanced data problem. FL-NIDS was applied using DNN and convolutional neural network (CNN) to evaluate three benchmark intrusion detection datasets that suffer from imbalanced distributions: NSL-KDD, UNSW-NB15, and Bot-IoT. The results showed that the proposed algorithm using FL-NIDS in DNN and CNN architecture increased the detection of intrusions in imbalanced datasets compared to vanilla DNN and CNN in both binary and multiclass classifications.

1. Introduction

The recent rapid development of information and communication technology systems that offers limitless access to data has been changing internet behavior. As huge amounts of data are accessed by internet users in a relatively short time, the risk of malicious violations, such as unauthorized access to the network, increases. A network intrusion detection system (NIDS) is used to prevent unauthorized access. It is able to aid abnormal traffic diagnosis and predict the type of attack in the network. In addition, NIDS is robust to the rapid changes of attack classes. The robustness of NIDS largely affects the effectiveness of intrusion detection. NIDS works by analyzing and classifying the passing traffic data. Once the attack is identified, NIDS classifies the type of attack. Traditional approaches have been employed to identify and classify the type of attack using shallow machine learning methods, such as support vector machine, decision tree, and naïve Bayes [1,2,3]. The effectiveness of the approaches has been evaluated using several benchmark datasets, such as KDD99 and Tokyo2016+, and they have obtained an intrusion detection accuracy of up to 97.41%. In addition, due to its increasing popularity in recent years, the neural network model has gained attention as an alternative to NIDS [4,5,6,7,8]. Neural network models, such as convolution neural network (CNN), recurrent neural network, and deep neural network (DNN), have been evaluated and applied to benchmark datasets. The deep model can obtain an intrusion detection accuracy of up to 99%, which is higher than that of shallow machine learning.
Despite the high accuracy obtained by shallow machine learning and deep neural network, NIDS models suffer high false-positive alarm rates and lower intrusion detection rates due to imbalanced datasets [9]. The data imbalance problem in datasets refers to the condition in which the distribution of classes is underrepresented. This condition occurs when one majority class is significantly outnumbered compared to the minority class, and the ratios can reach 1:100, 1:1000, or higher [10,11]. For instance, we have previously evaluated three benchmark NIDS real-world datasets: NSL-KDD [12], UNSW-NB15 [13], and Bot-IoT [14]. 
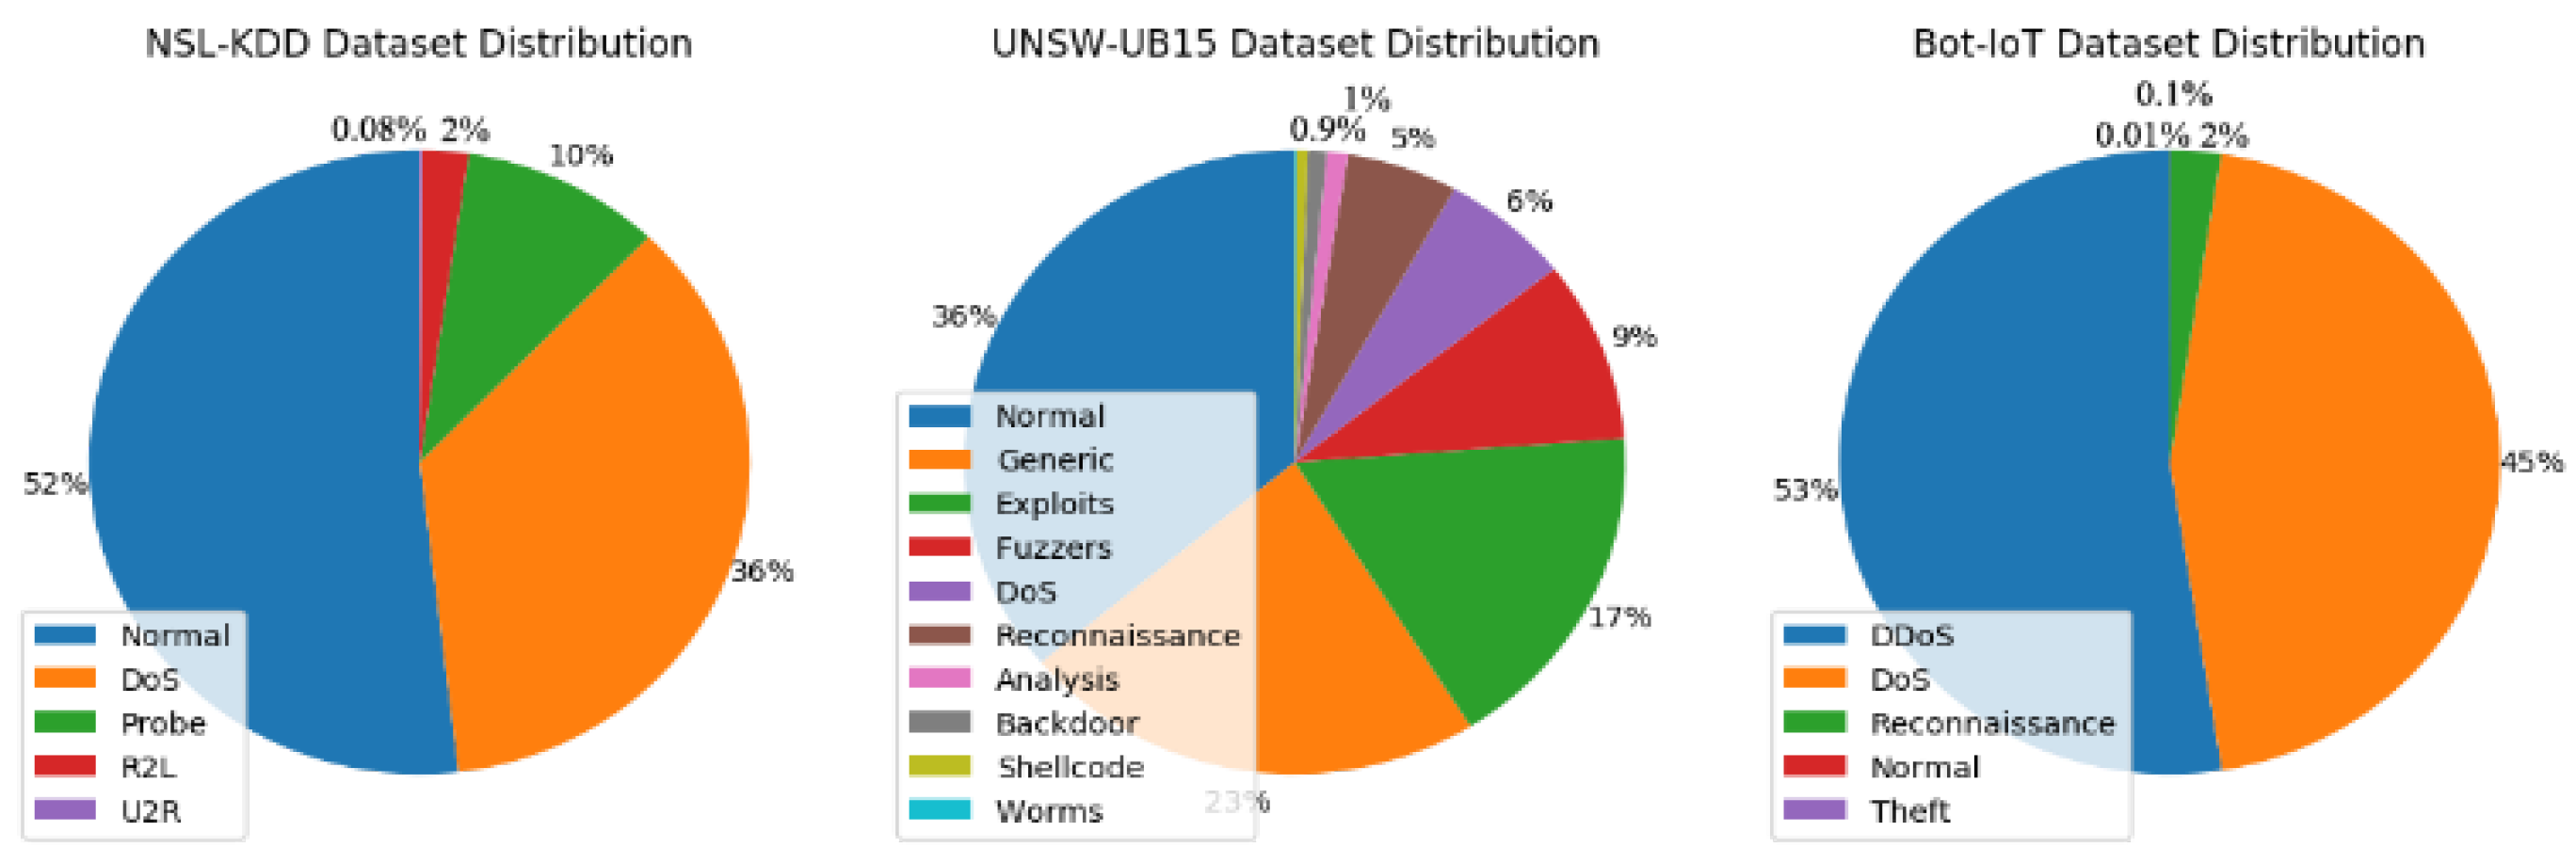
Figure 1 visualizes the distribution of each dataset. As can be seen, all suffer from high-class imbalance. The imbalance ratio reaches 1:534 between the majority and minority classes in the UNSW-NB15 dataset, while the highest imbalance ratio suffered by Bot-IoT is 1:26,750. Table 1 shows a complete description of the three benchmark datasets. This significant ratio of classes may mislead and bias the NIDS model during intrusion detection. Therefore, the minority class is not adequately learned, even in binary-class problems or multiclass classification [15,16,17].
Typically, there are two commons techniques when dealing with the imbalanced data problem: the data level technique and the algorithm level technique [18]. The data level technique focuses on manipulating an imbalanced dataset to balance the distribution of the classes. The dataset is modified by adding repetitive data (oversampling) for the minority class and removing data (undersampling) for the majority class [19,20]. The most popular algorithm that uses the data level technique to cope with imbalanced data is the synthetic minority oversampling technique (SMOTE) [21]. SMOTE works by generating synthetic data via oversampling of the minority class in its feature space interpolation. The minority class is oversampled in the region of the line segment between the samples by utilizing k-nearest neighbors. The number of generated samples depends highly on the imbalanced dataset, and the samples are used to balance the dataset. On the other hand, an algorithm level technique modifies cost matrices using cost-sensitive learning to misclassify the data sample [10,22]. Cost-sensitive learning mainly focuses on the misclassified minority by directly modifying the reweighting value in the learning procedures. The learning costs are represented as a cost matrix to evaluate the ability of a trained network so that misclassification is reduced [23]. Moreover, in cost-sensitive learning, more attention is given to the existing algorithm by weighting the minority class [24]. In the evaluation of imbalanced datasets, the neural network tends to misclassify the majority samples with high average classification accuracy [
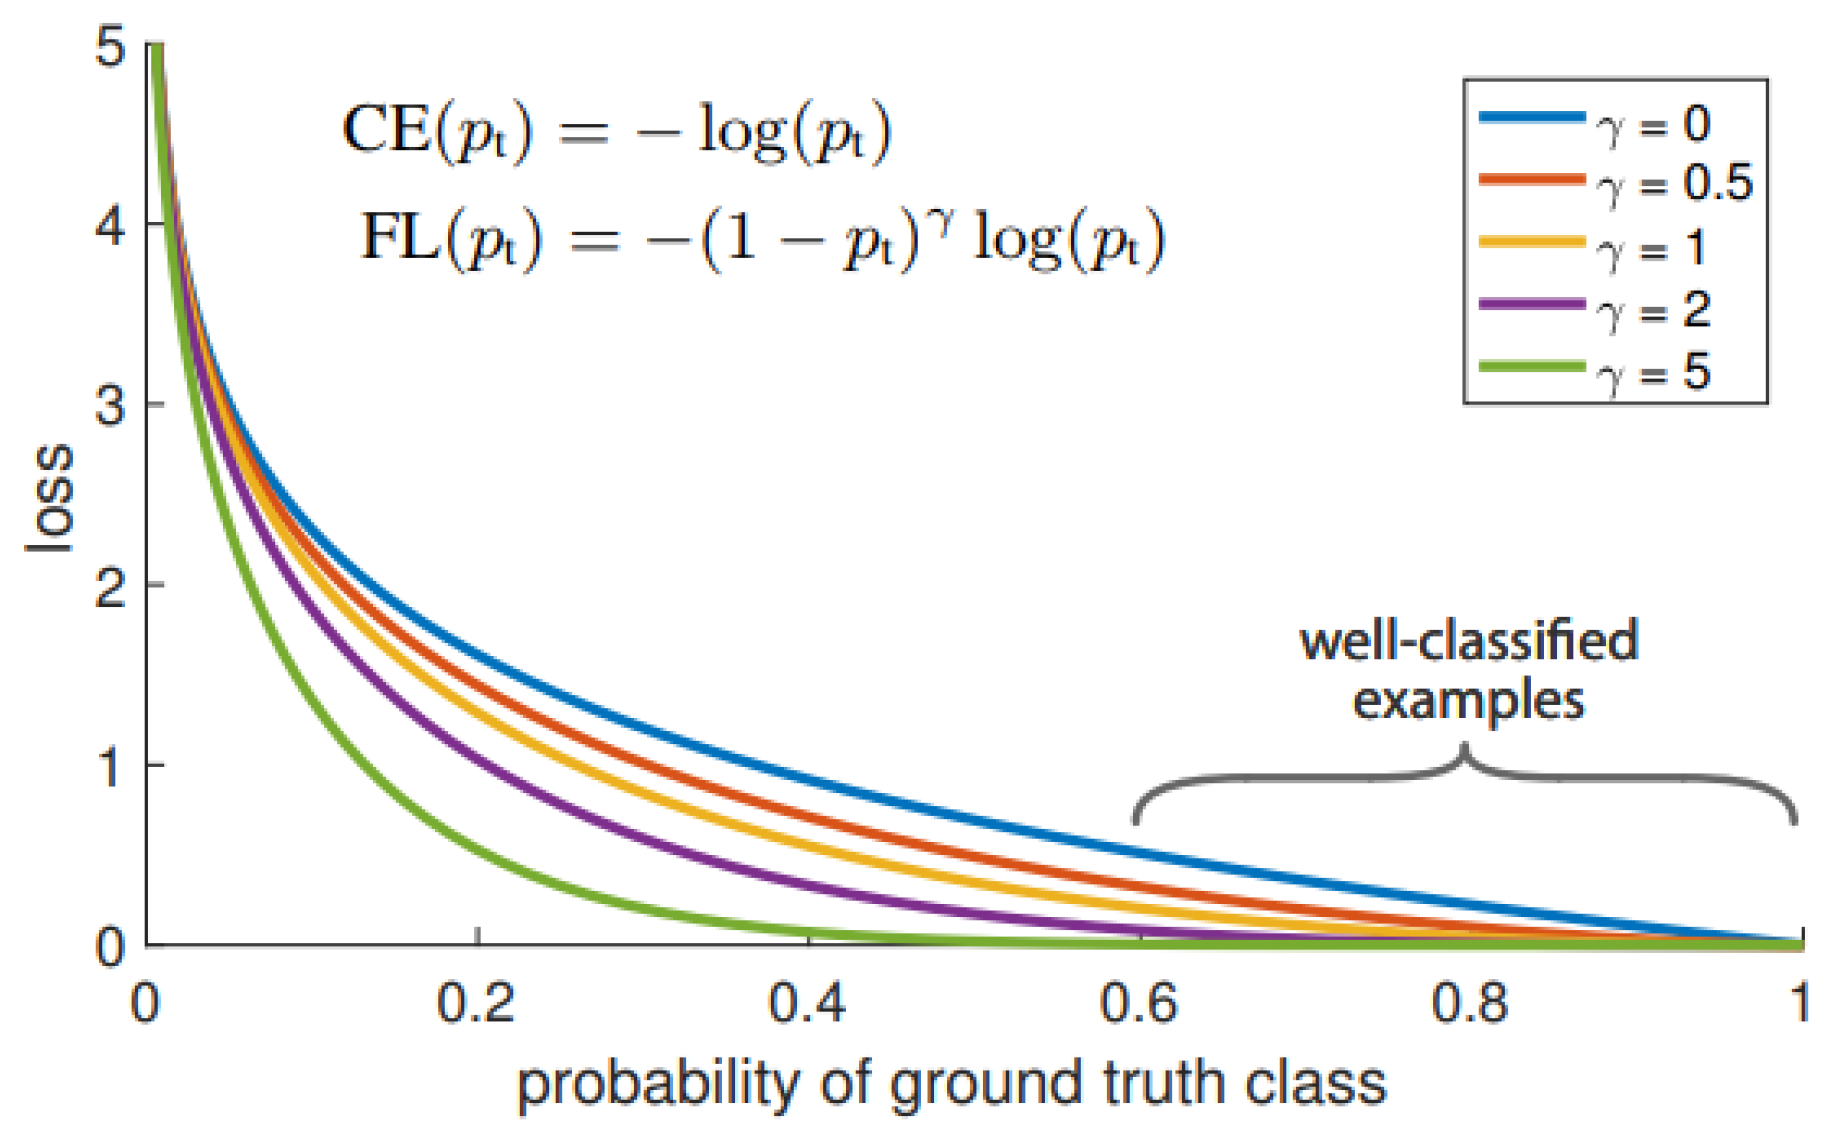
25]. To overcome this issue, cost-sensitive learning based on cross-entropy (CE) is preferable for training the neural network. Recently, a method that enhances cross-entropy, termed focal loss, has been emerging as an alternative candidate to improve performance [26,27,28,29,30]. Specifically, the authors of [30] performed a methodology to improve the performance of the deep learning technique using a focal loss neural network. The idea was proven feasible in machine vision and performed better than conventional cross-entropy. In summary, learning using an imbalanced dataset requires different handling techniques. Empirical study shows that some conventional handling techniques that are feasible for applying to a balanced dataset might obtain high misclassification costs when imbalanced datasets are used. As we know, in the real environment, data handled by machine learning is always in an imperfect form, i.e., they are examples of imbalanced data. Therefore, it is necessary to investigate a scheme to address this phenomenon.
The realm of intrusion detection has been studied extensively by many researchers. Vinayakumar et al. [4,6] proposed DNN using cross-entropy (DNN CE) and CNN using cross-entropy (CNN CE) to address the imbalance problem. Our preliminary results using the algorithms showed that both DNN CE and CNN CE could be successfully implemented in the datasets. However, even though both algorithms achieved good accuracy, they continued to suffer from the imbalance problem, as shown by the F1 score. In our preliminary results, we also utilized SMOTE to cope with the imbalance problem [21]. SMOTE is used for balancing the majority and minority classes and intended to address the class imbalance. By combining DNN and CNN, SMOTE (DNN SMOTE and CNN SMOTE, respectively) was successfully implemented and achieved good accuracy. However, the F1 score was lacking. This means that addition of the data preprocessing step resulted in imbalance. In the end, we used an improved classification model for the intrusion detection system, termed the focal loss network intrusion detection system (FL-NIDS), to address the class imbalance in NIDS. Deep neural network and convolutional neural network layers were utilized to compare the performance of the system with previous research results. The effectiveness of FL-NIDS was analyzed using three benchmark datasets: NSL-KDD, UNSW-NB15, and Bot-IoT. In conclusion, the paper’s contributions are as follows: (i) proposing a loss function modification based on focal loss to solve the imbalanced data problem; (ii) comparing the performance of the proposed method with common methods using imbalanced datasets; and (iii) empirically testing the system with real-world datasets to validate the proposed model. The rest of the paper is organized as follows. Section 2 presents detailed research related to the development of the proposed method. Section 3 defines the methodology and the proposed model. Section 4 explores some observations on the proposed model and discusses the accuracy of the proposed method compared to existing neural network models, such as vanilla deep neural network, vanilla convolutional neural network, and SMOTE, on three different datasets. Section 5 concludes the paper.

2. Related Work

Shallow machine learning algorithms, which include support vector machine, decision tree, and naïve Bayes, have been evaluated in NIDS and proven to be feasible solutions to the intrusion detection problem [1,2,3]. Due to the emergence of deep neural network algorithms in recent years, attention has automatically shifted to new algorithms that offer limitless exploration abilities but are complex. Vinayakumar et al. [6] evaluated the effectiveness of shallow machine learning algorithms and deep neural networks. The authors concluded that deep neural network performed well in most experimental scenarios because the information in the network was learned by the distinguished pattern of several layers. Another discussion that compared shallow machine learning and deep neural networks was presented by Hodo et al. [9]. The authors showed that deep neural network outperformed shallow machine learning in attack detection. Various CNN and long short-term memory (LTSM) deep neural network architectures were evaluated by Roopak et al. [31]. The authors concluded that the deep neural network combination of CNN + LTSM performed well and obtained the highest accuracy of 97.16%. These previous studies have shown that, in general, deep neural network performs better than shallow machine learning. However, the imbalanced data case that is encountered in real-world datasets is neglected.
The imbalanced data case refers to the problem where the distribution of the dataset is significantly underrepresented. Some attempts to improve imbalanced datasets have been made. Sun et al. reviewed some methods that were able to overcome an imbalanced dataset [11]. The methods included data level and algorithm level solutions. Furthermore, evaluation of the matrix was used to measure the effect on imbalanced datasets. Heibo compared some approaches to solve the imbalanced data problem and recommended several approaches from both the data level and algorithm level [10]. Chawla et al. conducted an experiment using an oversampling approach for an imbalanced dataset [21]. They utilized SMOTE, and the results showed that the method improved accuracy. However, despite SMOTE obtaining higher accuracy, the algorithm required huge computation time. Works applying algorithms to imbalanced datasets have also been conducted. The typical approach is to utilize cost-sensitive learning. Elkan presented a concept to optimize a neural network [32]. The concept utilized the neural network to prevent and minimize the mistakes of different misclassification errors caused by different losses. The paper proposed and formulated cost-sensitive learning to optimize the proportion of negative and positive training. Wang et al. examined the ability of a neural network to overcome an imbalanced dataset [33]. Despite obtaining high accuracy, the deep neural network did not achieve high precision. The research proved that an improvement of the cost learning rate in a neural network contributed to higher precision. Another research conducted by Cui et al. assessed the combination of cost-sensitive learning cross-entropy with focal loss [26].
Focal loss is able to counter extreme foreground–background class imbalances [27]. This study reshaped the typical cross-entropy loss so that the loss assigned to the classified sample was reduced. Focal loss is interested in a sparse set of hard samples during training and prevents the majority class from inundating the detector. In the area of machine vision, focal loss is utilized to detect characters in random images [28]. This research was conducted on text recognition from images. The evaluation of the benchmark dataset showed that the focal loss detector performed better, with the accuracy increasing by 2.5% compared to the focal lossless algorithm. Nemoto et al. observed rare building changes by employing a CNN based on focal loss. Building changes is categorized as a rare positive case as building construction in rural areas is limited. The experiment showed that the application of focal loss was effective for detecting rare problems, and the model avoided overfitting.

3. Methodology

3.1. Oversampling for Imbalanced Datasets

The data level technique, which compensates imbalanced datasets, focuses on modifying the minority class (oversampling) and the majority class (undersampling). Oversampling refers to modifying the data distribution so that the appearance of samples is based on the calculated cost. In other words, this technique duplicates higher-cost training data until the data distribution is proportional to their costs. To address the imbalanced data case, Chawla et al. introduced SMOTE, an oversampling technique that generates synthetic samples of the minority class [21]. The method utilizes linear interpolation in the region of the minority class sample so that new synthetic samples are generated. Based on the required oversampling rate, the neighbors from the k-nearest neighbors are randomly chosen. SMOTE is effective at enhancing the ability of a neural network to map the minority class features [15,16,19]. In NIDS, a neural network with the SMOTE approach is evaluated using imbalanced datasets and can significantly improve the accuracy and harmonic mean [4,5,8].

3.2. Cost-Sensitive Neural Network

A deep neural network utilizes a loss function to optimize the parameters. Typically, the loss function assigns the cross-entropy, which uses the sigmoid function to classify the binary class and the softmax function to conduct multiclass classification. The typical cross-entropy loss used for classification is mathematically defined as follows:
C E ( p ,   y   ) =   { log ( p )                         i f   y = 1 log ( 1 p )               o t h e r w i s e
y ∈ {±1} denotes the ground-truth class and p ∈ [0,1] refers to the model’s estimated probability for the class with label y = 1. More concisely, we calculate pt as follows:
p t   = { p                             i f   y = 1 1   p                   o t h e r w i s e
On an imbalanced dataset, a large class overwhelms the loss and dominates the gradient. If CE (pt) = CE (p,y), αt is balancing the importance of positive and negative examples. Lin et al. [27] modified cross-entropy loss by adding a modulating factor (1 − pt)γ with tunable focusing parameter γ ≥ 0, which is termed focal loss. Formally, focal loss is expressed as follows:
F L ( p t ) =     α t ( 1   p t ) γ   log ( p t )
where γ denotes a prefixed positive scale value and
α t =   { α                     i f   y = 1 1   α         o t h e r w i s e                    
A combination of the cross-entropy and the modulating factor (1 − pt)^γ is used as it yields better accuracy, as mentioned in Equation (1). Figure 2 [27] shows the comparison between the cross-entropy γ = 0 and the focal loss. The weight term   α t ( 1   p t ) γ is inversely proportional and dependent on the value of pt.

3.3. Applying a Focal Loss Network Intrusion Detection System

Focal loss is emerging as one of the cost-sensitive learning methods that balances cross-entropy loss so that the hard negative examples, including rare classes, are learned [27,28,29]. The authors verified the capability of focal loss in a detection process considering imbalanced classes. Focal loss is proposed to address imbalanced classes by reshaping and modifying the standard cross-entropy based on the loss function to obtain better classification. Focal loss is applied to solve this imbalanced data issue in computer vision and achieves excellent performance. However, the effectiveness of focal loss is not limited to the detection task. Regardless of the number of classes and the task, adjusting the learning according to the difficulty of samples is considered to be effective [29].
In this paper, we propose FL-NIDS, which can be applied in deep neural network and convolutional neural network, to overcome the imbalanced NIDS problem. Focal loss was utilized as a loss function on the output of the classification subnet. The architecture of deep neural network is shown in Figure 3a, and the architecture of convolution neural network is shown in Figure 3b. The deep neural network included three layers: DNN layer 1, DNN layer 2, and DNN layer 3. Each layer included one dense layer followed by a dropout layer and softmax layer for multiclass classification and a sigmoid layer for binary classification. Table 2 shows the full description of DNN. Another algorithm, CNN, was introduced with three layers: CNN layer 1, CNN layer 2, and CNN layer 3. Each layer included a 1D convolutional layer with a filter size of three. Every two layers were normalized using 1D MaxPooling with a filter size of two, which was followed by a dropout layer with a rate of 0.2. Table 3 shows the full description of CNN. Hyperparameter tuning was utilized using a batch size of 64. The Adam optimizer with a learning rate of 0.0001 and decay of 0.004 was used. The training included 250 epochs with an option to stop using the early stopping parameter of 25. To show the effectiveness of FL-NIDS, several algorithms, such as SMOTE as well as CNN and DNN with cross-entropy, were compared. In this experiment, we referred to Lin et al. [27] to set the focal loss parameters as γ = 2 and α = 0.25.

3.4. Evaluation Matrics

Evaluation metrics assess the performance of the classifier. In classification problems, assuming that class “M” is the observed minority, the possibility of detecting class “M” is based on the following widely used confusion matrix, which is shown in Table 4. The term true positive (TP) refers to correctly predicted values “M”, which means that the value of the actual class is “M”. True negative (TN) correctly predicts the values “not M”, which means that the value of the actual class is “not M”. False positive (FP) and false negative (FN) values occur when the actual class contradicts the predicted class.
It is common to measure the classification performance using a confusion matrix, especially the current one. Typically, accuracy is most commonly utilized. Accuracy is the number of correct predictions compared to all predictions made. However, accuracy is only suitable when the data distribution is balanced. When the classes are imbalanced, accuracy is not the favored method as the minority class is overwhelmed and the accuracy sums up all correct predictions from the total population. This could be misleading when the data is presented. In this case, metrics such as precision and recall are good at showing how a classifier performs with respect to the minority class. Precision and recall can indicate the model that catches the greatest number of instances of the minority class, even if it increases the number of false positives. The method with high precision/recall will possess the best potential to represent the minority. The accuracy, precision, and recall of the two classes can be computed as follows:
A c c u r a c y =   T P + T N T P + T N + F P + F N
P r e c i s i o n =   T P T P + F P
R e c a l l =   T P T P + F N
F 1 = 2   P r e c i s i o n × R e c a l l P r e c i s i o n + R e c a l l
When classification is conducted on multiple classes, a confusion matrix class label can be produced for every single class. The precision, recall, and F1 score are calculated for each class. Further, the scoring metrics via one vs. all classification could be utilized. They include both the microaveraged and macroaveraged results [34]. The microaverage focuses on the weight of each number of true instances, and the macroaverage is interested in the weight of each class. The microaverage and macroaverage of the precision score in a k-class are defined as follows:
P r e c i s i o n m i c r o =   T P 1 + + T P k T P 1 + + T P k + F P 1 + + F P k
P r e c i s i o n m a c r o = P R E 1 + + P R E k k

4. Experiment and Performance Evaluation

4.1. Description of Network Intrusion Detection System Datasets

The benchmark datasets for NIDS are currently limited. Most of them are internal network simulations based on traffic and attack data simulations. This research utilized three benchmark datasets for NIDS: NSL-KDD, UNSW-NB15, and Bot-IoT. They were consistently utilized to evaluate the effectiveness of machine learning algorithms.
NSL-KDD: This dataset is the updated version of KDDCup99 that removes the redundant data and invalid records. This clean version prevents the machine learning algorithm from being biased during the training data phase. The dataset typically includes the connection information with 41 features and its associated labels, and there are five categories of labels: normal, DoS (denial of service), R2L (unauthorized access from a remote machine), U2R (unauthorized access to local root privileges), and probing (surveillance and other probing).
UNSW-NB15: This dataset is formed from a network simulation. The simulation is established by creating a network that consists of a server and router. The server generates simulated traffic data, including normal data traffic and malicious data. The router captures the simulated traffic data. The dataset consists of 10 classes and 42 features.
Bot-IoT: This new NIDS dataset covers all 11 typical updated attacks, such as DoS, distributed denial of service (DDoS), reconnaissance, and theft. Bot-IoT2019 contains a large number of traffic packets and attack types that has occurred over five consecutive days. The whole dataset encompasses 3,119,345 instances and 15 features containing five class labels (one normal and four attack labels).

4.2. Environment

The experiment was run on Ubuntu 18.04 LTS. Deep neural network was implemented using GPU TensorFlow and Keras as a higher-level framework. A Nvidia GeForce RTX2080 11 GB was installed on a computer containing an Intel® Xeon® CPU E5-2630 v4 @2.20 GHz CPU and 128 GB of DDR4 RAM.

4.3. Discussion

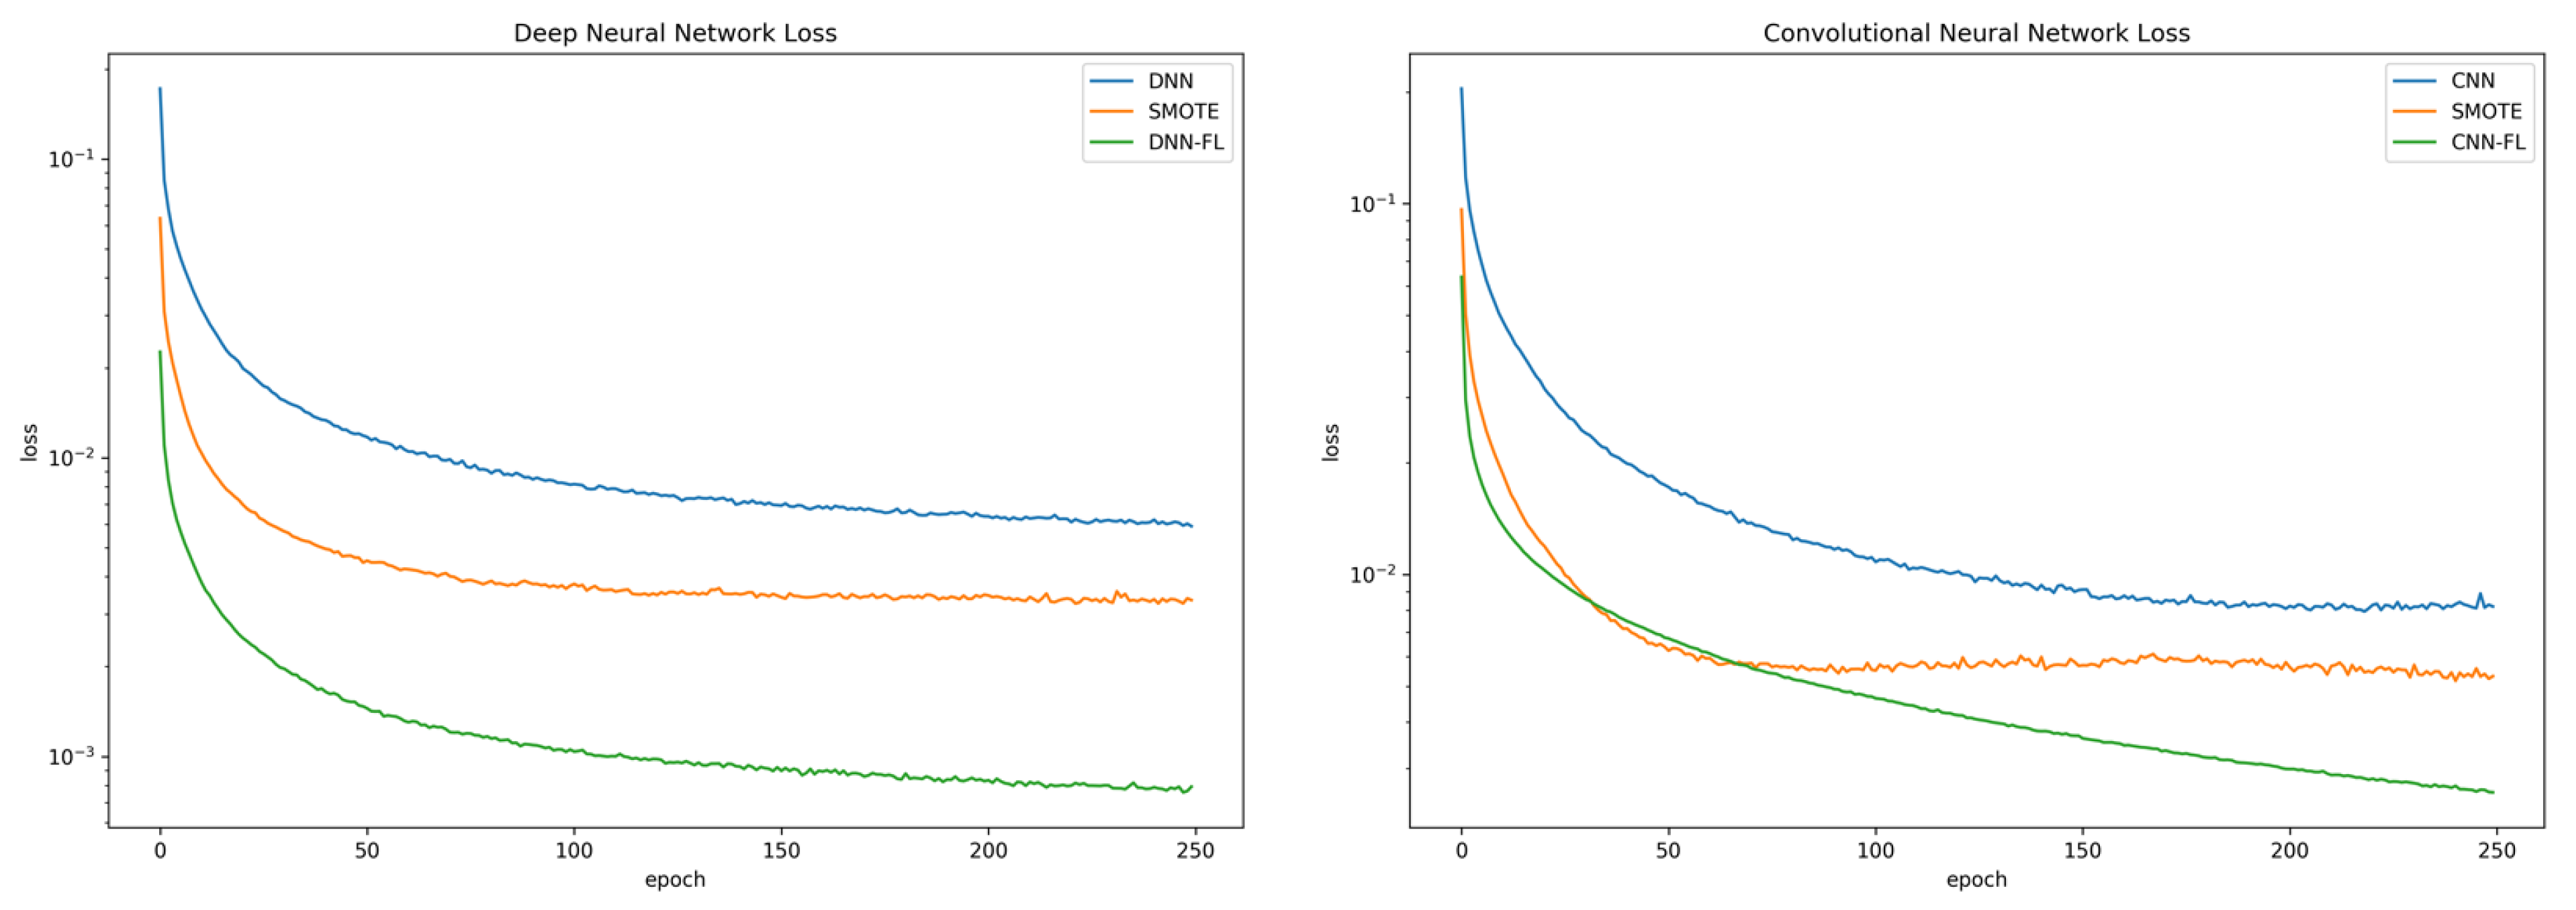
Imbalanced dataset has a huge influence on the ability of neural networks during training. The influence, which is affected by the majority class, is reflected by the late convergence of the loss function during the training process as the model sums the losses of all the large classes and rarely focuses on the minority class. By adding focal loss to cross-entropy loss, it reduces the large class contribution and extends the range to access the minority class. In this experiment, we compared and examined the cross-entropy of DNN using cross-entropy (DNN CE) from reference [6], CNN using cross-entropy (CNN CE) from reference [4], DNN using SMOTE (DNN SMOTE) from reference [21], and CNN using SMOTE (CNN SMOTE) from reference [21]; for DNN and CNN, focal loss with ɣ = 2.0 and α = 0.25 was used following reference [27]. Figure 4a,b shows the loss function compared to DNN and the loss function compared to CNN using the respective techniques. Both models that utilized focal loss converged faster compared to DNN CE, CNN CE, DNN SMOTE, and CNN SMOTE. In addition, the proposed model obtained minimum loss errors that were 7 times better for the DNN architecture and 3.7 times better for the CNN architecture than CNN SMOTE. It also had better generalizability, as shown by the validation losses. The detailed loss error and loss validation are shown in Table 5.
In terms of accuracy, the performance of FL-NIDS applying the DNN and CNN architecture was comparable to DNN CE, DNN SMOTE, CNN CE, and CNN SMOTE. Detailed accuracy results for the binary and multiclass classification using FL-NIDS are given in Table 6 and Table 7, respectively. The results showed that the accuracy was equally distributed, implying that the techniques are comparable to each other. The accuracy distribution of the NSL-KDD and UNSW-NB15 datasets were located approximately 77–89% in the binary classification and located slightly lower at approximately 66–78% in the multiclass classification. The opposite occurred in the Bot-IoT dataset. The accuracy distribution was located approximately 75–89% in the binary classification and located slightly higher at approximately 98–99% for the multiclass classification. In more detail, in the binary classification and multiclass classification using the DNN architecture, FL-NIDS outperformed DNN CE by a maximum of 5% in three layers using the Bot-IoT dataset. However, in some cases, FL-NIDS also surpassed the accuracy of DNN CE and DNN SMOTE. In the CNN-based architecture, FL-NIDS obtained even better accuracy by outperforming CNN CE and CNN SMOTE by a maximum of 2%. However, in some cases, FL-NISD also surpassed the accuracy of both of them. This result indicates that FL-NIDS has effective binary and multiclass classification performance and is able to classify potential future threats.
We have shown that accuracy for FL-NIDS is equal to the CE model and SMOTE model. However, accuracy alone cannot represent detection of the minority class. According to Equation (1), the accuracy only compares the positive detection of every class with respect to the total dataset. Therefore, when there is a change in the detection of the minority class, the detection does not affect the whole accuracy and tends to be ignored. We used precision, recall, and F1 score to assess the detection for imbalanced datasets. As shown in Equation (2), precision quantifies the exactness of the correctly labeled class. Precision focuses on the ratio of positive detections to the detection of each class, and it will be affected when there is a change in the minority class. Recall measures the sensitivity or correctly labeled positive classes. Recall is affected by the sensitivity of the model to negative detection errors. The F1 score is the average of precision and recall and measures the balance of precision and recall.
Detailed results of the DNN and CNN experiments using precision, recall, and F1 score are shown in Table 8 and Table 9, respectively. In the shallow layer (layer 1), the precision of FL-NIDS was poor compared to the other algorithms. However, as the number of layers increased, the precision of FL-NIDS was superior to the other models. It is obvious that FL-NIDS works best at a deep layer [27]. In the deep model (layer 3), FL-NIDS outperformed the other models by 3% with the DNN architecture and 12% with the CNN architecture.
In the multiclass experiment, FL-NIDS outperformed the other models. Detailed results of multiclass classification using the DNN and CNN architectures are shown in Table 10 and Table 11, respectively. The precision was superior for the deep model (layer 3) compared to the other models. This finding was expected as FL-NIDS was developed to handle multiclass and imbalanced data. However, there was an anomaly during the detection of NSL-KDD using the DNN model, which might have been caused by the selection of the focal loss parameter because the performance of focal loss is heavily dependent on the dataset. In spite of the anomaly, FL-NIDS is suitable and superior to other algorithms.
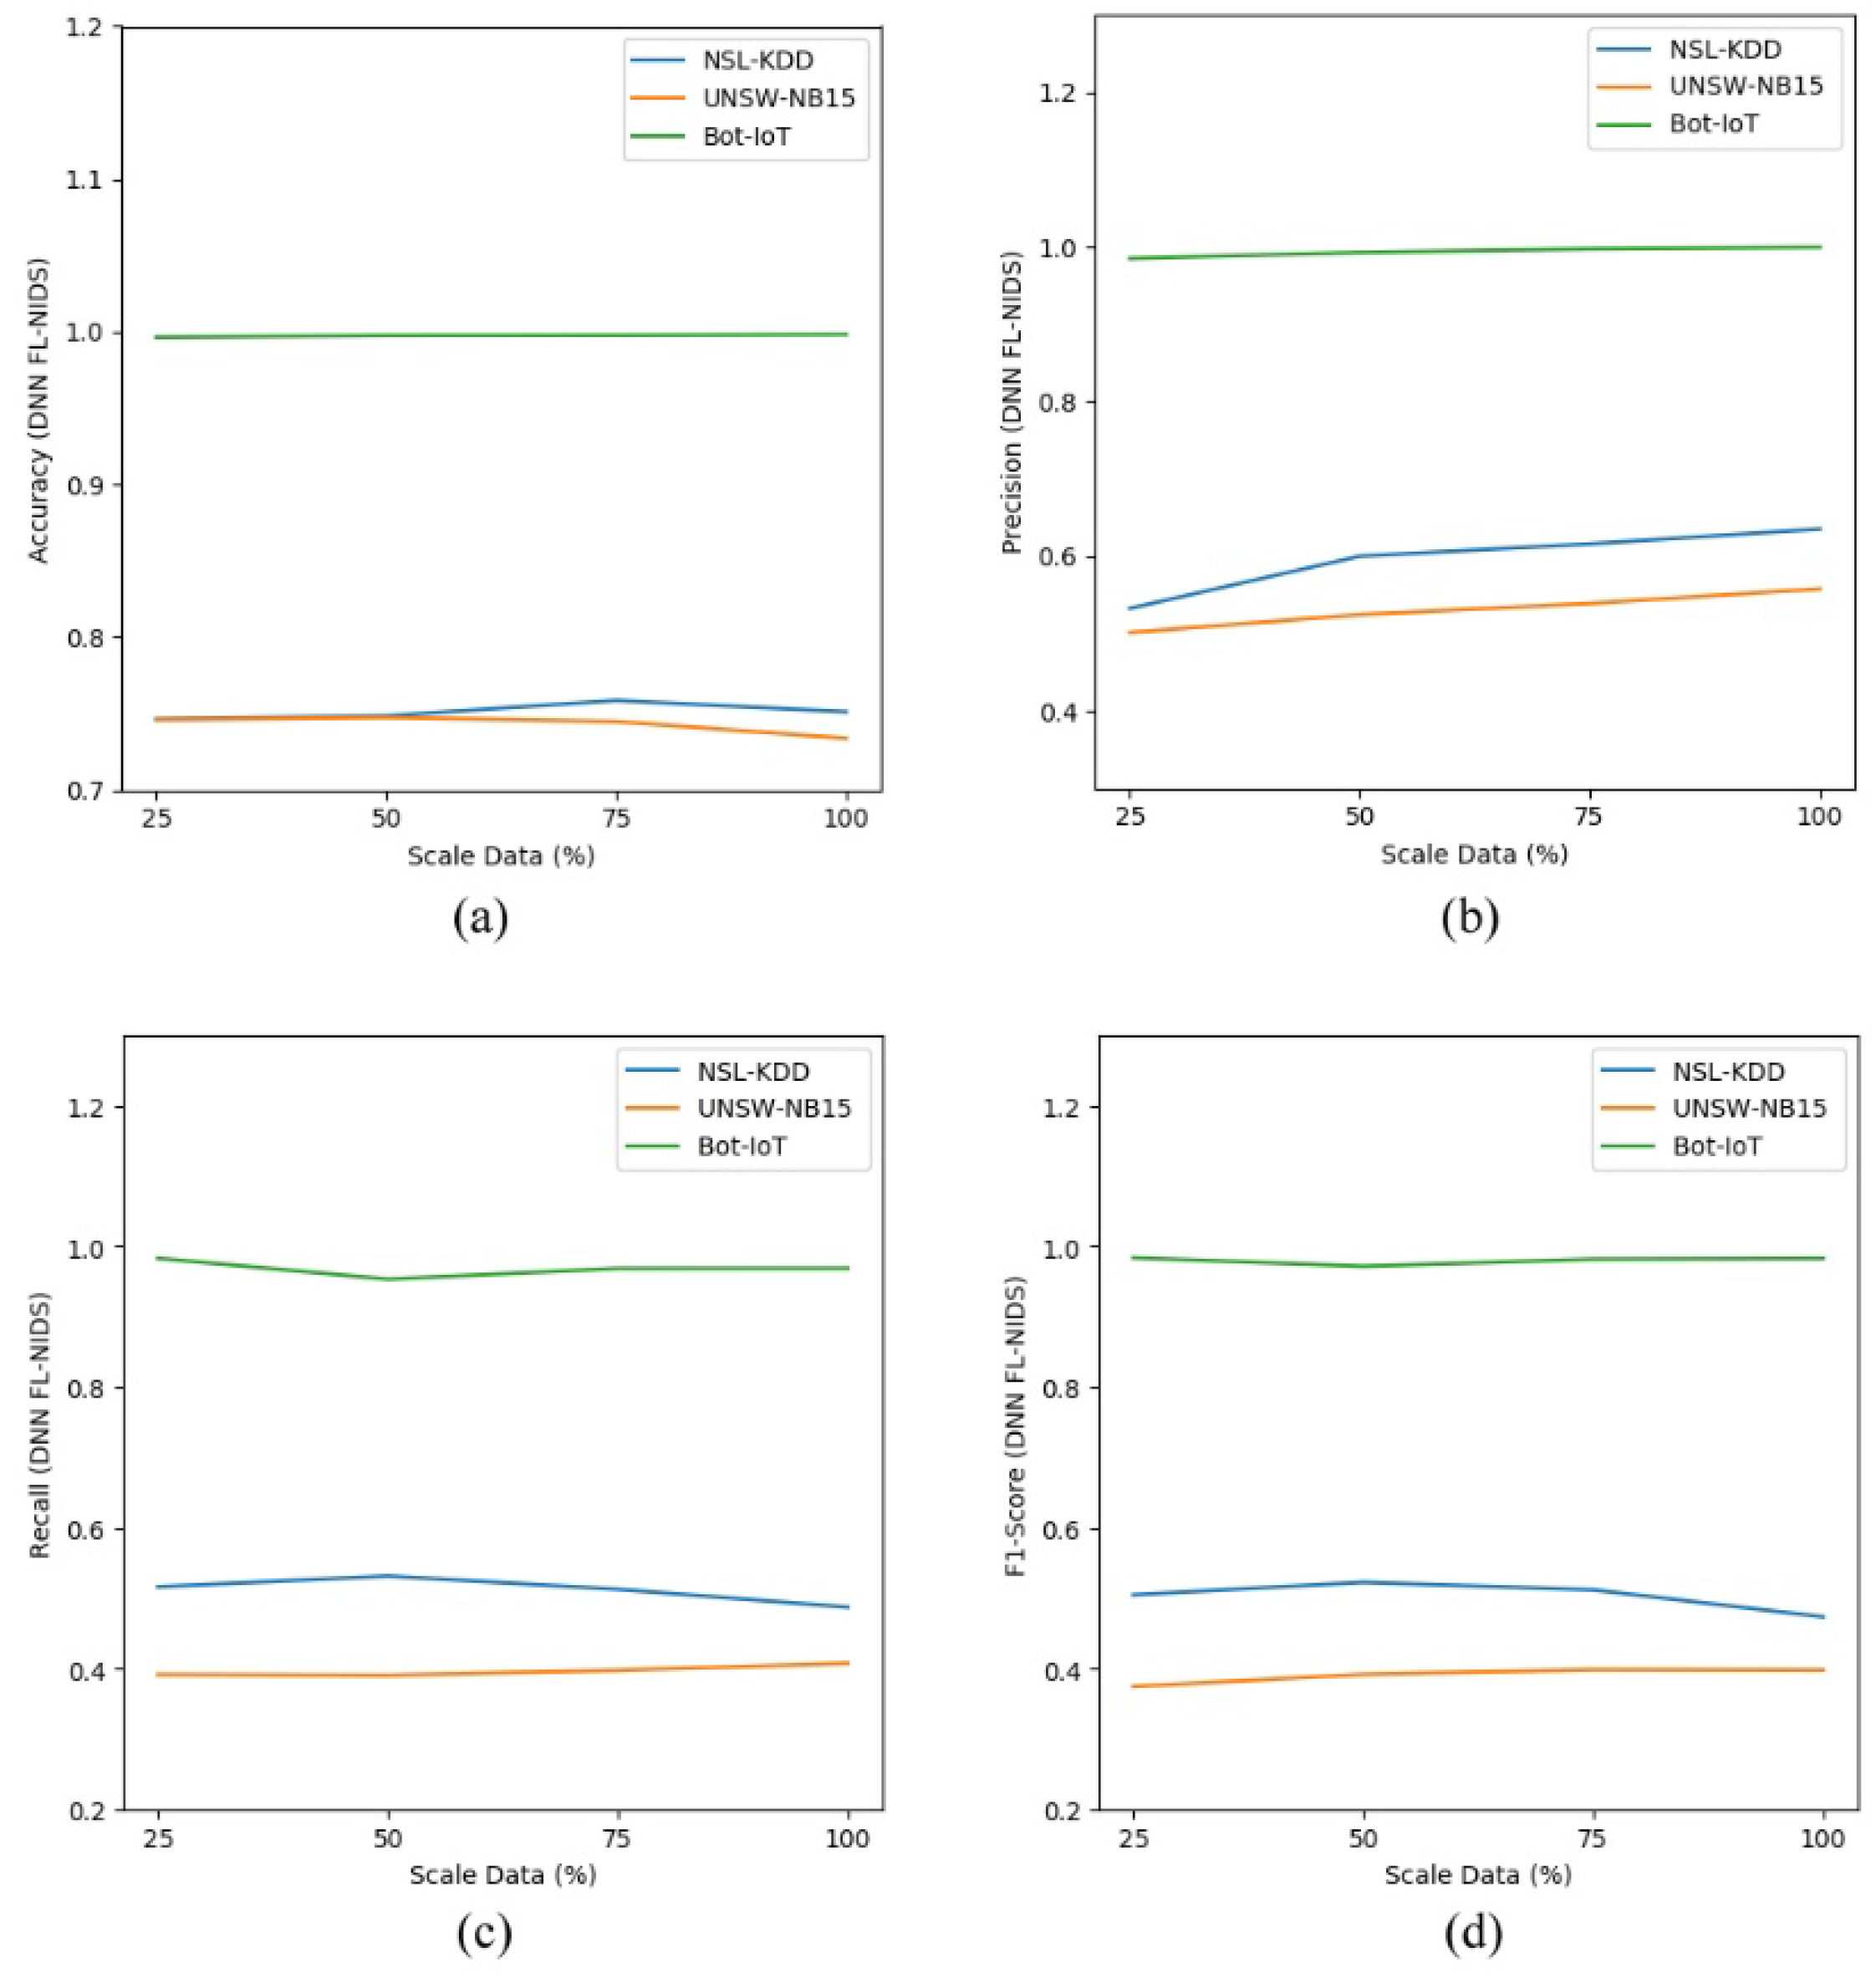
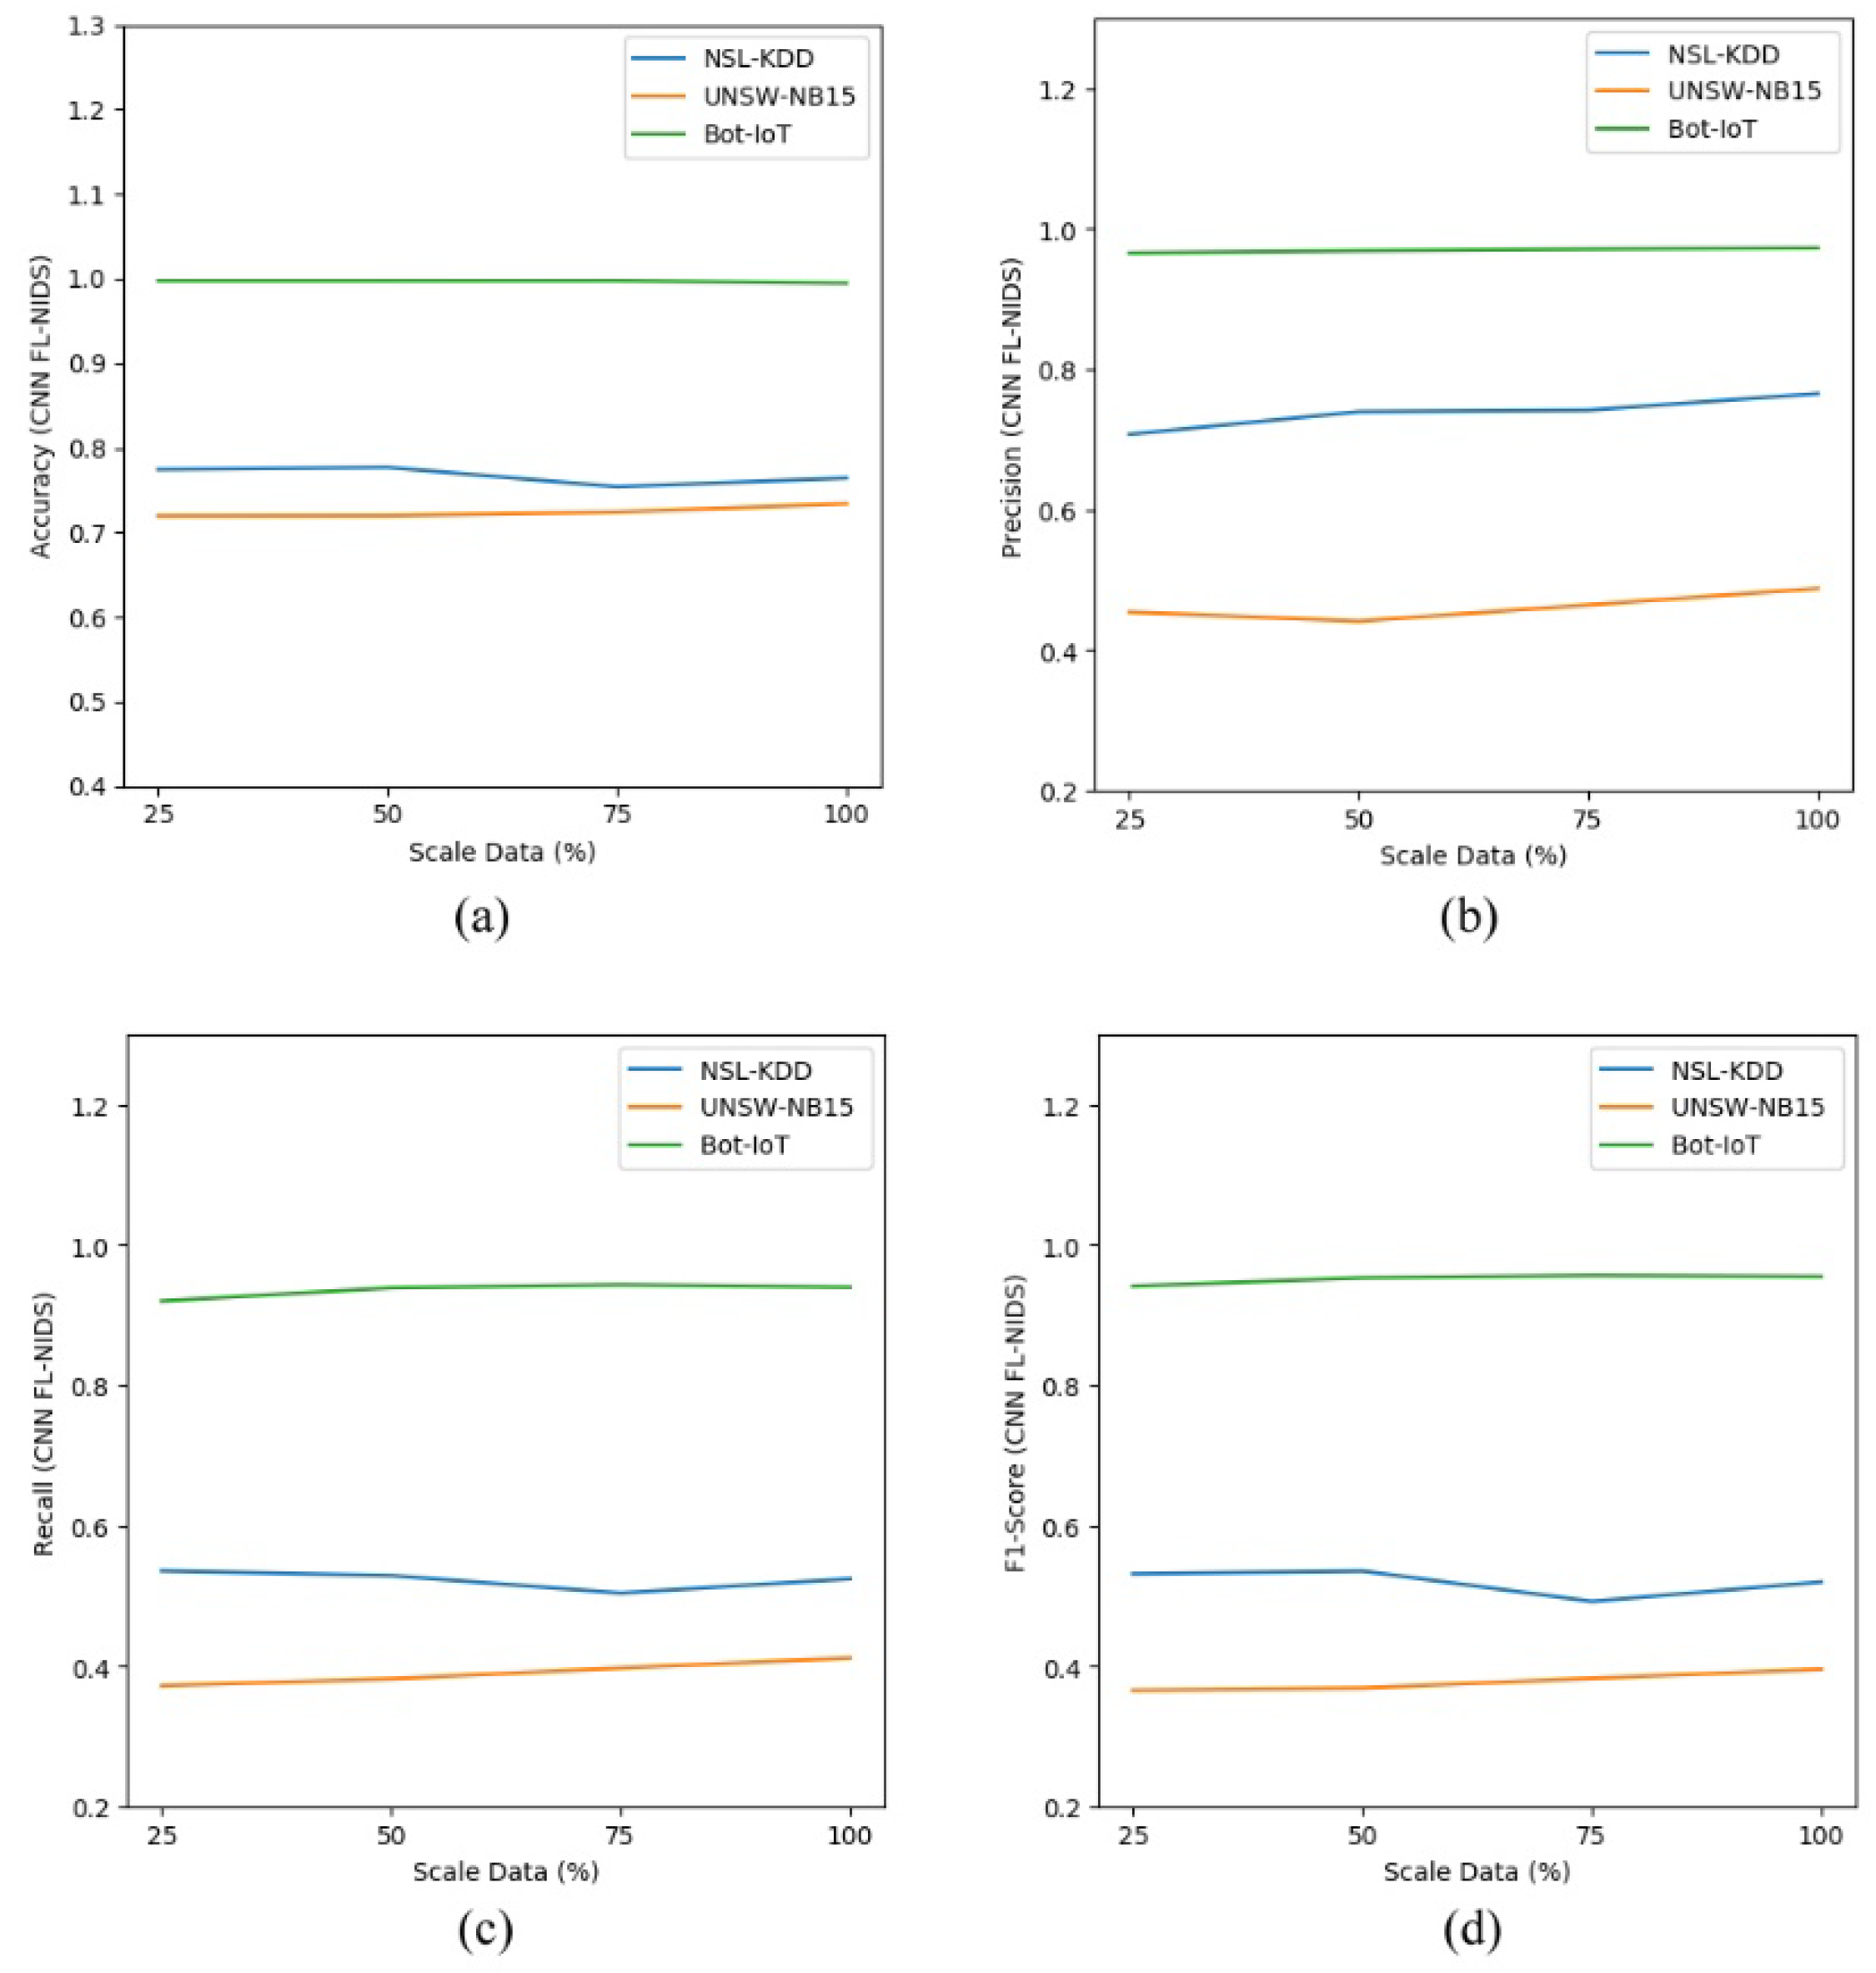
To get an insight on the scalability of the proposed approach, we measured the effectiveness of FL-NIDS by simulating a condition where few data are available. To mimic those circumstances, we trained the model using 25, 50, and 75% of the training dataset. Furthermore, the models were evaluated on the whole available testing data.
As depicted in Table 12 and Table 13, the scalability assessment of the proposed approach was conducted by comparing the performance of the DNN and CNN models using different data sizes. The performance comparison consisted of accuracy, precision, recall, and F1 score in multiclass classification. The results, shown in Table 12 and Table 13, indicate that our proposed approach is stable enough as the outcome achieved was almost the same, even for the model trained with few data. Figure 5a–d and Figure 6a–d show the performance comparison for FL-NIDS in the DNN and CNN models, respectively. From the presented results, it can be seen that the performance of the proposed scheme is scalable enough as the accuracy of FL-NIDS could be maintained at 74% for DNN and 77% for CNN, even with the availability of only 25% of the data size for training.

5. Conclusions

This study explored an improved cross-entropy neural network method, termed FL-NIDS, that can be applied to intrusion detection. The effectiveness of the algorithm was examined using three benchmark NIDS datasets that suffer from imbalanced classes. Our results showed that FL-NIDS improved the accuracy of detection in imbalanced datasets compared to the traditional DNN and CNN architecture. These results are consistent with our hypothesis that focal loss adjusts the weight of false predicted samples. As intrusion detection is needed for adversarial attack, we suggest applying focal loss to other datasets, such as sequential tasks.

Author Contributions

Conceptualization, M.M. and S.W.P.; Methodology, M.F. and M.M.; Project administration, J.-S.L.; Software, M.F. and S.W.P.; Supervision, J.-S.L.; Visualization, S.W.P. and M.F.; Writing—original draft, M.F. and M.M.; Writing—review and editing, J.-S.L. and M.F. All authors have read and agreed to the published version of the manuscript.

Funding

This study was supported by the Ministry of Science and Technology (MOST) under the grant MOST-109-2221-E-011-108.

Informed Consent Statement

Not applicable” for studies not involving human.

Acknowledgments

The authors gratefully acknowledge the support extended by the Ministry of Science and Technology (MOST) under the grant MOST-109-2221-E-011-108.

Conflicts of Interest

The authors declare no conflict of interest.

References

  1. Zaman, M.; Lung, C.H. Evaluation of machine learning techniques for network intrusion detection. In Proceedings of the NOMS IEEE/IFIP Network Operations and Management SymposiumTaipei, Taiwan, 23–27 April 2018; Institute of Electrical and Electronics Engineers (IEEE): Piscataway, NJ, USA, 2018; pp. 1–5. [Google Scholar]
  2. Chang, Y.; Li, W.; Yang, Z. Network intrusion detection based on random forest and support vector machine. In Proceedings of the 2017 IEEE International Conference on Computational Science and Engineering (CSE) and IEEE International Conference on Embedded and Ubiquitous Computing (EUC), Guangzhou, China, 21–24 July 2017; Institute of Electrical and Electronics Engineers (IEEE): Piscataway, NJ, USA, 2017; pp. 635–638. [Google Scholar]
  3. Jianhong, H. Network intrusion detection algorithm based on improved support vector machine. In Proceedings of the 2015 International Conference on Intelligent Transportation, Big Data and Smart City, Halong Bay, Vietnam, 19–20 December 2015; Institute of Electrical and Electronics Engineers (IEEE): Piscataway, NJ, USA, 2015; pp. 523–526. [Google Scholar]
  4. Vinayakumar, R.; Soman, K.P.; Poornachandran, P. Applying convolutional neural network for network intrusion detection. In Proceedings of the International Conference on Advances in Computing, Communications and Informatics (ICACCI), Udupi, India, 13–16 September 2017; pp. 1222–1228. [Google Scholar]
  5. Shone, N.; Ngoc, T.N.; Phai, V.D.; Shi, Q. A Deep learning approach to network intrusion detection. IEEE Trans. Emerg. Top. Comput. Intell. 2018, 2, 41–50. [Google Scholar] [CrossRef] [Green Version]
  6. Vinayakumar, R.; Alazab, M.; Soman, K.P.; Poornachandran, P.; Al-Nemrat, A.; Venkatraman, S. Deep learning approach for intelligent intrusion detection system. IEEE Access 2019, 7, 41525–41550. [Google Scholar] [CrossRef]
  7. Vinayakumar, R.; Soman, K.P.; Poornachandran, P. Evaluating effectiveness of shallow and deep networks to intrusion detection system. In Proceedings of the 2017 International Conference on Advances in Computing, Communications and Informatics (ICACCI), Udupi, India, 13–16 September 2017; pp. 1282–1289. [Google Scholar]
  8. Kwon, D.; Natarajan, K.; Suh, S.C.; Kim, H.; Kim, J. An empirical study on network anomaly detection using convolutional neural networks. In Proceedings of the IEEE 38th International Conference on Distributed Computing Systems (ICDCS), Vienna, Austria, 2–6 July 2018; pp. 1595–1598. [Google Scholar]
  9. Hodo, E.; Bellekens, X.; Hamilton, A.; Tachtatzis, C.; Atkinson, R. Shallow and deep networks intrusion detection system: A taxonomy and survey. arXiv 2017, arXiv:1701.02145. [Google Scholar]
  10. He, H.; Garcia, E.A. Learning from imbalanced data. IEEE Trans. Knowl. Data Eng. 2009, 21, 1263–1284. [Google Scholar]
  11. Sun, Y.; Wong, A.K.C.; Kamel, M.S. Classification of imbalanced data: A review. Int. J. Pattern Recognit. Artif. Intell. 2009, 23, 687–719. [Google Scholar] [CrossRef]
  12. Tavallaee, M.; Bagheri, E.; Lu, W.; Ghorbani, A.A. A detailed analysis of the KDD CUP 99 data set. In Proceedings of the 2009 IEEE Symposium on Computational Intelligence for Security and Defense Applications, Ottawa, ON, Canada, 8–10 July 2009; pp. 1–6. [Google Scholar]
  13. Moustafa, N.; Slay, J. UNSW-NB15: A comprehensive data set for network intrusion detection systems (UNSW-NB15 network data set). In Proceedings of the 2015 Military Communications and Information Systems Conference (MilCIS), Canberra, Australia, 10–12 November 2015; pp. 1–6. [Google Scholar]
  14. Koroniotis, N.; Moustafa, N.; Sitnikova, E.; Turnbull, B. Towards the development of realistic botnet dataset in the internet of things for network forensic analytics: Bot-IoT dataset. Futur. Gener. Comput. Syst. 2019, 100, 779–796. [Google Scholar] [CrossRef] [Green Version]
  15. Amin, A.; Anwar, S.; Adnan, A.; Nawaz, M.; Howard, N.; Qadir, J.; Hawalah, A.Y.A.; Hussain, A. Comparing oversampling techniques to handle the class imbalance problem: A customer churn prediction case study. IEEE Access 2016, 4, 7940–7957. [Google Scholar] [CrossRef]
  16. Aditsania, A.; Saonard, A.L. Handling imbalanced data in churn prediction using ADASYN and backpropagation algorithm. In Proceedings of the 3rd International Conference on Science in Information Technology (ICSITech), Bandung, Indonesia, 25–26 October 2017; pp. 533–536. [Google Scholar]
  17. Wang, S.; Yao, X. Multiclass Imbalance Problems: Analysis and Potential Solutions. IEEE Trans. Syst. Man Cybern. Part B 2012, 42, 1119–1130. [Google Scholar] [CrossRef] [PubMed]
  18. Khan, S.H.; Hayat, M.; Bennamoun, M.; Sohel, F.A.; Togneri, R. Cost-sensitive learning of deep feature representations from imbalanced data. IEEE Trans. Neural Netw. Learn. Syst. 2018, 29, 3573–3587. [Google Scholar] [PubMed] [Green Version]
  19. More, A. Survey of resampling techniques for improving classification performance in unbalanced datasets. arXiv 2016, arXiv:1608.06048. [Google Scholar]
  20. Nguyen, H.M.; Cooper, E.W.; Kamei, K.; Kamei, K. A comparative study on sampling techniques for handling class imbalance in streaming data. In Proceedings of the 6th International Conference on Soft Computing and Intelligent Systems, Kobe, Japan, 20–24 November 2012; pp. 1762–1767. [Google Scholar]
  21. Chawla, N.V.; Bowyer, K.W.; Hall, L.O.; Kegelmeyer, W.P. SMOTE: Synthetic minority over-sampling technique. J. Artif. Intell. Res. 2002, 16, 321–357. [Google Scholar] [CrossRef]
  22. Chawla, N.V.; Japkowicz, N.; Kotcz, A. Editorial: Special issue on learning from imbalanced data sets. ACM SIGKDD Explor. Newsl. 2004, 6, 1–6. [Google Scholar] [CrossRef]
  23. Kukar, M.; Kononenko, I. Cost-sensitive learning with neural networks. In Proceedings of the 13th European Conference Artificial Intelligence; 1998; pp. 445–449. Available online: https://eurai.org/library/ECAI_proceedings (accessed on 29 November 2020).
  24. Dong, Q.; Gong, S.; Zhu, X. Imbalanced deep learning by minority class incremental rectification. IEEE Trans. Pattern Anal. Mach. Intell. 2019, 41, 1367–1381. [Google Scholar] [CrossRef] [Green Version]
  25. Ng, W.W.; Hu, J.; Yeung, D.S.; Yin, S.; Roli, F. Diversified sensitivity-based undersampling for imbalance classification problems. IEEE Trans. Cybern. 2015, 45, 2402–2412. [Google Scholar] [CrossRef]
  26. Cui, Y.; Jia, M.; Lin, T.-Y.; Song, Y.; Belongie, S. Class-balanced loss based on effective number of samples. In Proceedings of the 2019 IEEE/CVF Conference on Computer Vision and Pattern Recognition (CVPR), Long Beach, CA, USA, 15–21 June 2019; pp. 9260–9269. [Google Scholar]
  27. Lin, T.-Y.; Goyal, P.; Girshick, R.; He, K.; Dollar, P. Focal loss for dense object detection. In Proceedings of the IEEE International Conference on Computer Vision (ICCV), Venice, Italy, 22–29 October 2017; pp. 2999–3007. [Google Scholar]
  28. Tian, X.; Wu, D.; Wang, R.; Cao, X. Focal text: An accurate text detection with focal loss. In Proceedings of the 25th IEEE International Conference on Image Processing (ICIP), Athens, Greece, 7–10 October 2018; Institute of Electrical and Electronics Engineers (IEEE): Piscataway, NJ, USA, 2018; pp. 2984–2988. [Google Scholar]
  29. Nemoto, K.; Hamaguchi, R.; Imaizumi, T.; Hikosaka, S. Classification of rare building change using CNN with multi-class focal loss. In Proceedings of the IGARSS, IEEE International Geoscience and Remote Sensing Symposium, Valencia, Spain, 22–27 July 2018; pp. 4667–4670. [Google Scholar]
  30. Cheng, Z.; Chai, S. A cyber intrusion detection method based on focal loss neural network. In Proceedings of the 39th Chinese Control Conference, Shenyang, China, 27–29 July 2020; pp. 7379–7383. [Google Scholar]
  31. Roopak, M.; Tian, G.Y.; Chambers, J. Deep learning models for cyber security in IoT networks. In Proceedings of the IEEE 9th Annual Computing and Communication Workshop and Conference, Las Vegas, NV, USA, 7–9 January 2019; pp. 452–457. [Google Scholar]
  32. Elkan, C. The foundations of cost-sensitive learning. In Proceedings of the International Joint Conference on Artificial Intelligence, Seattle, WA, USA, 4–10 August 2001; pp. 973–978. [Google Scholar]
  33. Wang, S.; Liu, W.; Wu, J.; Cao, L.; Meng, Q.; Kennedy, P.J. Training deep neural networks on imbalanced data sets. In Proceedings of the 2016 International Joint Conference on Neural Networks, Vancouver, BC, Canada, 24–29 July 2016; pp. 4368–4374. [Google Scholar]
  34. Van Asch, V. Macro-and Micro-Averaged Evaluation Measures [[BASIC DRAFT]]; CLiPS: Antwerpen, Belgium, 2013; pp. 1–27. [Google Scholar]
Figure 1. Distribution of the datasets.
Symmetry 13 00004 g001
Figure 2. Focal loss compared to cross-entropy [27].
Symmetry 13 00004 g002
Figure 3. Architecture of (a) convolutional neural network (CNN) and (b) deep neural network (DNN).
Symmetry 13 00004 g003
Figure 4. Loss function comparison. (a) deep neural network (DNN) model. (b) convolutional neural network (CNN) model.
Symmetry 13 00004 g004
Figure 5. Scalability assessment of DNN FL-NIDS: (a) accuracy; (b) precision; (c) recall; (d) F1 score.
Symmetry 13 00004 g005
Figure 6. Scalability assessment of CNN FL-NIDS: (a) accuracy; (b) precision; (c) recall; (d) F1 score.
Symmetry 13 00004 g006
Table 1. Index ratio (IR) of datasets.
DatasetClassFeaturesData Size *Max Class SizeMin Class SizeIR Majority/MinorityIR
Majority/Rest
NSL-KDD541148,51777,054119647.511.08
UNSW-NB151042257,67393,000174534.480.56
Bot-IoT5151,782,280936,2643526,750.41.9
* After preprocessing.
Table 2. Configuration of the DNN model.
LayersTypeShape OutputActivationExplain
0–1Dense(None, 512)ReLU
1–2Dense(None, 256)ReLU
2–3Dropout (0.01)(None, 256)
3–4Dense(None, 128)ReLU
4–5Dropout (0.01)(None, 128)
5–6Dense(None, 5)Softmax/SigmoidNSL-KDD
(None, 10)UNSW-NB15
(None, 13)Bot-IoT
Table 3. Configuration of the CNN model.
LayersTypeShape OutputActivationExplain
0–1Conv1D(None, 256)ReLU
1–2Conv1D(None, 128)ReLU
2–3MaxPooling1D(None, 128)
3–4Conv1D(None, 64)ReLU
4–5MaxPooling1D(None, 64)
5–6Dense(None, 128)
6–7Dropout(0.2)(None, 128)
7–8Dense(None, 5)Softmax/SigmoidNSL-KDD
(None, 10)UNSW-NB15
(None, 13)Bot-IoT
Table 4. Confusion matrix for classifying “M”.
Predicted True Class “M”Predicted Class “not M”
Actual class “M ”True positive (TP)False negative (FN)
Actual class “not M”False positive (FP)True negative (TN)
Table 5. Loss error and loss validation for CNN and DNN.
MethodLossLoss Validation
DNN
DNN CE [6]0.005900.00526
DNN SMOTE [21]0.003340.00737
FL-NIDS (ɣ = 2.0, α = 0.25)0.000480.00043
CNN
CNN CE [4]0.008190.00842
CNN SMOTE [21]0.005320.01351
FL-NIDS (ɣ = 2., α = 0.25)0.001420.00129
Table 6. The accuracy comparison of the DNN architecture.
MethodNSL-KDDUNSW-NB15Bot-IoT
AccuracyAccuracyAccuracy
Binary Classification
Layer 1 DNN CE [6]0.81120.85460.893
DNN SMOTE [21]0.82480.88170.8826
FL-NIDS (Ours)0.81410.85910.8446
Layer 2 DNN CE [6]0.80610.85810.781
DNN SMOTE [21]0.83040.85810.7935
FL-NIDS (Ours)0.82470.86610.7952
Layer 3DNN CE [6]0.80740.86070.7837
DNN SMOTE [21]0.81950.87970.7815
FL-NIDS (Ours)0.83950.86040.7529
Multiclass Classification
Layer 1DNN CE [6]0.74720.7290.9818
DNN SMOTE [21]0.75480.66420.9844
FL-NIDS (Ours)0.74630.72280.986
Layer 2DNN CE [6]0.74840.75650.997
DNN SMOTE [21]0.73350.75650.9972
FL-NIDS (Ours)0.75270.74360.9971
Layer 3DNN CE [6]0.76720.75210.9978
DNN SMOTE [21]0.75970.67570.998
FL-NIDS (Ours)0.75130.73390.9983
Table 7. Accuracy comparison of the CNN architecture.
MethodNSL-KDDUNSW-NB15Bot-IoT
Binary Classification
Layer 1 CNN CE [4]0.83380.86730.7921
CNN SMOTE [21]0.83020.8840.7938
FL-NIDS (Ours)0.83340.87850.7832
Layer 2 CNN CE [4]0.83690.85730.8029
CNN SMOTE [21]0.82080.89260.8029
FL-NIDS (Ours)0.85130.87720.7987
Layer 3CNN CE [4]0.83690.86970.9419
CNN SMOTE [21]0.83340.81320.7966
FL-NIDS (Ours)0.84890.86730.956
Multiclass Classification
Layer 1 CNN CE [4]0.76510.7290.9944
CNN SMOTE [21]0.76910.66420.9939
FL-NIDS (Ours)0.77370.72280.9943
Layer 2 CNN CE [4]0.78410.75650.9973
CNN SMOTE [21]0.74050.65950.9958
FL-NIDS (Ours)0.78330.74360.9959
Layer 3CNN CE [4]0.76060.75210.9968
CNN SMOTE [21]0.75470.66030.9969
FL-NIDS (Ours)0.75260.73390.9945
Table 8. The binary classification of DNN.
MethodNSL-KDDUNSW-NB15Bot-IoT
PrecRecallF1 ScorePrecRecallF1 ScorePrecRecallF1 Score
Layer 1DNN CE [6]0.82690.8270.81120.87280.84290.84850.89760.89810.893
DNN SMOTE [21]0.82330.82940.82370.88380.87720.87960.89510.89010.8825
FL-NIDS (Ours)0.82610.82820.81410.87660.84790.85350.86390.85380.8442
Layer 2DNN CE [6]0.82410.82280.80610.87590.84670.85230.83580.79630.7769
DNN SMOTE [21]0.83340.83940.82990.87590.84670.85230.83770.80720.7906
FL-NIDS (Ours)0.83520.83820.82470.88210.85550.8610.83990.8090.7924
Layer 3DNN CE [6]0.81980.82160.80740.87760.84970.85520.81010.79460.7823
DNN SMOTE [21]0.82280.82860.81910.88050.87610.87780.82890.79580.7781
FL-NIDS (Ours)0.84470.85020.83920.90660.90820.90410.83990.8090.7924
Table 9. The binary classification of CNN.
MethodNSL-KDDUNSW-NB15Bot-IoT
PrecRecallF1 ScorePrecRecallF1 ScorePrecRecallF1 Score
Layer 1CNN CE [4]0.84210.84630.83370.88670.85590.86180.81510.80220.7911
CNN SMOTE [21]0.82830.83430.8290.88660.87920.88180.82770.8060.7919
FL-NIDS (Ours)0.84290.84650.83330.89210.86910.87440.81840.79560.781
Layer 2CNN CE [4]0.84670.85030.83690.88950.84260.84930.84330.8160.8006
CNN SMOTE [21]0.8340.83560.82080.89560.88790.89060.83520.80950.7943
FL-NIDS (Ours)0.85680.86250.85110.89390.86680.87260.8420.81230.7961
Layer 3CNN CE [4]0.84670.85030.83690.89610.85660.86330.94250.94510.9418
CNN SMOTE [21]0.8310.83680.8320.86920.79270.7970.83520.80950.7943
FL-NIDS (Ours)0.85680.86140.84870.89780.85330.86030.95560.95590.9557
Table 10. The multiclass classification of DNN.
MethodNSL-KDDUNSW-NB15Bot-IoT
PrecRecallF1 ScorePrecRecallF1 ScorePrecRecallF1 Score
Layer 1DNN CE [6]0.67880.53070.53320.48680.4040.39410.99240.92420.9534
DNN SMOTE [21]0.66330.54660.55260.45570.46210.4270.97910.97950.9793
FL-NIDS (Ours)0.64690.52430.52540.50030.41020.40090.99440.97790.9859
Layer 2DNN CE [6]0.6820.52450.52510.49150.39670.3910.98330.96830.9756
DNN SMOTE [21]0.65330.53880.53070.49150.39670.3910.98450.98460.9845
FL-NIDS (Ours)0.6340.50380.48470.50610.39870.39350.99880.96830.9824
Layer 3DNN CE [6]0.72580.50720.51130.44830.40980.40640.98380.96690.9751
DNN SMOTE [21]0.62390.50930.49860.43220.43070.41060.98390.97070.977
FL-NIDS (Ours)0.63510.48710.47330.55780.40730.39780.99930.96890.983
Table 11. The multiclass classification of CNN.
MethodNSL-KDDUNSW-NB15Bot-IoT
PrecRecallF1 ScorePrecRecallF1 ScorePrecRecallF1 Score
Layer 1CNN CE [4]0.57770.5280.52330.43410.38920.37670.98190.96660.974
CNN SMOTE [21]0.66330.54660.55260.46360.38030.3480.95910.98310.9703
FL-NIDS (Ours)0.72560.54840.55470.48160.38950.3770.98180.96490.9731
Layer 2CNN CE [4]0.67530.53650.53370.47660.4030.38850.99630.96210.9781
CNN SMOTE [21]0.63180.52840.51110.44320.48150.40970.9580.96920.9634
FL-NIDS (Ours)0.71390.53740.53030.5140.39470.39920.99770.98340.9903
Layer 3CNN CE [4]0.72580.50720.51130.46150.37660.37250.960.94490.9511
CNN SMOTE [21]0.64360.51920.51450.41330.40360.36880.96190.96740.9646
FL-NIDS (Ours)0.7650.52410.51960.48720.41120.39520.97260.93980.9551
Table 12. Scalability assessment of DNN FL-NIDS.
Data Scale (%)NSL-KDDUNSW-NB15Bot-IoT
AccuracyPrecRecallF1 ScoreAccuracyPrecRecallF1 ScoreAccuracyPrecRecallF1 Score
250.74650.53250.51610.50470.7460.50130.39140.37430.99830.98480.98310.9839
500.74860.60.53140.52250.74760.52450.39030.39160.99760.99260.95340.9717
750.75870.61590.51250.51170.74490.53890.39740.39830.99770.99720.96870.9819
1000.75130.63510.48710.47330.73390.55780.40730.39780.99830.99930.96890.983
Table 13. Scalability assessment of CNN FL-NIDS.
Data Scale (%)NSL-KDDUNSW-NB15Bot-IoT
AccuracyPrecRecallF1 ScoreAccuracyPrecRecallF1 ScoreAccuracyPrecRecallF1 Score
250.77440.70690.53550.53120.71960.45360.37170.36520.99750.96540.92010.9413
500.77690.73920.52870.53520.71980.44060.38150.36840.99750.96870.93890.9532
750.75390.74140.50380.49190.72410.46370.39690.38220.99760.9710.94330.9566
1000.76430.7650.52410.51960.73390.48720.41120.39520.99450.97260.93980.9551
Publisher’s Note: MDPI stays neutral with regard to jurisdictional claims in published maps and institutional affiliations..

