Figure 1.
The general framework of human activity recognition (HAR) using machine learning approaches.
Figure 1.
The general framework of human activity recognition (HAR) using machine learning approaches.
Figure 2.
The general framework of HAR using deep learning approaches.
Figure 2.
The general framework of HAR using deep learning approaches.
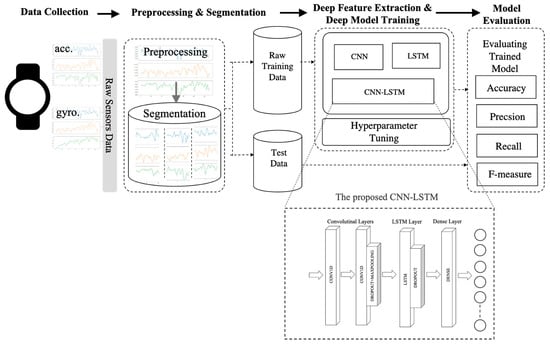
Figure 3.
The proposed smartwatch-based HAR framework.
Figure 3.
The proposed smartwatch-based HAR framework.
Figure 4.
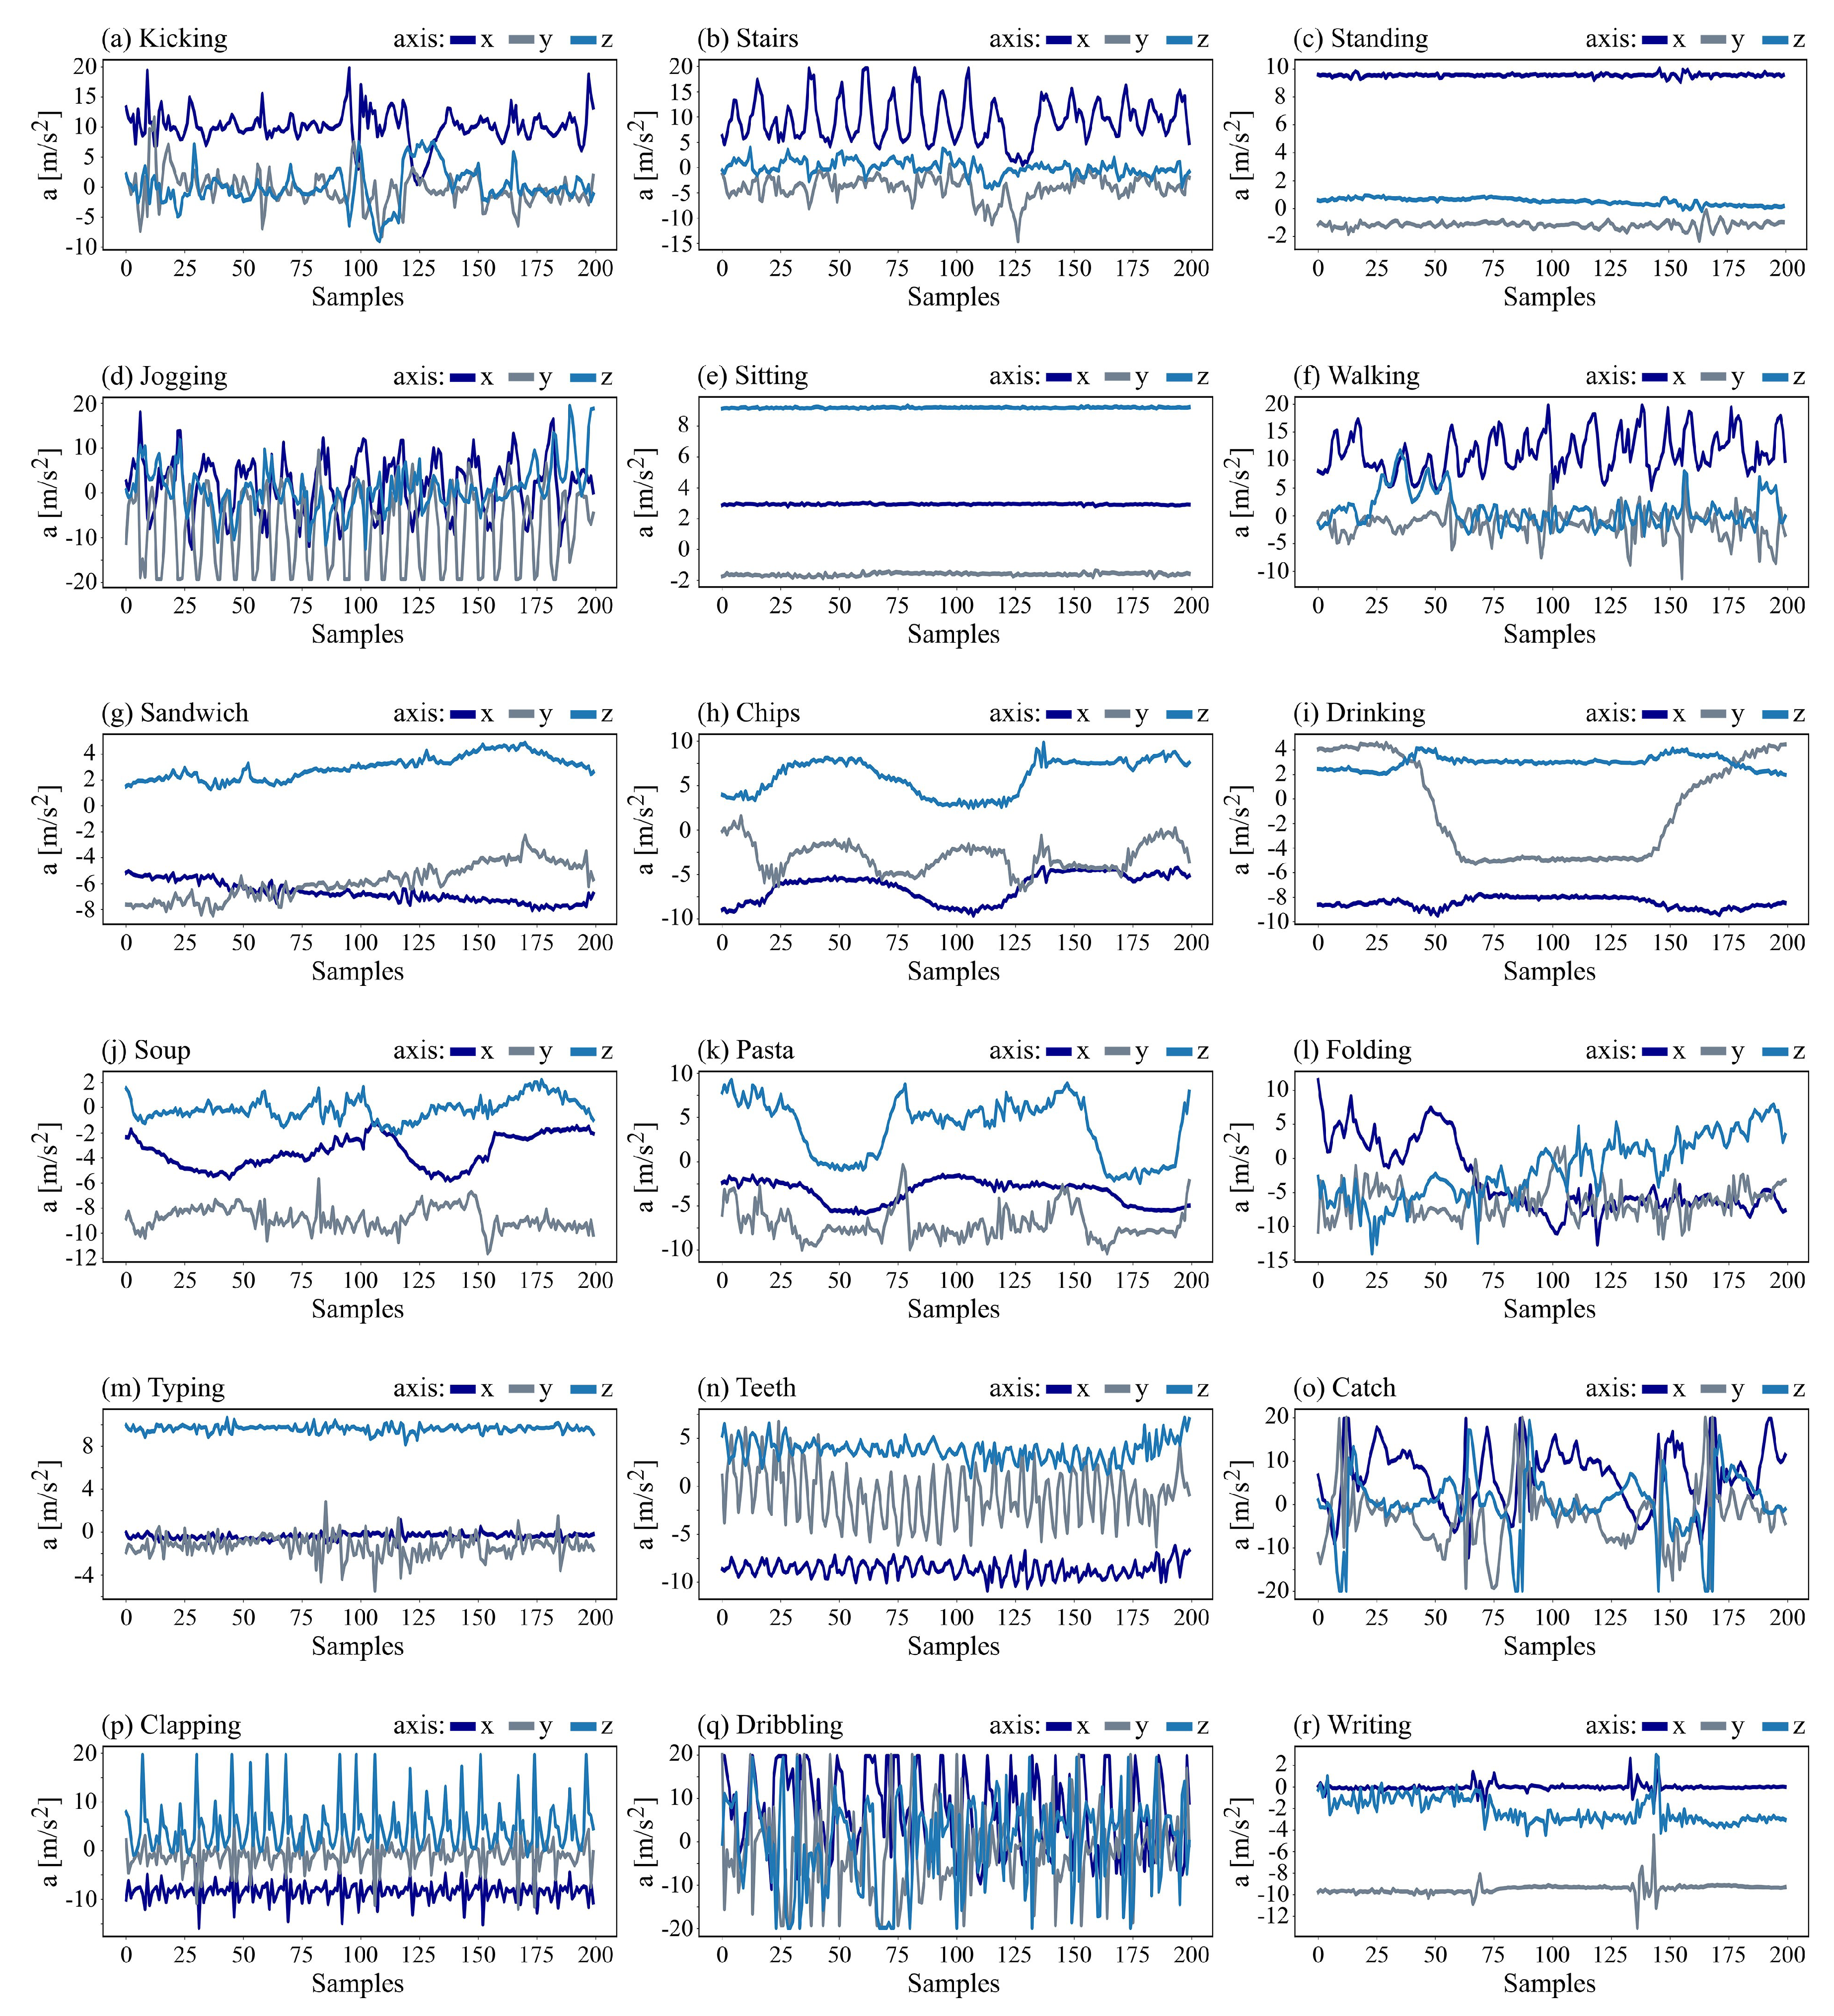
Activity accelerometer data for 10 s of (a) kicking, (b) stairs, (c) standing, (d) jogging, (e) sitting, (f) walking, (g) sandwich, (h) chips, (i) drinking, (j) soup, (k) pasta, (l) folding, (m) typing, (n) teeth, (o) catch, (p) clapping, (q) dribbling, and (r) writing.
Figure 4.
Activity accelerometer data for 10 s of (a) kicking, (b) stairs, (c) standing, (d) jogging, (e) sitting, (f) walking, (g) sandwich, (h) chips, (i) drinking, (j) soup, (k) pasta, (l) folding, (m) typing, (n) teeth, (o) catch, (p) clapping, (q) dribbling, and (r) writing.
Figure 5.
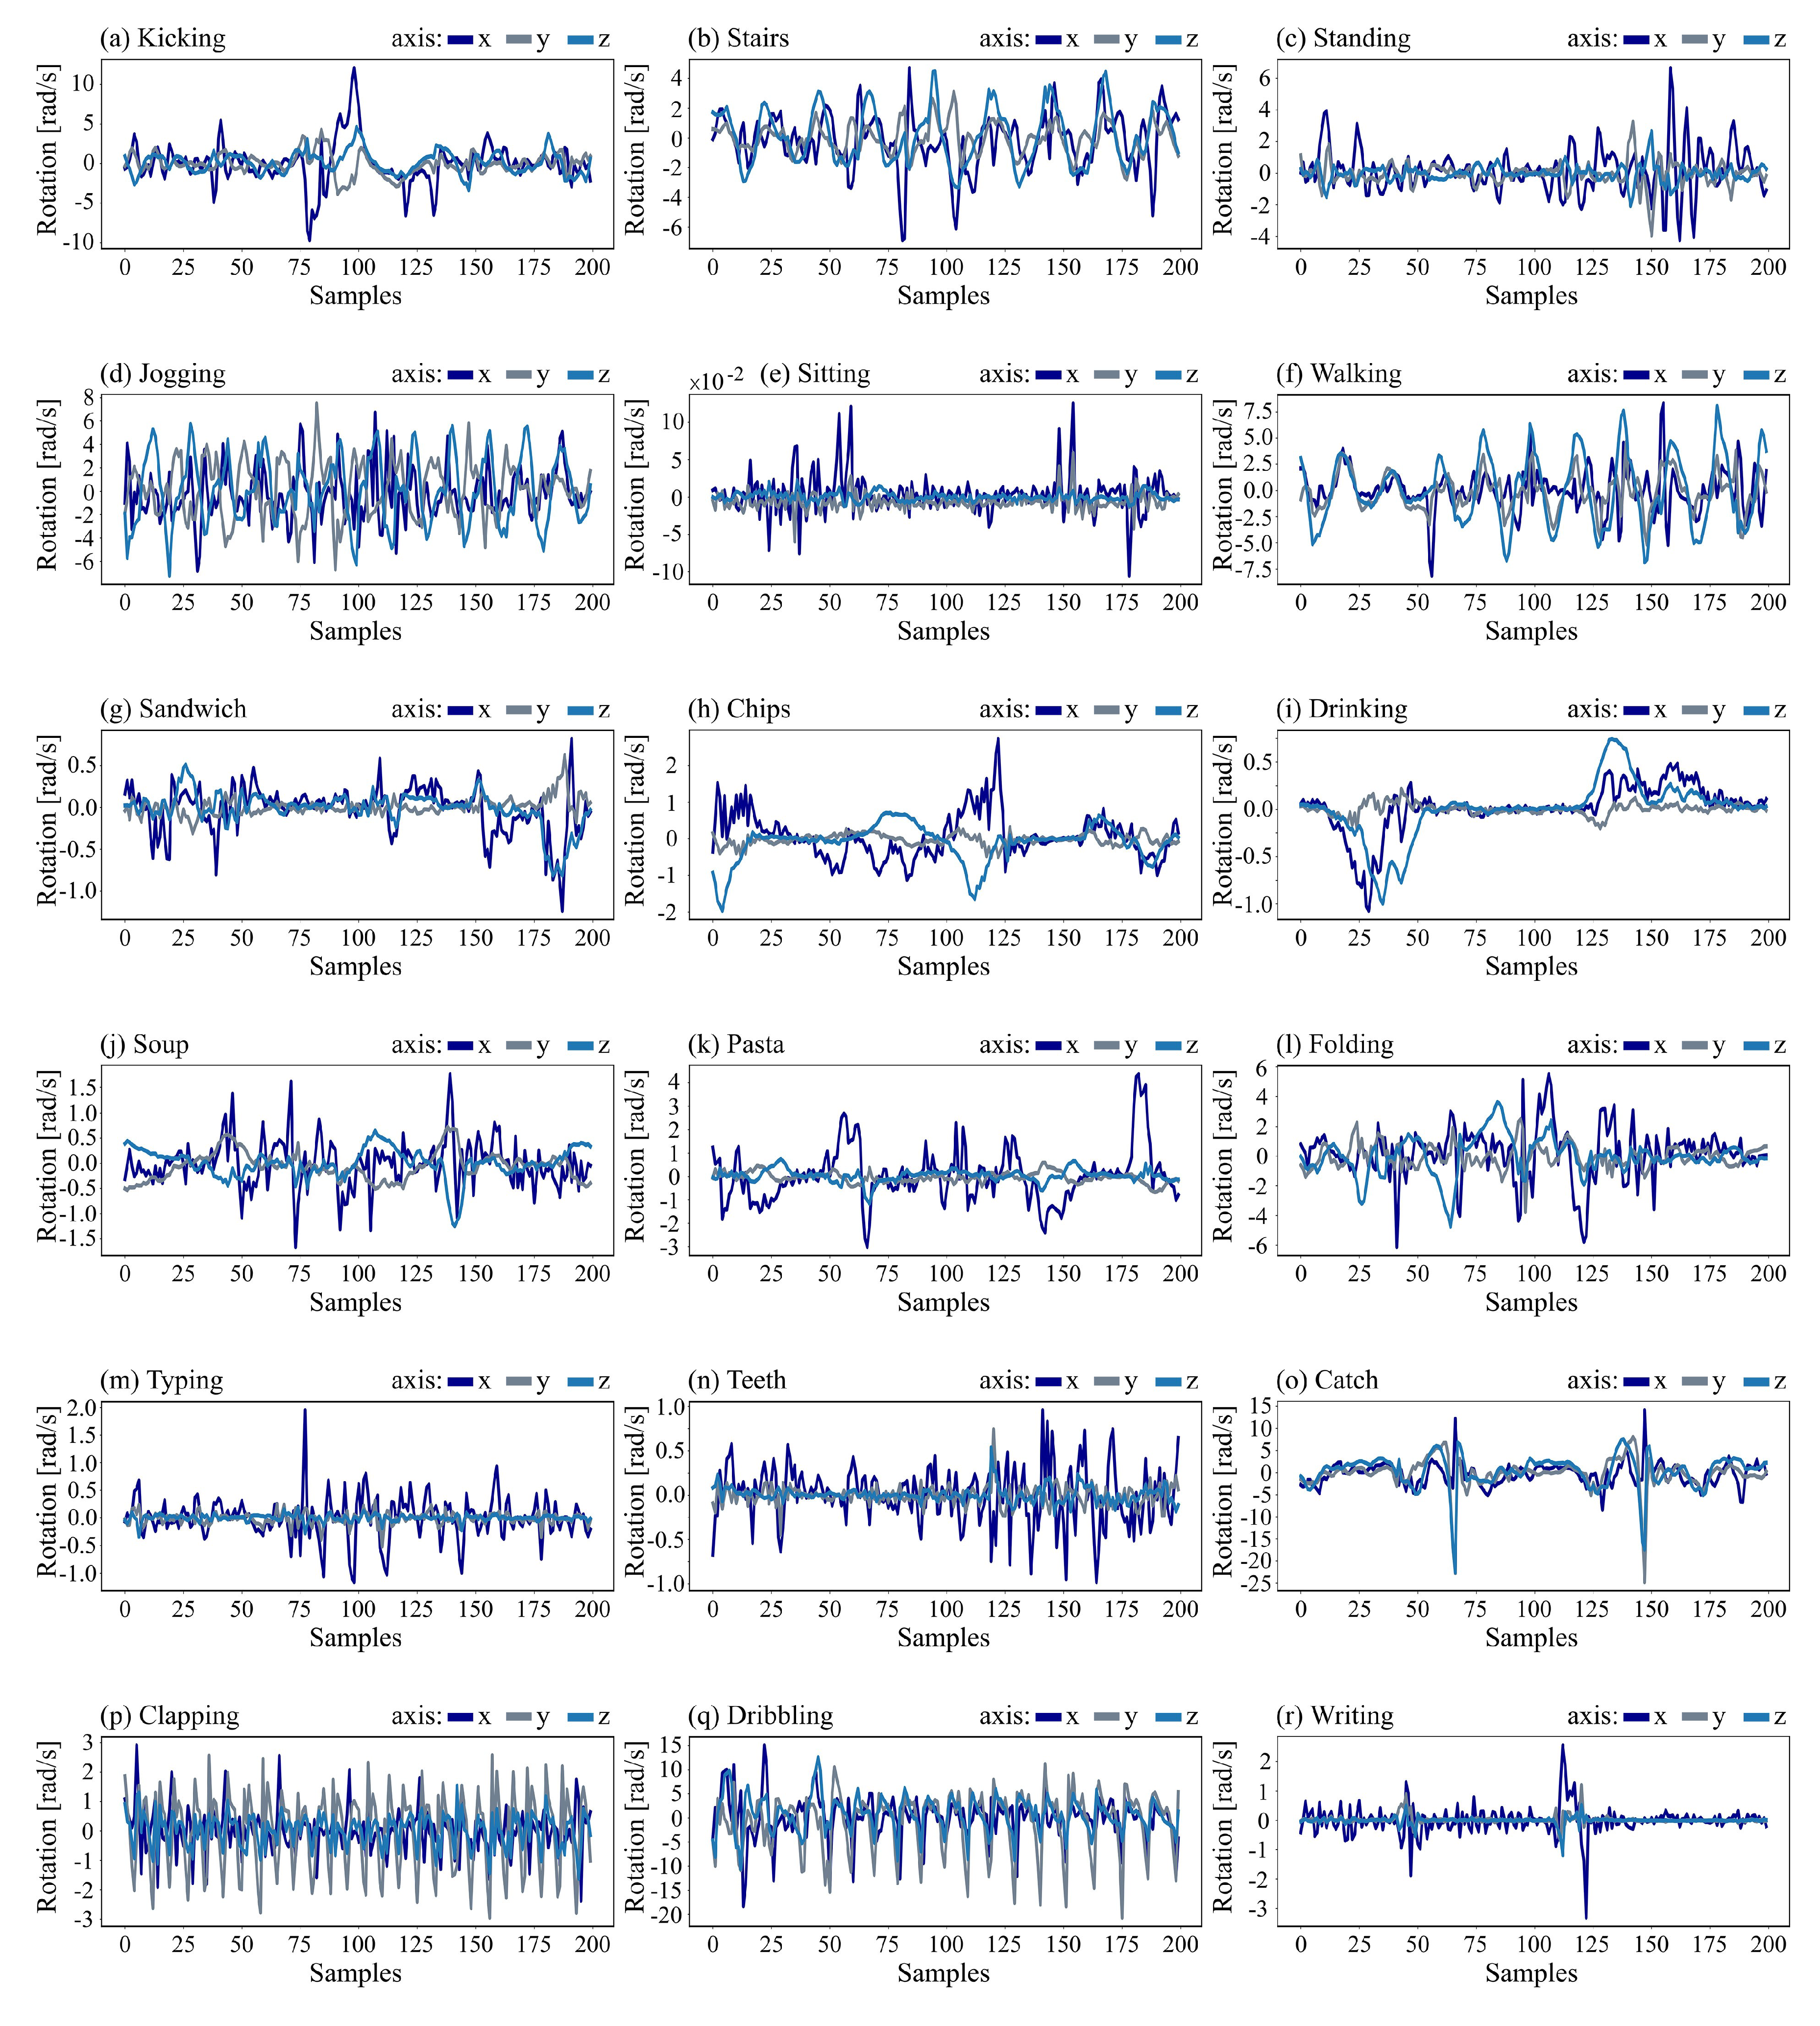
Activity gyroscope data for 10 s of (a) kicking, (b) stairs, (c) standing, (d) jogging, (e) sitting, (f) walking, (g) sandwich, (h) chips, (i) drinking, (j) soup, (k) pasta, (l) folding, (m) typing, (n) teeth, (o) catch, (p) clapping, (q) dribbling, and (r) writing.
Figure 5.
Activity gyroscope data for 10 s of (a) kicking, (b) stairs, (c) standing, (d) jogging, (e) sitting, (f) walking, (g) sandwich, (h) chips, (i) drinking, (j) soup, (k) pasta, (l) folding, (m) typing, (n) teeth, (o) catch, (p) clapping, (q) dribbling, and (r) writing.
Figure 6.
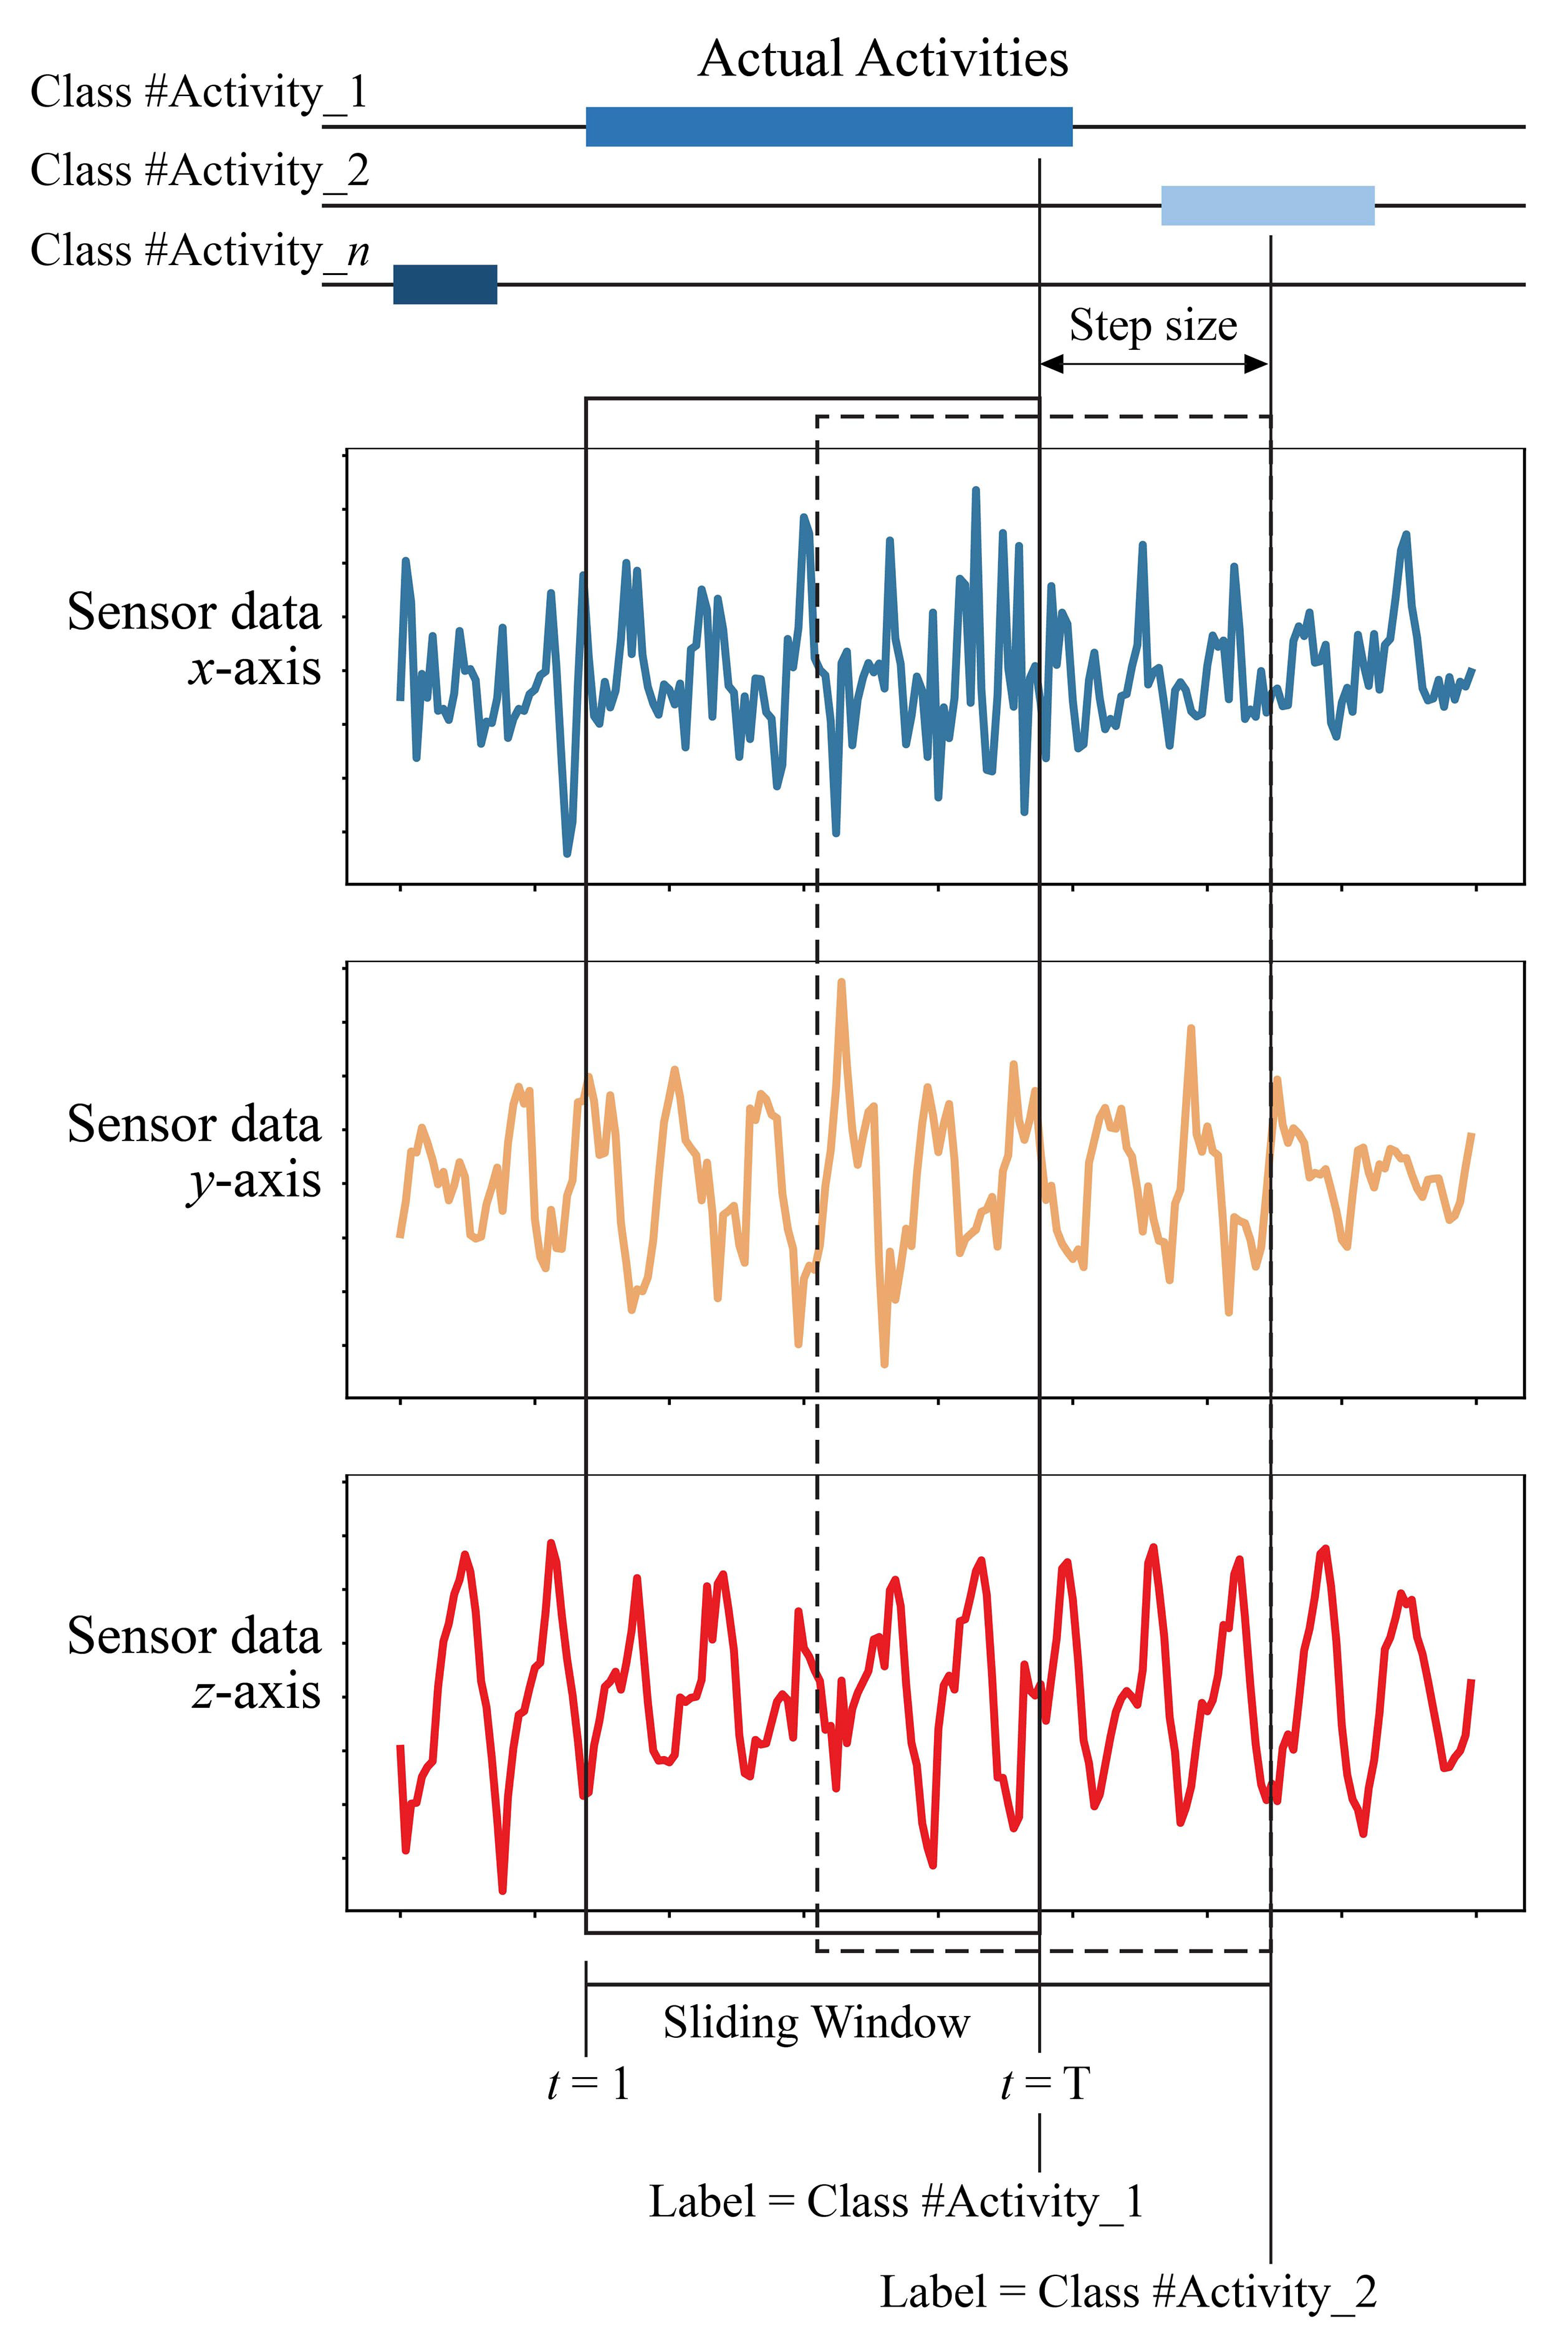
Data segmentation process by a sliding window of 10 s to handle time-series data on the HAR problem.
Figure 6.
Data segmentation process by a sliding window of 10 s to handle time-series data on the HAR problem.
Figure 7.
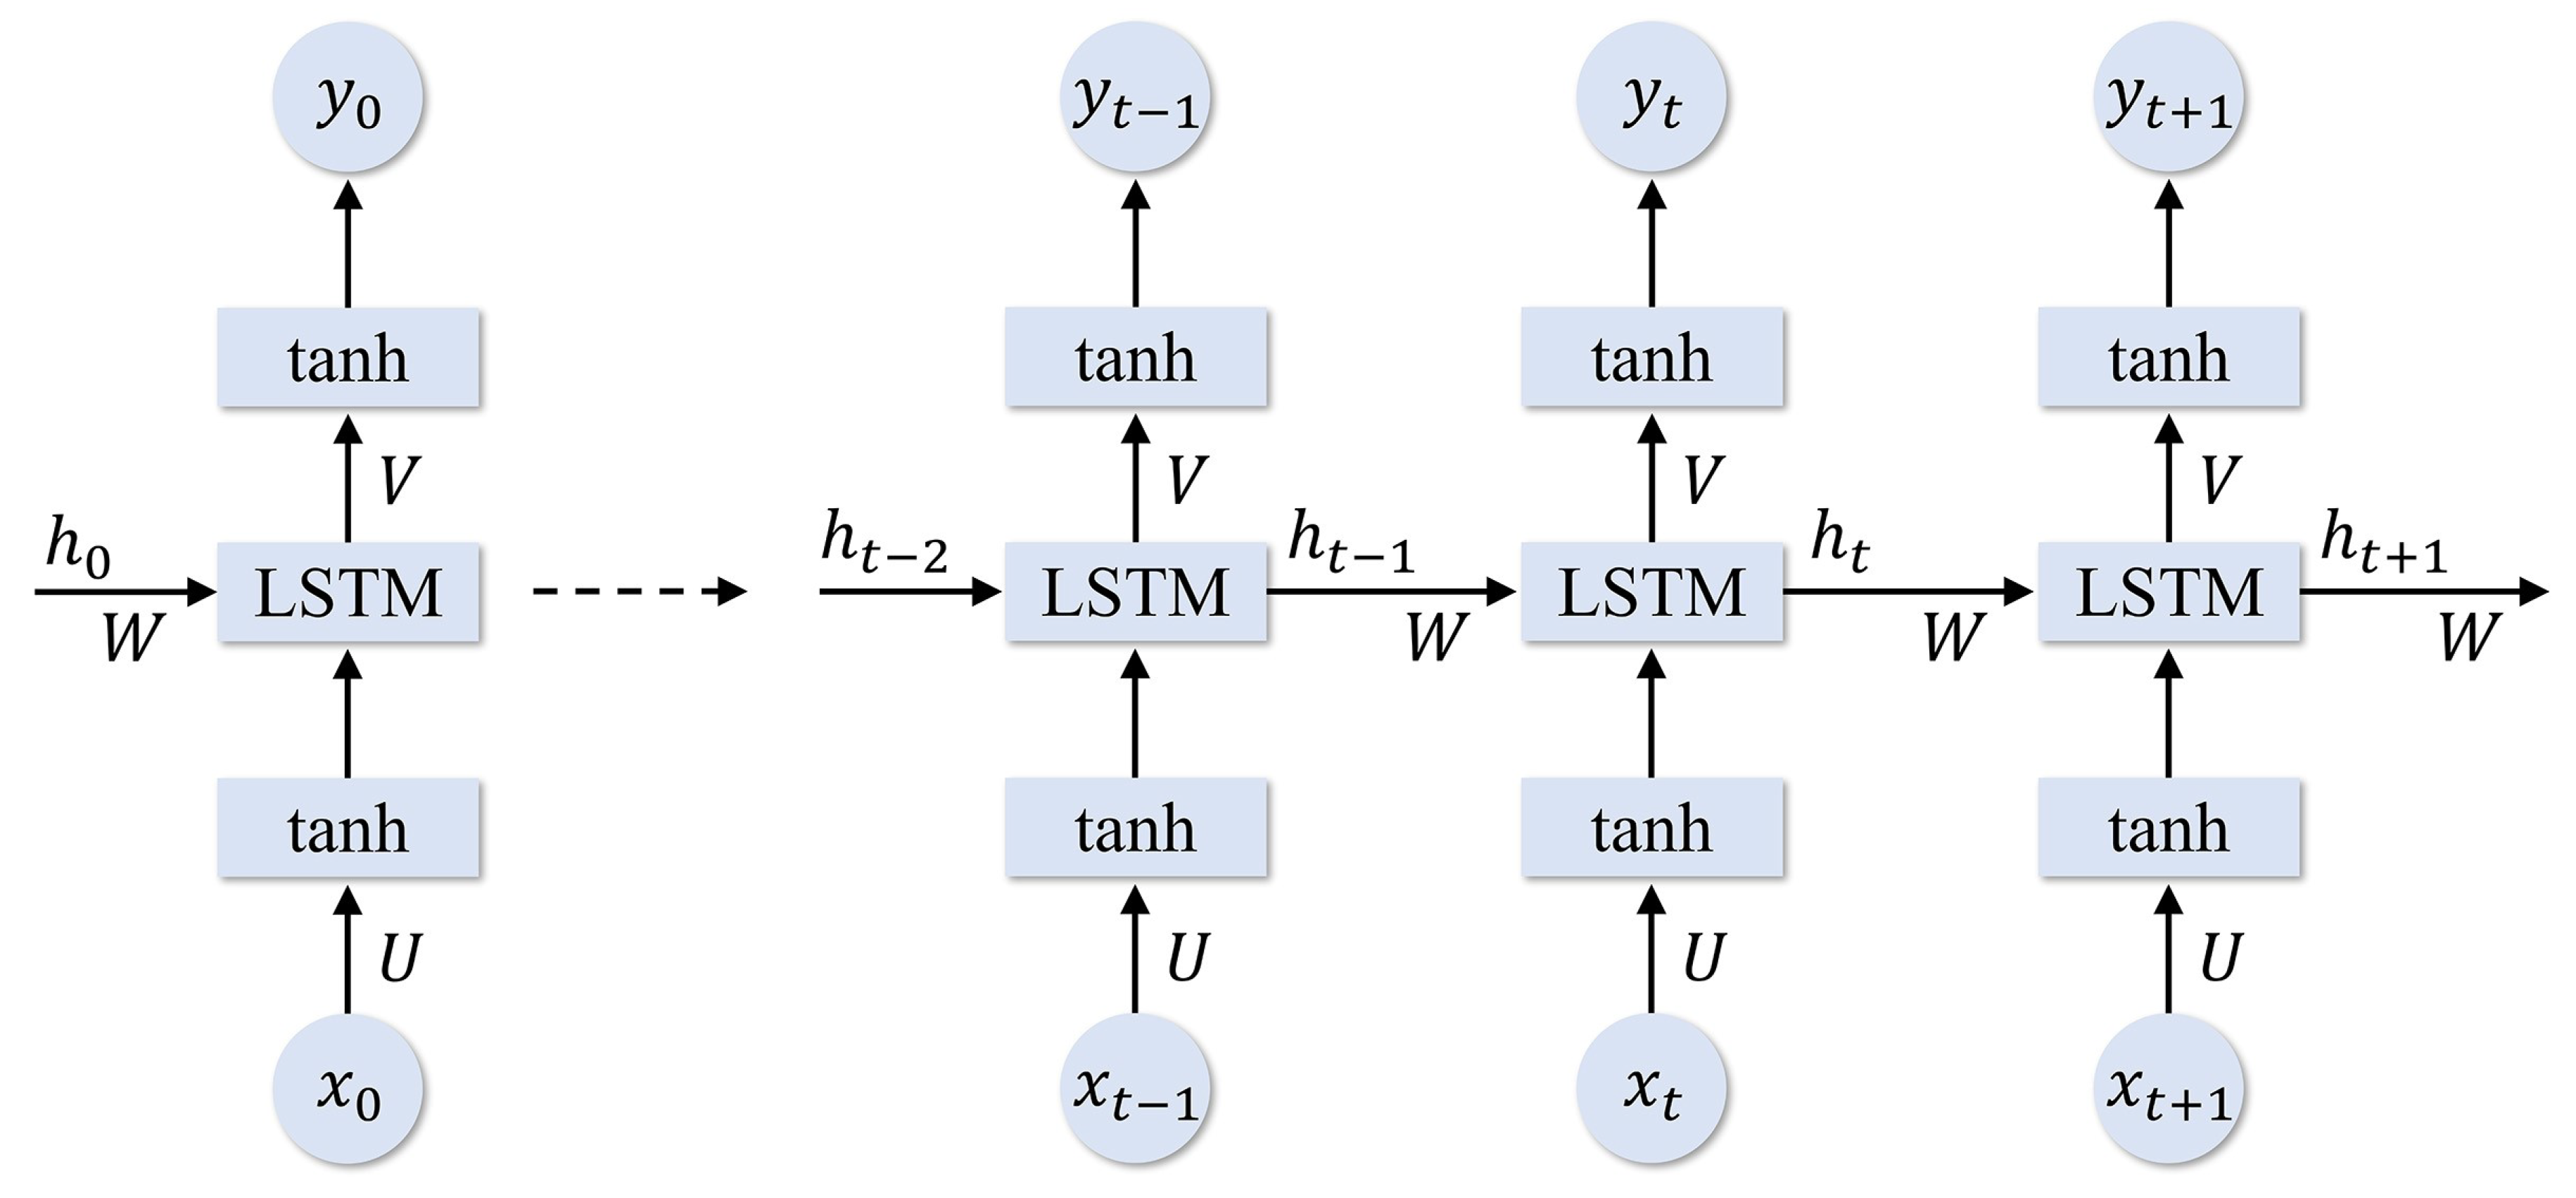
The unfold structure of one-layer baseline Long Short-Term Memory (LSTM).
Figure 7.
The unfold structure of one-layer baseline Long Short-Term Memory (LSTM).
Figure 8.
The structure of an LSTM node.
Figure 8.
The structure of an LSTM node.
Figure 9.
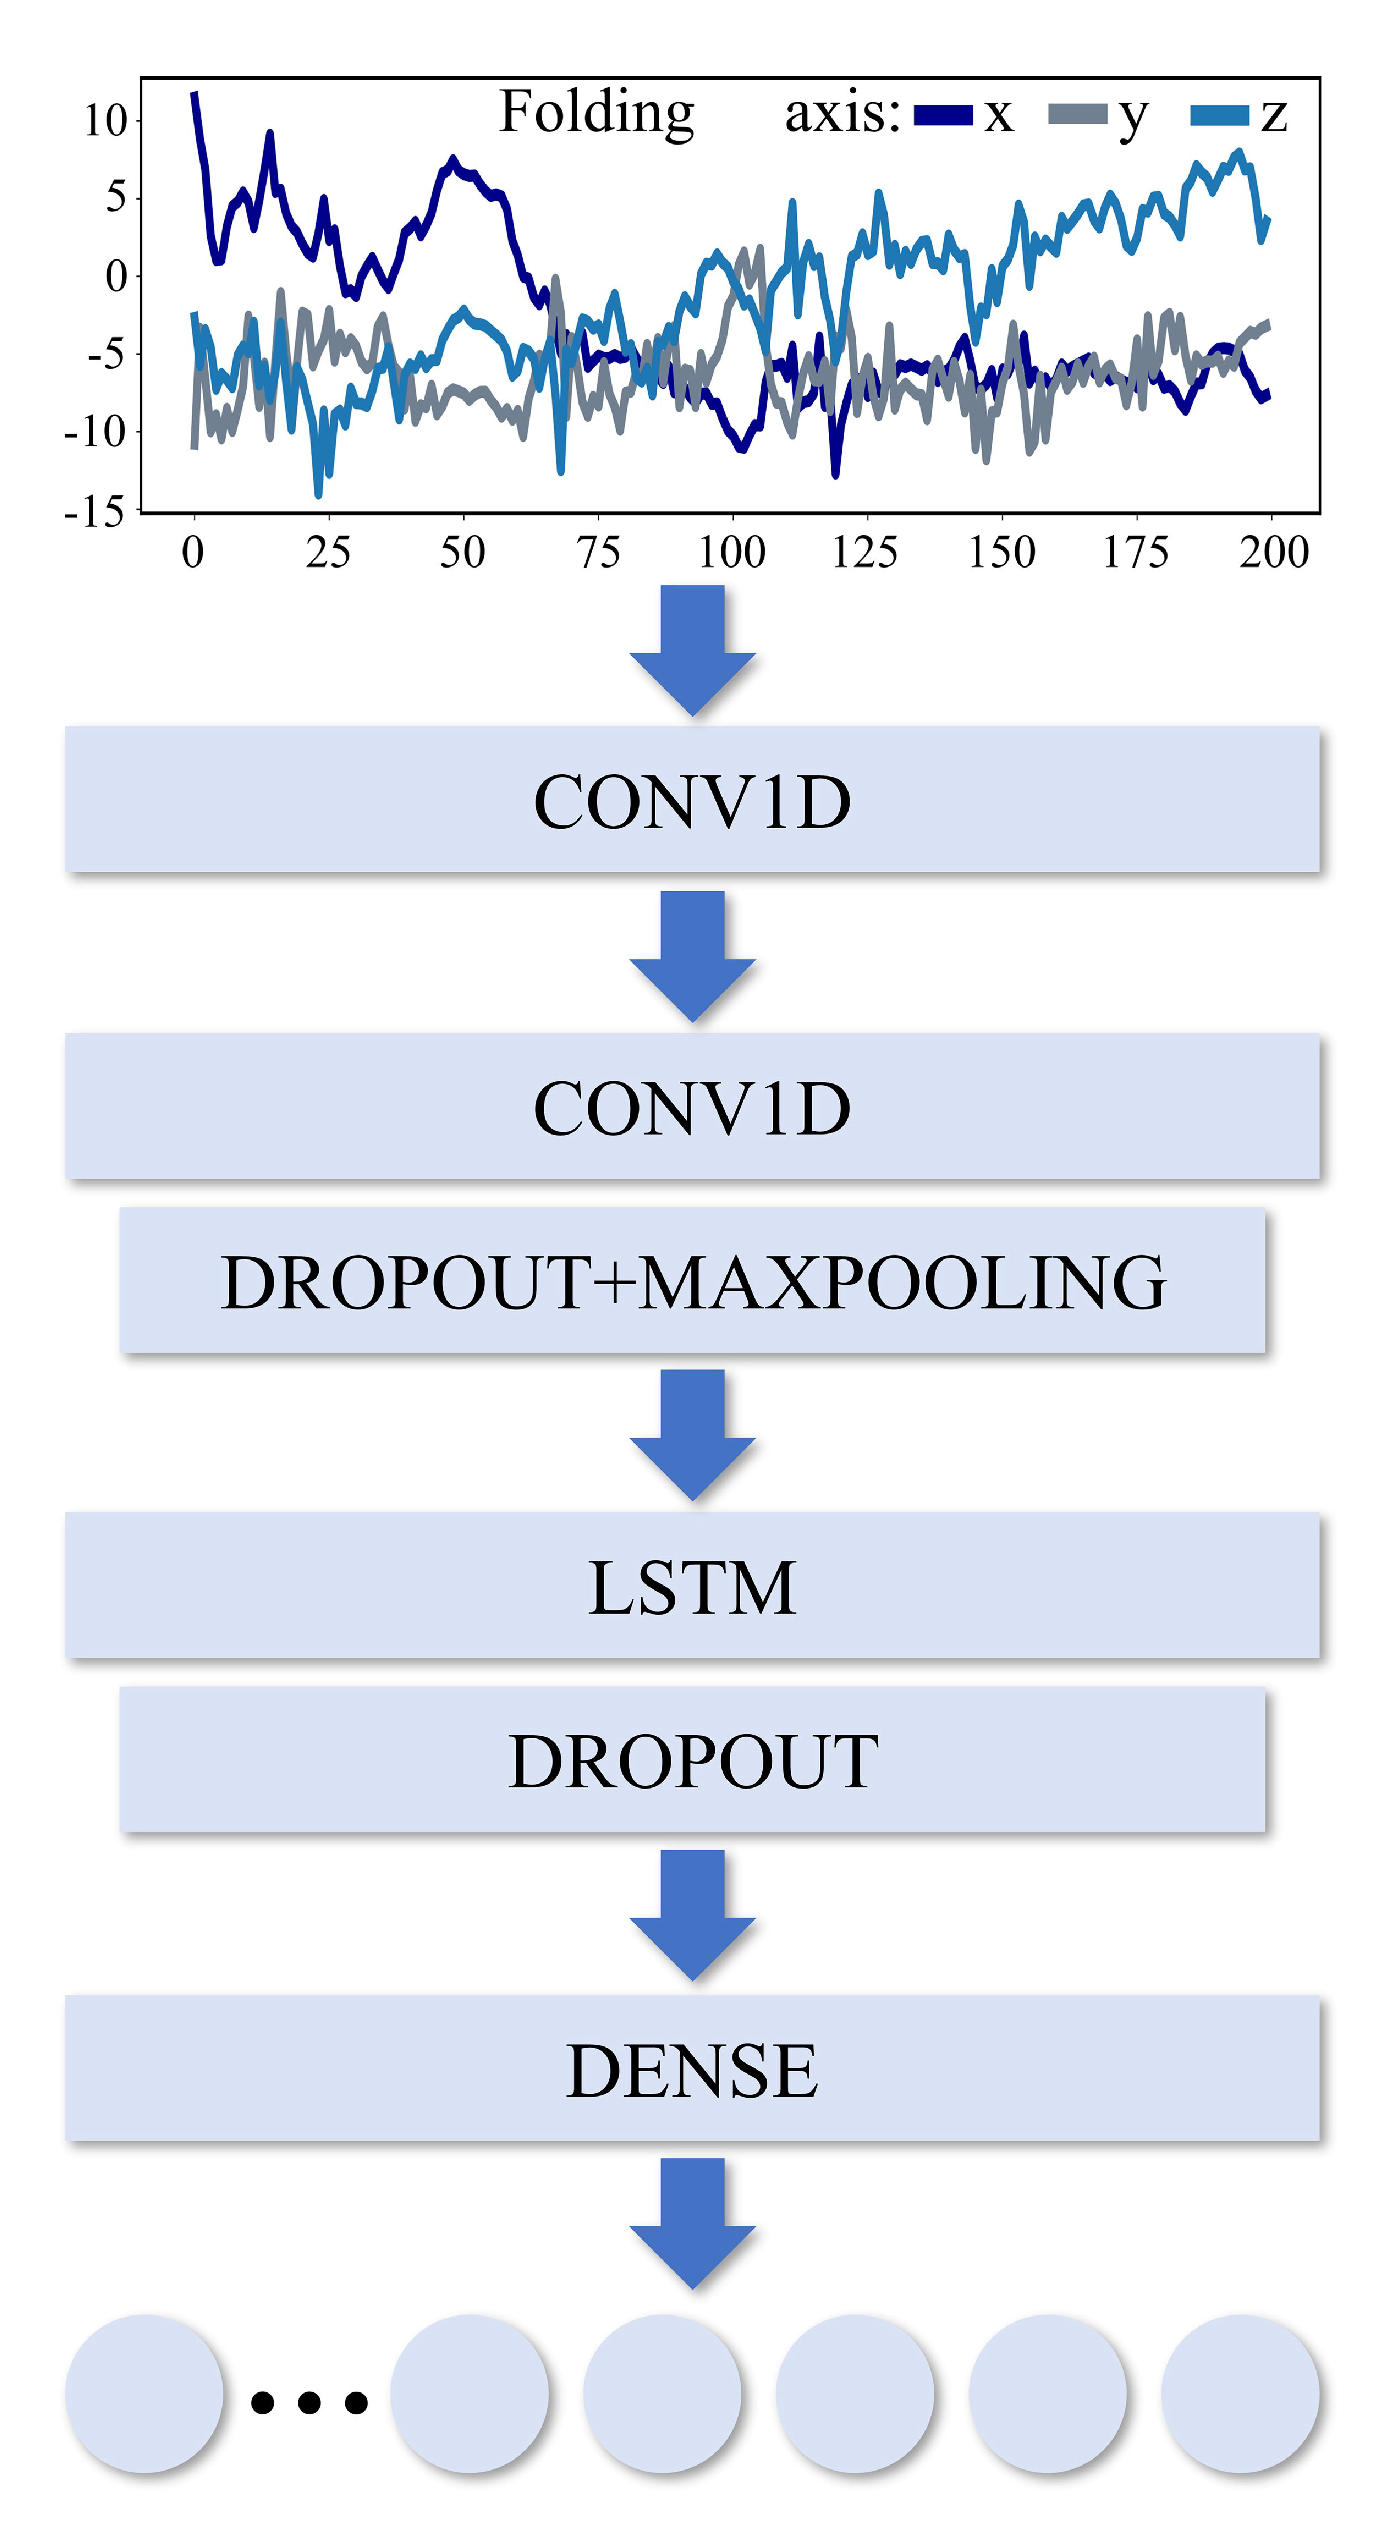
The proposed Convolution Neural Network (CNN)-LSTM network structure in this research.
Figure 9.
The proposed Convolution Neural Network (CNN)-LSTM network structure in this research.
Figure 10.
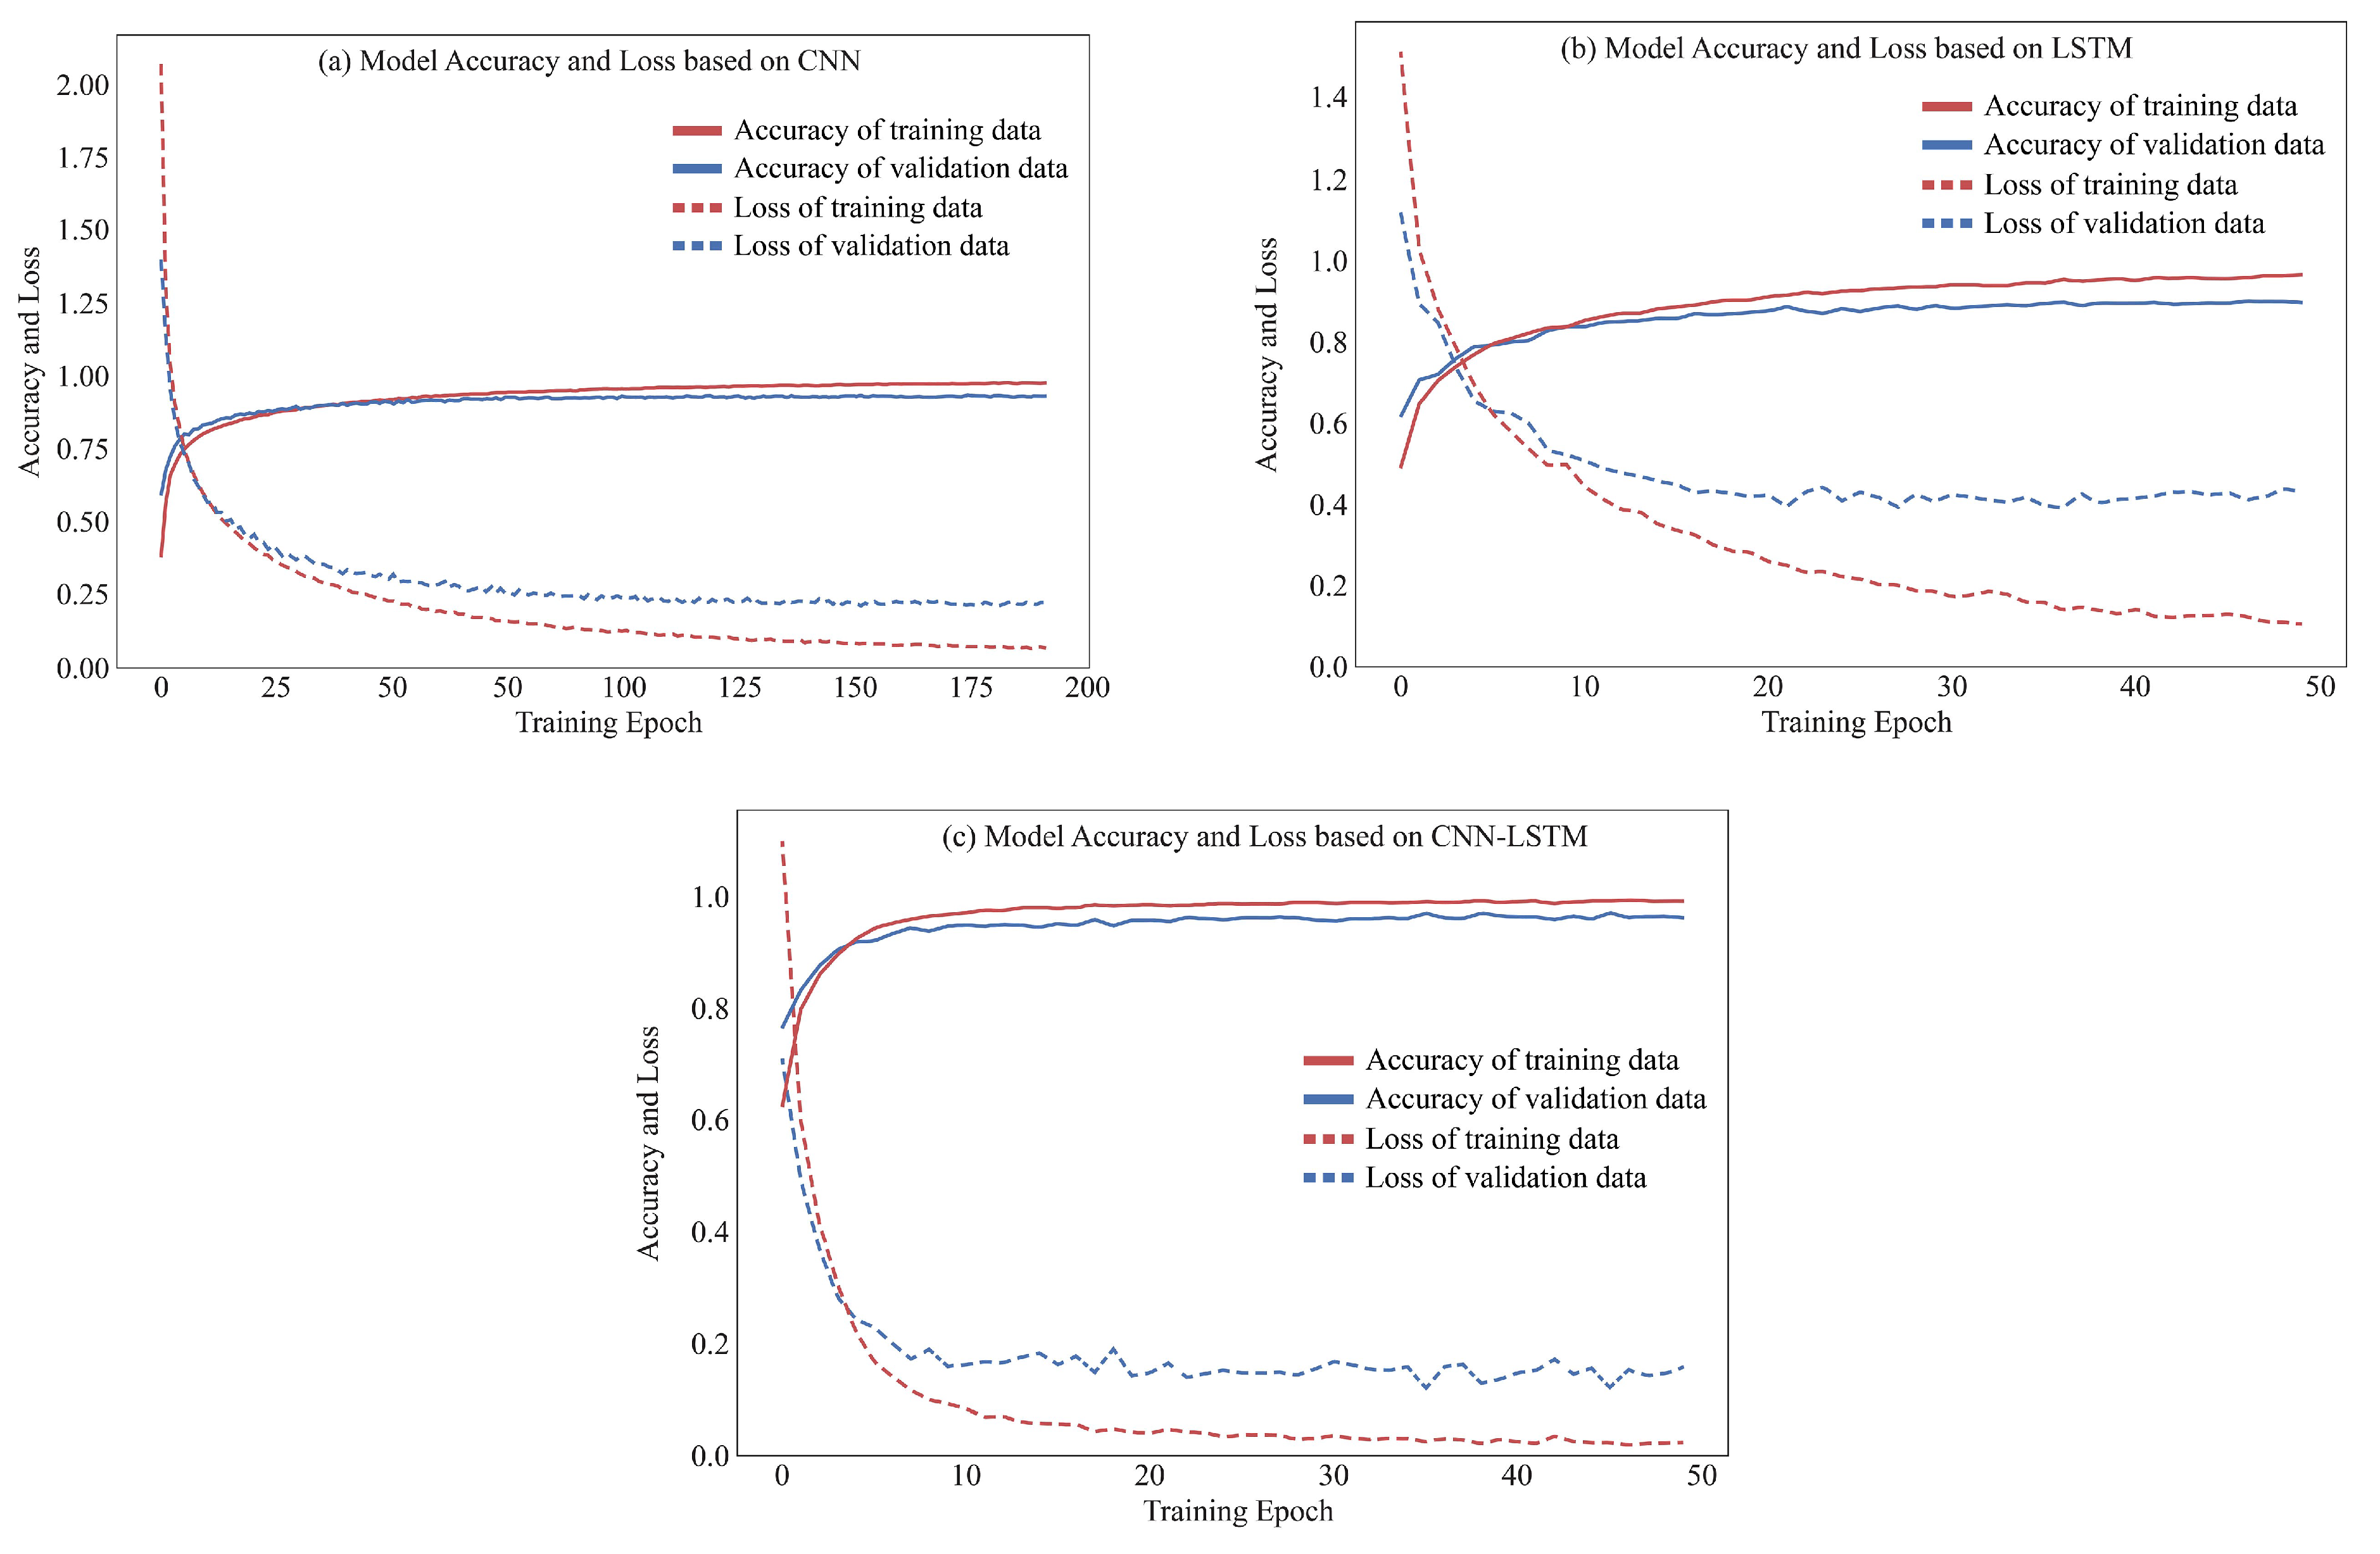
Accuracy and loss examples of the training process of (a) CNN, (b) LSTM, and (c) proposed CNN-LSTM.
Figure 10.
Accuracy and loss examples of the training process of (a) CNN, (b) LSTM, and (c) proposed CNN-LSTM.
Figure 11.
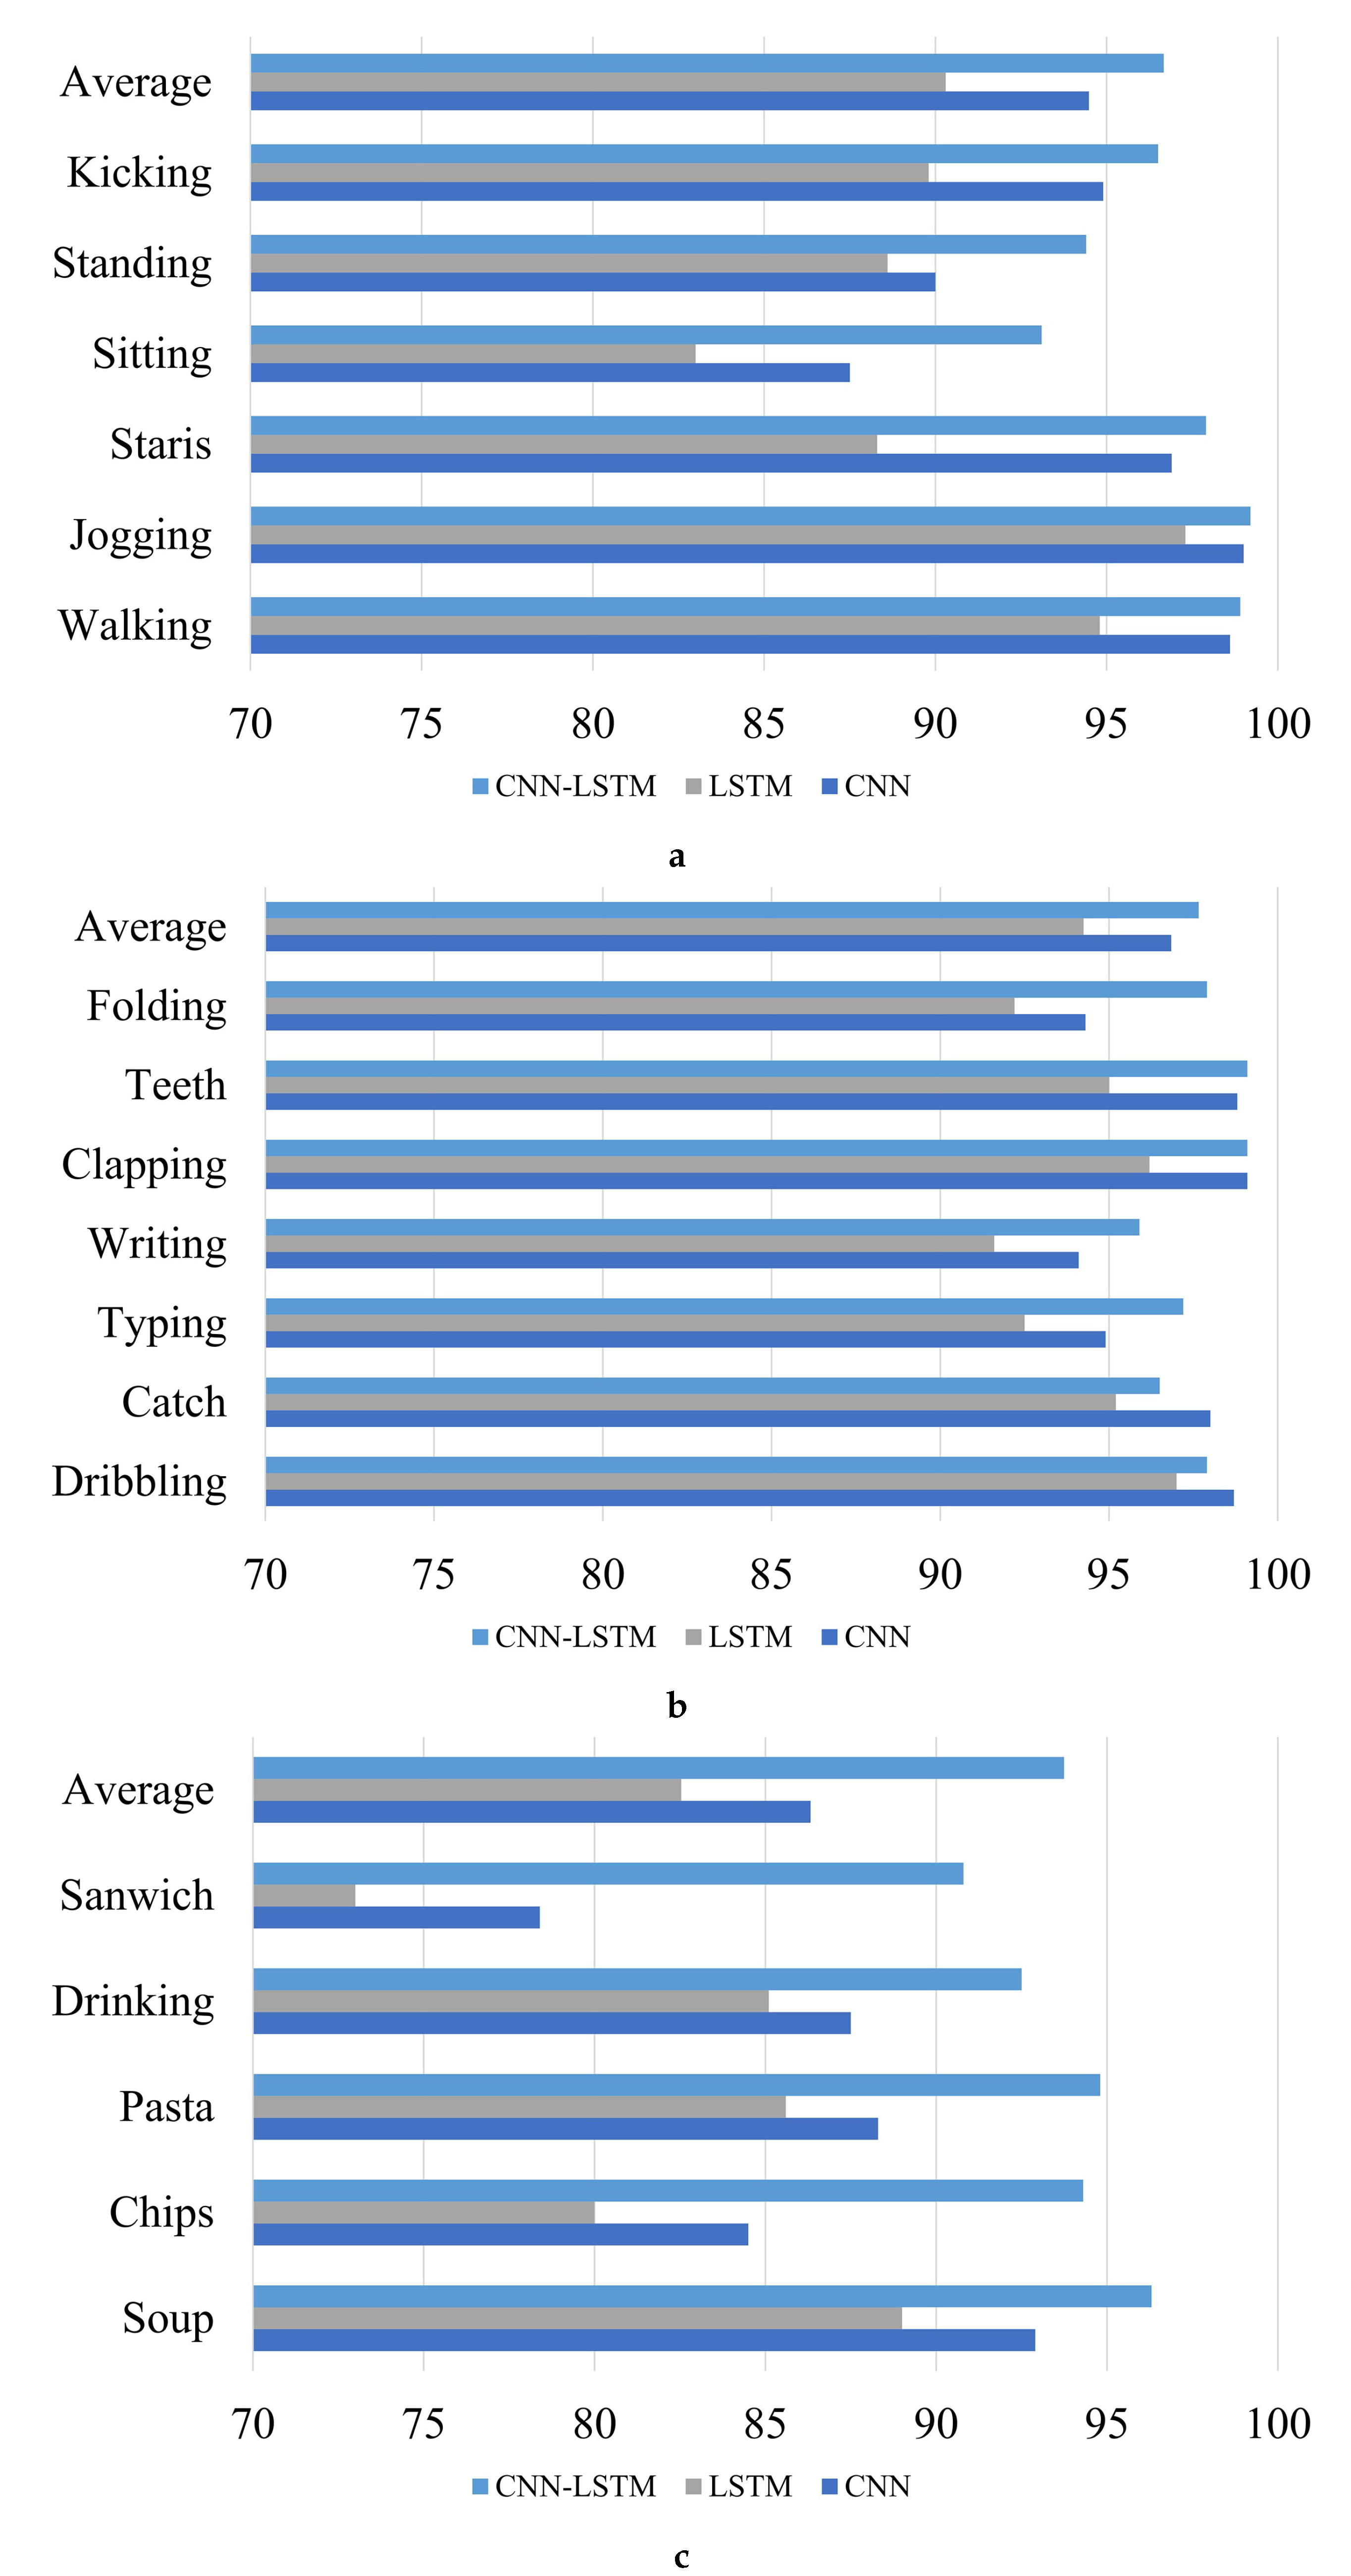
F-measure of the different deep learning (DL) models (trained from smartwatch sensor data on the WIDSM dataset) of (a) Non-Hand-Oriented Activities, (b) Hand-Oriented Activities (General), and (c) Hand-Oriented Activities (Eating).
Figure 11.
F-measure of the different deep learning (DL) models (trained from smartwatch sensor data on the WIDSM dataset) of (a) Non-Hand-Oriented Activities, (b) Hand-Oriented Activities (General), and (c) Hand-Oriented Activities (Eating).
Figure 12.
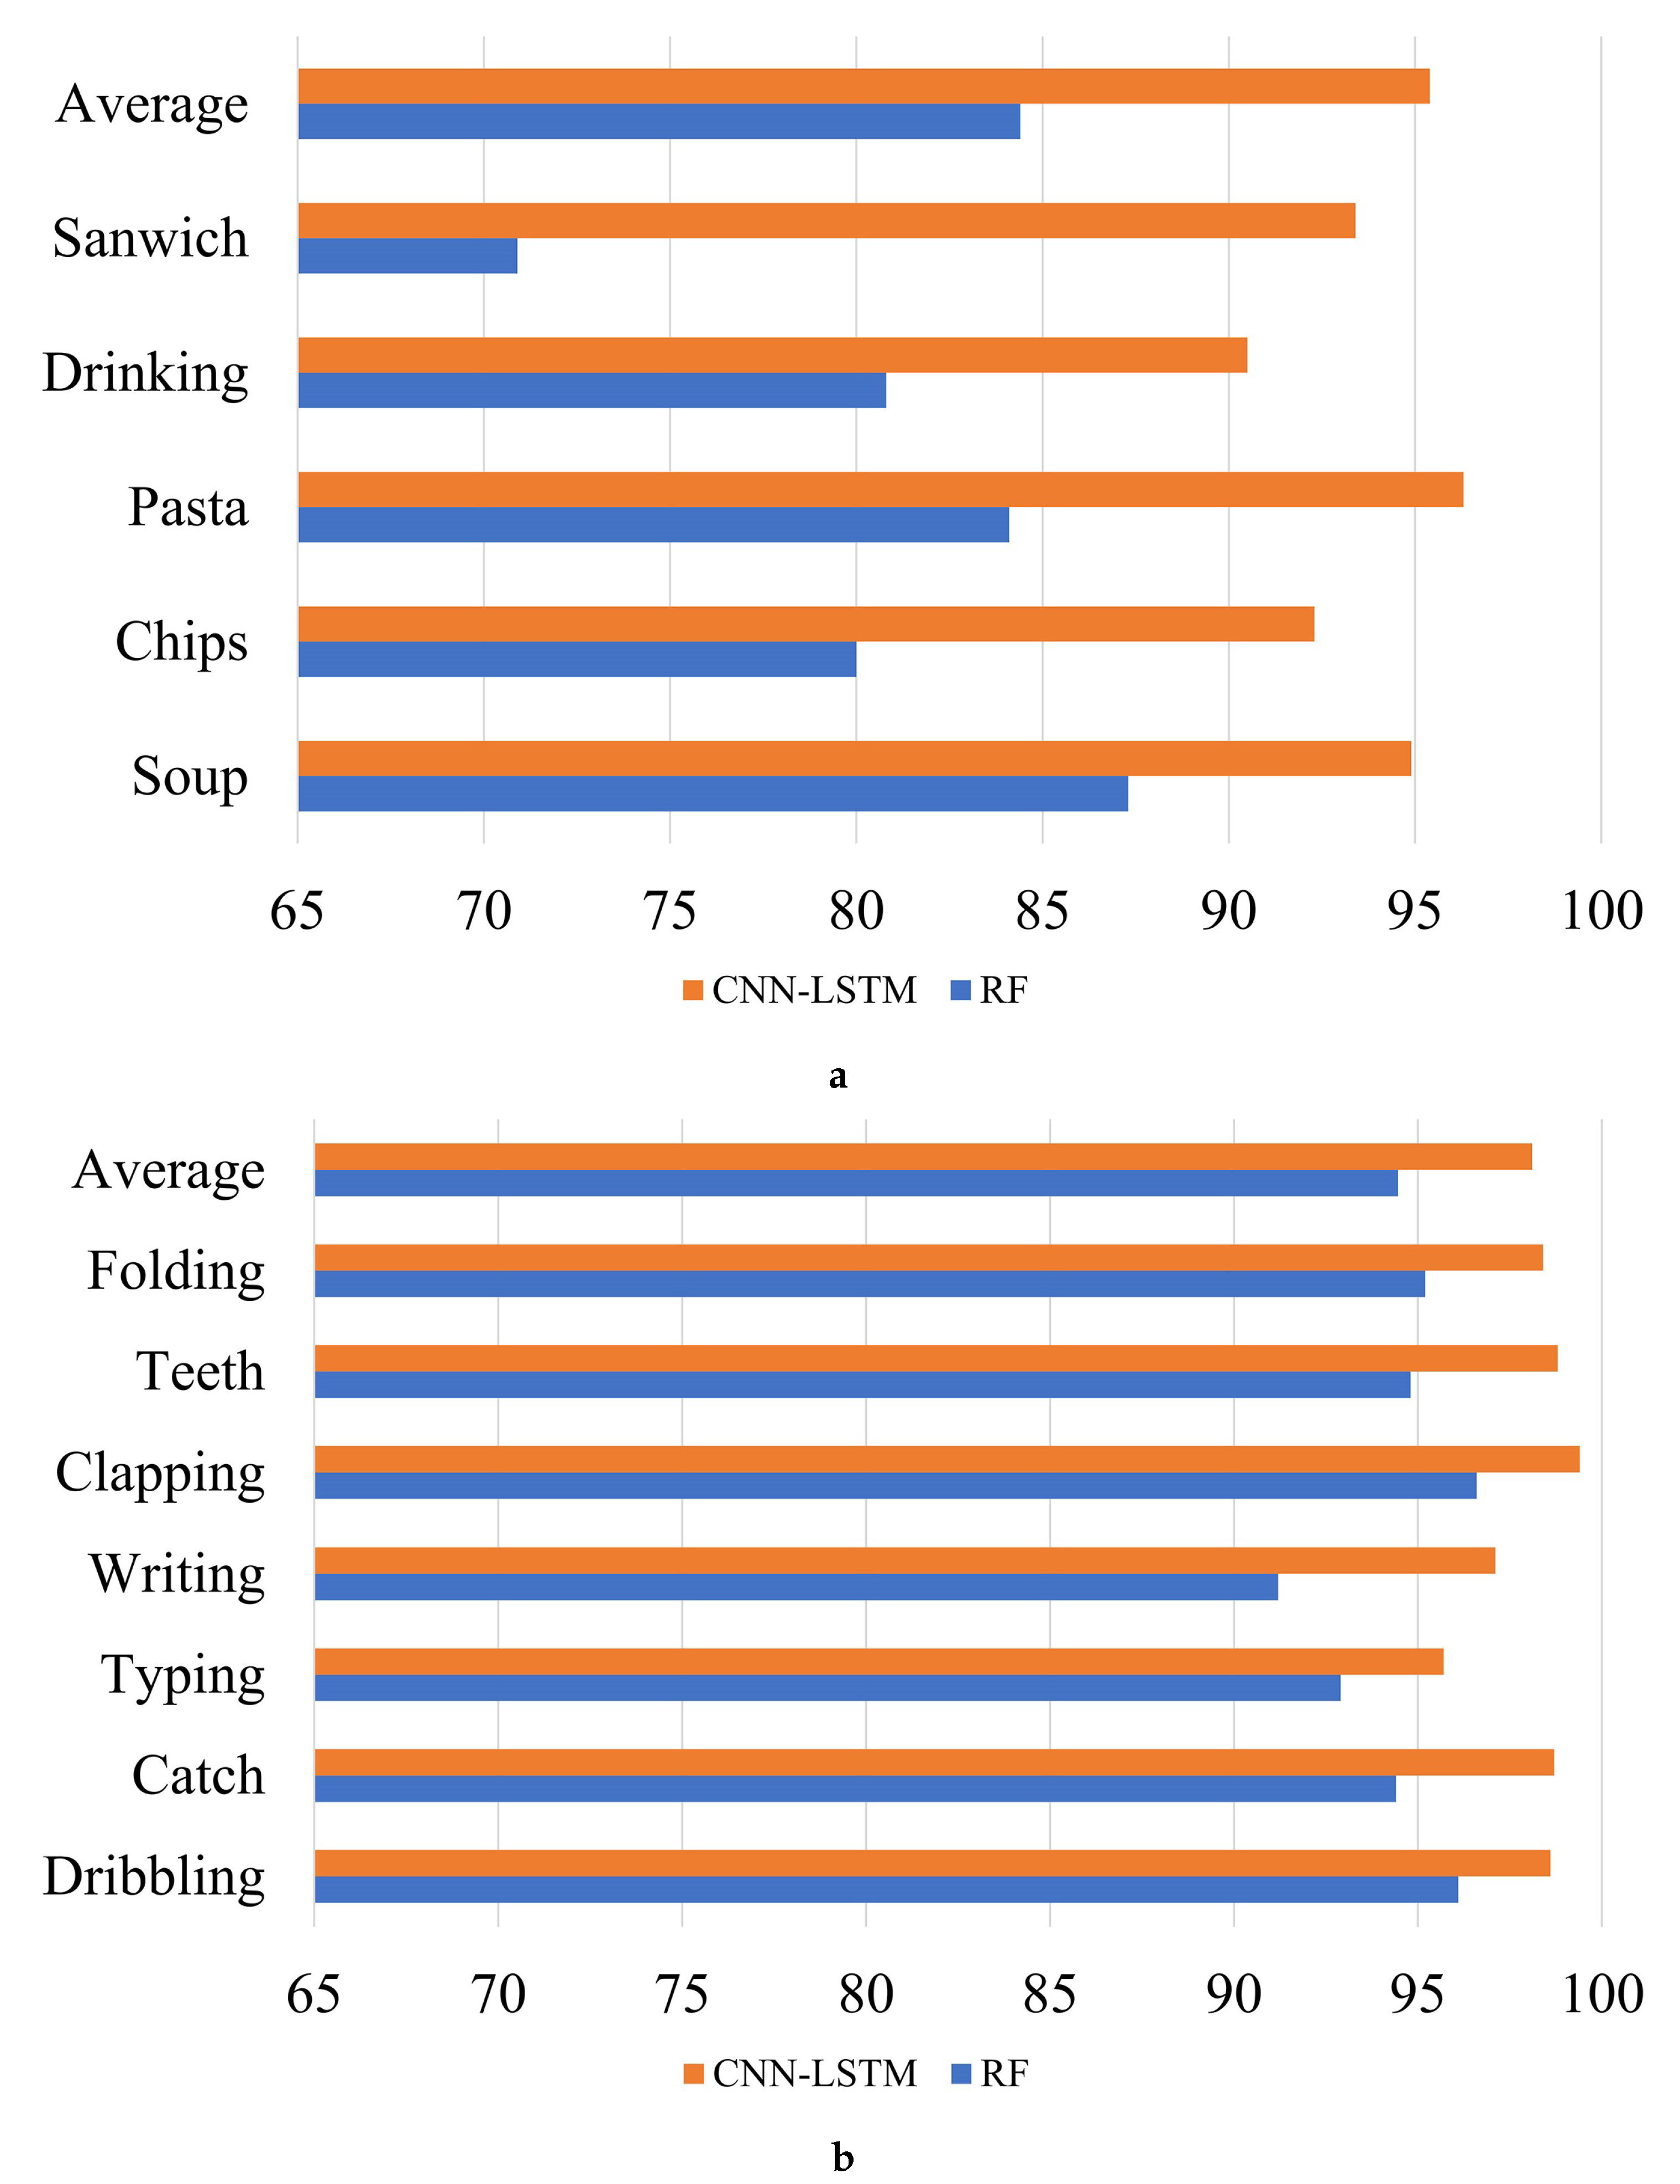
Performance (accuracy %) of comparison results: (a) Comparison results of the eating activity, and (b) Comparison results of the general activity
Figure 12.
Performance (accuracy %) of comparison results: (a) Comparison results of the eating activity, and (b) Comparison results of the general activity
Table 1.
Numbers of raw sensor data.
Table 1.
Numbers of raw sensor data.
| | 51 Subjects | Selected 44 Subjects |
|---|
| raw accelerometer data | 3,777,046 | 2,969,030 |
| raw gyroscope data | 3,440,342 | 2,960,050 |
Table 2.
Numbers of sensor samples
Table 2.
Numbers of sensor samples
| | 51 Subjects | Training Set (70%) | Test Set (30%) |
|---|
| raw accelerometer data | 59,380 | 41,566 | 17,814 |
| raw gyroscope data | 59,201 | 41,441 | 17,760 |
Table 3.
Layer types of baseline deep learning models and the proposed CNN-LSTM mode.
Table 3.
Layer types of baseline deep learning models and the proposed CNN-LSTM mode.
| DL Models | Layer Types |
|---|
| CNN | Conv1D–Dropoput–Maxpooling–Dense–Softmax |
| LSTM | Lstm–Dropout–Dense–Softmax |
| CNN-LSTM | Conv1D–Conv1d–Dropout–Maxpooling–Lstm–Dropout–Dense–Softmax |
Table 4.
Experimental results of all three scenarios with two baseline deep learning models and the proposed CNN-LSTM model.
Table 4.
Experimental results of all three scenarios with two baseline deep learning models and the proposed CNN-LSTM model.
| Scenario | Model | Evaluation Metrics |
|---|
| Accuracy | Precision | Recall | F-measure |
|---|
| | CNN | 89.60 | 89.60 | 89.60 | 89.60 |
| Acc. | LSTM | 87.80 | 88.00 | 87.80 | 87.90 |
| | CNN-LSTM | 95.20 | 95.20 | 95.20 | 95.20 |
| | CNN | 86.40 | 86.90 | 86.40 | 86.50 |
| Gyro. | LSTM | 84.10 | 84.30 | 84.10 | 84.00 |
| | CNN-LSTM | 95.40 | 95.40 | 95.40 | 95.40 |
| | CNN | 93.10 | 93.10 | 93.10 | 93.10 |
| Acc. + Gyro. | LSTM | 89.60 | 89.70 | 89.60 | 89.60 |
| | CNN-LSTM | 96.20 | 96.30 | 96.20 | 96.30 |
Table 5.
Confusion Matrix for the proposed CNN-LSTM.
Table 5.
Confusion Matrix for the proposed CNN-LSTM.
| | Walking | Jogging | Stairs | Sitting | Standing | Typing | Teeth | Soup | Chips | Pasta | Drinking | Sandwich | Kicking | Catch | Dribbling | Writing | Clapping | Folding | Recall |
|---|
| walking | 952 | 1 | 4 | 1 | 0 | 0 | 0 | 0 | 0 | 0 | 0 | 0 | 6 | 3 | 0 | 0 | 0 | 1 | 98.35% |
| jogging | 2 | 933 | 5 | 0 | 0 | 0 | 0 | 0 | 0 | 0 | 0 | 0 | 0 | 2 | 2 | 1 | 0 | 0 | 98.73% |
| stairs | 1 | 1 | 977 | 3 | 0 | 0 | 0 | 0 | 0 | 1 | 0 | 0 | 6 | 2 | 0 | 0 | 0 | 7 | 97.89% |
| sitting | 0 | 0 | 4 | 956 | 16 | 1 | 0 | 1 | 3 | 2 | 5 | 14 | 0 | 0 | 0 | 7 | 0 | 2 | 94.56% |
| standing | 2 | 0 | 0 | 26 | 953 | 4 | 0 | 0 | 4 | 4 | 0 | 13 | 3 | 2 | 5 | 1 | 0 | 0 | 93.71% |
| typing | 0 | 0 | 0 | 7 | 1 | 891 | 3 | 0 | 3 | 2 | 0 | 0 | 0 | 0 | 0 | 24 | 0 | 0 | 95.70% |
| teeth | 0 | 0 | 0 | 5 | 1 | 2 | 1017 | 1 | 0 | 0 | 0 | 0 | 1 | 0 | 0 | 0 | 1 | 1 | 98.83% |
| soup | 0 | 0 | 0 | 3 | 3 | 1 | 3 | 920 | 7 | 19 | 3 | 4 | 0 | 0 | 0 | 4 | 0 | 2 | 94.94% |
| chips | 0 | 0 | 0 | 8 | 3 | 2 | 0 | 10 | 918 | 16 | 8 | 28 | 0 | 0 | 0 | 0 | 0 | 2 | 92.26% |
| pasta | 0 | 0 | 0 | 5 | 0 | 0 | 0 | 6 | 6 | 977 | 3 | 13 | 0 | 0 | 0 | 0 | 4 | 1 | 96.26% |
| drinking | 0 | 0 | 0 | 11 | 15 | 1 | 0 | 1 | 4 | 15 | 898 | 40 | 0 | 0 | 0 | 7 | 0 | 0 | 90.52% |
| sandwich | 0 | 0 | 1 | 9 | 5 | 0 | 0 | 2 | 5 | 9 | 27 | 921 | 6 | 0 | 0 | 0 | 0 | 1 | 93.41% |
| kicking | 0 | 1 | 5 | 0 | 2 | 0 | 0 | 0 | 0 | 1 | 4 | 6 | 960 | 24 | 0 | 0 | 0 | 3 | 95.43% |
| catch | 0 | 0 | 0 | 1 | 1 | 0 | 0 | 0 | 0 | 1 | 1 | 0 | 2 | 986 | 5 | 1 | 0 | 1 | 98.70% |
| dribbling | 0 | 0 | 0 | 0 | 0 | 0 | 0 | 0 | 0 | 0 | 0 | 0 | 0 | 8 | 963 | 6 | 0 | 0 | 98.57% |
| writing | 0 | 0 | 0 | 7 | 1 | 0 | 0 | 0 | 2 | 0 | 0 | 2 | 0 | 2 | 13 | 1016 | 3 | 0 | 97.13% |
| clapping | 0 | 0 | 0 | 0 | 0 | 0 | 0 | 0 | 0 | 0 | 0 | 0 | 0 | 0 | 0 | 3 | 928 | 3 | 99.36% |
| folding | 0 | 0 | 1 | 1 | 0 | 0 | 0 | 0 | 0 | 0 | 0 | 1 | 0 | 4 | 2 | 3 | 3 | 928 | 98.41% |
| Precision | 99.50% | 99.68% | 97.99% | 91.66% | 95.20% | 98.78% | 99.41% | 97.77% | 96.43% | 93.31% | 94.63% | 88.39% | 97.56% | 95.45% | 97.27% | 94.69% | 98.83% | 97.48% | 96.20% |
Table 6.
Experimental results of stratified ten-fold cross validation.
Table 6.
Experimental results of stratified ten-fold cross validation.
| Model | Evaluation Metrics |
|---|
| Accuracy (SD) | Precision (SD) | Recall (SD) | F-Measure (SD) |
|---|
| CNN | 90.92% (+/−0.53%) | 97.12% (+/−0.73%) | 97.17% (+/−1.41%) | 97.14% (+/−0.72%) |
| LSTM | 93.96% (+/−0.46%) | 99.48% (+/−0.51%) | 98.95% (+/−0.88%) | 99.21% (+/− 0.41%) |
| CNN-LSTM | 97.40% (+/−0.38%) | 98.60% (+/−2.59%) | 99.48% (+/−0.51%) | 99.02% (+/−1.30%) |
Table 7.
Performance (% accuracy) of comparison results.
Table 7.
Performance (% accuracy) of comparison results.
| | Activity | Previous Work | Proposed CNN-LTSM |
|---|
| | Acc. | Gyro. | Acc. + Gyro. | Acc. | Gyro. | Acc. + Gyro. |
|---|
| Non-hand-oriented | Walking | 87.70 | 85.60 | 89.10 | 97.70 | 96.60 | 98.30 |
| Jogging | 96.90 | 93.60 | 97.30 | 99.40 | 98.70 | 98.70 |
| Stairs | 85.50 | 70.40 | 84.00 | 96.20 | 96.50 | 97.90 |
| Sitting | 87.30 | 62.80 | 84.00 | 92.20 | 91.80 | 94.60 |
| Standing | 90.70 | 59.00 | 89.70 | 95.30 | 92.70 | 93.70 |
| Kicking | 82.90 | 72.70 | 84.40 | 96.80 | 96.90 | 95.40 |
| Average | 88.50 | 74.02 | 88.08 | 95.27 | 95.53 | 96.43 |
| Hand-oriented general | Dribbling | 91.20 | 90.60 | 96.10 | 95.80 | 97.90 | 98.60 |
| Catch | 90.50 | 88.70 | 94.40 | 98.20 | 98.10 | 98.70 |
| Typing | 94.10 | 83.30 | 92.90 | 95.70 | 98.60 | 95.70 |
| Writing | 89.90 | 77.60 | 91.20 | 97.50 | 95.40 | 97.10 |
| Clapping | 95.00 | 92.70 | 96.60 | 99.70 | 99.30 | 99.40 |
| Teeth | 91.90 | 81.60 | 94.80 | 98.60 | 98.90 | 98.80 |
| Folding | 89.80 | 85.30 | 95.20 | 94.60 | 97.90 | 98.40 |
| Average | 91.77 | 85.69 | 94.46 | 97.16 | 98.01 | 98.10 |
| Hand-oriented eating | Soup | 86.60 | 69.10 | 87.30 | 97.30 | 91.00 | 94.90 |
| Chips | 78.80 | 60.60 | 80.00 | 88.90 | 94.30 | 92.30 |
| Pasta | 83.30 | 68.30 | 84.10 | 93.70 | 94.80 | 96.30 |
| Drinking | 80.90 | 65.20 | 80.80 | 87.30 | 89.30 | 90.50 |
| Sandwich | 72.70 | 50.50 | 70.90 | 89.20 | 88.60 | 93.40 |
| Average | 80.46 | 62.74 | 80.62 | 91.28 | 91.60 | 93.48 |


