Abstract
A continuum model for tumor invasion in a two-dimensional spatial domain based on the interaction of the urokinase plasminogen activation system with a model for cancer cell dynamics is proposed. The arising system of partial differential equations is numerically solved using the finite element method. We simulated a portion of biological tissue imposing no flux boundary conditions. We monitored the cancer cell dynamics, as well the degradation of an extra cellular matrix representative, vitronectin, and the evolution of a specific degrading enzyme, plasmin, inside the biological tissue. The computations were parameterized as a function of the indirect cell proliferation induced by a plasminogen activator inhibitor binding to vitronectin and of the indirect plasmin deactivation due to the plasminogen activator inhibitor binding to the urokinase plasminogen activator. Their role during the cancer dynamical evolution was identified, together with a possible marker helping the mapping of the cancer invasive front. Our results indicate that indirect cancer cell proliferation biases the speed of the tumor invasive front as well as the heterogeneity of the cancer cell clustering and networking, as it ultimately acts on the proteolytic activity supporting cancer formation. Because of the initial conditions imposed, the numerical solutions of the model show a symmetrical dynamical evolution of heterogeneities inside the simulated domain. Moreover, an increase of up to about 12% in the invasion speed was observed, increasing the rate of indirect cancer cell proliferation, while increasing the plasmin deactivation rate inhibits heterogeneities and networking. As cancer cell proliferation causes vitronectin consumption and plasmin formation, the intensities of the concentration maps of both vitronectin and plasmin are superimposable to the cancer cell concentration maps. The qualitative imprinting that cancer cells leave on the extra cellular matrix during the time evolution as well their activity area is identified, framing the numerical results in the context of a methodology aimed at diagnostic and therapeutic improvement.
1. Introduction
Tumor proliferation and growth are governed by complex mechanisms, involving several cell types, in which mutual molecular interactions are mediated by a variety of chemical signaling [1,2,3]. In the last decades, besides clinical and experimental studies, mathematical modeling has provided an important tool for the investigation of oncologic diseases, in order to orient both biomathematics and bioengineering research towards improvement of diagnostic and therapeutic methodologies. In general, cancer proliferation is a multi-scale process, beginning at the sub-cellular level, passing through the intercellular one, and ending at the tissue level [1,4,5]. Consequently, a wealth of model studies has been produced contributing to a better comprehension of the matter [6,7,8,9,10,11,12].
Since early studies, the tumor invasion process has been described in terms of reaction–diffusion models; see, among others, studies [13,14,15] and references therein. Cell adhesion effects in tumor growth have been investigated [16,17,18,19], whereas recent research interest focused on the role of proteolysis in tumor proliferation and invasion, and in particular matrix metalloproteinases (MMP) [20] and the urokinase plasminogen activator (uPA) [21,22]; the latter, in particular, is an enzyme that activates the abundantly present but inactive plasminogen to its active and extra-cellular matrix (ECM) degrading form, plasmin, ultimately promoting cancer invasion.
Once cancer cells have been seeded, malignant cell proliferation begins with cell growth in the avascular phase [23,24,25,26,27]; then cancer cells stimulate angiogenesis [28,29,30,31,32], the mechanism responsible for the formation of new blood vessels around the tumor mass, allowing nutrients to feed malignant cells [33,34,35]. At this stage, the new vasculature allows both tumor growth enhancement and an increase in invasion speed of the healthy tissue; metastasis, which is one of the hallmarks of cancer, takes place [3,31,36,37]. It consists of the spread of cancer cells away from their initial localization through vascular and lymphatic systems.
Cancer cells are considered as immersed in the ECM, which is a medium containing all the nutrients necessary for cell growth, where a complex chemical signaling activated by the enzymatic system triggers the degradation of proteins such as vitronectin (VN). We are concerned with the role played in the ECM proteolysis by the urokinase plasminogen activator (uPA) enzyme, together with an ECM degrading enzyme, plasmin, and a specific inhibitor secreted by healthy cells in order to regulate proteolysis, the plasminogen activator inhibitor type-1 (PAI-1). Then, considering the uPA system as constituted by uPA, VN, plasmin, and PAI-1, its coupling with cancer cells dynamics gives us a dynamical model for tumor progression in which the cancer cell motility process is accounted for not only by diffusion mechanisms, but also by chemotactic and haptotactic stimuli [21,22].
Chemotaxis occurs when cancer cells move because they are attracted by sensed chemical species dissolved in the ECM. It can happen that the sensed chemicals are not solved, but adhere to some ECM component, specifically VN, to form a chemical/VN complex. At this point, cancer cells can bind to such chemicals, ultimately all moving together, until another chemical/VN complex is encountered carrying a chemical at a higher concentration, onto which the transported cancer cell can attach, making a new bond; such a movement mechanism is called haptotaxis. In both chemotaxis and haptotaxis, cancer cells move according to concentration gradients of the sensed chemicals influencing the cell migration inside the ECM.
Cancer cells’ proliferation and growth consist of a complex system of chemical signaling among several biological players, which needs to be schematized and simplified when mathematically modeled; for this reason, in the model description some biological details will be omitted, together with the discussion of biological mechanisms not explicitly included in the modeling scheme. We direct the interested reader to [21,38,39] for further details. To invade the healthy tissue, cancer cells trigger the degradation of the ECM macromolecules, such as VN, by secreting the uPA enzyme, a serine protease that activate plasminogen to plasmin. Plasminogen is a protein present in ECM as well as in the blood, while plasmin degrades basement membranes and ECM. uPA binds to its cellular receptor uPAR, which in turn contains a binding site for vitronectin [21]. uPA activity is inhibited by the plasminogen activator inhibitor PAI-1, a specific inhibitor secreted by healthy cells that regulates excesses of proteolysis induced by uPA [21], which is present in plasma and tissues [40]. The binding with VN stabilizes PAI-1 [41]. Cell migration is reduced by PAI-1, as well as by uPA inhibition and by competing with integrin for a binding site on VN [42]. On the other hand, through a regulatory effect of the uPAR/VN binding, PAI-1 may promote cellular motility [43].
The evolution of the model depicted above takes into account the interaction of cancer cell dynamics with the uPA system, expressed in terms of partial differential equations (PDE). Efforts have been made in recent years to improve the mathematical modeling of cancer invasion and to develop appropriate computational techniques. Solid tumor growth has been modeled in the frame of the theory of mixtures [44,45,46], using computational techniques based on the level set method [47,48], as well adaptive [49,50], multi-grid [46], finite difference [22], and hybrid finite volume/finite element [51] algorithms. Very recently, a two-scale approach for cancer invasion was implemented [52] in order to obtain a qualitative description of the tumor invasive pattern, using a mixed finite difference/finite element discretization for, respectively, macro- and micro-dynamics approximations.
In a series of papers [53,54,55,56,57], we investigated cancer cell proliferation and growth in human tissue, modeling different biological conditions in the early avascular phase. We simulated the invasion in one-dimensional domains in which the arising system of PDE was solved using the moving mesh partial differential equation (MMPDE) numerical technique, implemented in the finite element method (FEM) [58]. We found that solid tumor progression is characterized by irregular proliferation patterns, with effects depending on the diffusion properties of cancer cells as well as on crowding and nutrient parameters. Despite the variety of studies performed up to now, the need for thorough investigations of tumor heterogeneities arises due to their relevant role in cancer treatments. In fact, an accurate determination of tumors’ spatial extensions and invasive fronts can give precious indications from both clinical and surgical point of views. In this respect, the contribution from mathematical modeling can provide sophisticated models and similarly sophisticated simulations for the biological systems considered. The recent work of Peng et al. [52] tackled the problem of studying the neighborhood of the invasive edge of the tumor using a two-scale model for the interaction of cancer cells with the uPA system in two spatial dimensions. Their numerical results give a qualitative contour of tumors’ invasive front by relying on micro-dynamics computations. Nevertheless, other finer mechanisms can act on the system; they were not yet included in the models, being considered secondary.
In the present study we implemented a model in a two-dimensional domain in order to simulate cancer invasion in the early avascular phase of a thin slice of biological tissue, when the malignant formation is confined to a small volume, typically within a cubic millimeter [27]. The arising PDE system was solved using the FEM. We focused our attention on the PAI-1 protein as an inhibitor of uPA activity, and in particular on the mechanisms that are triggered when PAI-1/VN and PAI-1/uPA bonds occur; for this reason our model differs from the one presented in study [22], but also from that of study [21]. We monitored the dynamical evolution of cancer cells, vitronectin, and plasmin-degrading enzymes, allowing the highlighting of regions of augmented degrading activity as a function of two parameters accounting for the abovementioned mechanisms in cancer dynamics: indirect cell proliferation induced by PAI-1/VN binding and indirect plasmin deactivation due to the PAI-1/uPA binding. After an initial invasive front propagating symmetrically towards the domain boundaries, the numerical solutions show sharp heterogeneous clusters that exhibit certain symmetries concerning their spatial distribution. The obtained numerical results allow us to conclude that the modeled indirect mechanisms influence the speed of the tumor invasion front and its heterogeneous development. Additionally, monitoring the plasmin concentration maps during the tumor evolution gives a finer indication of the tumor activity area inside the simulated domain, and as a result is more sensitive to the biological dynamics with respect to the VN maps as well as to the cancer cell maps themselves. In the next section we will refer to the model introduced in [22], which we modified in order to account for the indirect contributions described above.
2. Theory and Method
Considering a portion of biological tissue in which a cluster of cancer cells is initially seeded, we monitor the dynamical evolution during their interaction with the uPA system components inside the domain. We denote with Ω ⊂ ℝ3 a fixed volume occupied by the tissue, having S as its bounding surface and n as the number of interacting species in Ω; at each time step t ∈ [0,T] and position x = (x,y,z) ∈ Ω, ci = ci (x,t), for i = 1, …, n, represents the concentration of the ith species in Ω. Then, introducing c = (c1, …, cn), the mass conservation law for each species gives:
where fi(c) is a source term taking into account contributions coming from all the interacting species in Ω, and φi(x,t) is the flux of ci through S. From Equation (1), using the divergence theorem, the evolution equation for the ith species is obtained:
In the following we define that, for i = 1, …, 5, each concentration ci(x,t) corresponds, respectively, to cancer cells (c), VN (v), uPA (u), PAI-1 (p), and plasmin (m).
From the general Equation (2), we move on to examine the model equation for each of the interacting species inside the biological tissue. Contributions to cancer cells dynamics come from random diffusion at a rate Dc; haptotaxis due to VN and chemotaxis due to uPA and PAI-1, are accounted for by the χv, χu and χp coefficients, respectively; cell production is accounted for by the logistic term through the μ1 coefficient. We next turn our attention to PAI-1/VN interaction near the cancer cell’s surface, since it is relevant for the mass conservation of cancer cells. In Chaplain and Lolas [21] it was observed that such a bond indirectly promotes cancer cell proliferation. The mechanism starts as a signaling triggered by PAI-1/VN binding; PAI-1 molecules removed by VN result in the activation of the uPA to cancer cell binding through the uPA receptor (uPAR) located at the cell surface, which in turn activates plasmin formation, which can be considered a PAI-1/VN by-product fostering cancer proliferation. Then, we account for such indirect proliferation mechanism with the ϕ14 coefficient:
The constant c0 is intended as the carrying capacity of the cancer cell population, and will be defined later on, also for scaling purposes. The ECM representative VN macromolecule is confined within the cellular environment, and then the relative flux term vanishes giving the model equation:
Contributions to the above equation come from production due, indirectly, to uPA/PAI-1 interaction at a rate ϕ21: such binding, in fact, facilitates the VN binding to uPAR, then initiating a signaling promoting its own production [21,22,52]. A logistic proliferation is also present at rate μ2, while VN consumption, instead, is due to its neutralization by PAI-1 and its degradation by plasmin, at rates ϕ22 and δ, respectively. Similarly to cancer cell population, in Equation (4) the constant v0 is intended as the carrying capacity of the vitronectin population, which will be used for scaling purposes later on.
Concerning uPA, it diffuses at a rate Du, and is produced by cancer cells at a rate α31; moreover, it is inhibited via interaction with PAI-1 and degraded by interaction with cancer cells, at rates ϕ31 and ϕ33, respectively:
In the mass conservation for PAI-1, besides its diffusion at a rate Dp, a term accounting for PAI-1 production by healthy cells at a rate α41 is present, triggered by chemical signaling starting from plasminogen activation [21]. PAI-1 degradation comes from its interaction with uPA and VN at rates ϕ41 and ϕ42, respectively:
Concerning plasmin, besides its diffusion at a rate Dm, it is indirectly promoted by the PAI-1/VN and cancer cells/uPA interactions at rates ϕ52 and ϕ53, respectively. In fact, uPA binds to its uPAR receptor, which is located at the cell surface, where proteolytic activity increases due to uPA plasminogen activation to plasmin [21,22,52]. On the other hand, as in the case of the cancer cells equation, the binding PAI-1/VN promotes the interaction of uPA with cancer cells via the uPAR, inducing indirect plasmin formation through the activation of plasminogen to plasmin [21,22]. Plasmin degrades globally [22] at a rate ϕ54. On the other hand, the PAI-1/uPA binding prevents the activation of plasminogen to plasmin by uPA, resulting in indirect inhibition of plasmin formation [21]; we then introduce such a contribution through the ϕ51 coefficient:
In Figure 1 we visually summarize the complex plot of interactions among the five species involved in the model. It was derived from paper [53], and the modeled mechanisms are highlighted with dashed lines: red lines refer to indirect proliferation contribution due to PAI-1/VN binding, whilst green lines refer to indirect plasmin deactivation from PAI-1/uPA binding.
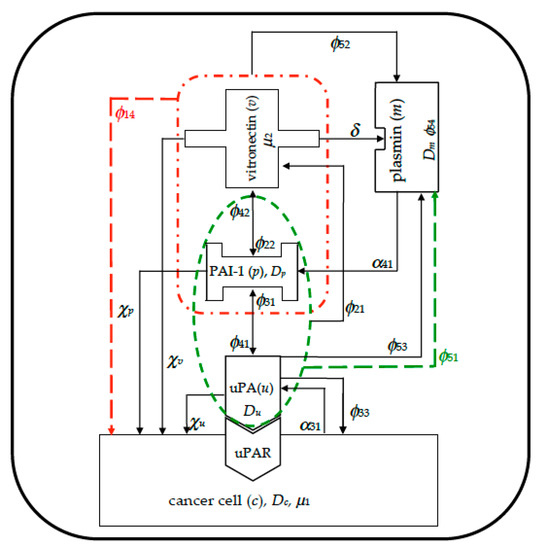
Figure 1.
Visual overview schematizing the interactions among the species inside the simulated domain, imposing zero-flux boundary conditions. Red dashed lines refer to indirect cancer cells proliferation due to plasminogen activator inhibitor tpe-1 (PAI-1)/vitronectin (VN) binding; green dashed lines refer to indirect plasmin deactivation from PAI-1/urokinase plasminogen activator (uPA) binding.
The set of Equations (3)–(7) constitutes a system of non-linear coupled PDE, which we solved over a two-dimensional domain in order to obtain the tumor dynamical evolution. We imposed the following set of initial conditions: c(x,0) = exp(−|x|2ε−1), v(x,0) = 1 − 0.5c(x,0), u(x,0) = 0.5c(x,0), p(x,0) = 0.05c(x,0), and m(x,0) = 0, where ε = 0.01 mm2. In other words, we define that at t = 0 the domain occupied by the biological tissue is almost filled by the ECM, and an initial cluster of cancer cells already exists. Chemical signaling in the biological environment starts the production of uPA and PAI-1 proportionally to cancer cells, while plasmin will be produced later, during the evolution process. Since we simulated the cancer cell proliferation in the early stage of the tumor formation, we posited that all the system components stay confined within the biological domain, and then we applied zero-flux boundary conditions to the domain boundaries. The spatial FEM discretization was performed using the method of lines, with a uniform, mapped mesh with 104 elements, over a two-dimensional spatial domain with a 1 mm2 area, while for time discretization we used an implicit Euler method. Moreover, the local variable distribution was interpolated with quadratic shape functions, using Galerkin’s method for the residuals of differential equations [58].
For computational convenience we chose to non-dimensionalize the model Equations (3)–(7); we then introduced a set of reference quantities taken from the literature [22], representative of typical values for the considered system that we use to rescale the variables and the parameters entering into the model. In particular, cancer cells and VN were scaled to their carrying capacity, c0 = 6.7 × 10⁷ cell cm−3, and v0 = 1 nM, respectively; for uPA, PAI-1 and plasmin, instead, u0 = 1 nM, p0 = 1 nM, and m0 = 0.1 nM were used, respectively. We also obtained from the literature all of the parameters used in the model [21,22], markedly the reference value D = 10−6 cm2s−1 used to scale the diffusion coefficients and the reference distance for cancer cells in the early stages of invasion, L = 0.1 cm, used to scale the spatial dimensions. It follows that defining τ = L2D−1 = 104, time is scaled accordingly. Cancer cell proliferation indirectly induced by PAI-1/VN interaction was monitored imposing ϕ14 ∈ [0, 0.275, 0.55]. This choice was determined after noticing that the parameter values for the PAI-1/VN interaction fall within the non-dimensional range 0 ÷ 0.55 [21,22,52,53]. Moreover, in [21], the authors used a plasmin deactivation rate indirectly induced by the PAI-1/uPA interaction falling within the non-dimensional range 0.15 ÷ 0.75; we thus chose the parameter ϕ51 ∈[0, 0.375, 0.75]. The other parameters used in the model simulation are summarized in Table 1, first column, while in the third and fourth columns their non-dimensional forms and non-dimensional values are reported, respectively. We performed our computations over a two-dimensional biological tissue, discretizing the domain for a x ∈ [0,1], y ∈ [0,1] non-dimensional interval, for t ∈ [0,100] corresponding to about 11.6 days, with a time step size δt = 0.1.

Table 1.
Summary of the parameters used in the simulations.
3. Results and Discussion
We started our computations using the parameter values reported in Table 1 with ϕ51 = 0, i.e., considering that plasmin deactivation indirectly induced by the PAI-1/uPA interaction is initially zero, and for ϕ14 ∈ [0, 0.275, 0.55]. In Figure 2, Figure 3 and Figure 4 the concentration maps over the simulated domain are shown for, respectively, cancer cells, VN, and plasmin, with snapshots taken at t = 40 (about 4.6 days), 60 (about 6.9 days), 80 (about 9.3 days), and 100 (about 11.6 days), as labeled at the beginning of each panel row; in each column, instead, panels are grouped according to the labeled ϕ14 value above them. Concentrations are linearly mapped on a color scale between the blue and yellow colors. At t = 0 the variables’ distribution is according to the initial conditions, hence they are omitted. The above graphical scheme will be maintained throughout the paper.
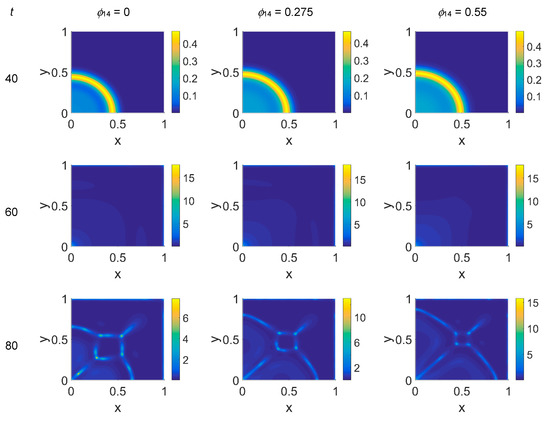
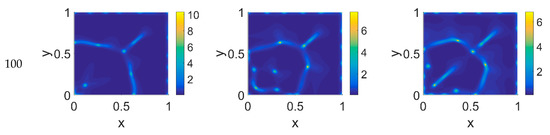
Figure 2.
Snapshots of cancer cell concentrations obtained in the simulated domain imposing ϕ51 = 0. The non-dimensional time steps are t = 40, 60, 80, and 100, while ϕ14 = 0, 0.275, and 0.55; the other parameters are as in Table 1. The concentration is linearly mapped on a color scale between the blue and yellow colors.
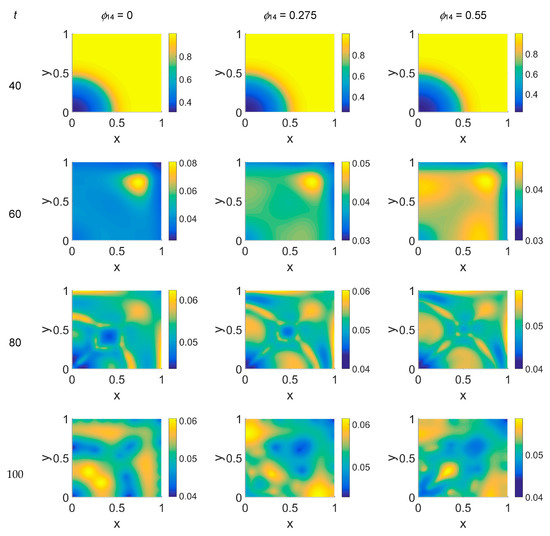
Figure 3.
Snapshots of VN concentrations obtained in the simulated domain imposing ϕ51 = 0. The non-dimensional time steps are t = 40, 60, 80, and 100, while ϕ14 = 0, 0.275, and 0.55; the other parameters are as in Table 1. The concentration is linearly mapped on a color scale between the blue and yellow colors.
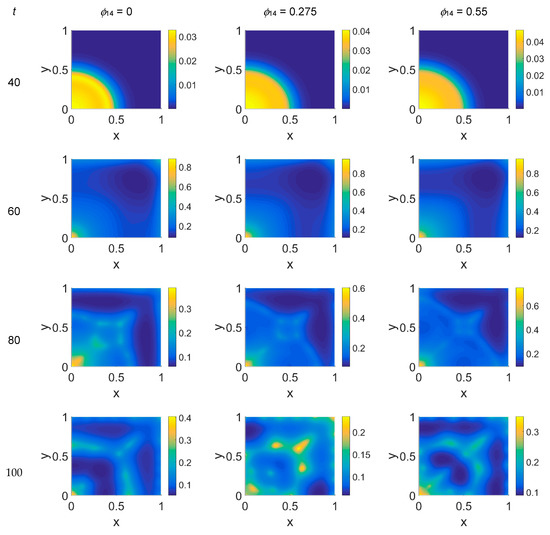
Figure 4.
Snapshots of plasmin concentrations obtained in the simulated domain imposing ϕ51 = 0. The non-dimensional time steps are t = 40, 60, 80, and 100, while ϕ14 = 0, 0.275, and 0.55; the other parameters are as in Table 1. The concentration is linearly mapped on a color scale between the blue and yellow colors.
As shown in Figure 2, at t = 40, the initial cluster of cancer cells seeded at x = (0,0) grew, and the invasion front developed while propagating with a sharp wave-front inside the squared domain, with a slight increasing invasion speed from ϕ14 = 0 to ϕ14 = 0.55; at t = 60 the invasion front reached the domain boundaries crushing on them, and at the same time a faintly visible secondary invasion front started propagating near x = (0,0). Because of the boundary conditions imposed, all of the interacting species remained confined into the domain; hence from t = 80 to t = 100, while the first invasion front stayed crushed on the domain boundaries, the secondary invasion front started degrading itself in a diffuse and heterogeneous pattern of cancer cells. At t = 80 we observe cancer cells heterogeneously arranged in a network-like structure clustering with growing ϕ14 values. At t = 100 the cancer cell distribution appeared branched with ϕ14 = 0, evolving towards denser and more heterogeneous cell clusters for increasing ϕ14 values. Cancer cells are spread out over the whole domain, even if their nucleation is not clearly visible on the boundary surfaces. Additionally, a symmetry of the heterogeneities spatial distribution with respect to the diagonal, starting from the domain origin, is observed, due to the initial conditions imposed for the solution of the PDE system.
Concerning VN distribution, shown in Figure 3—it should behave like the film-negative of the corresponding cancer cell distribution shown in Figure 2: at t = 0 (not shown) the domain was filled with the ECM, except for the initial cluster of cancer cells. For t > 0 the tumor invasion began, and the ECM was progressively degraded, leaving, for t = 60, a residual background inside the domain whose intensity depends on the ϕ14 parameter. In fact, the VN distribution was eroded at the domain boundaries and near x = (0,0), while inside the simulated domain the VN diffusion increased according to the ϕ14 value. At t = 80, nevertheless, the VN maps unexpectedly showed a growing concentration according to the cancer cell clustering (see Figure 2) where instead VN should have been consumed. Such a behavior in part persisted at t = 100, though it was limited to certain regions of the simulated domain, particularly for ϕ14 = 0. This matter turns clearer looking at the plasmin concentration of Figure 4: in each panel, the map overlaps with the corresponding map of Figure 2, showing diffuse patterns related to the activity area of cancer cells, especially at the boundary regions, which are not well visible in Figure 2.
The model simulations for ϕ51 = 0.375 are shown in Figure 5, Figure 6 and Figure 7 for, respectively, cancer cells, VN, and plasmin. Comparing the concentration maps for cancer cells at t = 40 and t = 60 of Figure 2 and Figure 5, indirect plasmin deactivation did not seem to influence the speed of the invasion front, depending only on ϕ14. At the higher time steps, instead, the network branching became sharper with respect to Figure 2, with the mesh size reducing faster as ϕ14 increased. Moreover, the cancer cell clusters appeared more densely distributed and interconnected across the domain, both at t = 80 and at t = 100.
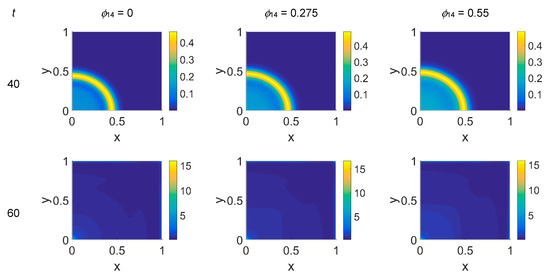
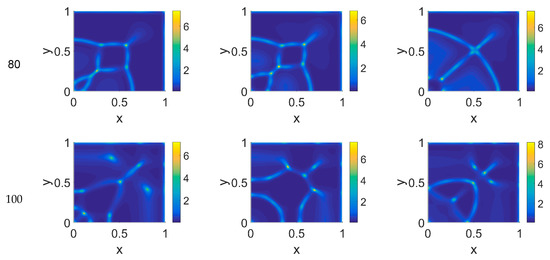
Figure 5.
Snapshots of cancer cell concentrations obtained in the simulated domain imposing ϕ51 = 0.375. The non-dimensional time steps are t = 40, 60, 80, and 100, while ϕ14 = 0, 0.275, and 0.55; the other parameters are as in Table 1. The concentration is linearly mapped on a color scale between the blue and yellow colors.
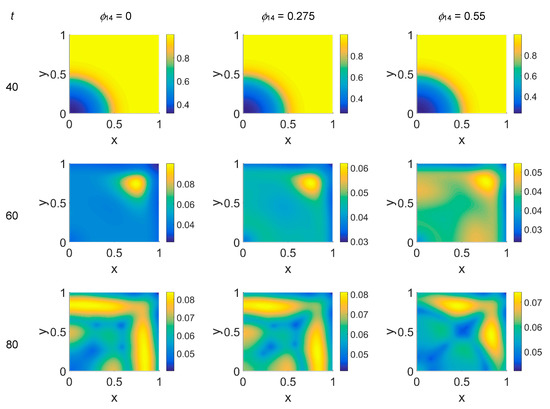
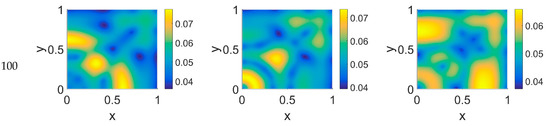
Figure 6.
Snapshots of VN concentrations obtained in the simulated domain imposing ϕ51 = 0.375. The non-dimensional time steps are t = 40, 60, 80, and 100, while ϕ14 = 0, 0.275, and 0.55; the other parameters are as in Table 1. The concentration is linearly mapped on a color scale between the blue and yellow colors.
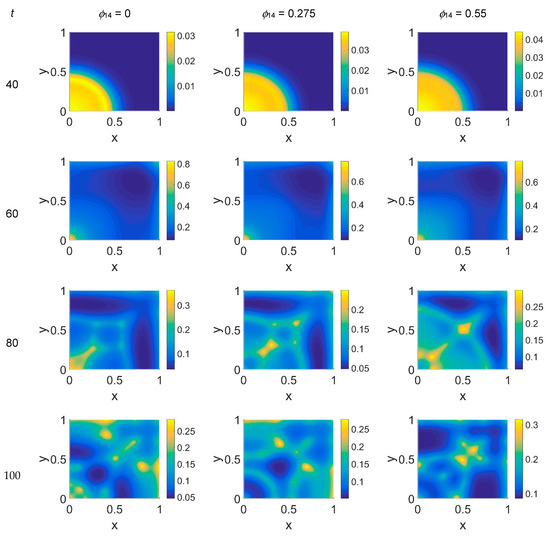
Figure 7.
Snapshots of plasmin concentration obtained in the simulated domain imposing ϕ51 = 0.375. The non-dimensional time steps are t = 40, 60, 80, and 100, while ϕ14 = 0, 0.275, and 0.55; the other parameters are as in Table 1. The concentration is linearly mapped on a color scale between the blue and yellow colors.
The VN concentration maps, shown in Figure 6, give us a clear negative image of the cancer cell distribution of Figure 5, also for the higher time steps, contrary to the case with ϕ51 = 0. In addition, the plasmin distribution, shown in Figure 7, which is superimposable to the cancer cell maps of Figure 5, exhibited a diffuse pattern, further evidencing the tumor activity regions inside the simulated domain, especially close to the domain boundaries.
Imposing a plasmin deactivation coefficient ϕ51 = 0.75, the distribution maps for cancer cells, shown in Figure 8, were similar to the previous cases, as far as the lower time steps are concerned. For t = 80, instead, the network branching appeared to be slightly affected by the ϕ14 coefficient, while at t = 100 the branching seemed inhibited, particularly at lower ϕ14 values. Concerning VN, as shown in Figure 9, the concentration maps appeared even more definite, while the plasmin concentration maps, shown in Figure 10, always enhanced cancer cell activity regions.
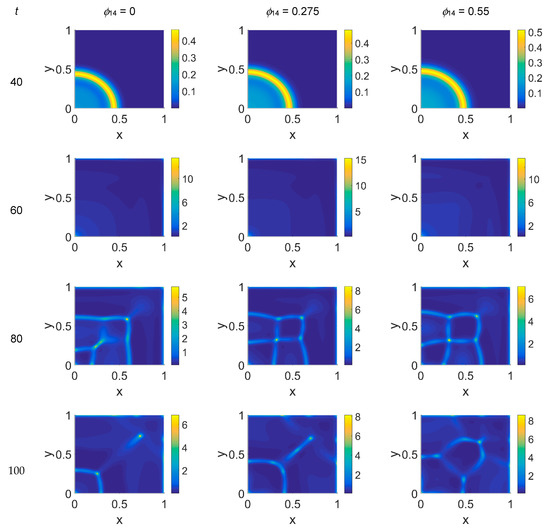
Figure 8.
Snapshots of cancer cell concentrations obtained in the simulated domain imposing ϕ51 = 0.75. The non-dimensional time steps are t = 40, 60, 80, and 100, while ϕ14 = 0, 0.275, and 0.55; the other parameters are as in Table 1. The concentration is linearly mapped on a color scale between the blue and yellow colors.
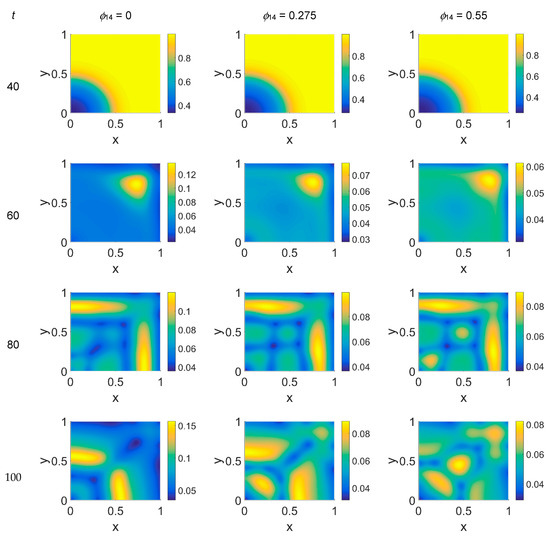
Figure 9.
Snapshots of VN concentrations obtained in the simulated domain imposing ϕ51 = 0.75. The non-dimensional time steps are t = 40, 60, 80, and 100, while ϕ14 = 0, 0.275, and 0.55; the other parameters are as in Table 1. The concentration is linearly mapped on a color scale between the blue and yellow colors.
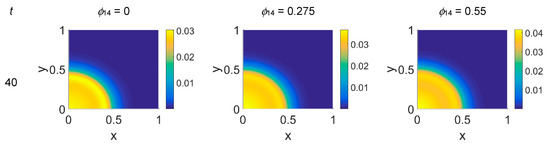
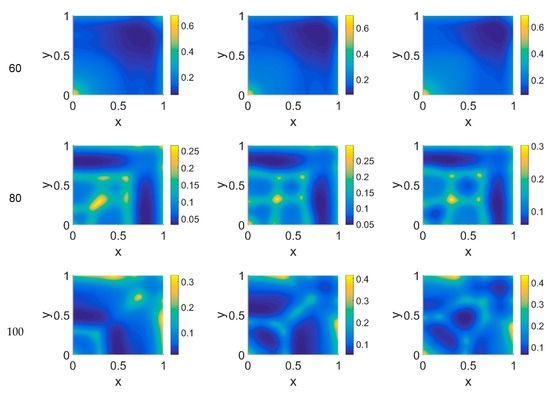
Figure 10.
Snapshots of plasmin concentrations obtained in the simulated domain imposing ϕ51 = 0.75. The non-dimensional time steps are t = 40, 60, 80, and 100, while ϕ14 = 0, 0.275, and 0.55; the other parameters are as in Table 1. The concentration is linearly mapped on a color scale between the blue and yellow colors.
Some considerations need to be taken into account concerning the changing VN behavior from ϕ51 = 0 to ϕ51 = 0.375 and ϕ51 = 0.75. As cancer cell proliferation occurs at the expense of VN, the suppression of the plasmin deactivation contribution by imposing ϕ51 = 0 should produce a decrease in VN; however, an unexpected and unreasonable growth of VN concentration was observed—see Figure 3 at t = 80 and t = 100. We can thus deduce that contributions coming from indirect plasmin deactivation that is different from zero improves the model and makes it more realistic. During the early stage of the tumor proliferation at the expense of VN, the primary invasion front intensity grew until t = 60, when it crushed on the domain boundaries, and the secondary front started to grow from the original seeding site. Whatever the values of ϕ14 and ϕ51 were, such an occurrence was evidenced in the maps of both VN and plasmin. At this stage, the VN degradation by the primary invasion front was not complete, as witnessed by the presence of the background at t = 60; therefore some residual healthy tissue remained in the domain, on which the secondary invasion front could proliferate. In fact, for t > 60, the domain became completely invaded, and clusters of cancer cells spread and branched all over it, starting to build a network as the secondary invasion front evolved. Nevertheless, the VN maps for t > 60 evidenced that residual healthy ECM was still present, except for domain regions where the degrading activity of cancer cells left a kind of imprint in correspondence to high concentration areas of cancer cells. A similar behavior was observed in [52], where the authors simulated tumor progression in a two-dimensional domain, also exploring the micro-dynamics of cancer invasion; their qualitative drawing of the tumor invasive boundary appeared, on average, to be in agreement with ECM consumption maps, except at higher time steps. By comparison, our results, obtained on a spatial domain four times smaller and using a different model, with different model parameters and a different numerical method, while using the FEM and interpolating the variable distribution inside each element with quadratic shape functions, gave us a numerical result similar to that obtained with the mixed method used in [52] at a lower computational cost.
Considering the above numerical results, we can try to formulate some hypotheses on the biology of the simulated system. First of all, we would like to point out that the branching formations observed in the cancer cell pattern for t > 60 are in agreement with other 2D simulations [22]. As noted above, when increasing the ϕ14 coefficient a slight increase of the invasion speed occurs, regardless of the ϕ51 coefficient, meaning that the tumor invasion speed can be regulated by the PAI-1/VN interactions, as observable in Figure 2 and Figure 5, and, at t = 40. Secondly, suppressing the contribution coming from indirect plasmin deactivation does not seem to give reliable results, and therefore leads us to infer that such a contribution needs to be considered. Nevertheless, focusing on the results obtained for ϕ51 = 0.375 and ϕ51 = 0.75, in the former case the invasion patterns showed stronger heterogeneities with respect to ϕ51 = 0.75, at t = 80 and t = 100, as if high plasmin deactivation rates had a limited influence on cancer cell dynamics. Heterogeneity and fast invasion of biological tissues are hallmarks of malignancy [3], which is then supported by increasing rates of PAI-1/VN binding. The PAI-1/uPA binding, instead, seems to have a slower influence on cancer cell dynamics, being more detectable for t = 100: it reverberates on plasmin deactivation, and for ϕ51 = 0.75 results in more stable (t = 80) and less heterogeneous (t = 10) proliferation patterns.
In [22] the interaction of the uPA system with cancer cells was modeled using a uniform finite volume discretization in space, monitoring the effects of varying selected model parameters in one and two spatial dimension. It was found that increasing the rate of plasmin production, simulated while by taking into account its indirect production by the uPA/uPAR interaction and then by increasing the ϕ53 parameter, induced a lowering of the speed of the invasion front. Our simulations, instead, showed that indirect plasmin deactivation induced by the PAI-1/uPA interaction, therefore decreasing the amount of available plasmin, had no effect on the speed of the invasive front.
It has been experimentally observed [59] that when plasmin activates on membranes of breast cells they become malignant as plasmin induces the formation of heterogeneous multicellular spheroids. Here we observed two somewhat competing effects triggered by the two modeled indirect mechanisms: on the one hand, growing ϕ14 rates increased the speed and heterogeneities of the invasive front; on the other hand, growing ϕ51 rates induced more plasmin deactivation, thus damping the ϕ14 action. Such findings confirm our deductions that the plasmin patterns give an early prediction for cancer activity, and plasmin is itself a marker for tumor formation. In paper [60] it was experimentally shown that PAI-1 overexpression reduces cancer cell migration in vitro, and metastasis in vivo, through uPA inhibition, while the role of the PAI-1/VN binding in tumor invasion appears unclear; moreover, a simultaneous interaction of PAI-1 with both vitronectin and uPA is needed to inhibit metastasis, while the inhibition of tumor growth is primarily due to the uPA inhibitory activity of PAI-1. Our numerical results then help distinguish the separate effects of the PAI-1/VN and PAI-1/uPA bindings, assessing the role of the PAI-1/VN binding in heterogeneous cancer proliferation; further, they answer the question of predicting the spatial extent of tumor formation by observing the plasmin evolution patterns, indicating plasmin as a marker to monitor the heterogeneity of cancer evolution in vivo. Finally, our results suggest a possible method for cancer treatments, designing therapies aimed at supporting plasmin deactivation, and, above all, targeting PAI-1/VN binding. Furthermore, monitoring the plasmin dynamics can give a practical tool to foresee malignant and heterogeneities evolution. In this vein, a new series of simulations are planned using a different geometry in 2D and in 3D, in order to include in the model external contributions as well as effects due to nutrient feeding on cancer evolution.
4. Conclusions
In this paper we presented a mathematical model for tumor invasion, simulating the interaction of the uPA system with a model for cancer cells in a two-dimensional portion of biological tissue in the very early stage of invasion. We focused our attention on the concentration maps of cancer cells, VN macromolecules as representative of the ECM environment, and plasmin, monitoring their dynamic evolution as a function of two model parameters indirectly affecting the tumor dynamics: the plasmin deactivation indirectly induced by the PAI-1/uPA interaction and the cancer cell proliferation indirectly induced by the PAI-1/VN interaction. The analysis of the computed concentration maps for cancer cells demonstrated that two regimes for the dynamical evolution can be distinguished: the first is the very early stage of cancer cell proliferation characterized by a sharp invasion front, in the form of a wave propagating across the domain as a consequence of ECM degradation, whose speed depends on the ϕ14 parameter. At this stage, when increasing the ϕ14 parameter from 0 to 0.55, an average speed increase of about 12% was observable in the cancer cell proliferation maps, and this behavior seems independent from the ϕ51 parameter. Once the domain has been invaded, in the presence of a residual ECM, as a consequence of a secondary invasive front cancer cells start to cluster inside the domain and close to its boundaries. From here heterogeneous and symmetric structures start to branch out in a network whose mesh size depends on the ϕ14 parameter. In particular, when increasing the ϕ14 parameter value, the mesh tends to thicken, except for ϕ51 = 0.75 when changes in the ϕ14 value slightly affect cancer heterogeneities. In this respect, it is noteworthy to highlight that at higher ϕ51 values the secondary invasion front activity appeared slightly inhibited. The VN concentration maps can be viewed as a photograph giving a qualitative image of the boundaries of the tumor invasion front. Nevertheless, some inconsistencies occurring in the maps at ϕ51 = 0, at higher time steps, persuade us to consider this value for the parameter as unreasonable. On the other hand, viewing the plasmin as a kind of marker for cancer formation, its concentration maps are revealed to be more reliable in comparison to VN maps for monitoring the cancer activity area. Finally, the computed plasmin concentration maps add useful information about the spatial extension of the tumor activity, highlighting features not clearly visible in the cancer cell concentration maps, delimiting a kind of “confidence interval” for malignant activity. Hence, therapies aimed at targeting the PAI-1/VN binding and at the same time supporting the PAI-1/uPA interaction could be a strategy for effective cancer treatments. In addition, plasmin concentration can be considered as a useful marker for an effective delimitation of the tumor invasive boundary.
Funding
The APC was funded under the PRIN Multiscale Innovative Materials and Structures (MIMS) of the Italian Ministry of University and Research (MIUR).
Conflicts of Interest
The author declares no conflict of interest.
References
- Preziosi, L. Modelling tumour growth and progression. In Progress in Industrial Mathematics at ECMI 2002; Buikis, A., Ciegis, R., Fitt, A.D., Eds.; Springer: Berlin-Heidelberg, Germany, 2004; pp. 53–66. [Google Scholar]
- Qian, B.Z.; Pollard, J.W. Macrophage diversity enhances tumor progression and metastasis. Cell 2010, 141, 39–51. [Google Scholar] [CrossRef] [PubMed]
- Hanahan, D.; Weinberg, R.A. The hallmarks of cancer: The next generation. Cell 2011, 144, 646–674. [Google Scholar] [CrossRef] [PubMed]
- Macklin, P.; McDougall, S.; Anderson, A.R.A.; Chaplain, M.A.J.; Cristini, V.; Lowengrub, J. Multiscale modelling and nonlinear simulation of vascular tumour growth. J. Math. Biol. 2009, 58, 765–798. [Google Scholar] [CrossRef] [PubMed]
- Preziosi, L.; Tosin, A.R. Multiphase modeling of tumor growth and extra cellular matrix interaction: Mathematical tools and applications. J. Math. Biol. 2019, 58, 625–656. [Google Scholar] [CrossRef] [PubMed]
- Preziosi, L. (Ed.) Cancer Modelling and Simulation; Chapman & Hall/CRC Press: Boca Raton, FL, USA, 2003. [Google Scholar]
- Araujo, R.P.; McElwain, D.L.S. A history of the study of solid tumour growth: The contribution of mathematical modeling. Bull. Math. Biol. 2004, 66, 1039–1091. [Google Scholar] [CrossRef] [PubMed]
- Astanin, S.; Preziosi, L. Multiphase models of tumour growth. In Selected Topics in Cancer Modelling: Genesis, Evolution, Immune Competition, and Therapy; Bellomo, N., Chaplain, M., de Angelis, E., Eds.; Birkhauser: Boston, MA, USA, 2008; pp. 223–254. [Google Scholar]
- Graziano, L.; Preziosi, L. Mechanics in tumour growth. In Modeling of Biological Materials; Mollica, F., Preziosi, L., Rajagopal, K.R., Eds.; Birkhauser: Boston, MA, USA, 2007; pp. 263–321. [Google Scholar]
- Roose, T.; Chapman, S.J.; Maini, P.K. Mathematical models of avascular tumor growth. SIAM Rev. 2007, 49, 179–208. [Google Scholar] [CrossRef]
- Tracqui, P. Biophysical models of tumour growth. Rep. Prog. Phys. 2009, 72, 056701. [Google Scholar] [CrossRef]
- Lowengrub, J.S.; Frieboes, H.B.; Jin, F.; Chuang, Y.L.; Li, X.; Macklin, P.; Wise, S.M.; Cristini, V. Nonlinear modelling of cancer: Bridging the gap between cells and tumours. Nonlinearity 2010, 23, R1–R9. [Google Scholar] [CrossRef]
- Greenspan, H.P. On the growth and stabiligy of cell cultures and solid tumours. J. Theor. Biol. 1976, 56, 229–242. [Google Scholar] [CrossRef]
- Adam, J.A. A simplified mathematical model of tumour growth. Math. Biosci. 1986, 81, 229–244. [Google Scholar] [CrossRef]
- Chaplain, M.; Graziano, L.; Preziosi, L. Mathematical modelling of the loss of tissue compression responsiveness and its role in solid tumour development. Math. Med. Biol. 2006, 23, 197–229. [Google Scholar] [CrossRef] [PubMed]
- Byrne, H.M.; Chaplain, M.A.J. Modelling the role of cell–cell adhesion in the growth and developement of carcinoma. Math. Comput. Model. 1996, 24, 1–17. [Google Scholar] [CrossRef]
- Armstrong, N.J.; Painter, K.J.; Sherratt, J.A. A continuum approach to modelling cell-cell adhesion. J. Theor. Biol. 2006, 243, 98–113. [Google Scholar] [CrossRef] [PubMed]
- Chaplain, M.A.J.; Lachowicz, M.; Szymanska, Z.; Wrzosek, D. Mathematical modelling of cancer invasion: The importance of cell–cell adhesion and cell-matrix adhesion. Math. Model. Methods Appl. Sci. 2011, 21, 719–743. [Google Scholar] [CrossRef]
- Domschke, P.; Trucu, D.; Gerisch, A.; Chaplain, M.A.J. Mathematical modelling of cancer invasion: Implications of cell adhesion variability for tumour infiltrative growth patterns. J. Theor. Biol. 2014, 361, 41–60. [Google Scholar] [CrossRef]
- Deakin, N.E.; Chaplain, M.A.J. Mathematical modelling of cancer invasion: The role of membrane-bound matrix metalloproteinases. Front. Oncol. 2013, 3, 70. [Google Scholar] [CrossRef]
- Chaplain, M.A.J.; Lolas, G. Mathematical modelling of cancer cell invasion of tissue: The role of the urokinase plasminogen activation system. Math. Model. Methods Appl. Sci. 2005, 15, 1685–1734. [Google Scholar] [CrossRef]
- Andasari, V.; Gerisch, A.; Lolas, G.; South, A.P.; Chaplain, M.A.J. Mathematical modeling of cancer cell invasion of tissue: Biological insight from mathematical analysis and computational simulation. J. Math. Biol. 2011, 63, 141–171. [Google Scholar] [CrossRef]
- Ambrosi, D.; Preziosi, L. On the closure of mass balance models for tumour growth. Math. Models Methods Appl. Sci. 2002, 12, 737–754. [Google Scholar] [CrossRef]
- Byrne, H.M. Modelling avascular tumor growth. In Cancer Modelling and Simulation; Preziosi, L., Ed.; Chapman & Hall/CRC Press: Boca Raton, FL, USA, 2003; pp. 75–120. [Google Scholar]
- Byrne, H.; Preziosi, L. Modelling solid tumour growth using the theory of mixtures. Math. Med. Biol. 2003, 20, 341–366. [Google Scholar] [CrossRef]
- Chaplain, M.A.J.; Ganesh, M.; Graham, I.G. Spatio-temporal pattern formation on spherical surfaces: Numerical simulation and application to solid tumour growth. J. Math. Biol. 2001, 42, 387–423. [Google Scholar] [CrossRef] [PubMed]
- Sherratt, J.A.; Chaplain, M.A.J. A new mathematical model for avascular tumour growth. J. Math. Biol. 2001, 43, 291–312. [Google Scholar] [CrossRef] [PubMed]
- Anderson, A.R.A.; Chaplain, M.A.J. Continuous and discrete mathematical models of tumour-induced angiogenesis. Bull. Math. Biol. 1998, 60, 857–899. [Google Scholar] [CrossRef] [PubMed]
- Levine, H.A.; Pamuk, S.; Sleeman, B.D.; Nilsen-Hamilton, M. Mathematical modeling of capillary formation and development in tumor angiogenesis: Penetration into the stroma. Bull. Math. Biol. 2001, 63, 801–863. [Google Scholar] [CrossRef]
- Levine, H.A.; Sleeman, B.D. Modelling tumour induced angiogenesis. In Cancer Modelling and Simulation; Preziosi, L., Ed.; Chapman & Hall/CRC Press: Boca Raton, FL, USA, 2003; pp. 147–184. [Google Scholar]
- McDougall, S.R.; Anderson, A.R.A.; Chaplain, M.A.J.; Sherrat, J.A. Mathematical modelling of flow through vascular networks: Implications for tumor induced angiogenesis and chemotherapy strategies. Bull. Math. Biol. 2002, 64, 673–702. [Google Scholar] [CrossRef] [PubMed]
- McDougall, S.R.; Anderson, A.R.A.; Chaplain, M.A.J. Mathematical modelling of dynamic adaptive tumour-induced angiogenesis: Clinical implications and therapeutic targeting strategies. J. Theor. Biol. 2006, 241, 564–589. [Google Scholar] [CrossRef]
- Folkman, J. Tumor angiogenesis. Adv. Cancer Res. 1974, 19, 331–358. [Google Scholar] [PubMed]
- Folkman, J. The vascularization of tumors. Sci. Am. 1976, 234, 58–73. [Google Scholar] [CrossRef]
- Folkman, J.; Klagsbrun, M. Angiogenic factors. Science 1987, 235, 442–447. [Google Scholar] [CrossRef]
- Chaplain, M.A.J.; Anderson, A.R.A. Mathematical modelling of tissue invasion. In Cancer Modelling and Simulation; Preziosi, L., Ed.; Chapman & Hall/CRC Press: Boca Raton, FL, USA, 2003; pp. 269–298. [Google Scholar]
- Anderson, A.R.A.; Chaplain, M.A.J.; Newman, E.L.; Steele, R.J.C.; Thompson, A.M. Mathematical modeling of tumour invasion and metastasis. J. Theor. Med. 2000, 2, 129–154. [Google Scholar] [CrossRef]
- Andreasen, P.A.; Kjøller, L.; Christensen, L.; Duffy, M.J. The urokinase-type plasminogen activator system in cancer metastasis: A review. Int. J. Cancer 1997, 72, 1–22. [Google Scholar] [CrossRef]
- Andreasen, P.A.; Egelund, R.; Petersen, H.H. The plasminogen activation system in tumor growth, invasion, and metastasis. Cell Mol. Life Sci. 2000, 57, 25–40. [Google Scholar] [CrossRef]
- Simpson, A.J.; Booth, N.A.; Moore, N.R.; Bennett, B. Distribution of plasminogen activator inhibitor (PAI-1) in tissue. J. Clin. Pathol. 1991, 44, 139–143. [Google Scholar] [CrossRef]
- Wiman, B.; Almquist, A.; Sigurdardottir, O.; Lindahl, T. Plasminogen activator inhibitor 1 (PAI) is bound to vitronectin in plasma. FEBS Lett. 1988, 242, 125–128. [Google Scholar] [CrossRef]
- Stefanson, S.; Lawrence, D.A. The serpin PAI-1 inhibits cell migration by blocking integrin αvβ3 binding to vitronectin. Nature 1996, 383, 441–443. [Google Scholar] [CrossRef] [PubMed]
- Waltz, D.A.; Natkin, L.R.; Fujita, R.M.; Wei, Y.; Chapman, H.A. Plasmin and plasminogen activator inhibitor type 1 promote cellular motility by regulating the interaction between the urokinase receptor and vitronectin. J. Clin. Investig. 1997, 100, 58–67. [Google Scholar] [CrossRef]
- Frieboes, H.B.; Jin, F.; Chuang, Y.L.; Wise, S.M.; Lowengrub, J.S.; Cristini, V. Three-dimensional multispecies nonlinear tumor growth-ii: Tumor invasion and angiogenesis. J. Theor. Biol. 2010, 264, 1254–1278. [Google Scholar] [CrossRef]
- Mascheroni, P.; Carfagna, M.; Grillo, A.; Boso, D.P.; Schrefler, B.A. An avascular tumor growth model based on porous media mechanics and evolving natural states. Math. Mech. Solids 2018, 23, 686–712. [Google Scholar] [CrossRef]
- Wise, S.M.; Lowengrub, J.S.; Cristini, V. An adaptive multigrid algorithm for simulating solid tumour growth using mixture models. Math. Comput. Model. 2011, 53, 1–20. [Google Scholar] [CrossRef]
- Frieboes, H.B.; Zheng, X.; Sun, C.H.; Tromberg, B.; Gatenby, R.; Cristini, V. An integrated computational/experimental model of tumor invasion. Cancer Res. 2006, 66, 1597–1604. [Google Scholar] [CrossRef]
- Macklin, P.; Lowengrub, J. Nonlinear simulation of the effect of microenvironment on tumor growth. J. Theor. Biol. 2007, 245, 677–704. [Google Scholar] [CrossRef] [PubMed][Green Version]
- Zheng, X.; Wise, S.; Cristini, V. Nonlinear simulation of tumor necrosis, neo-vascularization and tissue invasion via an adaptive finite-element/level-set method. Bull. Math. Biol. 2005, 67, 211–259. [Google Scholar] [CrossRef] [PubMed]
- Cristini, V.; Li, X.; Lowengrub, J.S.; Wise, S.M. Nonlinear simulations of solid tumor growth using a mixture model: Invasion and branching. J. Math. Biol. 2009, 58, 723–763. [Google Scholar] [CrossRef] [PubMed]
- Hubbard, M.E.; Byrne, H.M. Multiphase modeling of vascular tumour growth in two spatial dimensions. J. Theor. Biol. 2013, 316, 70–89. [Google Scholar] [CrossRef] [PubMed]
- Peng, L.; Trucu, D.; Lin, P.; Thompson, A.; Chaplain, M.A.J. A multiscale mathematical model of tumour invasive growth. Bull. Math. Biol. 2017, 79, 389–429. [Google Scholar] [CrossRef] [PubMed]
- Amoddeo, A. Adaptive grid modelling for cancer cells in the early stage of invasion. Comput. Math. Appl. 2015, 69, 610–619. [Google Scholar] [CrossRef]
- Amoddeo, A. Moving mesh partial differential equations modelling to describe oxygen induced effects on avascular tumour growth. Cogent Phys. 2015, 2, 1050080. [Google Scholar] [CrossRef]
- Amoddeo, A. Oxygen induced effects on avascular tumour growth: A preliminary simulation using an adaptive grid algorithm. J. Phys. Conf. Ser. 2015, 633, 012088. [Google Scholar] [CrossRef]
- Amoddeo, A. A moving mesh study for diffusion induced effects in avascular tumour growth. Comput. Math. Appl. 2018, 75, 2508–2519. [Google Scholar] [CrossRef]
- Amoddeo, A. Modelling avascular tumor growth: Approach with an adaptive grid numerical technique. J. Multiscale Model. 2018, 9, 1840002. [Google Scholar] [CrossRef]
- Zienkiewicz, O.C.; Taylor, R.L. The Finite Element Method; Butterworth–Heinemann: Oxford, UK, 2002. [Google Scholar]
- Chun, M.H. Plasmin induces the formation of multicellular spheroids of breast cancer cells. Cancer Lett. 1997, 117, 51–56. [Google Scholar] [CrossRef]
- Praus, M.; Collen, D.; Gerard, R.D. Both u-PA inhibition and vitronectin binding by plasminogen activator inhibitor 1 regulate HT1080 fibrosarcoma cell metastasis. Int. J. Cancer 2002, 102, 584–591. [Google Scholar] [CrossRef] [PubMed]
© 2020 by the author. Licensee MDPI, Basel, Switzerland. This article is an open access article distributed under the terms and conditions of the Creative Commons Attribution (CC BY) license (http://creativecommons.org/licenses/by/4.0/).