Article

A Novel Entropy-Fuzzy PIPRECIA-DEA Model for Safety Evaluation of Railway Traffic

by
Aleksandar Blagojević
1,
Željko Stević
2,
Dragan Marinković
3,*,
Sandra Kasalica
1 and
Snježana Rajilić
4
1
Academy of Technical and Artistic Professional Studies Belgrade, College of Railway Engineering, Zdravka Čelara 14, 11000 Belgrade, Serbia
2
Faculty of Transport and Traffic Engineering, University of East Sarajevo, Vojvode Mišića 52, 74000 Doboj, Bosnia and Herzegovina
3
Faculty of Mechanical Engineering and Traffic Systems, TU Berlin, Str. d. 17. Juni 135, 10623 Berlin, Germany
4
Bosnia and Herzegovina Railways Public Corporation, Kneza Miloša 105, 74000 Doboj, Bosna and Hercegovina
*
Author to whom correspondence should be addressed.
Symmetry 2020, 12(9), 1479; https://doi.org/10.3390/sym12091479
Submission received: 8 August 2020 / Revised: 31 August 2020 / Accepted: 4 September 2020 / Published: 9 September 2020

Abstract

:
The conditions of globalization often dictate the functioning of transport markets, so it is necessary to conduct frequent research in order to achieve sustainable business. This is achieved through adequate risk and safety management at all levels. The research carried out in this paper includes determining the state of railway traffic safety in a total of nine railway sections in Bosnia and Herzegovina (B&H). The aim of this paper is to develop a new integrated Entropy-Fuzzy PIPRECIA (PIvot Pairwise RElative Criteria Importance Assessment)-DEA (Data Envelopment Analysis) model for determining the state of safety in B&H under particular conditions of uncertainty. Additionally, the aim is to combine the advantages of linear programming (DEA), an objective method (Entropy), and a subjective method (Fuzzy PIPRECIA). In this way, an integrated objective–subjective model is created that provides accurate and balanced decision-making through their integration. Eleven sustainable criteria were defined and divided into six inputs and five outputs. The Entropy model was used to determine the weight values of the inputs, while due to the nature of the outputs, Fuzzy PIPRECIA was used to evaluate them. After the application of the two methods, the way of averaging their values was defined. The DEA model, which implies an input- and output-oriented model, was applied to determine which railway sections have satisfactory performance in terms of safety. Two sections were eliminated from further computation due to extremely poor performance and high risk. Then, the weighted overall efficiency ranking method was applied to determine the final ranking of the railway sections. The results obtained were verified through a sensitivity analysis, which involved changing the impact of the five most significant criteria and a comparison with two Multi-Criteria Decision-Making (MCDM) methods.

1. Introduction

Due to the changes that have occurred in the process of globalization and liberalization, global transport markets have become accessible to all companies. However, only efficient and sustainable companies survive in the single transport market, i.e., those that have developed competitive advantages over others. Bosnia and Herzegovina, like all Western Balkan countries, has a major problem with the sustainability of the railway system since the volume of rail transport has decreased compared to the period before the economic crisis. The economic crisis has caused reduction in demand by most rail customers (ironworks, mines, heavy industry) for the transport of goods. In addition, the economic crisis has caused a reduction in the amount of passenger transport, primarily in international transport, since railway undertakings in B&H have canceled a certain number of trains for economic reasons. The decrease in the transport of goods and passengers has resulted in a decrease in the revenues of railway undertakings. Lower revenues have caused the lower need for maintenance of rolling stock and railway infrastructure, which negatively affects railway traffic safety. As railway traffic is an activity of special importance for B&H, it also provokes special attention from society as a whole, which monitors the situation and takes measures to remedy difficulties and possible negatives in it. At the same time, special attention is paid to the safety of this type of traffic. Railway traffic safety basically depends on the state of technical capacity (available rolling stock, railway network conditions, signaling facilities for securing railway stations, actively and passively protected railway level crossings, etc.), traffic intensity, and human factor influence. The railway network and transport capacities in the transition period of railways in B&H were completely neglected and to date have been partially revitalized. The current state of transport capacities on the railways in Bosnia and Herzegovina, especially of safety devices, requires a large number of workers, i.e., executive staff, to participate in organizing the transport of goods and passengers. The participation of a large number of executive staff in the execution of transport, with the imperfection of human work and the presence of subjective weaknesses, contributes to errors in work and neglect of important actions in preparing and organizing the train traffic, which negatively affects traffic safety. Under these circumstances, accidents and incidents, in which people are killed and injured, occur. In Bosnia and Herzegovina, an average of twelve (12) people lose their lives in railway traffic every year. Human casualties and seriously injured persons caused by railway accidents make traffic safety in a self-protection system a social problem. It can be said that traffic safety is an important factor for transport users in making a choice of a certain type of transport, and it is thus a significant factor in the size of transport execution, income, and business results in general. Traffic safety is a mirror of safety, a reflection of transport organization and discipline, because through it and punctuality, the reputation of railways rises and falls in the eyes of the public. All this has negative consequences for the position of railways in the single transport market, because accidents, incidents, and deaths of passengers significantly affect the reputation of railways and the economic sustainability of railway systems. The problems that manifest through traffic safety are numerous and very complex because they arise under the influence of many, often mutually independent criteria. Taking into account the above, and the importance of the research area, the following aims of this paper can be defined. The first aim relates to the development of a novel Entropy-Fuzzy PIPRECIA-DEA model as a support in decision-making processes. The second aim of the paper refers to the application of the developed model for determining the safety level of railway sections in Bosnia and Herzegovina in the treatment of uncertainties. The third aim of the research is the development of a model that implies the integration of subjective–objective method when it comes to the evaluation of inputs and outputs in railway traffic. The last aim of the study is to enhance the integration of uncertainty theory, such as fuzzy logic, with other techniques, and the integration of the objective–subjective model in order to achieve more precise and approximately optimal results. On the basis of the foregoing, we can synthesize one main aim of this study, in that the developed model should ensure precise answers to various questions and give potential approximately optimal solutions in various fields while taking into account different constraints.
The paper is structured in a total of six sections. Section 2 includes an overview of the state in the field related to the application of various methodologies primarily in the field of railway safety. The emphasis is put on the application of different variants of the DEA model. Section 3 presents a detailed methodology with a flow chart of the research. All phases of the research are described in detail and the applied methodology is presented step by step, with the creation of certain new equations. Section 4 presents a case study defining inputs and outputs and railway sections to be evaluated, and provides their detailed description with quantitative and qualitative indicators. Section 5 consists of a sensitivity analysis divided into two parts: the change in the influence of the five most significant criteria and a comparison with two other MCDM methods. Section 6 provides a summary of the most important contributions, results and guidelines for further research.

2. Literature Review

Safety and risk management in rail transport are a key issue in achieving sustainable performance of this type of transport. Therefore, through numerous studies, models that contribute to the overall improvement of rail transport are being developed.
Roets et al. [1] point out that transport services providers are under increasing pressure because they need to increase their economy without sacrificing traffic safety. The paper presents the possibility of applying the DEA method with multiple input and output criteria for monitoring staff efficiency and detecting operational safety problems. To increase efficiency, Wanke et al. [2] developed a novel super-efficiency Multi-activity Network DEA (MNDEA) model—based on directional distance functions (DDFs) and capable of handling undesirable outputs—to assess how different contextual variables impact railway efficiency levels and safety in Asia. Djordjević et al. [3] developed a new approach to the evaluation of safety at railway level crossings based on a non-radial DEA model. The developed non-radial DEA model was used to evaluate the railway efficiency of European countries in terms of the level of safety at railway level crossings considering desirable and undesirable criteria. The results of sensitivity analysis of the developed model indicated certain weaknesses related to the number of criteria, as well as the inaccuracy of input and output criteria.
Azadeh et al. [4] defined a methodology based on AHP and DEA, which was integrated into a computer simulation in order to solve the problem of increasing the reliability of the railway system related to passenger trains. The same combination of methods was used by Mohajeri and Amin [5] to select the optimum site for a railway station for the city of Mashhad in northeastern Iran. The results showed that the priorities obtained by the AHP method can be defined as the multiple outputs of a DEA model for finding the best site for a railway station.
Cantos et al. [6] used the DEA method to analyze the impact of reforms in the railway sector on productivity and efficiency of railway undertakings on an example of 16 European countries over the period 1985–2004. The variables used by the authors as input data for DEA were line length and workforce, as well as rolling stock. The output data used to analyze the impact of the reforms on railway undertakings is the amount of transported goods, in terms of passenger kilometers and tonne-kilometers. The results of this empirical research have shown that the vertical separation of railway undertakings had a positive effect on their productivity. In their research, Lan-Bing Li and Jin-Li Hu [7] modeled railway transport in China from 1999 to 2008 through three processes (production, consumption and earnings) using the DEA model and Malmquist TFP. The DEA model was used to evaluate productivity efficiency, consumption effectiveness, and earnings effectiveness from the static viewpoint. Hansen I.A et al. [8], encouraged by the European policy of deregulation of transport markets, liberalization of railway markets, separation of infrastructure from railway undertakings, used benchmark analysis and the DEA method on an example of 11 mid-size European railway networks and railway undertakings to examine their efficiency including relevant technical and economic key criteria. In their study, Azadeh and Salehi [9] defined a methodology based on DEA in order to examine efficiency and shortcomings in performance between infrastructure managers and railway operators. The results of the study showed that the level of sustainability of railway systems depends on the amount of shortcomings. The fewer the shortcomings in the performance of operators, the more efficient the operators will be. Marchetti and Wanke [10] applied a methodological approach based on DEA to assess the efficiency of Brazilian rail concessionaires between 2010 and 2014, when new competitive regulations were introduced. The authors present the increase of cluster efficiency by applying DEA, addressing options such as upsizing, downsizing and resizing inputs (freight type, track gauge, track type), restructuring, best management practices and infrastructure upgrades. Kapetanovic et al. [11] applied the DEA method to assess the efficiency of railway undertakings from Europe, analyzing different input–output configurations of the model in order to assess the impact of different exogenous factors on the level of efficiency. Bai et al. [12] used the DEA method to assess the efficiency of potential organizational models of bureaus (institutions) in China over the period from 2011 to 2015. Empirical research results, comparing three representative bureau schemes, showed that the geographical location of the bureau is of the greatest importance for increasing the efficiency of the railway sector and network economics. In their paper, Blagojević et al. [13] evaluated the efficiency of railway undertakings for the transport of goods using the DEA model. The authors used a comprehensive approach to define the key criteria that affect the efficiency of railway undertakings for the transport of goods. A particular example of eight freight transport railway undertakings shows that the proposed approach successfully combines a set of criteria (resource, operational, financial, quality and safety) into a single assessment of the efficiency of the railway undertakings, while providing information on corrective actions to improve the efficiency of the railway undertakings. To make transport sustainable, Stefaniec et al. [14] proposed a systemic approach based on the DEA method to assess inland transport in China. The authors showed that the DEA method could be successfully applied to increase the efficiency of inland transport, considering social, economic and environmental dimensions of sustainability.

3. Methodology

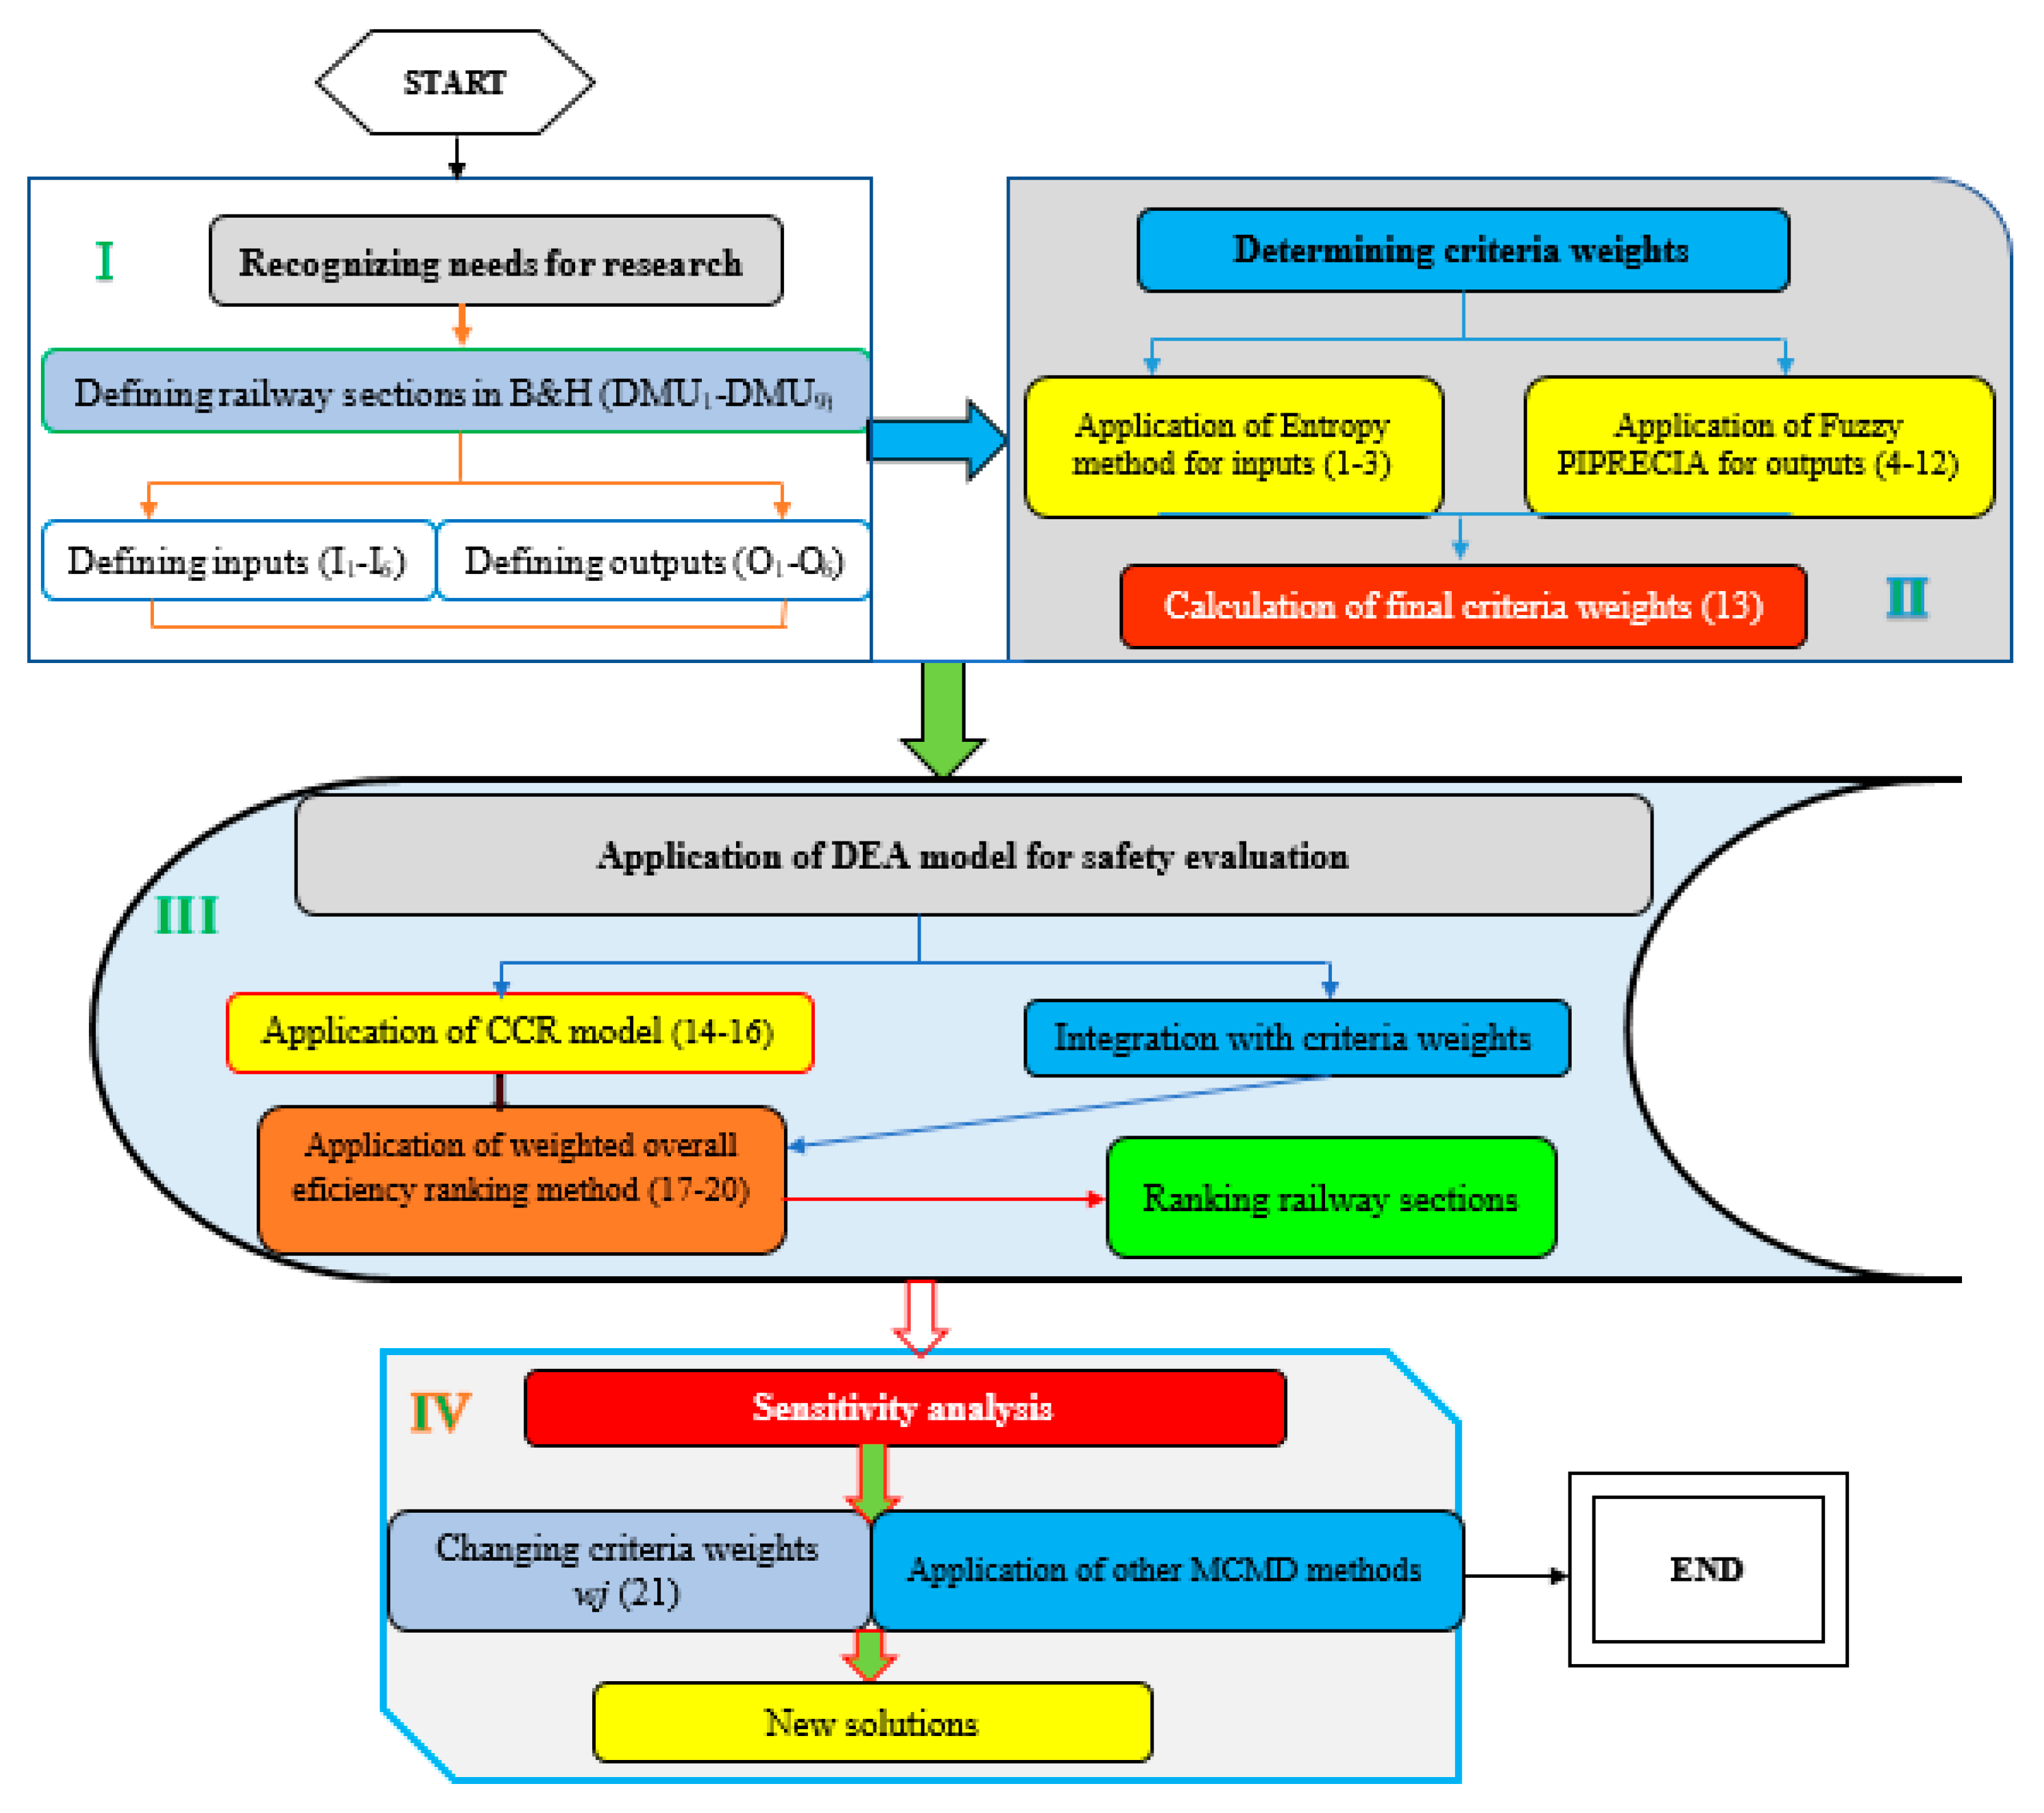
Figure 1 shows the proposed methodology for the evaluation of railway sections in Bosnia and Herzegovina. It consists of a total of four phases, i.e., 13 steps in total. All phases are interrelated and represent the entrance to the next phase.

3.1. The First Phase

In the first phase, after recognizing the needs for research, the railway sections in Bosnia and Herzegovina were defined. There are a total of nine sections in B&H: Bihać, Novi Grad, Prijedor, Banja Luka, Doboj, Tuzla, Zenica, Sarajevo and Mostar. Then, literature research and consultation with experts from Bosnia and Herzegovina and Serbia regarding the definition of inputs and outputs was done. Experts from the railway sector were consulted, i.e., experts from the Serbian Railways Directorate, the Center for Research of Traffic Accidents in Serbia, Railway Regulatory Board of Bosnia and Herzegovina, Ministry of construction, transport and infrastructure Serbia, Ministry of Communications and Transport Bosnia and Herzegovina, Ministry of Transport and Communications Republic of Srpska, and Ministry of transport and communications of the Federation of Bosnia and Herzegovina. Twenty-one experts took part in the discussion. After that, we formed the inputs and outputs. Each expert had a minimum of five years of professional experience. A list of six inputs was formed: the total length of railway network in km, the total number of level crossings, the total number of train-kilometers, the total number of stations, the total number of executive staff and the number of available vehicles. The outputs were as follows: the number of serious accidents, the number of accidents, the number of incidents, the number of killed and the number of injured persons. It is important to emphasize that all the criteria that represent inputs are of benefit type, i.e., they need to be maximized. All outputs are of minimization type, i.e., they belong to the cost group. This orientation of inputs and outputs is very important due to the later implementation of CCR model in which the model operates on the principle of calculating values based on inputs or outputs.

3.2. The Second Phase

In this phase, the significance of inputs and outputs was determined using two different methods: Entropy [15] and Fuzzy PIPRECIA [16,17,18,19]. Since the nature of the criteria marked as inputs allows objective determination of the weights of criteria, the Entropy method is applied. When it comes to criteria marked as outputs, the subjective Fuzzy PIPRECIA method is applied since the nature of these criteria requires such an evaluation. At the end of this phase, the previously calculated values of the criteria are averaged in order to obtain the final weights of the criteria whose sum is one.

3.2.1. Entropy Method

The Entropy method consists of the following steps.
In the first step, it is necessary to normalize an initial matrix by applying Equation (1).
r i j = x i j i = 1 m x i j
where rij represents normalized values and xij denotes values of initial decision-making matrix.
In the second step, the computation of the entropy measure ej is performed by applying Equation (2).
e j = 1 ln ( m ) i = 1 m r i j ln ( n i j )
where m represents number of alternatives.
In the third step, the values of the objective calculation of criterion weight wj are obtained by applying Equation (3).
w j = 1 e j j = 1 n ( 1 e j )
where n denotes number of criteria.

3.2.2. Fuzzy PIPRECIA Method

The Fuzzy PIPRECIA method consists of the steps presented below.
Step 1. Forming a set of criteria and sorting the criteria according to marks from the first to the last, and this means that they need to be sorted unclassified.
Step 2. Each decision-maker individually evaluates pre-sorted criteria Cj by starting from the second criterion, Equation (4).
s j r ¯ = { > 1 ¯ i f C j > C j 1 = 1 ¯ i f C j = C j 1 < 1 ¯ i f C j < C j 1
s j r ¯ denotes the assessment of criteria by a decision-maker r
Step 3. Determining the coefficient k j ¯
k j ¯ = { = 1 ¯ i f j = 1 2 s j ¯ i f j > 1
Step 4. Determining the fuzzy weight q j ¯
q j ¯ = { = 1 ¯ i f j = 1 q j 1 ¯ k j ¯ i f j > 1
Step 5. Determining the relative weight of the criterion w j ¯
w j ¯ = q j ¯ j = 1 n q j ¯
where n is number of criteria.
In the following steps, the inverse methodology of fuzzy PIPRECIA method needs to be applied.
Step 6. Performing the assessment, but this time starting from a penultimate criterion.
s j r ¯ = { > 1 ¯ i f C j > C j + 1 = 1 ¯ i f C j = C j + 1 < 1 ¯ i f C j < C j + 1
Step 7. Determining the coefficient k j ¯
k j ¯ = { = 1 ¯ i f j = n 2 s j ¯ i f j > n
Step 8. Determining the fuzzy weight q j ¯
q j ¯ = { = 1 ¯ i f j = n q j + 1 ¯ k j ¯ i f j > n
Step 9. Determining the relative weight of the criterion w j ¯
w j ¯ = q j ¯ j = 1 n q j ¯
Step 10. To determine the final weights of criteria, it is first necessary to perform the defuzzification of the fuzzy values w j ¯ and w j ¯
w j ¯ = 1 2 ( w j + w j )
Step 11. Checking the results obtained by applying the Spearman and Pearson correlation coefficients.

3.2.3. Determining the Final Criteria Weights

In the last step of the second phase, it is necessary to average the values of the criteria that were previously obtained by applying the stated methods. Since the defuzzified values in the Fuzzy PIPRECIA method do not provide the sum of weights to be one, for the purposes of this paper, the following Equation (13) was developed to average the weight values of the criteria using the fuzzy PIPRECIA method.
w j F P = w j ( j = 1 m w j 1 m ) 2
where wj denotes the values of the criteria obtained using the Fuzzy PIPRECIA method, and m denotes the total number of criteria.
The values obtained by applying the Entropy method are divided by two obtaining the final values of inputs and outputs whose sum is one and which are further inserted in the developed integrated model.

3.3. The Third Phase

In the third phase, the DEA model was applied. The model was applied to determine the values based on input orientation and output orientation. After the computation of the DEA model, the alternatives were identified and inserted further in the overall ranking procedure. For that purpose, the weighted overall efficiency ranking method was applied [20]. In the process, the integration with previously obtained values of inputs and outputs was performed. Based on the results obtained, the last step of the third phase, including the ranking of railway sections, was performed.

3.3.1. DEA Model

The CCR model is the most basic model of DEA. The model was introduced by Charnes et al. [21]. This section presents two DEA CCR models that were applied to obtain the values of alternatives, i.e., DMUs (Decision-Making Units) according to the input-oriented model (max) and the output-oriented model (min). The orientation is performed because the target function is the determination of efficiency of railway sections in terms of safety. The DEA CCR input-oriented model (max) is as follows:
D E A i n p u t = max i = 1 m w i x i i n p u t s t : i = 1 m w i x i j i = m + 1 m + s w i y i j 0 , j = 1 , , n i = m + 1 m + s w i y i o u t p u t = 1 w i 0 , i = 1 , , m + s
The Decision-Making Unit (DMU) consists of m input parameters for each alternative xij, while s represents output parameters for each alternative yij, taking into account the weights of the parameters denoted by wi. Also, n represents the total number of DMUs.
The DEA CCR output-oriented model (min) is as follows:
D E A o u t p u t = min i = m + 1 m + s w i y i o u t p u t s t : ( i = 1 m w i x i j ) + i = m + 1 m + s w i y i j 0 , j = 1 , , n i = 1 m w i x i i n p u t = 1 w i 0 , i = 1 , , m + s
Then, it is necessary to apply Equation (16) in order to determine safe sections at the first level, which are further inserted into the model.
D E A s a f e t y = min o u t p u t max i n p u t

3.3.2. Weighted Overall Efficiency Ranking Method

The additive utility function, when the attributes are mutually preferentially independent, can be given as below:
u ( X 1 , , X k ) = i = 1 k u i ( X i )
where ui (Xi) denotes the single-attribute utility function for ith performance measure. For attributes that belong to the cost group, i.e., need to be minimized, the single-attribute utility function is defined by Equation (18):
u i ( X i ) = X i max X i X i max X i min
where X i max and X i min denote the maximum and minimum value of ith attribute, respectively.
When it comes to parameters that belong to the cost group, i.e., need to be maximized, the single-attribute utility function is defined by Equation (19):
u i ( X i ) = ( ( X i X i min ) X i max X i min ) 0.5
After that, the integration with the previously obtained values of the criterion wj and summing up by rows are performed by Equation (20).
u ( X 1 , , X k ) = i = 1 k w j · u i ( X i )
Finally, the DMUs are ranked in descending order, where the best variant has the highest value.

3.4. The Fourth Phase

In this segment of the developed methodology, a sensitivity analysis, which refers to two parts, is performed. The first part includes changing the significance of inputs and outputs by applying Equation (21).
W n β = ( 1 W n α ) W β ( 1 W n )
W ˜ n α denotes a reduced value of the criterion whose weight changes, W ˜ β denotes the original value of the criterion under consideration, while W ˜ n denotes the original value of the criterion whose value is reduced or increased.
In addition, in the sensitivity analysis, the results obtained were compared with two other MCDM methods: MABAC [22,23] and CoCoSo [24,25]. Comparative analysis can provide exceptional suggestions in modeling different processes, such as in [26]. Based on the change in the weights of criteria and based on the comparison with other methods, new results and ranks were obtained.

4. Case Study

4.1. Analysis of the Condition of Railway Sections in B&H

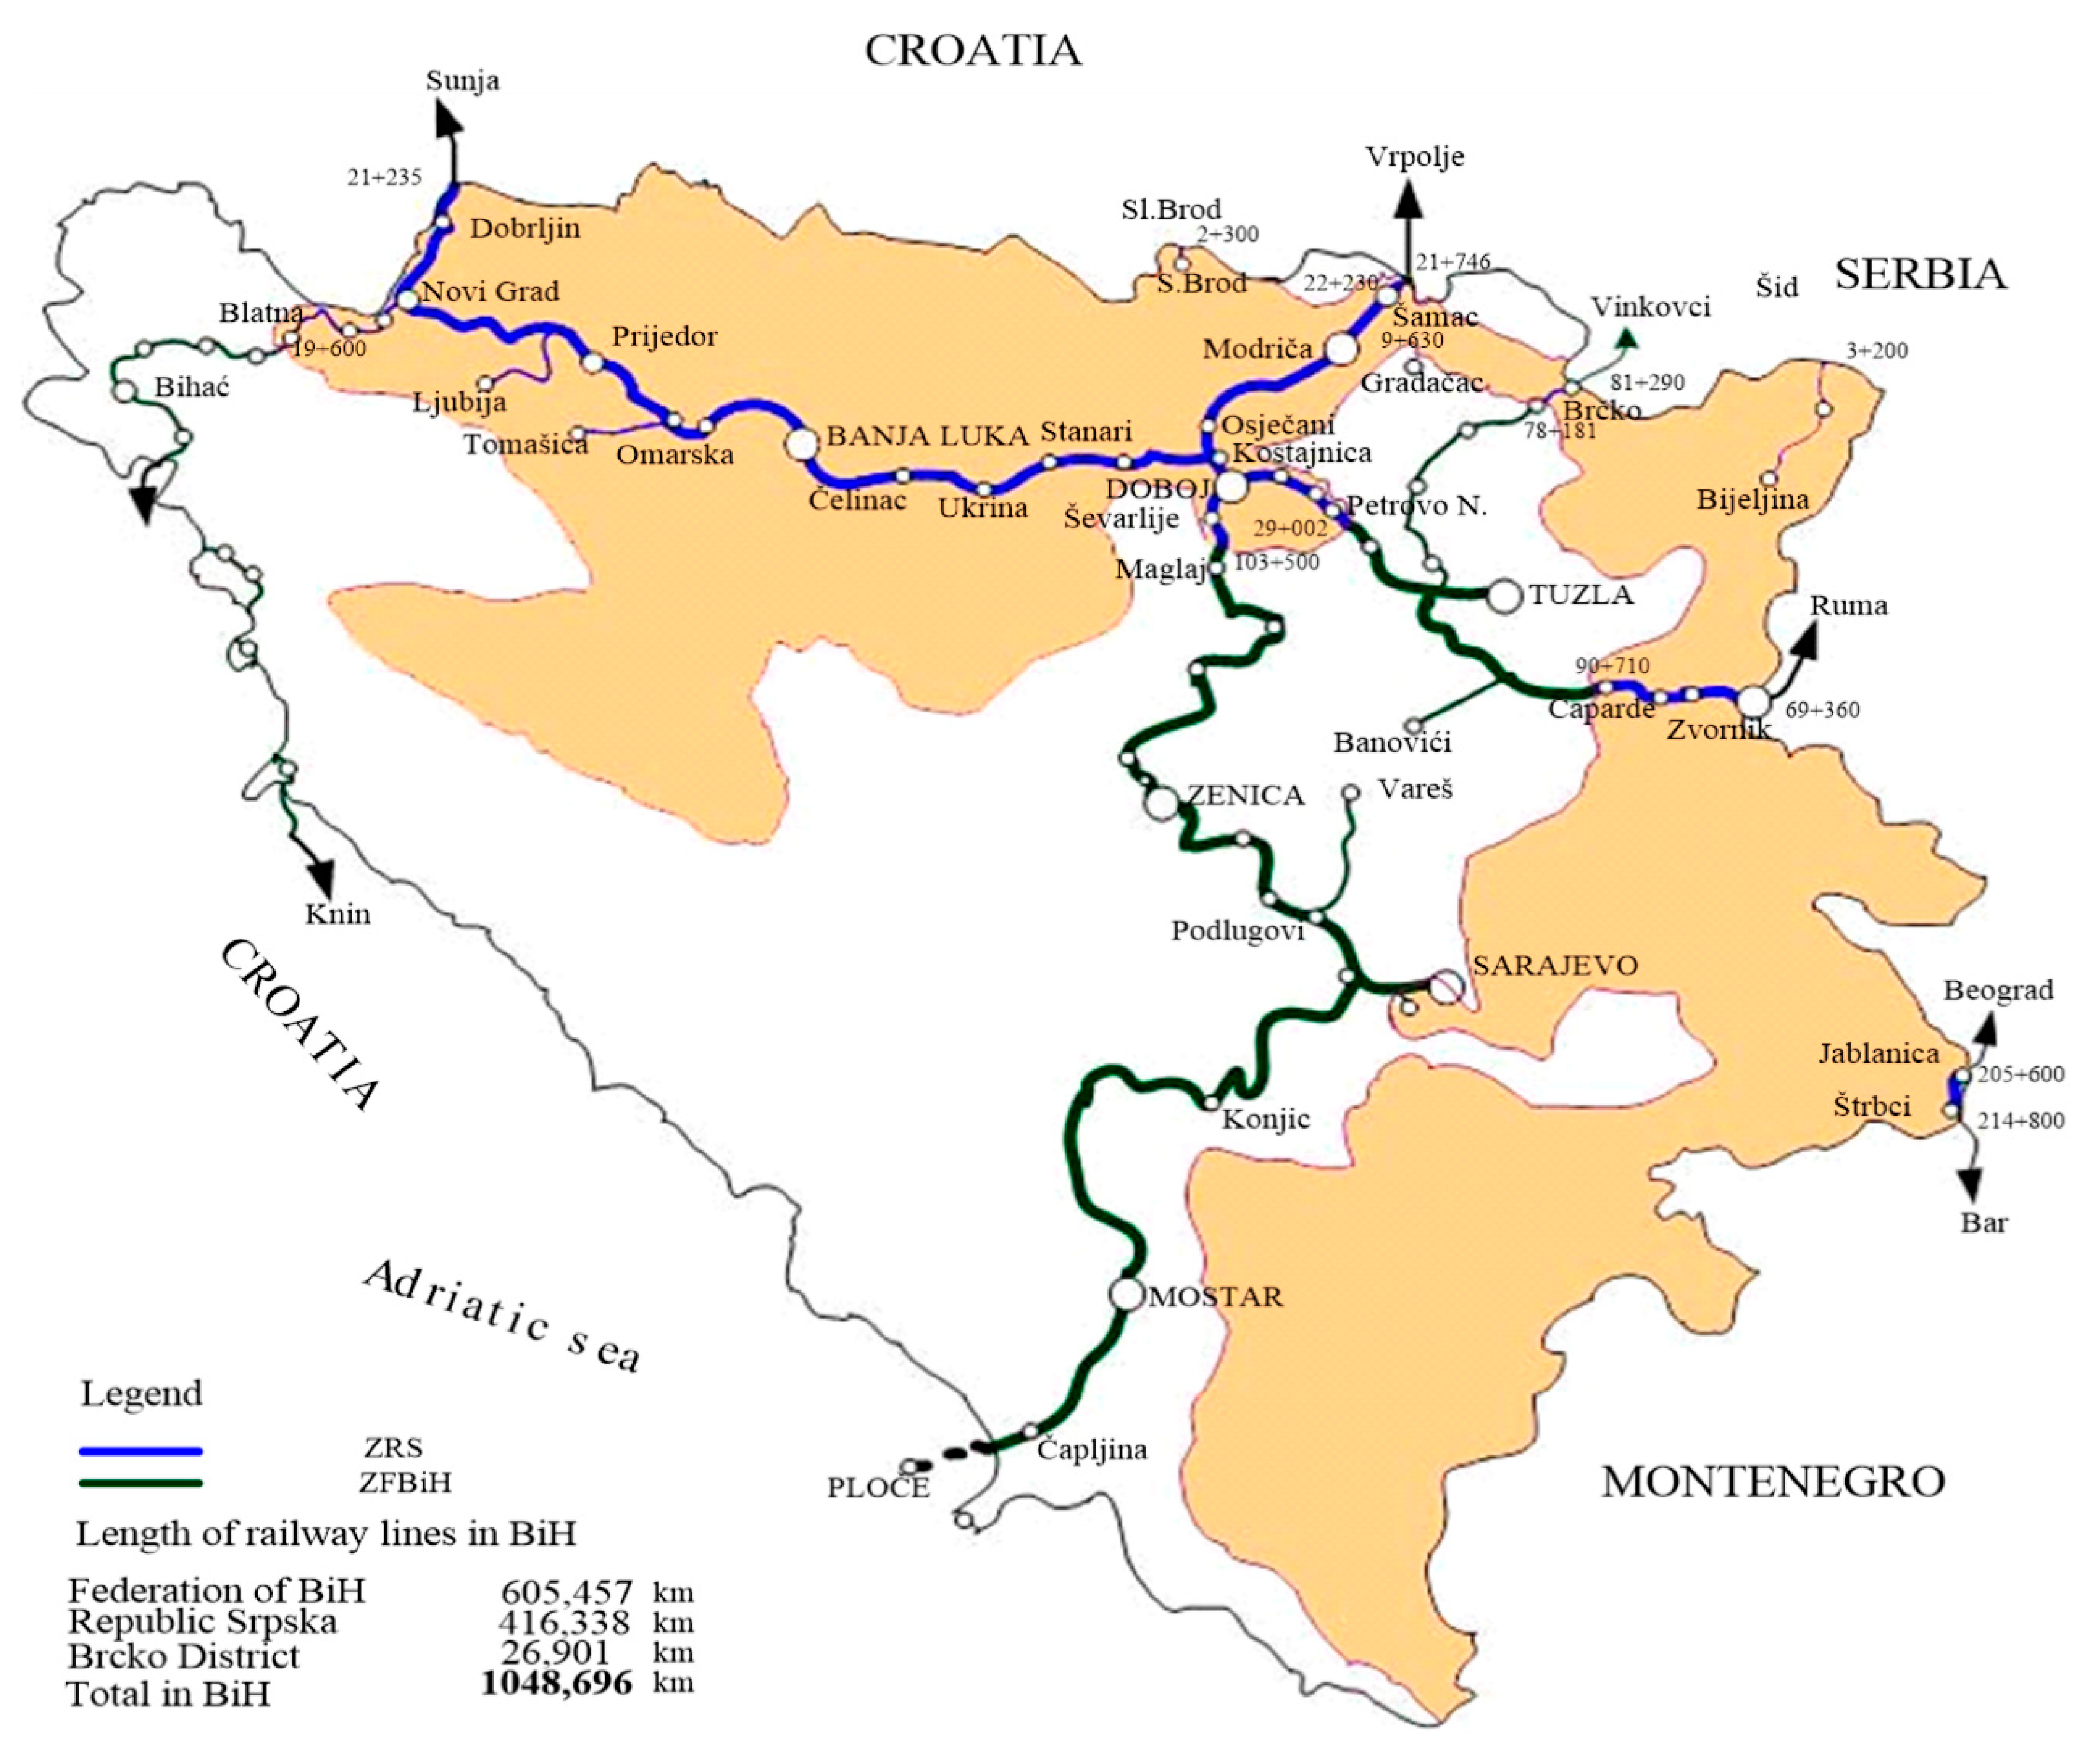
The generator of flows of goods and passengers on the railway network in Bosnia and Herzegovina is the corridor Vc (Šamac–Doboj–Sarajevo–Mostar–Čapljina–Ploče) and the railway line Zvornik–Tuzla–Doboj–Banja Luka–Novi Grad/Bosanski Novi–Bihać. The operational railway network in B&H consists of 1048 km of railways. Most of the network consists of a single-track railway and 87 km of a double-track railway. The railway network in Bosnia and Herzegovina is shown in Figure 2. The main electrification system is 25 kV/50 Hz and 776 km of the network is electrified. There are a total of 94 railway stations in B&H, of which 43 stations with simplified security and 51 with full security. The B&H railway network has 491 level crossings, of which only 59 are actively protected by traffic lights and/or ramps, and the other 434 are passively protected by St. Andrew’s cross and a visibility triangle. The railway complies with the structure gauge “GA” and “GB”, established by the International Union of Railways “UIC”. The railway is capable of speeds of up to 120 km/h. The ability of the railway to receive loads from vehicles on the B&H railway network are of categories D4 (22.5 t/axle), and C3 (20 t/axle), expressed in tons per axle. The railway sector in B&H consists of two railway companies, The Railways of the Federation of B&H (RFB&H) and The Railways of the Republic of Srpska (RRS), which deal with operations and infrastructure. Both companies have organized regional services or sections as their organizational units in the field. They are functionally organized in nine (9) sections (Bihać, Novi Grad, Prijedor, Banja Luka, Doboj, Tuzla, Zenica, Sarajevo and Mostar).
The current state of transport capacities, executive staff, stations, realized train-kilometers and the length of the railway network with its sections are explained in Table 1.

4.2. Defining Input-Output Parameters

The essence, meaning and reasons of each criterion are explained in the further text. Note: The transport of dangerous goods in Bosnia and Herzegovina is small in scale, and it is not possible to take into account the type of goods; for this reason, this criterion has not been considered.
The total length of railway network—I1. This criterion refers to the characteristics of the network and greatly affects railway traffic safety. The safety of transport of goods and passengers is significantly affected by the condition and the degree of wear of the railway network. Even though the technical condition of the network has been improved by reconstruction and modernization, it still does not correspond to the condition of modern and safe transport. The technical equipment of the railway, as a basis of traffic safety, most clearly reflects the ability of railways, signaling and telecommunication devices and rolling stock. Despite efforts to improve the condition of the railway network, it is still not at the required level due to a high percentage of wear and tear of materials, especially the superstructure (tracks, sleepers, track material and ballast) and other facilities. It is estimated that the degree of wear of track superstructure is over 40%. The level of traffic safety is also affected by a large number of slow drives, i.e., reduction of speed caused by the deterioration of materials and weak points on the railway, which cause very frequent speed changes. Thirty to forty permanent slow drives are introduced annually on the B&H railway network. Due to low temperatures and insufficient ballast, the track is deformed 10 to 15 times a year, especially on parts of the track with continuous welded rails. A significant number of railway network sections are exposed to the influence of natural disturbances, which occasionally endanger traffic and cause its interruptions. The most common are torrential rains, floods and landslides, which pose a danger to traffic safety because these phenomena usually occur suddenly. Traffic safety has been reduced due to the condition of tracks, which is determined by the technical parameters of facilities on particular tracks and the manner and policy of track maintenance.
The total number of stations—I2. Railway traffic safety, in addition to the human factor, is most significantly determined by the degree of security of stations with signaling and telecommunication devices. On the B&H railway network, 54% of stations are protected with modern and more extensive security, while 46% of stations are protected with simplified security. The degree of modernization program implementation and installation of modern signaling devices significantly affects the level of railway traffic safety, reducing the number of staff involved in providing and regulating traffic, reducing delays in technological processes, improving working conditions of station staff, better clarity of signal items along tracks, etc. The lack of adequate infrastructure has become a limiting factor for the implementation of new systems for the purpose of safe and regular railway traffic and connecting the railways in B&H with the railways in the region and beyond with the railways of EU countries. Raising the level of train traffic safety largely depends on the installation of modern signaling devices. Some accidents with severe consequences could be avoided if these devices were installed.
The number of level crossings—I3. Many accidents and incidents, especially those with serious consequences, occur at the intersections of railway tracks and roads. The number of traffic accidents and incidents in these places is increasing, and growing with an increase in the number of vehicles in traffic. It is symptomatic that the number of accidents and incidents at level crossings is growing and that the number of human casualties and injured persons is increasing as well as material damage. Accidents at level crossings occur particularly due to the negligence of road vehicle drivers, which is manifested in disrespect of signs at level crossings, careless crossing of vehicles over tracks, etc. Accidents occur due to the fault of railway workers in only 1% of cases. Accidents and incidents occur despite the fact that level crossings are protected by light signals, barriers or half-length barriers. Level crossings on the B&H railway network are locations that generate great risk in terms of railway and road traffic safety. Level crossings should be accepted as a necessary evil, i.e., places where there is a high risk of endangering traffic safety with fatal consequences. To increase traffic safety, it is necessary to take all available measures to reduce negative consequences of accidents at level crossings.
The number of available vehicles—I4. A serious problem in transport execution and timetable realization is poor technical conditions, poor maintenance and a high percentage of immobilization of rolling stock. It was especially manifested in a large number of immobilized locomotives caused by poor maintenance, improper handling of vehicles and their devices, lack of spare parts, prolongation of repairs and damage to locomotives in accidents and incidents. The most common failures in towing vehicles are on drive and auxiliary devices. Special attention should be paid to those defects of rolling stock that directly endanger traffic safety, such as axle fractures or gearbox failures, pantograph fractures on electric locomotives, etc. The number of defects in towing vehicles is very large and is constantly increasing, and that is the reason radical measures should be taken to improve their technical functionality. Immobilization of freight and passenger cars as a consequence of their condition and maintenance adversely affects traffic safety and quality of transport. Due to the unfavorable condition of rolling stock and inadequate maintenance, the number of vehicles removed from traffic because of breakdowns is high. Additionally, the number of accidents and incidents due to vehicle breakdowns is large. According to available data, vehicles in B&H are mostly of old average age, over 41 years, which represents difficulties in maintaining vehicles in good condition. Railway safety largely depends on a level of modernization of rolling stock.
The total number of train-kilometers—I5. Train-kilometers are quantitative indicators that are able to show a certain amount of work or quantity in the transport of passengers and goods. A railway undertaking, providing transport, performs a certain amount of work in train-kilometers, which is considered to be a realized transport service for which a certain price is charged. Train-kilometers characterize the operation of locomotives and cars (electric or diesel engine sets) on one network or on particular lines. The most common criterion for determining the reliability of vehicles is their lifespan, which is expressed in the number of train-kilometers traveled. In essence, the level of railway traffic safety is reduced if the number of train-kilometers traveled is higher. Thus, in B&H, a serious problem is the condition of mobile capacities which are mostly of old age and at the end of their lifespan.
The total number of executive staff—I6. This criterion is the most significant for railway traffic safety because it is dominant in a chain of railway traffic safety components. It can be freely stated that in all accidents and incidents except those caused by “force majeure” (a phenomenon that man cannot predict, manage or control, such as earthquakes, floods, large landslides, large-scale fires, etc.), a man, compared to the resources he has created, is the most susceptible to deviations from standard (standardized, prescribed, expected) behavior and hence becomes a (direct or indirect) cause of most railway accidents and incidents. In some sections, the problem is an insufficient number of executive staff (train drivers, train dispatchers, shunters and switchers), which requires great efforts and responsibilities in order to maintain a high level of safety. The lack of executive staff requires the introduction of extended work, which increases fatigue and creates unfavorable safety conditions. Basically, the cause of some railway accidents and incidents is a man who has failed (directly or indirectly). Thus, he has erred in designing, manufacturing, maintaining, controlling, and handling of technical means which are the cause of some events (serious accidents, accidents and incidents). For these reasons, and in order to increase safety, executive staff must be constantly checked in terms of: health status, professional skills, fatigue, and work and technical discipline.
Table 2 shows the values of all DMUs in relation to input parameters.
To maintain safety at a high level, the European Union in its documents [27] has prescribed the definitions of accidents and incidents and limitations of common safety objectives.
Serious accident—O1. A serious accident means any train collision or derailment of trains resulting in the death of at least one person, serious injuries to five or more persons or extensive damage to rolling stock (extensive damage means damage that can be immediately assessed by the investigating body to cost at least EUR 2 million), infrastructure or the environment, and any other accident which has an obvious impact on railway safety or safety management.
Accident—O2. An accident is an unwanted or unintended sudden event or a specific chain of such events which have harmful consequences (collisions, derailments, level crossing accidents, accidents to persons involving rolling stock in motion, fires, etc.).
Incident—O3. An incident is any occurrence, other than an accident or serious accident, and which is related to the traffic of trains or shunting rolling stock and affects the safety of railway traffic.
Killed persons—O4. Killed persons are any persons killed immediately or dying within 30 days as a result of an accident, serious accident or incident, except persons who committed suicide.
Injured persons—O5. Injured persons are any persons injured who were hospitalized for more than 24 h as a result of an accident, serious accident or incident, except suicide attempt.
Table 3 shows the values of all DMUs in relation to output parameters.
4.3. Determining the Weight Values of Criteria

As already mentioned in the previous section of the paper, two methods were applied to determine the weights of the criteria. The Entropy method was used to determine the weight values of inputs, and Fuzzy PIPRECIA was used to compute the values of outputs.

4.3.1. Determining the Weight Values of Inputs Using the Entropy Method

Table 4 shows a normalized matrix obtained by applying Equation (1).
Examples of calculations for the Entropy method are shown in Appendix A.

4.3.2. Determining the Weight Values of Outputs Using the Fuzzy PIPRECIA Method

The following section of the paper presents the calculation of the weight values of outputs using the Fuzzy PIPRECIA method. As this is a subjective MCDM method, the first evaluation was performed by three experts in the field of railway safety. The evaluation was performed on the basis of linguistic scales defined in [16], the quantification of which is shown in Table 5.
As already mentioned, the evaluation is performed starting from the second, i.e., the penultimate criterion. Therefore, Table 5 shows the evaluation of O2 and O4, respectively. Examples of calculations for fuzzy PIPRECIA are shown in Appendix B, and for inverse fuzzy PIPRECIA in Appendix B.

4.4. Application of DEA Model

In this section, of the paper, input- and output-oriented models of DEA are presented in order to determine which sections, i.e., DMUs, are efficient and will be inserted further in the model and then ranked. Linear programming problems are set and then solved in Lingo 17. As an example of an input-oriented model, shown by Equation (14), Section Bihać is presented in Appendix C. Then, as an example of an output-oriented model, Section Banja Luka, defined by Equation (15), is presented in Appendix C.
Solving all DEA models for all railway sections, the values shown in Table 6 are obtained. The final DEA values obtained by applying Equation (16) are also presented.
The railway sections DMUs Banja Luka and Tuzla are not safe, and it is necessary to implement certain corrective measures in order to improve safety. It can be seen from Table 7 that these two sections have values higher than one and are not inserted further into the model. The highest values are removed, since Equation (16), which defines risk and not efficiency, is applied.

4.5. Application of Weighted Overall Efficiency Ranking Method

Based on the previously applied DEA, we determined the DMUs that represent the greatest risk: DMU4 and DMU6, while other DMUs are relatively safe sections. To determine the difference among the seven DMUs that have obtained the values of one in DEA, the weighted overall efficiency ranking method is applied. First, a new initial matrix is formed consisting of seven railway sections and is shown in Table 7.
Examples of calculation are shown in Appendix D.
The final values of all railway sections and their ranks are obtained, which is shown in Table 8.
After the application of the integrated Entropy-Fuzzy PIPRECIA-DEA model, the results show that the railway section Mostar is the safest in Bosnia and Herzegovina, with a value of 0.687. The second safest section is Prijedor, with a value of 0.601. The railway sections Tuzla and Banja Luka, which are characterized as the sections with the highest risk within the DEA model, are followed by the sections Doboj and Bihać, applying the weighted overall efficiency ranking method.

5. Sensitivity Analysis

5.1. Changing the Significance of Criteria

When creating a model and calculating the results, it is very important to determine how sensitive the model is to changes in input parameters. Therefore, in this section, the impacts of inputs and outputs are changed by applying Equation (21) [28]. Thirty scenarios were formed with completely new values of the criteria, as shown in Table 9.
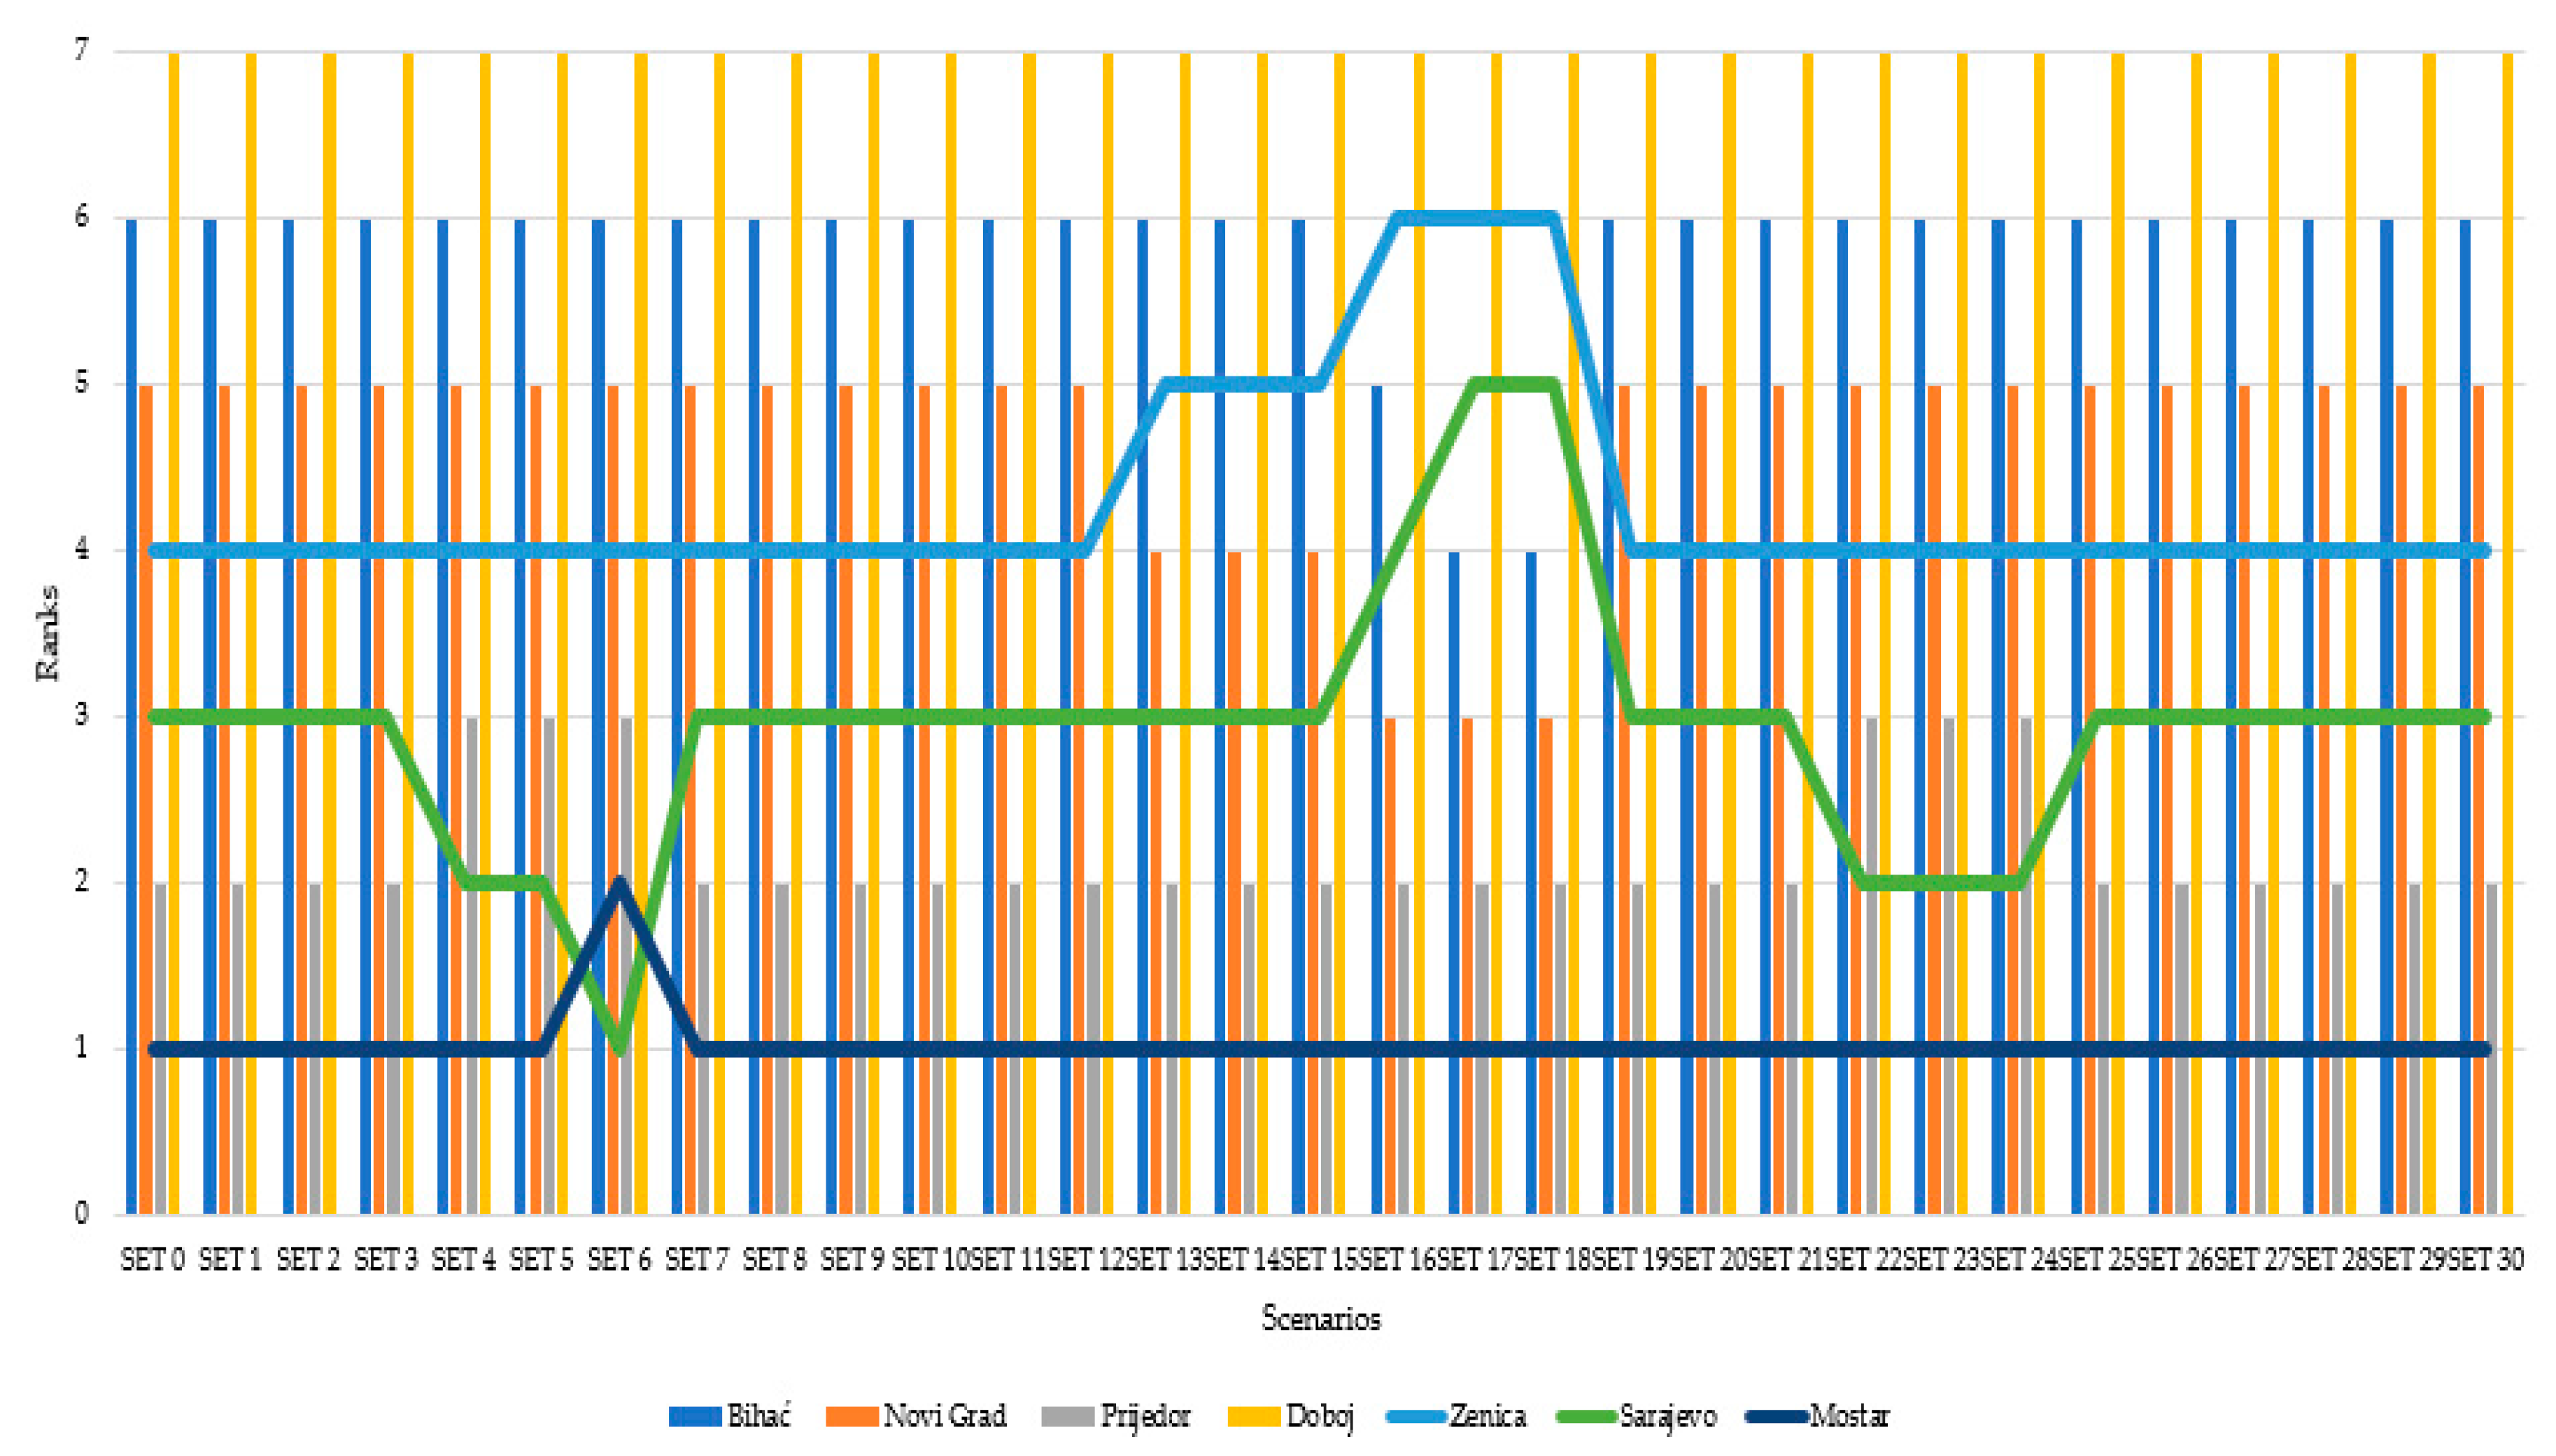
For each of the newly formed scenarios, the calculation was performed again using the weighted overall efficiency ranking method, and the results presented in Figure 3 were obtained.
Figure 3 shows that the model is sensitive to changes in the significance of the criteria in the following cases. The first change of ranks is in the fourth scenario when the third (Prijedor) and the sixth alternative (Sarajevo) change their positions, and Sarajevo is in the second position. The reason for this change is the reduction of the most significant criterion w10 by 60%. This ranking is maintained in the fifth scenario, and the biggest changes in the rankings occur in the sixth scenario, when the first-ranked alternative (Mostar) falls to second place, and the sixth alternative (Sarajevo) comes in the first place. This is caused by reducing the value of the most significant criterion w10 to a value of 0.013, i.e., the significance is reduced by as much as 90%. In all other scenarios, the railway section Mostar retains the first position. In scenarios S7–S12, there is no change in the initial ranks, which practically implies that any change of criterion w2 does not affect the stability of the model. However, the change of the third most significant criterion w6 leads to the change of the original ranks. With the reduction of the significance of this criterion by 15, 30 and 45% (S13, S14 and S15), the railway sections Novi Grad and Zenica change their positions (fourth and fifth position). When the criterion w6 is reduced by 60% (S16), there are new changes in the rankings which include the following: the first alternative (Bihać) comes to the fifth from the sixth place, while the reverse situation occurs for the section Zenica. In addition, in this set, Novi Grad and Sarajevo change their positions (third and fourth place). In sets S17 and S18, when the criterion w6 is reduced by 75 and 90%, there are major changes in the ranks. Namely, Bihać changes its rank by two places (from the sixth to the fourth), while Sarajevo falls from the third to the fifth place compared to the initial rank. In the following sets, in S22–S24 is there a change in only one position, and in other scenarios, the initial rank is retained. Based on the analysis of the impact of changes in the weight values of the criteria, it can be concluded that the model is sensitive in certain scenarios, with an emphasis that the biggest changes in ranks occur when the significance of the last input, i.e., the value of criterion w6 changes.

5.2. Comparison with MABAC and CoCoSo Methods

In this part of the sensitivity analysis, the previously obtained results created by integrating the Entropy-Fuzzy PIPRECIA-DEA-weighted overall efficiency ranking method are confirmed by comparison with two MCDM methods, MABAC and CoCoSo. The results are presented in Table 10.
The originally obtained ranks were confirmed through comparison with the MABAC and CoCoSo methods. Based on the presented ranks, it can be noticed that they are in a very high correlation. The results obtained by implementing the MABAC method show the same ranks, except for the section Sarajevo, which shares the second position. The situation is similar with the CoCoSo method when Prijedor and Sarajevo change positions, while other railway sections keep their initial positions.

6. Conclusions

European transport policy emphasizes that the introduction of an efficient, clean and safe freight and passenger transport system requires an appropriate, dynamic, railway system that will directly contribute to the creation and development of the single European market. The position of transport policy is that the transport system must be viewed as a whole in which all modes of transport are complementary and compatible with the ultimate goal of providing end users with high-quality service, greater safety, lower costs, and more innovation, with fewer negative impacts on environment. As the transport sector is the driving force of the B&H economy, it is crucial that the railway system in B&H continues to develop and rebuild in a sustainable manner. To maintain a competitive position in terms of transport, it is necessary to establish a framework for its sustainable functioning. Through the research conducted, a new subjective–objective model was developed for determining the level of safety in railway traffic and sustainable functioning, which is one of the most important contributions of the paper. Primarily, it was noticed the need for the research, initiated by the liberalization of the market in B&H. Inputs and outputs were defined, and quantitative indicators were collected for all railway sections in B&H. Due to the specificity of the problem being treated, a new integrated Entropy-Fuzzy PIPRECIA-DEA-weighted overall efficiency ranking method was developed. The Entropy method was used to determine input weights, while the Fuzzy PIPRECIA method was used to determine output weights in order to insert their values further into the model. Two DEA models were defined, showing that two railway sections, Tuzla and Banja Luka, had poor performance in terms of the level of railway traffic safety, and were eliminated from further calculations. The weighted overall efficiency ranking method was then applied to determine the ranks of the remaining seven sections. The obtained results were modeled through a sensitivity analysis. The comparison with two other MCDM methods confirmed the results previously obtained by the developed methodology. Then, the results were modeled in terms of changing the significance of the five most important criteria, which showed that the model was sensitive to certain changes in the weights of criteria. The biggest deviations, i.e., changes in ranks, were when the third criterion in terms of significance, w6, was decreased by 75 or 90%. In these scenarios of modeling the impact of criteria, when one criterion decreases, the others increase proportionally.
The results show that the railway section Mostar has the best performance in terms of safety and could be a benchmark in future research with respect to certain corrective measures for other railway sections. Regarding the liberalization of the transport market and the possibility of providing services by foreign operators, it is necessary to define performance improvement measures and a standard risk management procedure as soon as possible. The model developed in this paper can serve in a risk management standardization procedure in railway sections.

Author Contributions

Conceptualization, A.B. and S.K.; methodology, Ž.S. and D.M.; validation, Ž.S. and S.K.; investigation, A.B. and S.K.; data curation, A.B. and S.R.; writing—original draft preparation, Ž.S. and A.B.; writing—review and editing, D.M. and S.R.; All authors have read and agreed to the published version of the manuscript.

Funding

This research received no external funding.

Conflicts of Interest

The authors declare no conflict of interest.

Appendix A

The normalization of the initial matrix is performed as follows.
n 11 = 44.9 1048.7 = 0.043
In the second step, the computation of the entropy measure is performed by applying Equation (2) and the following values
e 1 = 0.933 , e 2 = 0.855 , e 3 = 0.933 , e 4 = 0.974 , e 5 = 0.945 , e 6 = 0.891
are obtained as follows:
e 1 = 1 ln ( 9 ) ( 2.050 ) = 0.933
In the third step, the values of the objective calculation of criterion weights are obtained by applying Equation (3).
w 1 = 0.153 , w 2 = 0.261 , w 3 = 0.153 , w 4 = 0.060 , w 5 = 0.125 , w 6 = 0.248   as   follows : w 1 = 1 0.933 0.439 = 0.153
To aggregate these values with the output values, it is necessary to divide the stated values by two and the final input values are obtained:
w 1 = 0.077 , w 2 = 0.131 , w 3 = 0.077 , w 4 = 0.030 , w 5 = 0.063 , w 6 = 0.124

Appendix B

Averaging the estimates given by the expert team, a matrix s j ¯ , i.e., s j ¯ is obtained. The coefficient k j ¯ is calculated by applying Equation (5) as follows.
k 1 ¯ = ( 1.000 , 1.000 , 1.000 )
k 2 ¯ = ( 2 1.000 , 2 0.788 , 2 0.556 ) = ( 1.000 , 1.222 , 1.444 )
When Equation (6) is applied, the values q j ¯ are obtained as follows:
q 1 ¯ = ( 1.000 , 1.000 , 1.000 )
q 2 ¯ = ( 1.000 1.444 , 1.000 1.222 , 1.000 1.000 ) = ( 0.692 , 0.818 , 1.000 )
q 3 ¯ = ( 0.692 1.567 , 0.818 1.444 , 1.000 1.222 ) = ( 0.442 , 0.566 , 0.818 )
To obtain the weight values from the fifth step, it is necessary to apply Equation (7) as follows:
j = 1 n q j ¯ = ( 3.196 , 4.230 , 5.867 ) = ( 1.000 + 0.692 + 0.442 + 0.663 + 0.399 ) = 3.196 = ( 1.000 + 0.818 + 0.566 + 1.133 + 0.713 ) = 4.230 = ( 1.000 + 1.000 + 0.818 + 1.818 + 1 , 230 ) = 5.867
w 1 ¯ = ( 1.000 5.867 , 1.000 4.230 , 1.000 3.196 ) = ( 0.170 , 0.236 , 0.313 )
The equation d f c r i s p = l + 4 m + u 6 is applied to perform the defuzzification of the values as shown in the penultimate column of Table A1. Additionally, in Table A1, the results obtained by using the fuzzy PIPRECIA method and the values of the criteria, i.e., outputs are shown.
Table A1. Details of the calculation carried out using fuzzy PIPRECIA.
s j ¯ k j ¯ q j ¯ w j ¯ DFwj
O1 (1, 1, 1)(1, 1, 1)(0.17, 0.236, 0.313)0.238
O2(0.556, 0.778, 1)(1, 1.222, 1.444)(0.692, 0.818, 1)(0.118, 0.193, 0.313)0.201
O3(0.433, 0.556, 0.778)(1.222, 1.444, 1.567)(0.442, 0.566, 0.818)(0.075, 0.134, 0.256)0.144
O4(1.333, 1.5, 1.55)(0.45, 0.5, 0.667)(0.663, 1.133, 1.818)(0.113, 0.268, 0.569)0.292
O5(0.34, 0.411, 0.522)(1.478, 1.589, 1.66)(0.399, 0.713, 1.23)(0.068, 0.169, 0.385)0.188
SUM (3.196, 4.23, 5.867)
In the following, the inverse fuzzy PIPRECIA methodology is applied, i.e., Equations (8)–(11) are applied. The results are shown in Table A2.
Table A2. Details of the calculation carried out using fuzzy PIPRECIA-I.
s j ¯ k j ¯ q j ¯ w j ¯ DFwj
O1(1.067, 1.1, 1.15)(0.85, 0.9, 0.933)(1.074, 1.622, 2.116)(0.131, 0.232, 0.396)0.243
O2(1.167, 1.25, 1.3)(0.7, 0.75, 0.833)(1.002, 1.46, 1.798)(0.123, 0.209, 0.337)0.216
O3(0.29, 0.34, 0.411)(1.589, 1.66, 1.71)(0.835, 1.095, 1.259)(0.102, 0.157, 0.236)0.161
O4(1.3, 1.45, 1.5)(0.5, 0.55, 0.7)(1.429, 1.818, 2)(0.175, 0.26, 0.375)0.265
O5 (1, 1, 1)(1, 1, 1)(0.122, 0.143, 0.187)0.147
SUM (5.34, 6.996, 8.172)
To determine the final weight values of the outputs, Equations (12) and (13) are applied as follows; Equation (12) is first applied to obtain the following values:
w 1 = 1 2 ( 0.238 + 0.243 ) = 0.240
w 2 = 0.208 , w 3 = 0.153 , w 4 = 0.278 , w 5 = 0.167
and then Equation (13) is applied in order to obtain the final values of the outputs, which are further inserted into the model, and they are
O 1 = 0.115 , O 2 = 0.099 , O 3 = 0.072 , O 4 = 0.135 , O 5 = 0.079   obtained   as   follows :
O 1 = 0.240 ( 1.047 1 5 ) 2 = 0.115
Spearman’s correlation coefficient is 0.900, while Pearson’s correlation coefficient is 0.884, which is a very high correlation of both the ranks and values.

Appendix C

D E A i n p u t B i h a ć = MAX = 98.844 w 1 + 51 w 2 + 158000 w 3 + 9 w 4 + 146 w 5 + 17 w 6 ; 98.844 w 1 + 51 w 2 + 158000 w 3 + 9 w 4 + 146 w 5 + 17 w 6 ( 1 w 7 + 1 w 8 + 2 w 9 + 1 w 10 + 0 w 11 ) < = 0 ; 44.222 w 1 + 57 w 2 + 158095.3 w 3 + 7 w 4 + 108 w 5 + 61 w 6 ( 1 w 7 + 0 w 8 + 0 w 9 + 1 w 10 + 0 w 11 ) < = 0 ; 52.5 w 1 + 39 w 2 + 474285.9 w 3 + 7 w 4 + 87 w 5 + 462 w 6 ( 1 w 7 + 0 w 8 + 2 w 9 + 1 w 10 + 0 w 11 ) < = 0 ; 91.6 w 1 + 66 w 2 + 316190.6 w 3 + 10 w 4 + 144 w 5 + 168 w 6 ( 1 w 7 + 7 w 8 + 26 w 9 + 1 w 10 + 3 w 11 ) < = 0 ; 229.1 w 1 + 134 w 2 + 632381.2 w 3 18 w 4 + 254 w 5 + 215 w 6 ( 2 w 7 + 5 w 8 + 11 w 9 + 2 w 10 + 4 w 11 ) < = 0 ; 141.855 w 1 + 107 w 2 504200 w 3 + 18 w 4 + 414 w 5 + 359 w 6 ( 4 w 7 + 13 w 8 + 55 w 9 + 4 w 10 + 12 w 11 ) < = 0 ; 167.673 w 1 + 11 w 2 + 854576 w 3 + 12 w 4 + 306 w 5 + 487 w 6 ( 2 w 7 + 1 w 8 + 0 w 9 + 2 w 10 + 0 w 11 ) < = 0 ; 135.087 w 1 + 37 w 2 + 957420 w 3 + 15 w 4 + 368 w 5 + 591 w 6 ( 2 w 7 + 2 w 8 + 0 w 9 + 2 w 10 + 1 w 11 ) < = 0 ; 133.490 w 1 + 6 w 2 + 844028 w 3 + 17 w 4 + 335 w 5 + 265 w 6 ( 0 w 7 + 2 w 8 + 2 w 9 + 0 w 10 + 2 w 11 ) < = 0 ; 1 w 7 + 1 w 8 + 2 w 9 + 1 w 10 + 0 w 11 = 1 ; w 1 > 0 ; w 2 > 0 ; w 3 > 0 ; w 4 > 0 ; w 5 > 0 ; w 6 > 0 ; w 7 > 0 ; w 8 > 0 ; w 9 > 0 ; w 10 > 0 ; w 11 > 0 ;
After solving this model, the objective function is 1.000.
D E A o u t p u t B a n j a L u k a = MIN = 1 w 7 + 7 w 8 + 26 w 9 + 1 w 10 + 3 w 11 ; 98.844 w 1 51 w 2 158000 w 3 9 w 4 146 w 5 17 w 6 + ( 1 w 7 + 1 w 8 + 2 w 9 + 1 w 10 + 0 w 11 ) > = 0 ; 44.222 w 1 57 w 2 158095.3 w 3 7 w 4 108 w 5 61 w 6 + ( 1 w 7 + 0 w 8 + 0 w 9 + 1 w 10 + 0 w 11 ) > = 0 ; 52.5 w 1 39 w 2 474285.9 w 3 7 w 4 87 w 5 462 w 6 + ( 1 w 7 + 0 w 8 + 2 w 9 + 1 w 10 + 0 w 11 ) > = 0 ; 91.6 w 1 66 w 2 316190.6 w 3 10 w 4 144 w 5 168 w 6 + ( 1 w 7 + 7 w 8 + 26 w 9 + 1 w 10 + 3 w 11 ) > = 0 ; 229.1 w 1 134 w 2 632381.2 w 3 18 w 4 254 w 5 215 w 6 + ( 2 w 7 + 5 w 8 + 11 w 9 + 2 w 10 + 4 w 11 ) > = 0 ; 141.855 w 1 107 w 2 504200 w 3 18 w 4 414 w 5 359 w 6 + ( 4 w 7 + 13 w 8 + 55 w 9 + 4 w 10 + 12 w 11 ) > = 0 ; 167.673 w 1 11 w 2 854576 w 3 12 w 4 306 w 5 487 w 6 + ( 2 w 7 + 1 w 8 + 0 w 9 + 2 w 10 + 0 w 11 ) > = 0 ; 135.087 w 1 37 w 2 957420 w 3 15 w 4 368 w 5 591 w 6 + ( 2 w 7 + 2 w 8 + 0 w 9 + 2 w 10 + 1 w 11 ) > = 0 ; 133.490 w 1 6 w 2 844028 w 3 17 w 4 335 w 5 265 w 6 + ( 0 w 7 + 2 w 8 + 2 w 9 + 0 w 10 + 2 w 11 ) > = 0 ; 91.6 w 1 + 66 w 2 + 316190.6 w 3 + 10 w 4 + 144 w 5 + 168 w 6 = 1 ; w 1 > 0 ; w 2 > 0 ; w 3 > 0 ; w 4 > 0 ; w 5 > 0 ; w 6 > 0 ; w 7 > 0 ; w 8 > 0 ; w 9 > 0 ; w 10 > 0 ; w 11 > 0 ;
After solving this model, the objective function is 1.061.

Appendix D

Since the inputs are of benefit type, i.e., they need to be maximized, Equation (19) is applied as follows:
u 1 ( I 1 ) = ( ( 44.9 44.222 ) ( 251.884 44.222 ) ) 0.5 = 0.057
while the outputs are of minimization type, and Equation (18) is applied as follows:
u 1 ( O 1 ) = 2 1 2 0 = 0.500 .
Normalization is performed in an identical way for all other elements of the initial matrix depending on the type of orientation. The entire normalized matrix obtained as described above is shown in Table A3.
Table A3. Normalized matrix.
I1I2I3I4I5I6O1O2O3O4O5
DMU10.0570.5520.0000.0000.4580.0000.5000.8000.8180.5001.000
DMU20.0000.6310.0110.0000.2730.2770.5001.0001.0000.5001.000
DMU30.2000.5080.6290.0000.0000.8800.5001.0000.8180.5001.000
DMU51.0001.0000.7701.0000.7710.5870.0000.0000.0000.0000.000
DMU70.7690.1980.9330.3020.8830.9050.0000.8001.0000.0001.000
DMU80.6320.4841.0000.6031.0001.0000.0000.6001.0000.0000.750
DMU90.6560.0000.9260.6030.9390.6571.0000.6000.8181.0000.500
After that, the integration with the previously obtained values of the criteria wj is performed:
w 1 = 0.077 , w 2 = 0.131 , w 3 = 0.077 , w 4 = 0.030 , w 5 = 0.063 , w 6 = 0.124 , w 7 = 0.115 , w 8 = 0.099 , w 9 = 0.072 , w 10 = 0.135 , w 11 = 0.079
and the values for DMUs are summed by rows. Therefore, by applying Equation (20), the final values of all railway sections and their ranks are obtained, which is shown in Table 8.

References

  1. Roets, B.; Verschelde, M.; Christiaens, J. Multi-output efficiency and operational safety: An analysis of railway traffic control centre performance. Eur. J. Oper. Res. 2018, 271, 224–237. [Google Scholar] [CrossRef]
  2. Wanke, P.; Chen, Z.; Liu, W.; Antunes Jorge, J.M.; Azad, M.A.K. Investigating the drivers of railway performance: Evidence from selected Asian countries. Habitat Int. 2018, 80, 49–69. [Google Scholar] [CrossRef]
  3. Djordjević, B.; Krmac, E.; Mlinarić, T.J. Non-radial DEA model: A new approach to evaluation of safety at railway level crossings. Saf. Sci. 2018, 103, 234–246. [Google Scholar] [CrossRef]
  4. Azadeh, A.; Ghaderi, S.F.; Izadbakhsh, H. Integration of DEA and AHP with computer simulation for railway system improvement and optimization. Appl. Math. Comput. 2008, 195, 775–785. [Google Scholar] [CrossRef]
  5. Mohajeri, N.; Amin Gholam, R. Railway station site selection using analytical hierarchy process and data envelopment analysis. Comput. Ind. Eng. 2010, 59, 107–114. [Google Scholar] [CrossRef]
  6. Cantos, P.; Pastor, J.M.; Serrano, L. Vertical and Horizontal Separation in the European Railway Sector and its Effects on Productivity. J. Transp. Econ. Policy 2010, 44, 139–160. [Google Scholar]
  7. Li, L.-B.; Hu, J.-L. Efficiency and productivity of the Chinese railway system, Application of a multi-stage framework. Afr. J. Bus. Manag. 2011, 5, 8789–8803. [Google Scholar]
  8. Hansen, I.A.; Wiggenraad, P.B.L.; Wolff, J.W. Benchmark Analysis of Railway Networks and Undertakings. In Proceedings of the International Seminar on Railway Operations Modelling and Analysis, Copenhagen, Denmark, 13–15 May 2013; pp. 1–20. [Google Scholar]
  9. Azadeh, A.; Salehi, V. Modeling and optimizing efficiency gap between managers and operators in integrated resilient systems. Process Saf. Environ. Prot. 2014, 92, 766–778. [Google Scholar] [CrossRef]
  10. Marchetti, D.; Wanke, P. Brazil′s rail freight transport: Efficiency analysis using two-stage DEA and cluster-driven public policies. Socio-Econ. Plan. Sci. 2017, 59, 26–42. [Google Scholar] [CrossRef]
  11. Kapetanovic, M.; Milenkovic, M.; Bojovic, N.; Avramovic, Z. Evaluation of European Railway Companies Efficiency: Application of a Two-Stage Analysis. Tehnika 2017, 72, 403–410. [Google Scholar] [CrossRef] [Green Version]
  12. Bai, X.-J.; Zeng, J.; Chiu, Y.-H. Pre-evaluating efficiency gains from potential mergers and acquisitions based on the resampling DEA approach: Evidence from China′s railway sector. Transp. Policy 2019, 76, 46–56. [Google Scholar] [CrossRef]
  13. Blagojevic, A.; Vesković, S.; Kasalica, S.; Gojic, A.; Allamani, A. The application of the fuzzy ahp and dea for measuring the efficiency of freight transport railway undertakings. Oper. Res. Eng. Sci. Theory Appl. 2020, 3, 1–23. [Google Scholar] [CrossRef]
  14. Stefaniec, A.; Hosseini, K.; Xie, J.; Li, Y. Sustainability assessment of inland transportation in China: A triple bottom line-based network DEA approach. Transp. Res. Part D Transp. Environ. 2020, 80, 102258. [Google Scholar] [CrossRef]
  15. Shannon, C.E.; Weaver, W. The Mathematical Theory of Communication; The University of Illinois Press: Urbana, IL, USA, 1947. [Google Scholar]
  16. Stević, Ž.; Stjepanović, Ž.; Božičković, Z.; Das, D.K.; Stanujkić, D. Assessment of conditions for implementing information technology in a warehouse system: A novel fuzzy piprecia method. Symmetry 2018, 10, 586. [Google Scholar] [CrossRef] [Green Version]
  17. Memiş, S.; Demir, E.; Karamaşa, Ç.; Korucuk, S. Prioritization of road transportation risks: An application in Giresun province. Oper. Res. Eng. Sci. Theory Appl. 2020, 3, 111–126. [Google Scholar] [CrossRef]
  18. Đalić, I.; Stević, Ž.; Karamasa, C.; Puška, A. A novel integrated fuzzy PIPRECIA–interval rough SAW model: Green supplier selection. Decis. Mak. Appl. Manag. Eng. 2020, 3, 126–145. [Google Scholar] [CrossRef]
  19. Đalić, I.; Ateljević, J.; Stević, Ž.; Terzić, S. An integrated SWOT—Fuzzy PIPRECIA model for analysis of competitiveness in order to improve logistics performances. Facta Univ. Ser. Mech. Eng. 2020. [Google Scholar] [CrossRef]
  20. Mondal, S.; Chakraborty, S. A solution to robot selection problems using data envelopment analysis. Int. J. Ind. Eng. Comput. 2013, 4, 355–372. [Google Scholar] [CrossRef]
  21. Charnes, A.; Cooper, W.W.; Rhodes, E. Measuring the efficiency of decision making units. Eur. J. Oper. Res. 1978, 2, 429–444. [Google Scholar] [CrossRef]
  22. Pamučar, D.; Ćirović, G. The selection of transport and handling resources in logistics centers using Multi-Attributive Border Approximation area Comparison (MABAC). Expert Syst. Appl. 2015, 42, 3016–3028. [Google Scholar] [CrossRef]
  23. Muravev, D.; Mijic, N. A Novel Integrated Provider Selection Multicriteria Model: The BWM-MABAC Model. Decis. Mak. Appl. Manag. Eng. 2020, 3, 60–78. [Google Scholar] [CrossRef]
  24. Yazdani, M.; Zarate, P.; Zavadskas, E.K.; Turskis, Z. A Combined Compromise Solution (CoCoSo) method for multi-criteria decision-making problems. Manag. Decis. 2019. [Google Scholar] [CrossRef]
  25. Biswas, T.; Chatterjee, P.; Choudhuri, B. Selection of commercially available alternative passenger vehicle in automotive environment. Oper. Res. Eng. Sci. Theory Appl. 2020, 3, 16–27. [Google Scholar] [CrossRef]
  26. Petrović, G.; Mihajlović, J.; Ćojbašić, Ž.; Madić, M.; Marinković, D. Comparison of three fuzzy MCDM methods for solving the supplier selection problem. Facta Univ. Ser. Mech. Eng. 2019, 17, 455–469. [Google Scholar] [CrossRef]
  27. Directive (EU) 2016/798 of the European Parliament and of the Council of 11 May 2016 on Railway Safety; Official Journal of the European Union; European Union: Brussels, Belgium, 2016.
  28. Vesković, S.; Stević, Ž.; Karabašević, D.; Rajilić, S.; Milinković, S.; Stojić, G. A New Integrated Fuzzy Approach to Selecting the Best Solution for Business Balance of Passenger Rail Operator: Fuzzy PIPRECIA-Fuzzy EDAS Model. Symmetry 2020, 12, 743. [Google Scholar] [CrossRef]
Figure 1. Developed methodology for safety evaluation of railway sections.
Symmetry 12 01479 g001
Figure 2. Railway network in B&H.
Symmetry 12 01479 g002
Figure 3. Results of sensitivity analysis with changes of the impact of the five most significant criteria.
Symmetry 12 01479 g003
Table 1. Description of railway sections (DMUs).
DMUDescription
DMU1—Bihaćcovers an area of about 44 train-km. It includes 7 stations. In the area of Section Bihać, there are 45 level crossings (railway tracks and roads). Road traffic at these level crossings is of low intensity. Section Bihać has 17 vehicles at its disposal (towing and towed). Section Bihać currently employs 146 executive staff. It realized about 158 thousand train-km in freight and passenger transport.
DMU2—Novi Gradcovers an area of about 44 train-km. It includes 7 stations. In the area of the section of Novi Grad, there are 57 level crossings (railway tracks and roads). Road traffic at these level crossings ranges from low intensity to moderate intensity. Section Novi Grad has 61 vehicles at its disposal (towing and towed). Section Novi Grad currently employs 108 executive staff. It realized about 158 thousand train-km in freight and passenger transport.
DMU3—Prijedorcovers an area of about 52 train-km. It includes 7 stations. In the area Section Prijedor, there are 39 level crossings (railway tracks and roads). Road traffic at these level crossings ranges from low intensity to moderate intensity. Section Prijedor has 462 vehicles at its disposal (towing and towed). Section Prijedor currently employs 87 executive staff. It realized about 474 thousand train-km in freight and passenger transport.
DMU4—Banja Lukacovers an area of about 92 train-km. It includes 10 stations. In the area of Section Banja Luka, there are 66 level crossings (railway tracks and roads). Road traffic at these level crossings ranges from low intensity to moderate intensity. Section Banja Luka has 168 vehicles at its disposal (towing and towed). Section Banja Luka currently employs 144 executive staff. It realized about 316 thousand train-km in freight and passenger transport.
DMU5—Dobojcovers an area of about 252 train-km. It includes 18 stations. In the area of Section Doboj, there are 134 level crossings (railway tracks and roads). Road traffic at these level crossings ranges from low intensity to moderate intensity. Section Doboj has 215 vehicles at its disposal (towing and towed). Section Doboj currently employs 254 executive staff. It realized 632 thousand train-km in freight and passenger transport.
DMU6—Tuzlacovers an area of about 136 train-km. It includes 15 stations. In the area of Section Tuzla, there are 97 level crossings (railway tracks and roads). Road traffic at these level crossings ranges from low intensity to moderate intensity. Section Tuzla has 359 vehicles at its disposal (towing and towed). Section Tuzla currently employs 414 executive staff. It realized about 504 thousand train-km in freight and passenger transport.
DMU7—Zenicacovers an area of about 167 train-km. It includes 8 stations. In the area of Section Zenica, there are 11 level crossings (railway tracks and roads). Road traffic at these level crossings ranges from low intensity to moderate intensity. Section Zenica has 487 vehicles at its disposal (towing and towed). Section Zenica currently employs 306 executive staff. It realized about 855 thousand train-km in freight and passenger transport.
DMU8—Sarajevocovers an area of about 127 train-km. It includes 11 stations. In the area of Section Sarajevo, there are 36 level crossings (railway tracks and roads). Road traffic at these level crossings ranges from low intensity to moderate intensity. Section Sarajevo has 591 vehicles at its disposal (towing and towed). Section Sarajevo currently employs 368 executive staff. It realized about 957 thousand train-km in freight and passenger transport.
DMU9—Mostarcovers an area of about 133 train-km. It includes 11 stations. In the area of Section Mostar, there are six level crossings (railway tracks and roads). Road traffic at these level crossings ranges from low intensity to moderate intensity. Section Mostar has 265 vehicles at its disposal (towing and towed). Section Mostar currently employs 335 executive staff. It realized 844 thousand train-km in freight and passenger transport.
Table 2. Section indicators in relation to inputs.
Total Length of Railway Network (km)—I1Total Number of Stations—I2Number of Level Crossings—I3Number of Available Vehicles—I4Total Number of Train-km—I5Total Number of Executive Staff—I6
DMU1—Bihać44.90045158,000714617
DMU2—Novi Grad44.22257158,095.3710861
DMU3—Prijedor52.50039474,285.9787462
DMU4—Banja Luka91.60066316,190.610144168
DMU5—Doboj251.884134632,381.218254215
DMU6—Tuzla136.00097504,20015414359
DMU7—Zenica166.90011854,5768306487
DMU8—Sarajevo127.20036957,42011368591
DMU9—Mostar133.4906844,02811335265
Total1,048,696491 9421622625
Table 3. Section indicators in relation to outputs.
Serious Accident (Number)—O1Accident (Number)—O2Incident (Number)—O3Killed Persons (Number)—O4Injured Persons (Number)—O5
DMU1—Bihać11210
DMU2—Novi Grad10010
DMU3—Prijedor10210
DMU4—Banja Luka172613
DMU5—Doboj251124
DMU6—Tuzla41355412
DMU7—Zenica21020
DMU8—Sarajevo22021
DMU9—Mostar02202
Table 4. Normalized decision matrix.
I1I2I3I4I5I6
DMU10.0430.0920.0320.0740.0680.006
DMU20.0420.1160.0320.0740.0500.023
DMU30.0500.0790.0970.0740.0400.176
DMU40.0870.1340.0650.1060.0670.064
DMU50.2400.2730.1290.1910.1170.082
DMU60.1300.1980.1030.1600.1910.137
DMU70.1590.0220.1740.0850.1420.186
DMU80.1210.0730.1950.1170.1700.225
DMU90.1270.0120.1720.1170.1550.101
Table 5. Evaluation of outputs by an expert team.
Fuzzy PIPRECIA
O2O3O4O5
DM1(0.667, 1, 1)(0.4, 0.5, 0.667)(1.3, 1.45, 1.5)(0.286, 0.333, 0.4)
DM2(0.5, 0.667, 1)(0.5, 0.667, 1)(1.3, 1.45, 1.5)(0.4, 0.5, 0.667)
DM3(0.5, 0.667, 1)(0.4, 0.5, 0.667)(1.4, 1.6, 1.65)(0.333, 0.4, 0.5)
AV(0.556, 0.778, 1)(0.433, 0.556, 0.778)(1.333, 1.5, 1.55)(0.34, 0.411, 0.522)
Inverse Fuzzy PIPRECIA
O4O3O2O1
DM1(1.4, 1.6, 1.65)(0.25, 0.286, 0.333)(1.2, 1.3, 1.35)(1, 1, 1.05)
DM2(1.2, 1.3, 1.35)(0.333, 0.4, 0.5)(1.1, 1.15, 1.2)(1.1, 1.15, 1.2)
DM3(1.3, 1.45, 1.5)(0.286, 0.333, 0.4)(1.2, 1.3, 1.35)(1.1, 1.15, 1.2)
AV(1.3, 1.45, 1.5)(0.29, 0.34, 0.411)(1.167, 1.25, 1.3)(1.067, 1.1, 1.15)
Table 6. Results of DEA model.
DEA-InputDEA-OutputDEA-Final
Bihać1.0001.0001.000
Novi Grad1.0001.0001.000
Prijedor1.0001.0001.000
Banja Luka0.9431.0611.125
Doboj1.0001.0001.000
Tuzla0.3872.5816.669
Zenica1.0001.0001.000
Sarajevo1.0001.0001.000
Mostar1.0001.0001.000
Table 7. A new initial decision matrix.
I1I2I3I4I5I6O1O2O3O4O5
DMU144.90045158,00071461711210
DMU244.22257158,095.371086110010
DMU352.50039474,285.978746210210
DMU5251.884134632,381.218254215251124
DMU7166.90011854,576830648721020
DMU8127.20036957,4201136859122021
DMU9133.4906844,0281133526502202
Table 8. Final results after applying the integrated Entropy-Fuzzy PIPRECIA-DEA model.
ResultsRank
Bihać0.4476
Novi Grad0.5105
Prijedor0.6012
Doboj0.4177
Zenica0.5634
Sarajevo0.5833
Mostar0.6871
Table 9. New values of criteria through 30 formed scenarios.
w1w2w3w4w5w6w7w8w9w10w11
S10.0780.1340.0780.0300.0640.1270.1180.1020.0730.1140.081
S20.0800.1370.0800.0310.0650.1300.1210.1040.0750.0940.083
S30.0820.1400.0820.0320.0670.1320.1240.1060.0770.0740.085
S40.0840.1430.0840.0330.0680.1350.1260.1090.0780.0540.086
S50.0860.1460.0860.0330.0700.1380.1290.1110.0800.0340.088
S60.0870.1490.0870.0340.0710.1410.1320.1130.0820.0130.090
S70.0780.1110.0780.0300.0640.1270.1180.1020.0730.1380.081
S80.0800.0910.0800.0310.0650.1290.1210.1040.0750.1410.083
S90.0820.0720.0820.0320.0670.1320.1230.1060.0760.1440.084
S100.0830.0520.0840.0320.0680.1350.1260.1080.0780.1470.086
S110.0850.0330.0850.0330.0700.1380.1280.1110.0800.1500.088
S120.0870.0130.0870.0340.0710.1410.1310.1130.0810.1530.090
S130.0780.1330.0780.0300.0640.1050.1180.1020.0730.1370.081
S140.0800.1360.0800.0310.0650.0870.1200.1040.0750.1400.082
S150.0810.1390.0820.0320.0670.0680.1230.1060.0760.1430.084
S160.0830.1420.0830.0320.0680.0500.1250.1080.0780.1460.086
S170.0850.1440.0850.0330.0690.0310.1280.1100.0790.1490.087
S180.0860.1470.0860.0340.0710.0120.1300.1120.0810.1520.089
S190.0780.1330.0780.0300.0640.1260.0980.1010.0730.1370.081
S200.0800.1360.0800.0310.0650.1290.0810.1030.0740.1400.082
S210.0810.1380.0810.0320.0660.1310.0640.1050.0760.1420.084
S220.0830.1410.0830.0320.0670.1330.0460.1070.0770.1450.085
S230.0840.1430.0840.0330.0690.1360.0290.1090.0790.1480.087
S240.0860.1460.0860.0330.0700.1380.0120.1110.0800.1500.088
S250.0780.1330.0780.0300.0640.1260.1170.0850.0730.1370.080
S260.0790.1350.0790.0310.0650.1280.1190.0700.0740.1390.082
S270.0800.1370.0800.0310.0660.1300.1210.0550.0750.1410.083
S280.0820.1390.0820.0320.0670.1320.1230.0400.0760.1430.084
S290.0830.1410.0830.0320.0680.1340.1250.0250.0780.1460.086
S300.0840.1440.0840.0330.0690.1360.1270.0100.0790.1480.087
Table 10. Results of sensitivity analysis—comparison with MCDM methods.
Proposed ModelMABACCoCoSo
Bihać666
Novi Grad555
Prijedor223
Doboj777
Zenica444
Sarajevo322
Mostar111