Article

Formation of Thermal Lesions in Tissue and Its Optimal Control during HIFU Scanning Therapy

1
School of Physics and Electronics, Hunan Normal University, Changsha 410081, China
2
School of Electronic Information and Electrical Engineering, Xiangnan University, Chenzhou 423000, China
3
School of Information and Engineering, Changsha Normal University, Changsha 410100, China
*
Author to whom correspondence should be addressed.
Symmetry 2020, 12(9), 1386; https://doi.org/10.3390/sym12091386
Submission received: 25 July 2020 / Revised: 13 August 2020 / Accepted: 17 August 2020 / Published: 19 August 2020
(This article belongs to the Special Issue Thermodynamics and Energy Conservation)

Abstract

:
A high intensity focused ultrasound (HIFU) scanning approach is needed to obtain multiple treatment spots for the ablation of large volume tumors, but it will bring some problems such as longer treatment times, the inhomogeneity of temperature and thermal lesions in tissues. Although some optimal control methods have been proposed, it is difficult to take into account the uniformity, efficiency and entirety of thermal lesions. In this study, based on the Helmholtz equation and Pennes’ bio-heat transfer equation, a coupled acoustic-thermal field model is proposed to investigate the relationship between temperature elevation, thermal lesions and neighboring treatment spots, and to analyze the effects of the heating time and acoustic intensity on thermal lesions by the finite element method (FEM). Consequently, optimal control schemes for the heating time and acoustic intensity based on the contribution from neighboring treatment spots to thermal lesions are put forward to reduce treatment times and improve the uniformity of temperature and thermal lesions. The simulation results show that the peak historical temperature elevation on one treatment spot is related to the number, distance and time interval of its neighboring treated spots, and the thermal diffusion from the neighboring untreated spots can slow down the drop of temperature elevation after irradiation, thus both of them affect the final shape of the thermal lesions. In addition, increasing the heating time or acoustic intensity of each treatment spot can expand the overall area of thermal lesions, but it would aggravate the elevation and nonuniformity of the temperature of the treatment region. Through optimizing the heating time, the total treatment time can be reduced from 249 s by 17.4%, and the mean and variance of the peak historical temperature elevation can decrease from 44.64 °C by 13.3% and decrease from 24.6317 by 45%, respectively. While optimizing the acoustic intensity, the total treatment time remains unchanged, and the mean of the peak historical temperature elevation is reduced by 4.3 °C. Under the condition of the same thermal lesions, the optimized schemes can reduce the treatment time, lower the peak of the temperature on treatment spots, and homogenize the temperature distributions. This work is of practical significance for the optimization of a HIFU scanning therapy regimen and the evaluation of its treatment effect.

1. Introduction

High intensity focused ultrasound (HIFU), as a noninvasive method of tumor hyperthermia, has been widely used for treating various solid tumors in the past two decades, such as primary or metastatic liver, lung, breast, prostate, and malignant kidney tumors [1,2,3,4,5]. When large volume tumors are ablated, an ultrasound phased array with electronic scanning or a single source with mechanical scanning is needed to produce multiple treatment spots which are independent or overlapping of each other over the treatment region. The ultrasound phased array has the advantages of a short treatment time, multi-focus, and no mechanical movement, but it is still in the stage of experimental research on the prototype and rare applied in commercial HIFU systems [6,7]. On the contrary, mechanical scanning has been widely used in clinical treatment for various tumors, where after one treatment spot is heated for a period of time, the next treatment spot would be irradiated by moving the HIFU-sourced transducer or the biological tissue at a certain step size until all treatment spots are treated [8,9,10].
During HIFU mechanical scanning therapy, the size of lesions around each treatment spot will gradually become nonuniform with the progress of HIFU therapy because of the influence of thermal diffusion from the neighboring treatment spots, which may cause insufficient treatment around some treatment spots and over-treatment around other treatment spots [11,12]. Several optimal control approaches have been investigated to obtain the desired temperatures and thermal responses in tissues. Comparing the influences of three scanning pathways (raster line scanning, spiral scanning from the center to the outside and spiral scanning from the outside to the center) on the overall thermal lesions under the same dose parameters, Zhou et al. proved that spiral scanning from the center to outside can achieve lesions with better uniformity while minimizing the total delivered energy and treatment time by simulations and experiments [8]. Malien et al. proposed a direct global optimization method where the phases and amplitudes of the transducers are controlled as a function of time to obtain the desired thermal dose distribution in 2004 [13]. One year later, they developed an optimization algorithm for scanning paths and evaluated it with numerical simulations in 3D, based on the minimum time formulation of the optimal control theory; their simulation results showed that the treatment time and the total applied energy can be decreased from 16% to 43% as compared with standard sonication where treatment is started from the outermost focus and then the target volume is scanned according to the decreasing order of treatment spots [14]. Similarly, an unequal heating duration method was tested to be effective in reducing the treatment time by more than 50% compared with the conventional method, and the target necrosis rate was more than 97%, while the nontarget necrosis rate is less than 0.7% [15]. Dhiraj Arora et al. developed a feedback thermal dose controller that can minimize the delivery time of the desired thermal dose to the target without violating safety constraints [16]. However, the influence of neighboring treatment spots on the temperature elevation and thermal lesions is still unclear. In addition, the optimal effect is evaluated from only one or two aspects in the above studies, such as the treatment time, energy, the area and uniformity of lesions, etc. As far as we know, other parameters such as temperature and its uniformity had rarely been considered, and almost no optimal control method can consider multiple parameters (treatment time, temperature and its uniformity, the areas of lesions inside and outside the target treatment region, etc.) to evaluate the optimal effect at the same time, thus it is difficult to produce uniform, effective and entire thermal lesions with the available optimal control methods.
In this paper, the Helmholtz equation and bio-heat transfer equation are combined in a coupled acoustic-thermal field model to investigate the temperature elevation and thermal lesions formation along a spiral pathway by the finite element method (FEM). We analyze the influences of neighboring treatment spots, the heating time and acoustic intensity on the temperature elevation and thermal lesions, and put forward optimal control schemes to dynamically compensate the heating time or acoustic intensity according to the contribution of thermal diffusion from neighboring treatment spots, and the parameters of treatment time, temperature and its uniformity, the areas of lesions inside and outside of the target treatment region are used to evaluate the optimal effect. The purpose of this study is to reveal the influence of neighboring treatment spots on the temperature elevation and thermal lesions during HIFU scanning therapy, and to produce uniform thermal lesions by shorter treatment times and lower the peak of temperature based on the optimization of the heating time or acoustic intensity, which can provide a reference for the optimization of HIFU scanning therapy regimens and the evaluation of the treatment effect.

2. Theory and Methods

2.1. Description of Acoustic Fields and Temperature Fields

In HIFU therapy, the differences in the intensity distributions and temperature elevation resulting from nonlinearities are very small, so it is practical to calculate the acoustic fields and temperature fields by linear models [17,18]. Since the HIFU transducer is axisymmetric, the acoustic pressure p can be described with the Helmholtz equation in 2D cylindrical coordinates [19,20], which is shown below:
r [ r ρ c ( p r ) ] + r z [ 1 ρ c ( p z ) ] [ ( ω c c ) 2 ] r p ρ c = 0
where r and z are the radial and axial coordinates; ω is the angular frequency; c c = ω / k i and ρ c = ρ c 2 / c c 2 ; ρ and c are the density and acoustic velocity in the medium without acoustic attenuation, respectively; k i is the complex wave number.
The temperature elevation in biological tissue induced by ultrasound can be calculated by the bio-heat transfer equation (BHTE) developed by Pennes [20,21]:
ρ C T t = ( κ T ) + W b C b ( T a T ) + Q p + Q m
where ρ is the tissue density; C and C b are the specific heat capacity of the tissue and blood; T and T a are the temperature in the tissue and blood, respectively; κ is the thermal conductivity; W b is the blood perfusion rate; Q p is the absorbed ultrasound energy, and Q m is the metabolic rate. In fact, during HIFU therapy, the time of tissue necrosis caused by ultrasound irradiation is short so we can ignore the terms of the blood perfusion rate and metabolic heat production. Assuming that the acoustic attenuation coefficient is equivalent to the absorption coefficient ( α ) and the acoustic intensity is I , the heat induced by the absorbed ultrasound can be expressed as follows [22,23]:
Q P = 2 · α ·   I = α | p | 2 ρ c c c
If the thermal damage rate is simulated as a temperature-dependent process, the possibility of denaturation depends on energy deposition in tissue. When the energy deposition reaches the threshold (the activation energy E), lesions would occur. According to the Arrhenius equation, the thermal damage rate can be illustrated as [24]
d Ω d t = A · e x p [   E R T ( t )   ]
where A is the frequency factor, representing the number of molecular collisions per unit time. E is the activation energy; R is the universal gas constant; T ( t ) is the absolute temperature of tissue at moment t [25]. The thermal damage degree ( Ω ) of the tissue at t can be given by integrating the thermal damage rate with the time of heating as follows [26]:
Ω = A t 0 t e x p [ E R T ( t ) ] d τ
where the thermal damage will be considered as irreversible when Ω equals 1.

2.2. Parameters for Evaluating the Treatment Effect

Usually, the treatment time, temperature and its uniformity, and the size of thermal lesions are used as the main parameters to evaluate the safety and efficiency during HIFU scanning therapy. The total treatment time t T is expressed as
  t T = n = 1 N t n + i = 1 N 1 t i
where t n is the heating time of the nth treatment spot; t i is the time to move from treatment spot ith to the neighboring next (i + 1)th; N is the total number of treatment spots. It is obvious that the smaller the value of t T , the shorter the treatment time, and the higher the consequent treatment efficiency.
During the process of HIFU scanning therapy, the temperature varies with the positions on the treatment region, and changes with time. The temperature of the current treatment spot rises during the time it is irradiated by HIFU, and then drops slowly after the irradiation. There is a maximum value of temperature elevation during this process, which is called the peak historical temperature elevation. The mean ( m p T ) and variance ( S p T 2 ) of the peak historical temperature elevation on all treatment spots are calculated as follows:
  m p T = 1 N · n = 1 N T p n
S p T 2 = 1 N · n = 1 N ( T p n m p T ) 2
where T p n represents the peak historical temperature elevation of the nth treatment spot, m p T and S p T 2 reflect the temperature level and uniformity of the treatment region, respectively.
Assuming S T is the area of the target treatment region,   S A T and S A H are the areas of lesions inside and outside of the target treatment region, respectively. The deviation area of thermal lesions S D   is defined as
S D = ( S T S A T ) + S A H
S D is the sum of the undamaged area inside the target treatment region and the area of lesions outside of the target treatment region. Apparently, a good treatment effect requires that the target area is denatured to the greatest extent without damaging the surrounding healthy tissues, which is expected to maximize the value of S A T and minimize the value of S A H . The smaller the value of S D is, the more uniform the thermal lesions, and the better the treatment effect.

2.3. Optimal Control for Formation of Thermal Lesions

During the process of HIFU scanning therapy, the temperature elevation and thermal lesions are both affected by the number, time interval of heating and distance of neighboring treatment spots. The contribution (marked as C N ) of neighboring treatment spots to thermal lesions around the current treatment spot, can be expressed as a function related to its number, time interval and distance of neighboring treatment spots:
C N = 1 M 1 f b 1 t N j · d s s N j + 1 M 2 f a · d s s N k
here, M 1 is the number of neighboring treated spots; M 2 is the number of neighboring untreated spots;   M 1 + M 2 is the total number of neighboring treatment spots; d s is moving step from one treatment spot to next; t N j and s N j are the interval times of heating and distance between the current spot and the jth neighboring treated spot, respectively; s N k is the distance between the current spot and the kth neighboring untreated spot. The ratio of s N j or s N k to d s can only have the value of 1 or 2 when only eight neighboring treatment spots are considered. f b and f a are the influence coefficients of the neighboring treated and untreated spots, respectively.
In Equation (10), the contribution value C N is composed of two parts: the untreated spots and treated spots, which can reflect the influence of the thermal diffusion from neighboring treatment spots on the temperature elevation and thermal lesions of the current treatment spot. M 1 + M 2 , t N j , s N j and s N k for each treatment spot are different, which certainly results in different contribution values. Under the condition of fixed heating time and acoustic intensity, the contribution value C N is positively related to the temperature elevation and thermal lesions, and the heterogeneity of the temperature elevation and thermal lesions caused by thermal diffusion are presented as the difference in the contribution value C N for each treatment spot. Moreover, the heating time and acoustic intensity are also positively correlated with the temperature elevation and thermal lesions. Therefore, it is necessary to adjust the heating time or acoustic intensity dynamically for each treatment spot according to the contribution value C N , so as to offset the influence of thermal diffusion from neighboring treatment spots, to shorten the treatment time and to obtain a better uniformity of temperature elevation and thermal lesions. The dynamic compensation weight W is defined as:
W = W B C N
here, W B is the basic weight, and the actual adjusted heating time or acoustic intensity of each treatment spot should be
I t n = ( 1 + | W | · W W B ) · I t 0
where I t 0 is the base value for optimization, which is equal to t s or I s . If the treatment spot is greatly affected by the thermal diffusion from neighboring treatment spots, the contribution value C N would become larger, and the dynamic compensation weight obtained from Equation (11) would be very small and may even be negative (in the range of −0.25 to 0.34), thus the actual adjusted heating time or acoustic intensity calculated by Equation (12) is relatively small, which can offset the tissue damage caused by the influence of thermal diffusion from neighboring treatment spots through reducing the heating time or acoustic intensity. On the contrary, if the contribution value C N is very small, it can make up for the lack of thermal lesions by increasing the heating time or acoustic intensity, so as to make the temperature elevation and thermal lesions more uniform on the treatment region.

2.4. Simulation Methods and Relevant Conditions

In this study, irradiations are performed using a concave-focused HIFU transducer (PRO2008, Pro hitu, Shenzhen, China) with an insonation frequency of 1.391 MHz, a focal length of 16 cm and an aperture of 14 cm, where a hole (5 cm in diameter) is drilled in the middle to facilitate the installation of a B-mode ultrasound probe [27,28]. A block of tissue which has a 10 mm × 10 mm cross section and is 6 mm in depth is placed directly below the transducer (where the center part has a 9 mm × 9 mm cross section which is the target treatment region and the rest of the surrounding parts are considered be healthy tissue and should not be treated). Both the transducer and tissue are immersed in water. The initial temperature of water and tissue is set to be 37 °C, and their properties, as shown in Table 1, are assumed to be static [21].
In this study, a spiral pathway from the center to the outside is employed as shown in Figure 1, where the numbers indicate the order of heating for each treatment spot; the moving step d s from one treatment spot to next is 2 mm [8,15]. After a treatment spot is heated for a certain period of time ( t n ), the next treatment spot would be treated according to the arrows until all treatment spots are treated. To simplify the model, the scanning is performed only on a single layer and the movement time from one treatment spot to another is fixed to 1 s. For this study, the entire simulation process by the FEM includes the following steps [27,29]. Firstly, the distributions of the acoustic pressure and intensity are calculated based on the acoustic wave equation (Equation (1)). Then, the fixed or optimized heating time and acoustic intensity, calculated by Equations (10)–(12), are employed as the input of bio-heat transfer to simulate temperature distributions using Equations (2) and (3). Meanwhile, the Arrhenius equation (Equations (4) and (5)) is used to quantify the thermal damage in tissue. Finally, the parameters for evaluating the treatment effect are obtained according to the temperature and thermal lesions that have been calculated. In order to speed up the simulation with the appropriate accuracy, the spatial grids and time step for simulations are set to 0.05 mm and 0.2 s, respectively.

3. Results and Discussion

3.1. Influence of Neighboring Treatment Spots on the Temperature Elevation

Figure 2 indicates the distributions of the acoustic intensity I s on the focal plane (a plane that is perpendicular to the axis of the HIFU and passes though the acoustic focus) when treatment spot No. 1 is irradiated by the HIFU, where the maximum value is located in the center of the focal region, and those greater than 106 W/m2 are basically confined to a circular area with a radius of 1 mm in the center of the focal region. When HIFU scanning therapy is performed, the fixed or optimized acoustic intensity shifts geometrically along the path shown in Figure 1 on the focal plane.
When the heating time t n for every treatment spot is fixed as t s = 5   s , the curve of temperature elevation with time on four different treatment spots (No. 1, No. 5, No. 13 and No. 19) is shown in Figure 3, in which the temperature elevation is affected by the neighboring treatment spots distinguished by different colors (red and black). During the heating period of every treatment spot, the curve segment is very sharp, which means that the temperature rises rapidly within a short time; during the subsequent cooling period, the curve tends to be flat, showing a relatively long cooling process. In comparison, the historical peaks and curves of temperature elevation on the four treatment spots are basically the same without the influence of neighboring treatment spots, while considering the influence of thermal diffusion, the peaks of the historical temperature elevation on the four treatment spots are different, which are 26.25, 35.25, 31.62 and 34.68 °C, respectively. In Table 2, s N and t N are the interval times of the heating and distance between the current spot and its neighboring spots, where it can be seen that there is no neighboring treated spot around treatment spot No. 1, thereby the peak historical temperature elevation is the minimum, equal to what it would be without the influence of thermal diffusion, and the curves of temperature elevation are coincident during the first 11 s. There are two neighboring treated spots around treatment spot No. 5, at a corresponding s N of 2   mm and 2 2   mm . The temperature elevation curves of treatment spot No. 5 approximates the superposition of three curve segments (affected by No. 1 from 0 s to 5 s, affected by No. 2 and No. 3 from 6 s to 17 s, and affected by No. 4 from 18 s to 24 s), and the temperature rises by 8.88 °C at 24 s. The M 1 and s N of treatment spot No. 13 are the same as those of No. 5, but one of its neighboring treated spots has a longer interval time (55 s) than that corresponding to treatment spot No. 5 (19 s), so its peak historical temperature elevation is lower than that of treatment spot No. 5. In contrast, there are four neighboring treated spots around treatment spot No. 19, which are No. 5, No. 7, No. 6 and No. 18, respectively, where the t N of the first two spots are 79 s and 67 s, and their s N is 2 2   mm , while those of the latter two spots are 73 s, 1 s and 2 mm, respectively. Treatment spot No. 19 has the greatest number of neighboring treated spots, but it corresponds to the longest interval time, which results in the decrease in the peak historical temperature elevation. Therefore, the peak historical temperature elevation on one treatment spot is positively correlated with the number of its neighboring treated spots, but is negatively correlated with the distance and interval time of them.
The temperature elevation on treatment spot No. 1 declines slowly after 11 s, but it then shows a slight increase from 24 s to 52 s, and reaches another peak at 52 s (22.75 °C) due to the thermal diffusion from the subsequent neighboring treatment spots. After that, the curve slopes smoothly downward and the temperature elevation falls to 12.1 °C at 149 s when all treatment spots are treated, which is higher than those on the other three treatment spots at the same time. For treatment spot No. 5, due to the continuous influence of thermal diffusion from neighboring untreated spots (No. 6, No. 15, No. 16, No. 17, No. 18 and No. 19), the temperature elevation reaches another peak (19.78 °C) during the heating period of treatment spot No. 19 (111 s). For treatment spots No. 13 and No. 19, because there is only one neighboring untreated spot, and the t N is short enough (1 s), their temperature elevation decreases continuous after being irradiated by the HIFU, which is higher than it would be without the influence of thermal diffusion. Obviously, the decrease in the temperature elevation depends on the neighboring untreated spots, that is, the higher the number of neighboring treatment spots, the lower the decline rate. If the interval time is long enough, the temperature may even rise.

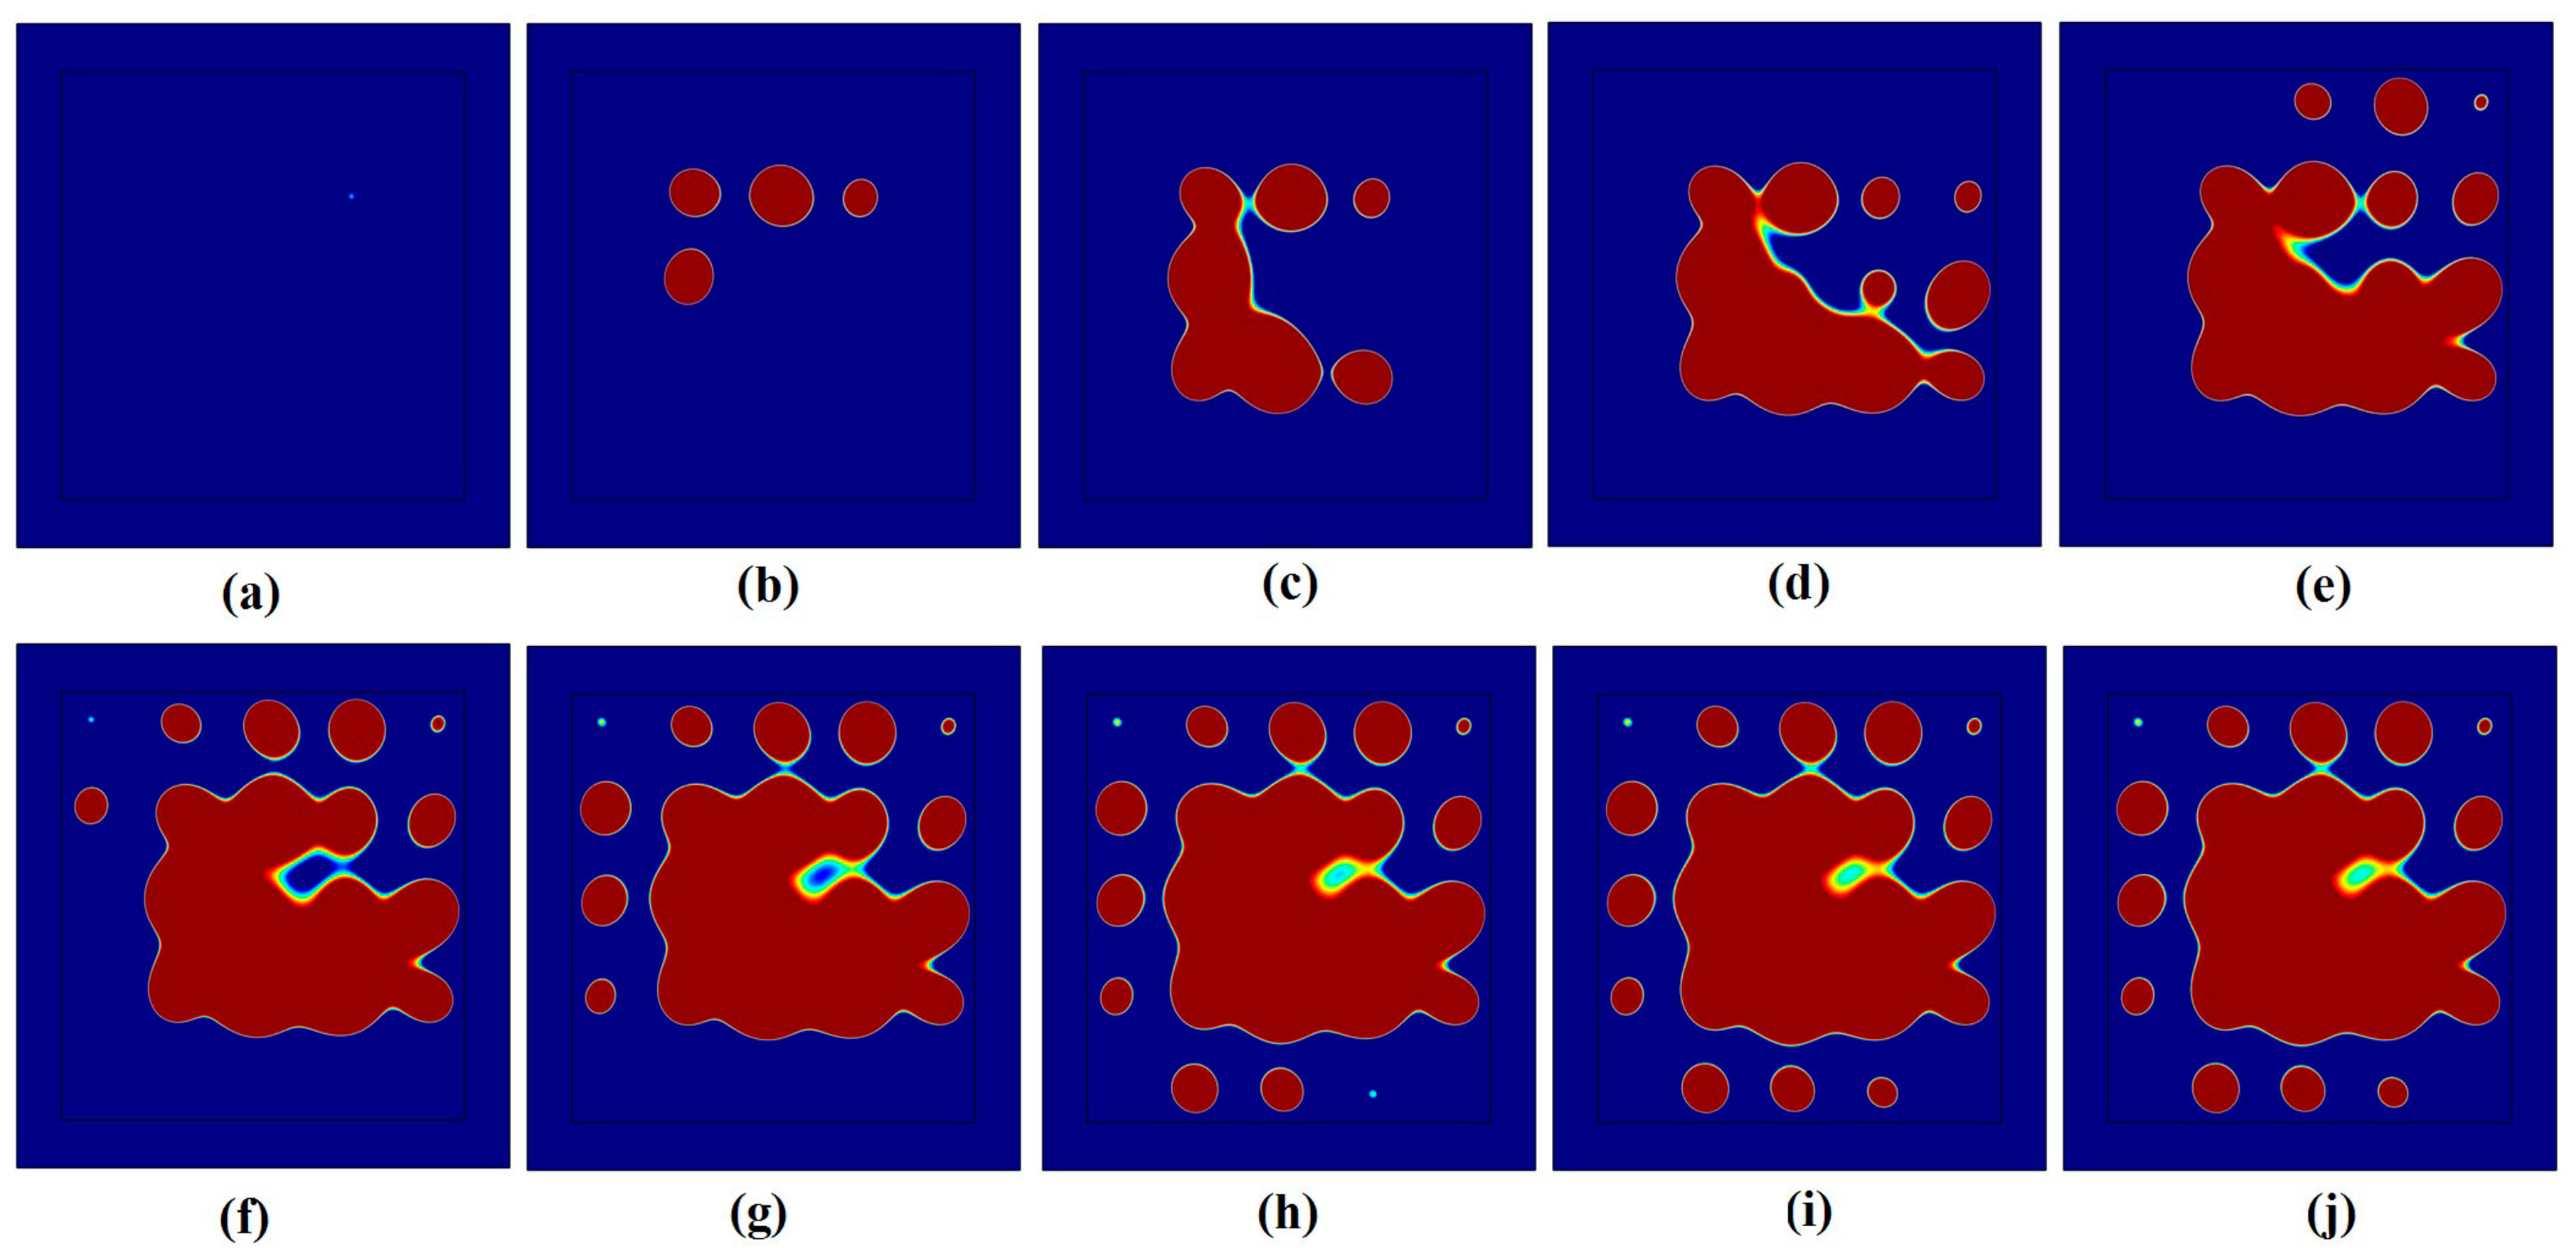
3.2. Influence of Neighboring Treatment Spots on the Formation of Thermal Lesions

Assuming the heating time t n and acoustic intensity I n remain unchanged and the treatment is administered along the spiral pathway represented in Figure 1, the thermal lesions on the focal plane at different times are shown in Figure 4. Apparently, the sequence of thermal lesions occurring is not consistent with the sequence of scanning. For example, there are almost no thermal lesions formed around the first three treatment spots at the completion of heating on treatment spot No. 3 (17 s), whereas it can be seen that the thermal lesions around treatment spot No. 3 occur after 17 s by comparing Figure 4a,b, and that the thermal lesions around treatment spot No. 2 occur after 53 s by comparing Figure 4c,d. Consequently, the thermal lesions on treatment spot No. 5, No. 6, No. 7 and No. 8 are firstly connected to form a closed area, which gradually expands to other treatment spots with the process of scanning. Figure 4j shows the thermal lesions when the tissue is cooled for 10 s after the completion of heating on all treatment spots. Evidently, the thermal lesions around each treatment spot are different, although the same heating time and acoustic intensity are provided. In Figure 4j, the thermal lesions around 11 treatment spots heated earlier (No. 1–No. 11) are connected with each other to form a closed area; among the rest of the 14 treatment spots (No. 12–No. 25), 12 cases of them have different-sized isolated thermal lesions which are nearly round and extend towards the middle of the angle between the former treated spot and the neighboring inner treatment spot. Compared with other treatment spots, thermal lesions around the two treatment spots in the top corner (No. 13 and No. 17) are smaller in size, and there are even no thermal lesions around the spots in the bottom corners (No. 21 and No. 25). For the middle three isolated spots in the same direction, the treatment spots treated early has larger thermal lesions than the ones treated later. For instance, the thermal lesion around treatment spot No. 14 is larger than that around treatment spot No. 15, both of which are larger than that around treatment spot No. 16. Furthermore, compared with Figure 3, it is found that the formation of thermal lesions is related to the peak historical temperature elevation of the treatment spots. In general, the higher the temperature elevation is, the greater the thermal lesions in size. However, the formation of thermal lesions is not completely determined by the peak historical temperature elevation—it also depends on the cumulative effects of the temperature on the heating time. In fact, for treatment spot No. 1, although the corresponding peak historical temperature elevation is the smallest, higher temperatures still last for a long period of time after the completion of heating on this spot due to the thermal diffusion from multiple neighboring untreated spots, which inevitably leads to the formation of thermal lesions. The neighboring untreated spots could not decide the peak historical temperature elevation, but they can affect the final degree of thermal lesions. It can be said that the thermal lesions are the product of HIFU irradiation and thermal diffusion from neighboring treatment spots during the process of scanning therapy.

3.3. Influence of the Heating Time and Acoustic Intensity on Thermal Lesions

The thermal lesions on the focal plane are shown in Figure 5 and Figure 6 when the heating time and acoustic intensity increase to 1.2, 1.4, 1.6 and 1.8 times their reference values ( t s , I s ), respectively. The size of the thermal lesions on the treatment region increases with the heating time and acoustic intensity, and finally the thermal lesions on all treatment spots connect each other to form a complete closed-lesion region. When the heating time reaches 1.6 t s or the acoustic intensity reaches 1.4 I s , the thermal lesions appear outside of the target treatment region and result in an obvious over-treatment. The edge of the closed-lesion region is in a pattern of wavy lines. An intact concave cold area is formed between the thermal lesions around two adjacent treatment spots, and the larger the cold area is, the more irregular the lesion shape is. Additionally, the size of the cold areas formed from the treatment spots treated earlier is smaller than the size of those treated later considering the same heating time and acoustic intensity, and the cold area will become smaller in size by increasing the heating time or acoustic intensity. Comparing Figure 5 and Figure 6, it is found that at the same rate of increase, the effect of the acoustic intensity on thermal lesions is greater than that of the heating time, and the corresponding cold area is also smaller. The size of the thermal lesions formed at an acoustic intensity of 1.4 I s approximates that at a heating time of 1.8 t s , and yet, when the acoustic intensity increases to 1.8 I s , almost all the tissues inside the target region are denatured, but the lesions outside of the target region are very large in size.
The influence of a different heating time and acoustic intensity on the parameters for evaluating the treatment effect is listed in Table 3, where the mean ( m p T ) and variance ( S p T 2 ) of the peak historical temperature elevation, and the lesion area inside ( S A T ) and outside ( S A H ) the target treatment region tend to increase significantly with the increase in the heating time and acoustic intensity; thereafter, the tumors inside the target treatment region are treated effectively, but the healthy tissue outside of the target treatment region is damaged. By comparison, given the same increase-rate, the influence of the acoustic intensity on the treatment effect is greater than that of the heating time. In particular, the increment of m p T and S p T 2 are about 7 °C and 5 by changing the acoustic intensity, which are larger than those (2 °C and 4, respectively) by changing the heating time. The value of S A T at a heating time of 1.8 t s is close to that of S A T with an acoustic intensity of 1.4 I s , and the former has a smaller m p T and S p T 2 , but the total heating time is 100 s longer than that of the latter, indicating a lower treatment efficiency. After all, under the condition of a fixed heating time and acoustic intensity, the heating time, acoustic intensity, mean and variance of the temperature elevation positively correlated with the thermal lesions, while it is impossible to consider a low temperature, good temperature uniformity and thermal lesions with a high effect at the same time.

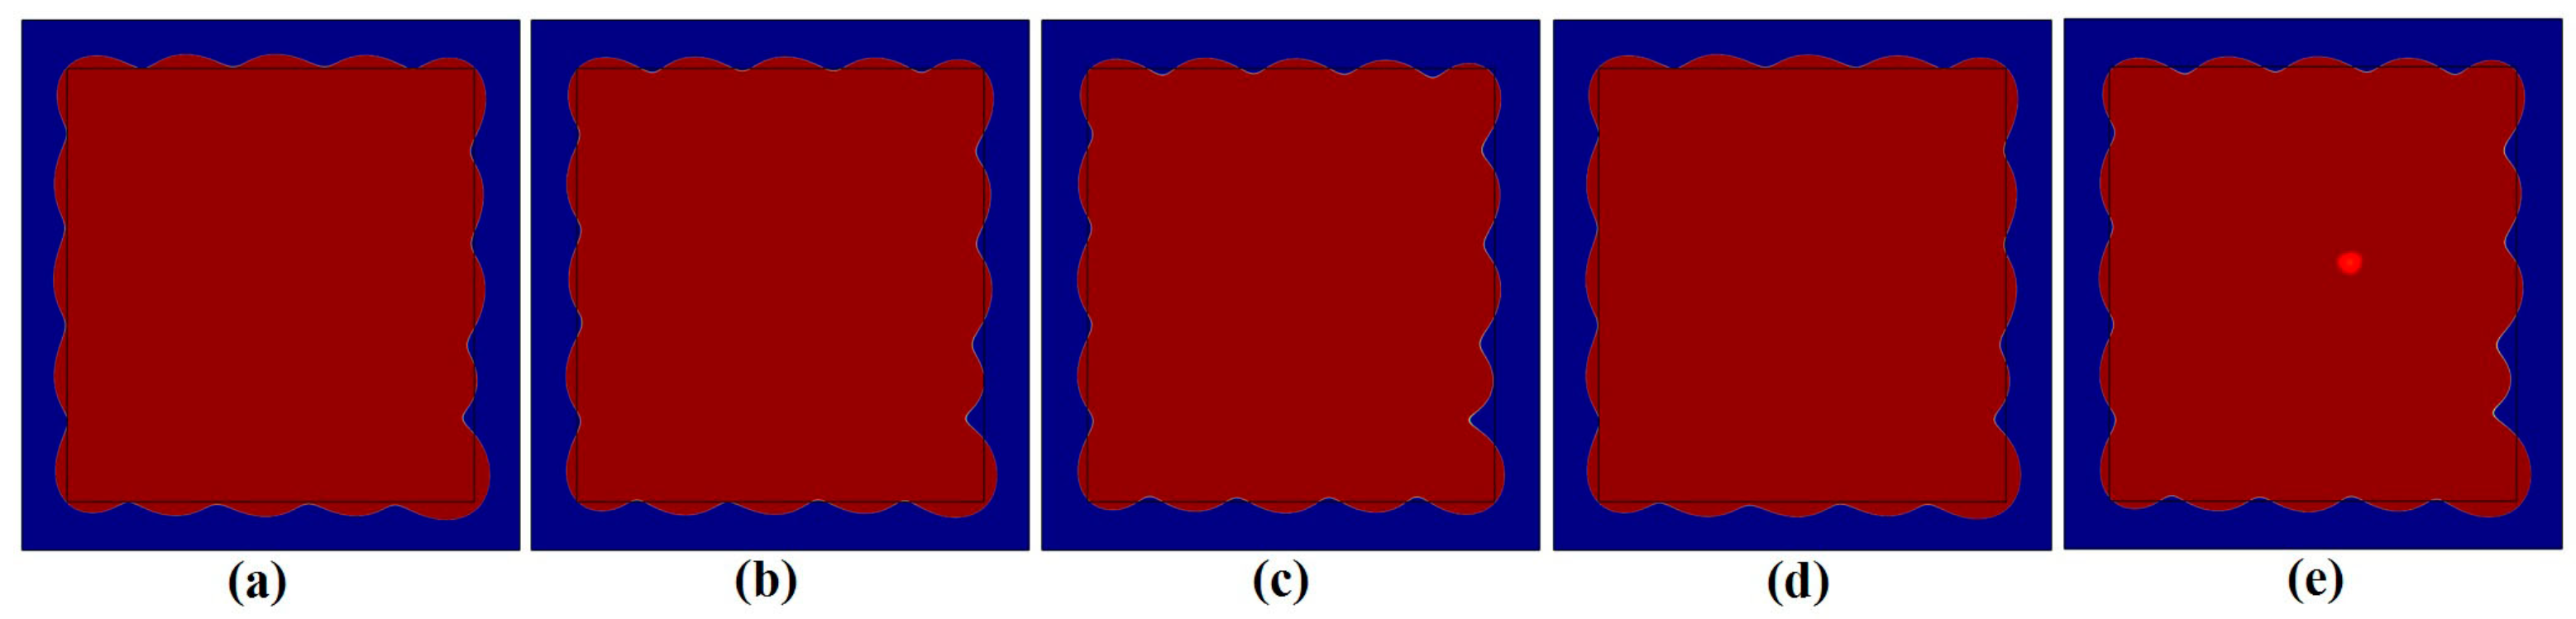
3.4. Optimal Control for the Formation of Thermal Lesions

Figure 7 and Figure 8 present the thermal lesions on the focal plane under an optimized heating time and acoustic intensity, where the influence coefficients f b and f a are 0.7, 0.8, 0.9 and 0.4, 0.5, 0.6, respectively. When the influence coefficients are the same, the size of thermal lesions under an optimized acoustic intensity is larger than that under an optimized heating time, however, the size of the cold area at the edge of the thermal lesions becomes smaller. There is a gradual decline in the size of tissue lesions with the increase in f b and f a . When f b = 0.8 and f a = 0.6, part of the tissue inside the target treatment region remains intact due to an insufficient treatment, as shown in Figure 7e and Figure 8e. It can be seen from Equation (6) that if the values of f b and f a are too large, the contribution value C N of the neighboring treatment spots is considered to be increased, and the actual heating time or acoustic intensity applied to the treatment spot would be reduced, leading to an insufficient treatment in Figure 7e and Figure 8e.
The influence of different values of f b and f a on the parameters for evaluating the treatment effect under an optimized heating time and acoustic intensity, shown in Table 4 and Table 5, respectively. It can be seen clearly that the larger the values of f b and f a , the smaller the values of m p T , S p T 2 , S A T and S A H . Compared with Table 4 and Table 5, the optimized acoustic intensity can ensure a relatively shorter t T (149 s, at least 38.2 s less than that under optimized heating time) and larger S A T (more than 98.4% of the target treatment region), but the values of m p T and S p T 2 are at least 4.988 °C and 41.999 higher than those under an optimized heating time. Similarly, the corresponding S A H is at least 2.042 mm2 larger than that under an optimized heating time. When f b = 0.7 and f a = 0.5 or f b = 0.8 and f a = 0.6, the value of S p T 2 is over 100, which implies a poor temperature uniformity during the treatment process. The deviation area of thermal lesions ( S D ) can be calculated according to Equation (9) in Table 4, and its minimum is 4.2339 mm2 at f b = 0.8 and f a = 0.4, which are regarded as the best optimization cases for the heating time. Compared with the data in Table 3 at an approximate total heating time (1.4 t s ), the values of m p T and S p T 2 after optimization are reduced by 1.86 °C and 2.6921, respectively, and S A T increases by 4.913 mm2, but S A H only increases slightly (0.9439 mm2). In the case of the approximate S A T values (1.6 t s ) in Figure 4, t T , m p T and S p T 2 after optimization are reduced by 18.4 s, 4.064 °C and 6.7136, respectively; after all, compared with the case of the fixed heating time 1.8 t s , the value of S D almost remains unchanged, but t T ,     m p T and S p T 2 are reduced by 17.4%, 13.3% and 45%, respectively. In Table 5, when f b = 0.9 and f a = 0.5, the value of S D reaches rock bottom (4.4562 mm2), which is regard as the best optimization case for the acoustic intensity. Compared with the case of a fixed acoustic intensity 1.4 I s in Table 3, the value of S A T in the optimization case is basically the same, and the value of m p T decreases by 4.3 °C, but S p T 2 increases by 44.515. Obviously, compared with the cases with a fixed acoustic intensity, the scheme of the optimized acoustic intensity provides the same total heating time, and can reduce the temperature elevation of the treatment region, but it also results in a greater reduction in the temperature uniformity. In comparison, the optimized heating time is conducive to reducing the temperature elevation and improving the temperature uniformity of the treatment region, while the optimized acoustic intensity can save more treatment time and produce larger tissue lesions.

4. Conclusions

This paper focuses on the formation of thermal lesions and its optimal control during HIFU scanning therapy. A coupled acoustic and thermal model is established to reveal the influences of the neighboring treatment spots on the temperature elevation and thermal lesions, and optimal control schemes for the heating time and acoustic intensity based on the contribution of neighboring treatment spots are proposed. The simulation results indicate that the peak historical temperature elevation is related to the neighboring treated spots, and thermal lesions are considered as the combined effects of HIFU irradiation and thermal diffusion from all neighboring treatment spots. In addition, the uniformity of temperature tends to get worse with the increase in the heating time and acoustic intensity. Under the condition of the same resultant thermal lesions, the total treatment time with an optimized heating time is reduced from 249 s by 17.4%, and the mean and variance of the peak historical temperature elevation are reduced from 44.64 °C by about 13.3% and decrease from 24.6317 by 45%, respectively; while, by optimizing the acoustic intensity, the total treatment time is shorter and unchanged, and the mean value of the peak historical temperature elevation is reduced by 4.3 °C, but the corresponding variance increases greatly. The optimized schemes can lower the peak of temperature, reduce the treatment time and improve temperature uniformity, which are conducive to the need to produce uniform, efficient, and entire thermal lesions. The optimization schemes for the heating time and acoustic intensity have their own advantages, and the integration of these two schemes would be able to achieve a better treatment effect. Additionally, due to the complexity of the model and calculation, the simulation in this paper is limited to single layer treatment without consideration for the dynamic changes of tissue properties with temperature. The results of this study provide guidance for improving the safety and efficiency of HIFU scanning therapy.

Author Contributions

S.Q. and X.Z. conceived and designed the research idea and framework; X.Z. and Q.T. performed the simulations; X.Z. and H.D. analyzed the data and wrote the manuscript. S.Q. modified the paper. All authors have read and agreed to the published version of the manuscript.

Funding

This study was supported by National Natural Science Foundation of China (No.11774088, 11474090, 61502164), Hunan Provincial Natural Science Foundation of China (No. 2016JJ3090, No.2018JJ3557) and the Science Research Program of Education Department of Hunan Province (No.16B155).

Conflicts of Interest

The authors declare no conflict of interest.

References

  1. Illing, R.O.; Kennedy, J.E.; Wu, F.; Ter Haar, G.R.; Protheroe, A.S.; Friend, P.J.; Gleeson, F.V.; Cranston, D.W.; Phillips, R.R.; Middleton, M.R. The safety and feasibility of extracorporeal high-intensity focused ultrasound(HIFU) for the treatment of liver and kidney tumours in a Western population. Brit. J. Cancer 2005, 93, 890–895. [Google Scholar] [CrossRef] [PubMed] [Green Version]
  2. Leslie, T.; Ritchie, R.; Illing, R.O.; Ter Haar, G.R.; Phillips, R.; Middleton, M.; Bch, B.M.; Wu, F.; Cranstonet, D. High-intensity focused ultrasound treatment of liver tumours: Post-treatment MRI correlates well with intra-operative estimates of treatment volume. Brit. J. Radiol. 2012, 85, 1363–1370. [Google Scholar] [CrossRef] [PubMed] [Green Version]
  3. Wu, F.; Chen, W.Z.; Bai, J.; Zou, J.Z.; Wang, Z.L.; Zhu, H.; Wang, Z.B. Tumor vessel destruction resulting from high-intensity focused ultrasound in patients with solid malignancies. Ultrasound Med. Biol. 2002, 28, 535–542. [Google Scholar] [CrossRef]
  4. Haar, G.T.; Coussios, C. High intensity focused ultrasound: Past, present and future. Int. J. Hyperther. 2007, 23, 85–87. [Google Scholar] [CrossRef] [Green Version]
  5. Kennedy, J.E. High-intensity focused ultrasound in the treatment of solid tumors. Nat. Rev. Cancer 2005, 5, 321–327. [Google Scholar] [CrossRef]
  6. Botros, Y.Y.; Ebbini, E.S.; Volakis, J.L. Two-step hybrid virtual array ray (VAR) technique for focusing through the rib cage. IEEE. T. Ultrason. Ferr. 1998, 45, 989–1000. [Google Scholar] [CrossRef]
  7. White, J.; Clement, G.T.; Hynynen, K. Transcranial ultrasound focus reconstruction with phase and amplitude correction. IEEE. T. Ultrason. Ferr. 2005, 52, 1518–1522. [Google Scholar] [CrossRef]
  8. Zhou, Y.; Kargl, S.G.; Hwang, J.H. The effect of the scanning pathway in High-Intensity Focused Ultrasound therapy on lesion production. Ultrasound Med. Biol. 2011, 37, 1457–1468. [Google Scholar] [CrossRef]
  9. Haar, G.T. Ultrasound focal beam surgery. Ultrasound Med. Biol. 1995, 21, 1089–1100. [Google Scholar] [CrossRef]
  10. Wu, F.; Wang, Z.B.; Chen, W.Z.; Zou, J.Z.; Bai, J.; Zhu, H.; Li, K.Q.; Xie, F.L.; Jin, C.B.; Su, H.B.; et al. Extracorporeal focused ultrasound surgery for treatment of human solid carcinomas: Early Chinese clinical experience. Ultrasound Med. Biol. 2004, 30, 245–260. [Google Scholar] [CrossRef]
  11. Curiel, L.; Chavrier, F.; Gignoux, B.; Pichardo, S.; Chesnais, S.; Chapelon, J.Y. Experimental evaluation of lesion prediction modelling in the presence of cavitation bubbles: Intended for high-intensity focused ultrasound prostate treatment. Med. Biol. Eng. Comput. 2004, 42, 44–54. [Google Scholar] [CrossRef] [PubMed]
  12. Damianou, C.; Hynynen, K. Focal spacing and near-field heating during pulsed high temperature ultrasound therapy. Ultrasound Med. Biol. 1993, 19, 777–787. [Google Scholar] [CrossRef]
  13. Malinen, M.; Huttunen, T.; Hynynen, K.; Kaipio, J.P. Simulation study for thermal dose optimization in ultrasound surgery of the breast. Med. Phys. 2004, 31, 1296–1307. [Google Scholar] [CrossRef] [PubMed]
  14. Malinen, M.; Huttunen, T.; Kaipio, J.P.; Hynynen, K. Scanning path optimization for ultrasound surgery. Phys. Med. Biol. 2005, 50, 3473–3490. [Google Scholar] [CrossRef] [PubMed] [Green Version]
  15. Luo, H.; Shen, G.; Chen, Y. Treatment planning of scanning time and path for phased High-Intensity Focused Ultrasound surgery. In Proceedings of the 2009 IEEE 2nd International Conference on Biomedical Engineering and Informatics, Tianjin, China, 17–19 October 2009. [Google Scholar]
  16. Arora, D.; Cooley, D.; Perry, T.; Skliar, M.; Roemer, R.B. Direct thermal dose control of constrained focused ultrasound treatments: Phantom and in vivo evaluation. Phys. Med. Biol. 2005, 50, 1919–1935. [Google Scholar] [CrossRef] [PubMed] [Green Version]
  17. Curra, F.P.; Mourad, P.D.; Khokhlova, V.A.; Cleveland, R.O.; Crum, L.A. Numerical simulations of heating patterns and tissue temperature response due to high-intensity focused ultrasound. IEEE. T. Ultrason. Ferr. 2002, 47, 1077–1089. [Google Scholar] [CrossRef]
  18. Sonesona, J.E.; Myers, M.R. Thresholds for nonlinear effects in high-intensity focused ultrasound propagation and tissue heating. IEEE. T. Ultrason. Ferr. 2010, 57, 2450–2459. [Google Scholar] [CrossRef]
  19. Guo, G.P.; Su, H.D.; Ding, H.P.; Ma, Q.Y. Noninvasive temperature monitoring for high intensity focused ultrasound therapy based on electrical impedance tomography. Acta Phys. Sin. 2017, 66, 164301. [Google Scholar]
  20. Su, H.D.; Guo, G.P.; Ma, Q.Y.; Tu, J.; Zhang, D. Noninvasive treatment efficacy monitoring and dose control for high-intensity focused ultrasound therapy using relative electrical impedance variation. Chin. Phys. B 2017, 26, 054302. [Google Scholar] [CrossRef]
  21. Pennes, H.H. Analysis of tissue and arterial blood temperature in the resting human foearm. J. Appl. Phys. 1948, 1, 93–122. [Google Scholar]
  22. Palmeri, M.L.; Sharma, A.C.; Bouchard, R.R.; Nightingale, R.W.; Nightingale, K.R. A finite-element method model of soft tissue response to impulsive acoustic radiation force. IEEE. T. Ultrason. Ferr. 2005, 52, 1699–1712. [Google Scholar] [CrossRef] [Green Version]
  23. Hou, G.Y.; Marquet, F.; Wang, S.; Konofagou, E.E. Multi-parametric monitoring and assessment of high-intensity focused ultrasound (HIFU) boiling by harmonic motion imaging for focused ultrasound (HMIFU): An ex vivo feasibility study. Phys. Med. Biol. 2014, 59, 1121–1145. [Google Scholar] [CrossRef] [Green Version]
  24. Galwey, A.K.; Brown, M.E. Application of the Arrhenius equation to solid state kinetics: Can this be justified? Thermochim. Acta 2002, 386, 91–98. [Google Scholar] [CrossRef]
  25. Jiang, S.C.; Zhang, X.X. Effects of dynamic changes of tissue properties during laser-induced interstitial thermotherapy (LITT). Laser Med. Sci. 2005, 19, 197–202. [Google Scholar] [CrossRef] [PubMed]
  26. Shibib, K.S.; Munshid, M.A.; Lateef, H.A. The effect of laser power, blood perfusion, thermal and optical properties of human liver tissue on thermal damage in LITT. Laser Med. Sci. 2017, 32, 2039–2046. [Google Scholar] [CrossRef] [PubMed]
  27. Zou, X.; Dong, H.; Qian, S.Y. Influence of dynamic tissue properties on temperature elevation and lesions during HIFU scanning therapy: Numerical simulation. Chin. Phys. B 2020, 29, 034305. [Google Scholar] [CrossRef]
  28. Liu, B.; Qian, S.Y.; Hu, W.P. Identification of Denatured Biological Tissues Based on Time-Frequency Entropy and Refined Composite Multi-Scale Weighted Permutation Entropy during HIFU Treatment. Entropy 2019, 21, 666. [Google Scholar] [CrossRef] [Green Version]
  29. Tan, Q.L.; Zou, X.; Ding, Y.J.; Zhao, X.M.; Qian, S.Y. The Influence of Dynamic Tissue Properties on HIFU Hyperthermia: A Numerical Simulation Study. Appl. Sci. 2018, 8, 1933. [Google Scholar] [CrossRef] [Green Version]
Figure 1. Schematic illustration of the spiral pathway from the center to the outside.
Symmetry 12 01386 g001
Figure 2. Distributions of the acoustic intensity on the focal plane.
Symmetry 12 01386 g002
Figure 3. Comparison of the temperature elevation on treatment spots. (a) No. 1; (b) No. 5; (c) No. 13; (d) No. 19.
Symmetry 12 01386 g003
Figure 4. Thermal lesions on the focal plane at different times during high intensity focused ultrasound (HIFU) scanning therapy ( t n = t s ). (a) 17 s; (b) 35 s; (c) 53 s; (d) 71 s; (e) 89 s; (f) 107 s; (g) 125 s; (h) 143 s; (i)149 s; (j) 159 s.
Symmetry 12 01386 g004
Figure 5. Thermal lesions on the focal plane under different heating times. (a) 1.2 t s ; (b) 1.4 t s ; (c) 1.6 t s ; (d) 1.8 t s .
Symmetry 12 01386 g005
Figure 6. Thermal lesions on the focal plane under different acoustic intensities. (a) 1.2 I s ; (b) 1.4 I s ; (c) 1.6 I s ; (d) 1.8 I s .
Symmetry 12 01386 g006
Figure 7. Thermal lesions on the focal plane under an optimized heating time. (a) f b = 0.7,   f a = 0.5; (b) f b = 0.8, f a = 0.5; (c) f b = 0.9,   f a = 0.5; (d) f b = 0.8,   f a = 0.4; (e) f b = 0.8,   f a = 0.6.
Symmetry 12 01386 g007
Figure 8. Thermal lesions on the focal plane under an optimized acoustic intensity. (a)   f b = 0.7,   f a = 0.5; (b)   f b = 0.8,   f a = 0.5; (c)   f b = 0.9,   f a = 0.5; (d)   f b = 0.8,   f a = 0.4; (e)   f b = 0.8,   f a = 0.6.
Symmetry 12 01386 g008
Table 1. Properties of water and tissue (37 °C).
MaterialsDensity (kg/m3)Speed of Sound
(m/s)
Attenuation (Np/m/MHz)Specific Heat
(J/(kg.K))
Thermal Conductivity
(W/(m.K))
Water100014830.025N/AN/A
Tissue103615513.561435600.5212
Table 2. The s N   and t N of neighboring spots around different treatment spots.
Treatment SpotsNeighboring Treated Spots ( s N ,   t N )
(mm, s)
Neighboring Untreated Spots ( s N , t N )   (mm, s)
No.1/No. 2(2,1), No. 3( 2 2 ,7), No. 4(2,13), No. 5( 2 2 ,19), No. 6(2,25), No.7( 2 2 ,31), No. 8(2,37), No. 9( 2 2 ,43)
No.5No. 4(2,1), No.1(   2 2 ,19)No. 6(2,1), No.15( 2 2 ,55), No. 16(2,61),
No.17( 2 2 ,67), No. 18 (2,73), No.19( 2 2 ,79)
No.13No.12(2,1), No.3(   2 2 ,55)No. 14(2,1)
No.19No.18(2,1), No.6 (2,73), No.5( 2 2 ,79), No.7( 2 2 ,67)No. 20(2,1)
Table 3. Influence of a different heating time and acoustic intensity on the parameters for evaluating the treatment effect.
t n   or   I n t T   ( s )   m p T   ( ° C ) S p T 2 S A T   ( mm 2 ) S A H   ( mm 2 )   S D   ( mm 2 )
1.2 t s 17437.92412.486963.8220.004017.182
1.4 t s 19940.57616.217773.0330.23608.2030
1.6 t s 22442.78020.239277.0860.87604.7860
1.8 t s 24944.64024.631778.9231.71403.7910
1.2 I s 14941.66813.263972.5360.20508.6690
1.4 I s 14948.64418.124279.4192.26233.8433
1.6 I s 14955.57223.605480.8525.67585.8238
1.8 I s 14962.51629.818180.9919.09989.1088
Table 4. Influence of different f b and f a values on the parameters for evaluating the treatment effect under an optimized heating time.
f b   and   f a t T   ( s )   m p T   ( ° C ) S p T 2 S A T   ( mm 2 ) S A H   ( mm 2 ) S D   ( mm 2 )
0.7,0.520438.47213.826377.8721.21124.3392
0.8,0.5194.237.86011.835876.6410.78785.1468
0.9,0.5188.237.19611.536275.8380.60505.7670
0.8,0.4205.638.71613.525677.9461.17994.2339
0.8,0.6187.236.82820.640474.9960.71836.7223
Table 5. Influence of different f b and f a values on the parameters for evaluating the treatment effect under an optimized acoustic intensity.
f b   and   f a t T   ( s )   m p T   ( ° C ) S p T 2 S A T   ( mm 2 ) S A H   ( mm 2 ) S D   ( mm 2 )
0.7,0.514948.3080108.991680.7896.19536.4063
0.8,0.514945.608076.470880.3584.34314.9851
0.9,0.514944.344062.639279.7973.25324.4562
0.8,0.414949.132086.046480.8256.16126.3362
0.8,0.614943.7040100.121279.7343.69704.9630

