Article

Enhancement in Quality Estimation of Resistance Spot Welding Using Vision System and Fuzzy Support Vector Machine

1
School of Mechanical and Electronic Engineering, Wuhan University of Technology, Wuhan 430070, China
2
School of Mechanical and Electrical Engineering, Tishreen University, Lattakia 97009, Syria
*
Author to whom correspondence should be addressed.
Symmetry 2020, 12(8), 1380; https://doi.org/10.3390/sym12081380
Submission received: 8 July 2020 / Revised: 31 July 2020 / Accepted: 12 August 2020 / Published: 18 August 2020

Abstract

:
The current nondestructive testing methods such as ultrasonic, magnetic, or eddy current signals, and even the existing image processing methods, present certain challenges and show a lack of flexibility in building an effective and real-time quality estimation system of the resistance spot welding (RSW). This paper provides a significant improvement in the theory and practices for designing a robotized inspection station for RSW at the car manufacturing plants using image processing and fuzzy support vector machine (FSVM). The weld nuggets’ positions on each of the used car underbody models are detected mathematically. Then, to collect perfect pictures of the weld nuggets on each of these models, the required end-effector path is planned in real-time by establishing the Denavit-Hartenberg (D-H) model and solving the forward and inverse kinematics models of the used six-degrees of freedom (6-DOF) robotic arm. After that, the most frequent resistance spot-welding failure modes are reviewed. Improved image processing methods are employed to extract new features from the elliptical-shaped weld nugget’s surface and obtain a three-dimensional (3D) reconstruction model of the weld’s surface. The extracted artificial data of thousands of samples of the weld nuggets are divided into three groups. Then, the FSVM learning algorithm is formed by applying the fuzzy membership functions to each group. The improved image processing with the proposed FSVM method shows good performance in classifying the failure modes and dealing with the image noise. The experimental results show that the improvement of comprehensive automatic real-time quality evaluation of RSW surfaces is meaningful: the quality estimation could be processed within 0.5 s in very high accuracy.

1. Introduction

Resistance spot welding (RSW) is a technology utilized extensively in the automobile industry due to its effective and easy implementation. Recently, there has been an increasing demand in the automotive companies for reducing the number of weld nuggets while still ensuring the quality of the RSW, which may save time and cost [1,2,3].
The traditional method for verification of RSW’s quality includes many kinds of destructive testing methods like tension tests, bend tests, and peel tests. Compared to interfacial failure mode, resistance spot welding that fails in the nugget pullout model is better because it provides higher peak loads and energy absorption levels [4]. To prove the quality of the RSW during automobile lifetime, the nugget pullout failure mode should be guaranteed by adjusting the process parameters [5,6]. The very nature of the destructive test means that just a few chosen welds will be sampled for quality. These results deviate in quality from weld to weld, and more than 99% of RSW in a car is never checked. There are important costs and hazards related to reworking and scrapping the defective welded parts made between the teardown tests.
Many nondestructive inspection methods of the RSW were presented based on ultrasonic transmission inspections [7]. Baradarani et al. [8] proposed an effective algorithm to enhance the scanning signal to extract the required features from highly polluted signal mixtures in the ultrasonic spot-welding inspection. There are some disadvantages to this method, such as restricted detection ranges, inaccurate readings, and inflexible scanning process. Other technologies on the welding quality monitoring studied the welding voltage, current signal, and dynamic resistance [9] or sensing of the force and electrode pressure-displacement of the welding machine. Johnson et al. [10] discussed the coefficient of electrode movement due to the expansion of the weld and discussed its effect on the quality of the resistance spot weld. A method to evaluate the quality of weld as an in-process system with monitoring the dynamic resistance utilizing a microprocessor in the secondary circuit of the welding machine has been suggested by Patange et al. [11].
Several researchers used an artificial neural network for evaluating nugget sizes of spot welds. Brown et al. [12] used this method to estimate the nugget diameter, a factor closely related to weld strength. Shimamoto et al. [13] developed a direct current nugget-tester and proposed a nondestructive method for evaluating the fixed strength of the welded joints. The proposed method was based on the relative decrease in surface electrical resistance of the RSW and the effect of the corona bond area, which were both considered as two factors to accurately estimate the nugget diameter. Jiyoung [14] designed an exponential for estimating the welding pitch, utilizing the ratio of adaptive welding heat inputs to the reference welding heat inputs at the height of the reference welding strength curve. Based on the relationship between nugget diameter, heat input, and weld pitch, the logistic growth model was subsequently developed to evaluate the heat input restitution. The experimental results based on the proposed method showed that the shunting effect reduced significantly, and an improved nugget shape was produced. Duan et al. [15] introduced a novel work based on the post-weld current pulse as the main factor in a novel post-weld heat treatment to change the crystallization direction on the microstructure of the weld nugget, then they verified the results by using a tensile shear test.
Other works were based on a magnetic method that does not supply good morphology information compared with ultrasonic and radiographic methods, but it is a suitable and low-cost technique. In Reference [16], the authors have used eddy current testing for surface depth profile analysis and magnetic flux permeation to investigate the linkage between the magnetic analyses and the strength of the spot weld.
The following works introduced automatic identification systems of RSW’s defects by using novel image processing methods. Ruisz et al. [17] presented an online real-time nondestructive estimation system based on vision methods to test the quality of RSW. The images have been taken by a low-cost camera fixed on the welding gun. A real-time process was ensured in the structure system. The computing method of the fractal dimension theory indicates some characteristics of irregular geometric objects in images [18]. This technique is identical to the process of human visual processing. It reveals the features of the material damage and its development, in a sense. To overcome the noise and other disturbances in the traditional image processing methods, microcosmic and macrocosmic image processing algorithms in welding were compared in Reference [19], then the authors combined a novel image processing method with fractal theory, Laplace operator, and least square method to detect and recognize the image edges correctly. In Reference [20], effective results were obtained for identifying and segmenting line defects in X-ray welding images based on multiple thresholds for images, the support vector machine (SVM) method to classify defects, and a Hough transform to delete the noise pixels in the coarse defect area. Vilar et al. [21] proposed a more effective method for defect detection in X-ray images based on fuzzy logic theory. Boersch et al. [22] used data mining techniques based on data preprocessing and segmentation, feature extraction and selection, and model creation and validation in order to estimate the weld diameter in RSW. The results showed high performance in classifying more than 3000 welds using the proposed predictor, with a success rate of 93%.
However, several proposed methods face certain challenges in the reliable quality evaluation of the weld nuggets in automobile production. The destructive techniques show a lack of low-cost and safety and cannot effectively be used. The non-destructive techniques show the weakness of experience in various fields such as illumination, location of the camera, lack of flexibility in the production line, and no successful real-time inspection attempts, yet. These factors can influence the quality estimation of RSW.
In our previous paper [23], an online quality monitoring system was proposed using image processing and fuzzy logic. After extracting data, the trained fuzzy approach was used to classify the weld nuggets’ flaws into the good and bad weld. However, our proposed system showed limitations when the shape of the weld nugget to be analyzed was not a circle and also due to the few samples which were used for training the system. The purpose of this study is building a more reliable, cost-effective, fully intelligent, and automatic online quality inspection system based on image processing methods with a fuzzy support vector machine (FSVM) without any human interaction to evaluate the RSW quality in order to meet the industry’s requirements. The fundamental contributions are listed in the following points:
  • Improve the image processing methods to cover the non-circular weld nuggets. More accurate results in extracting the characteristics from the weld nugget surface. Major and minor diameters, center coordinates, and angle of both “the fusion zone and heat-affected zone” are considered.
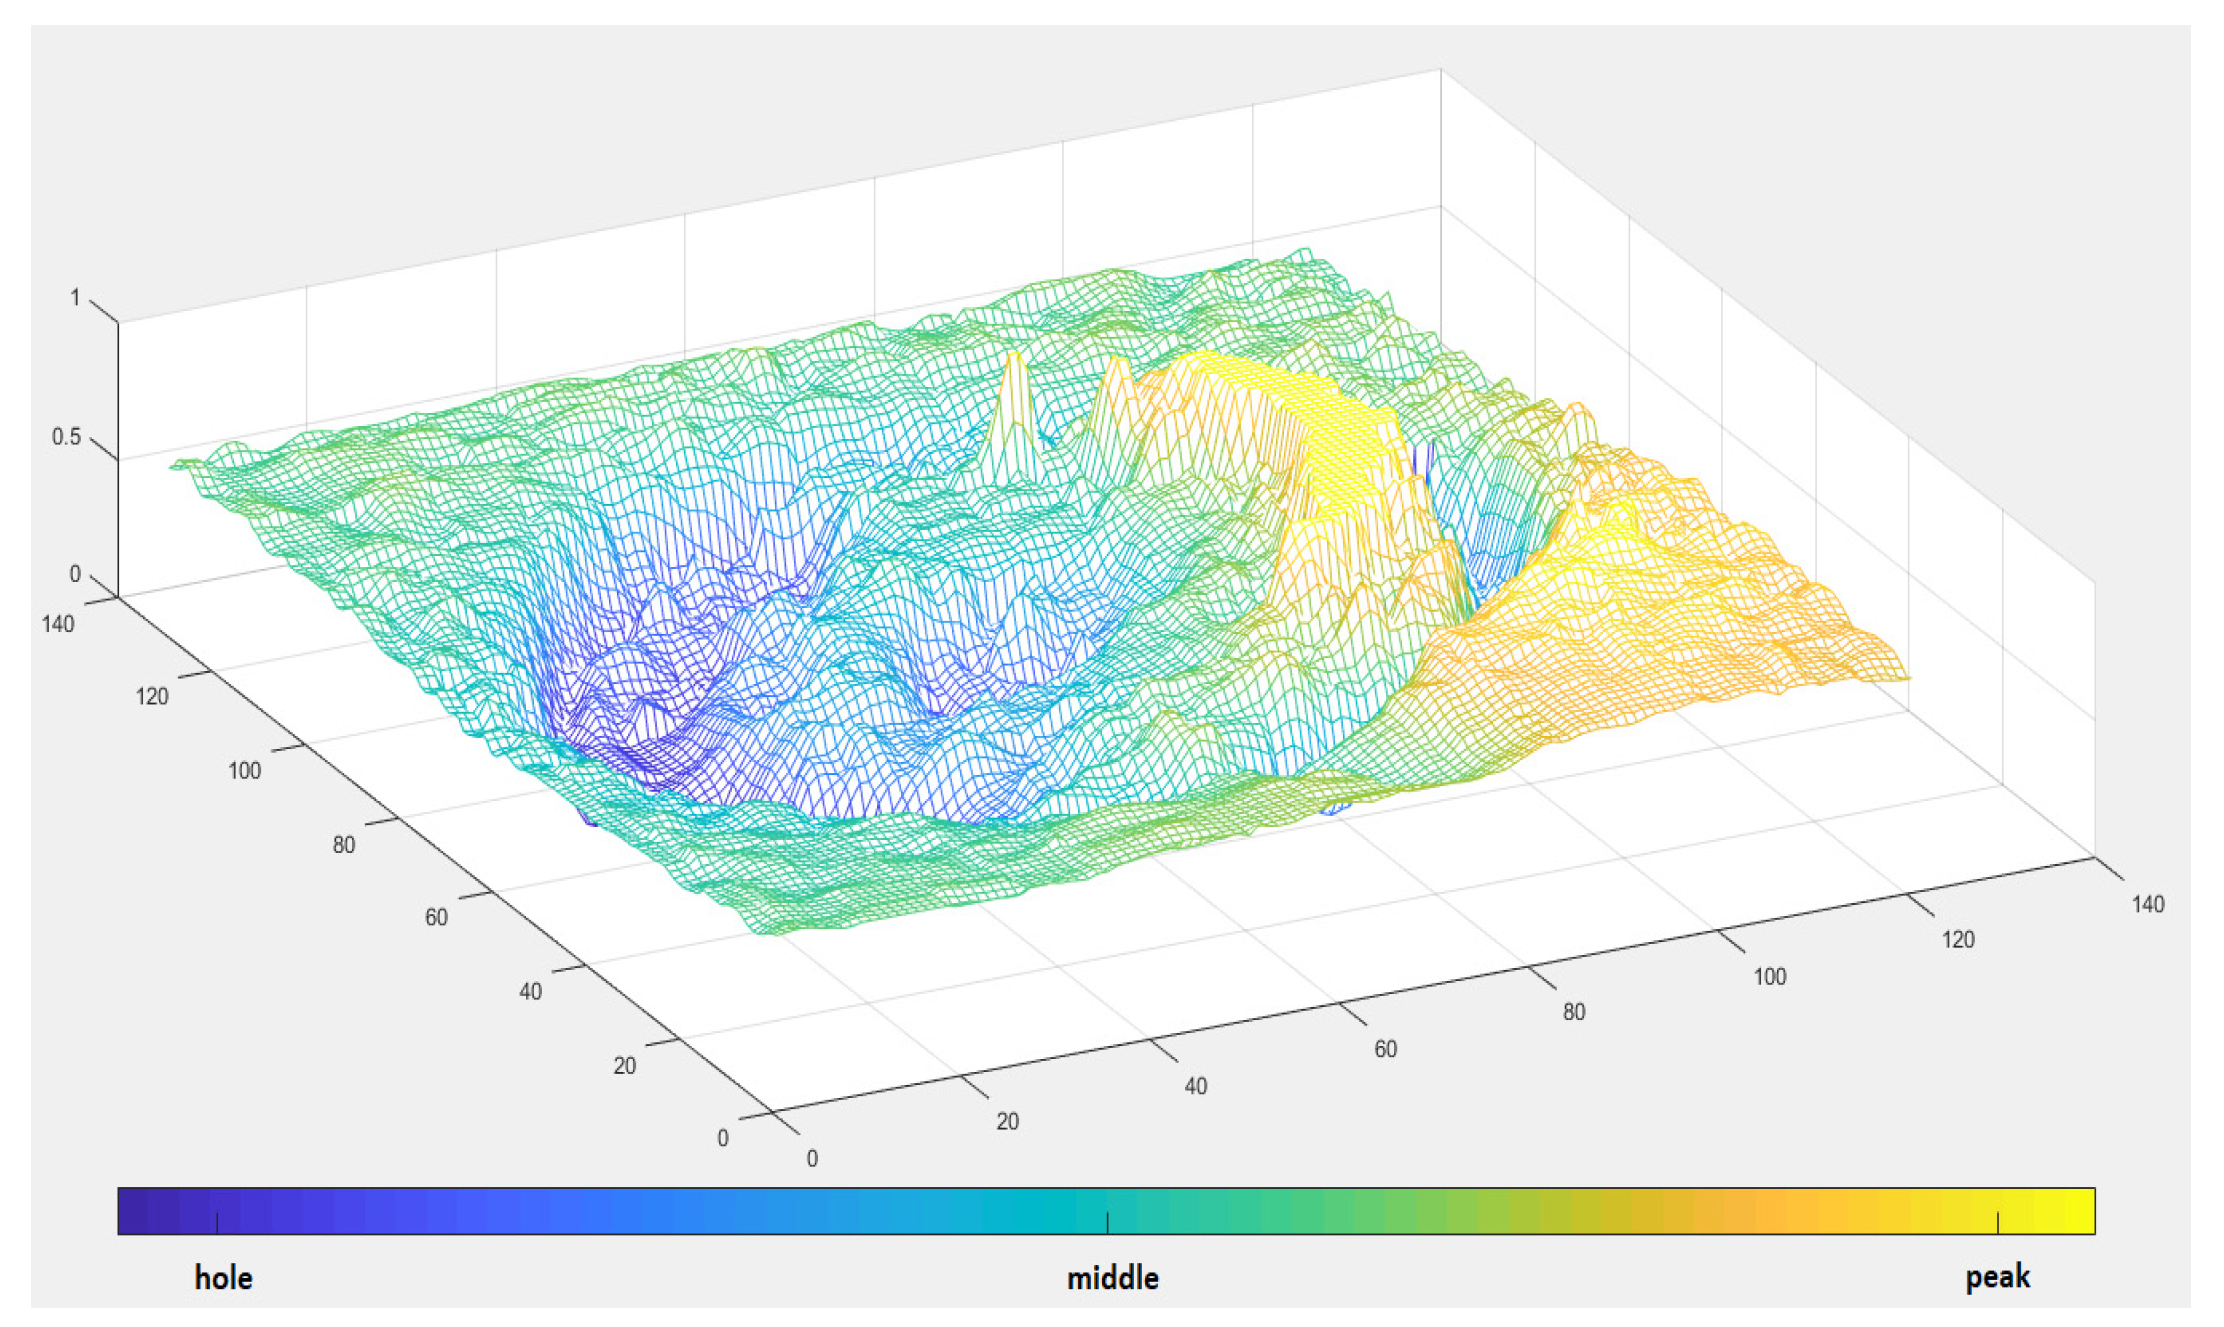
  • Show more details of the weld nugget’s surface: the appearance’s accuracy of the topography of the weld nugget’s surface is enhanced in the concluded three-dimensional (3D) model.
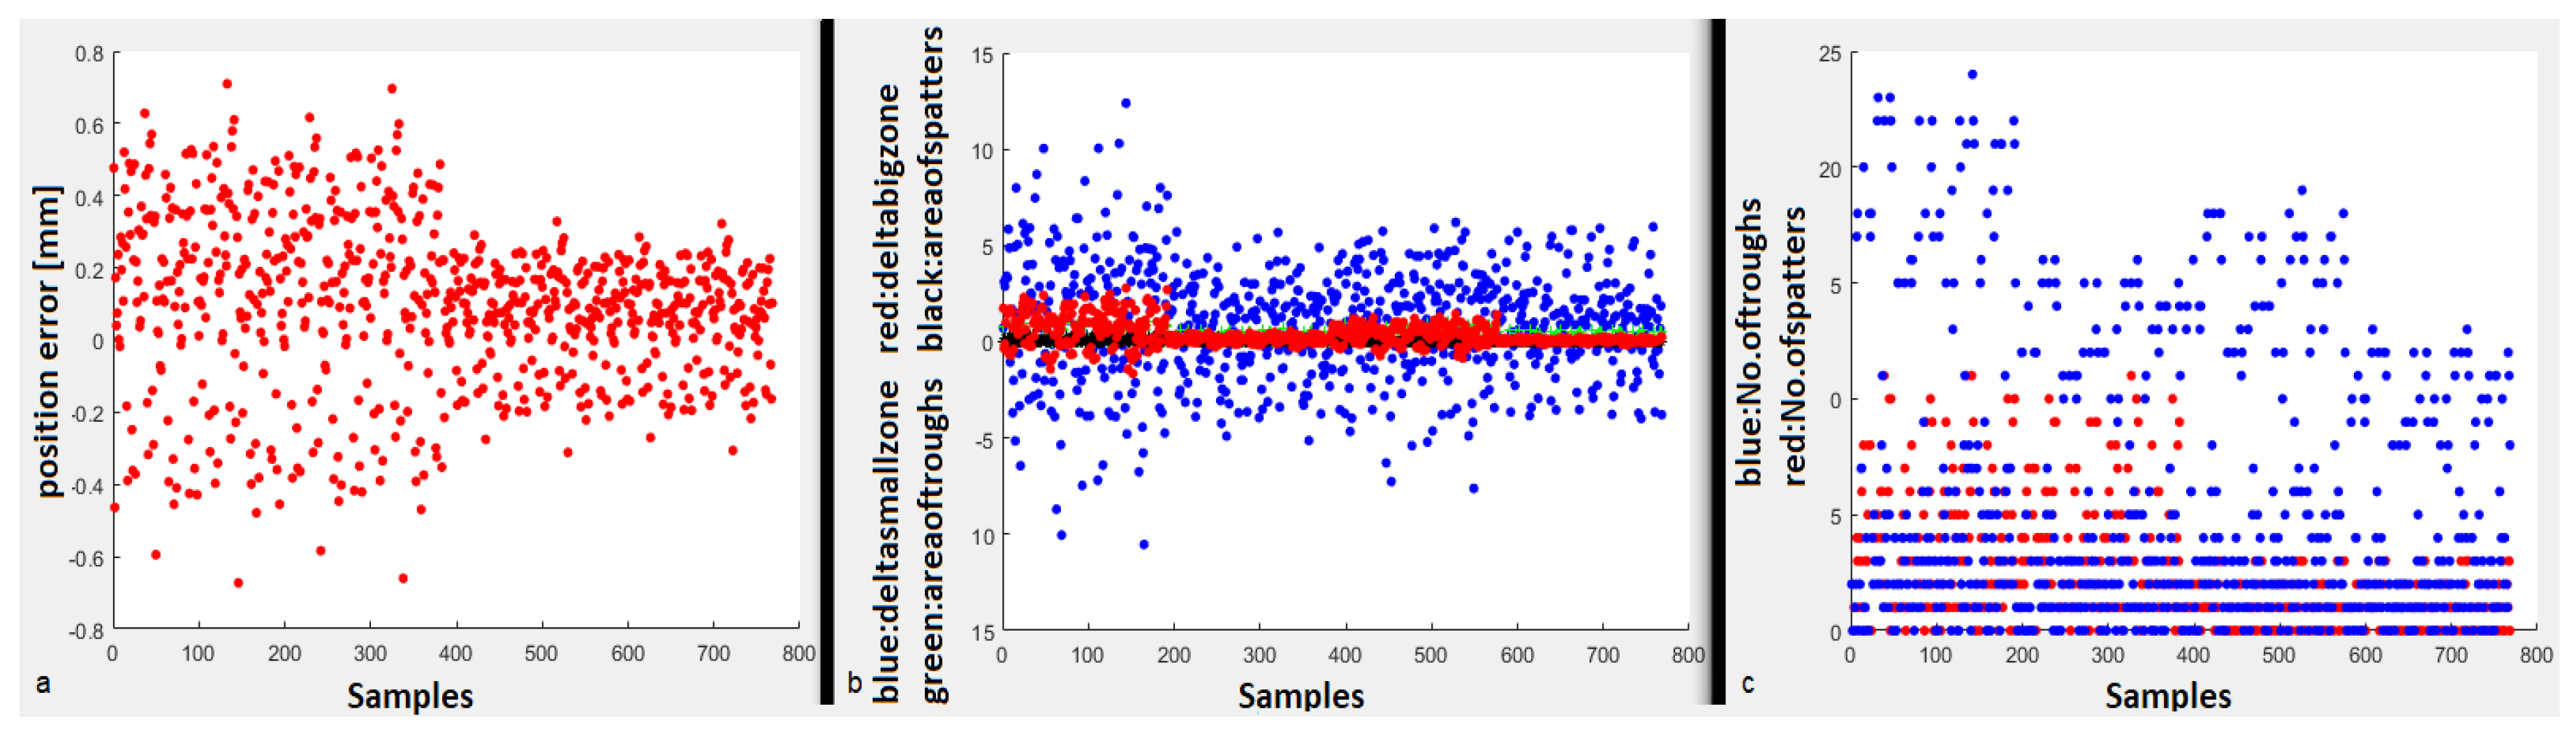
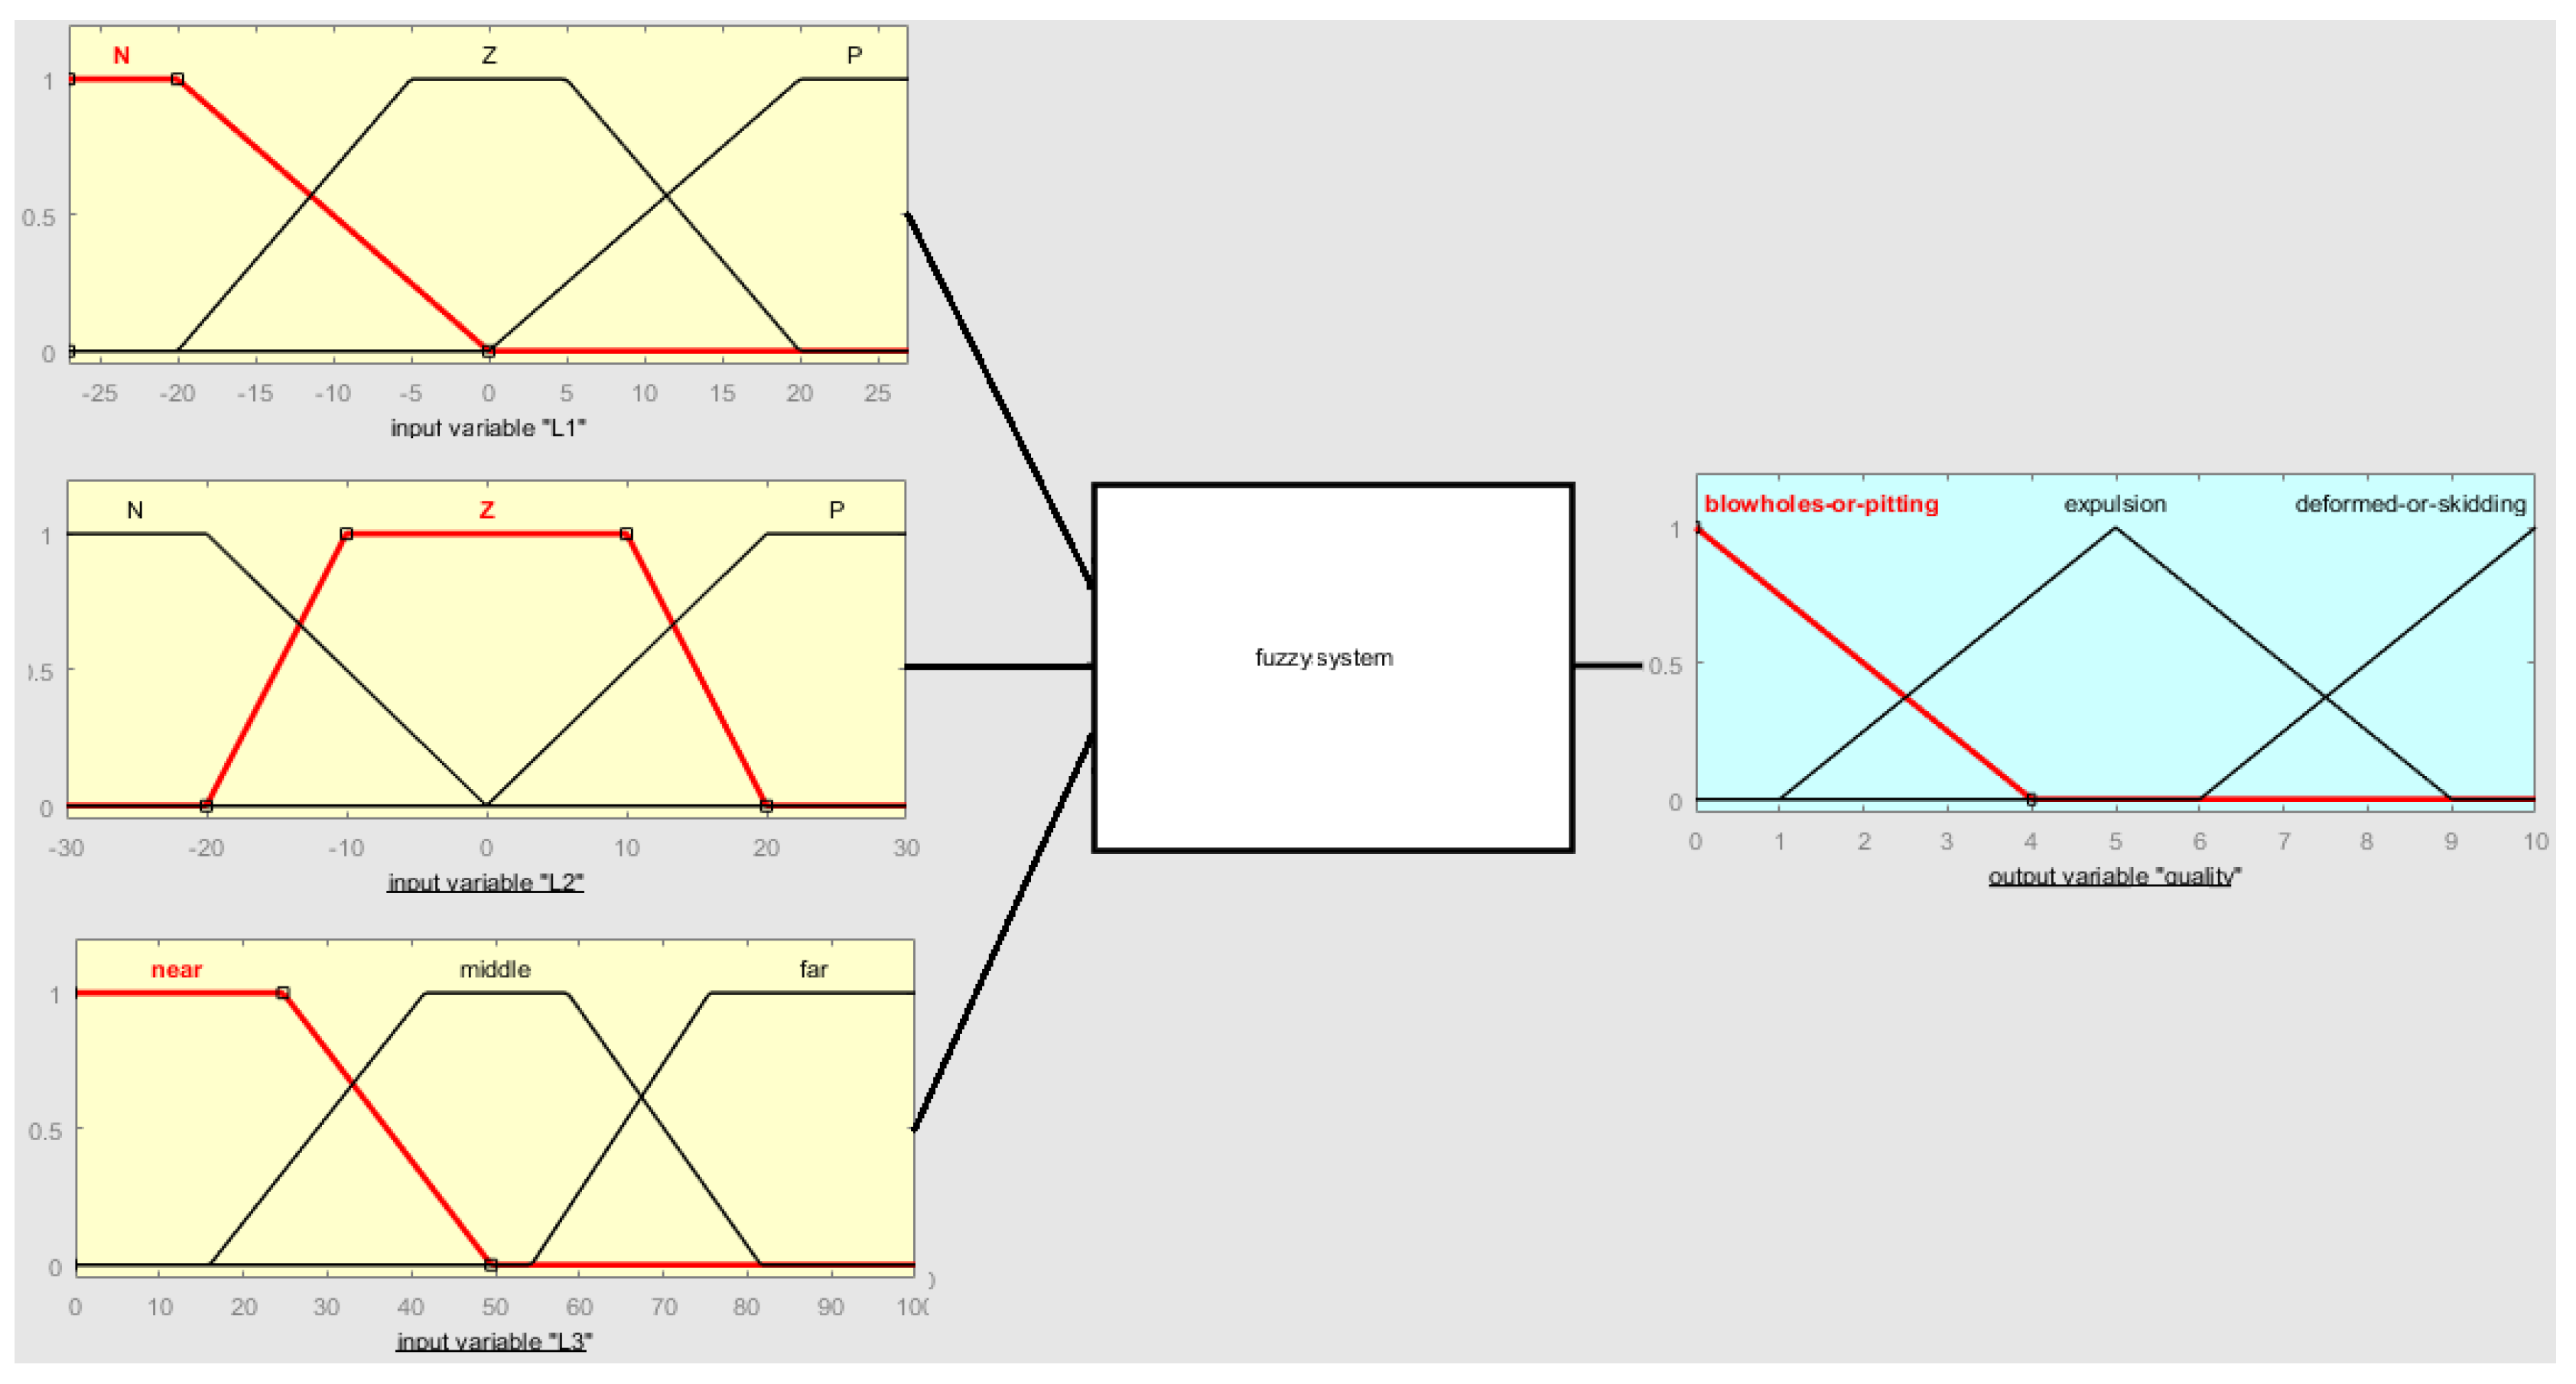
  • Increase the efficiency of the proposed system by using an excessive number of samples for data training. Also, the FSVM machine learning method is carried out by applying the fuzzy functions to three groups of the extracted data to improve data training and classify the failure modes of the RSW effectively.
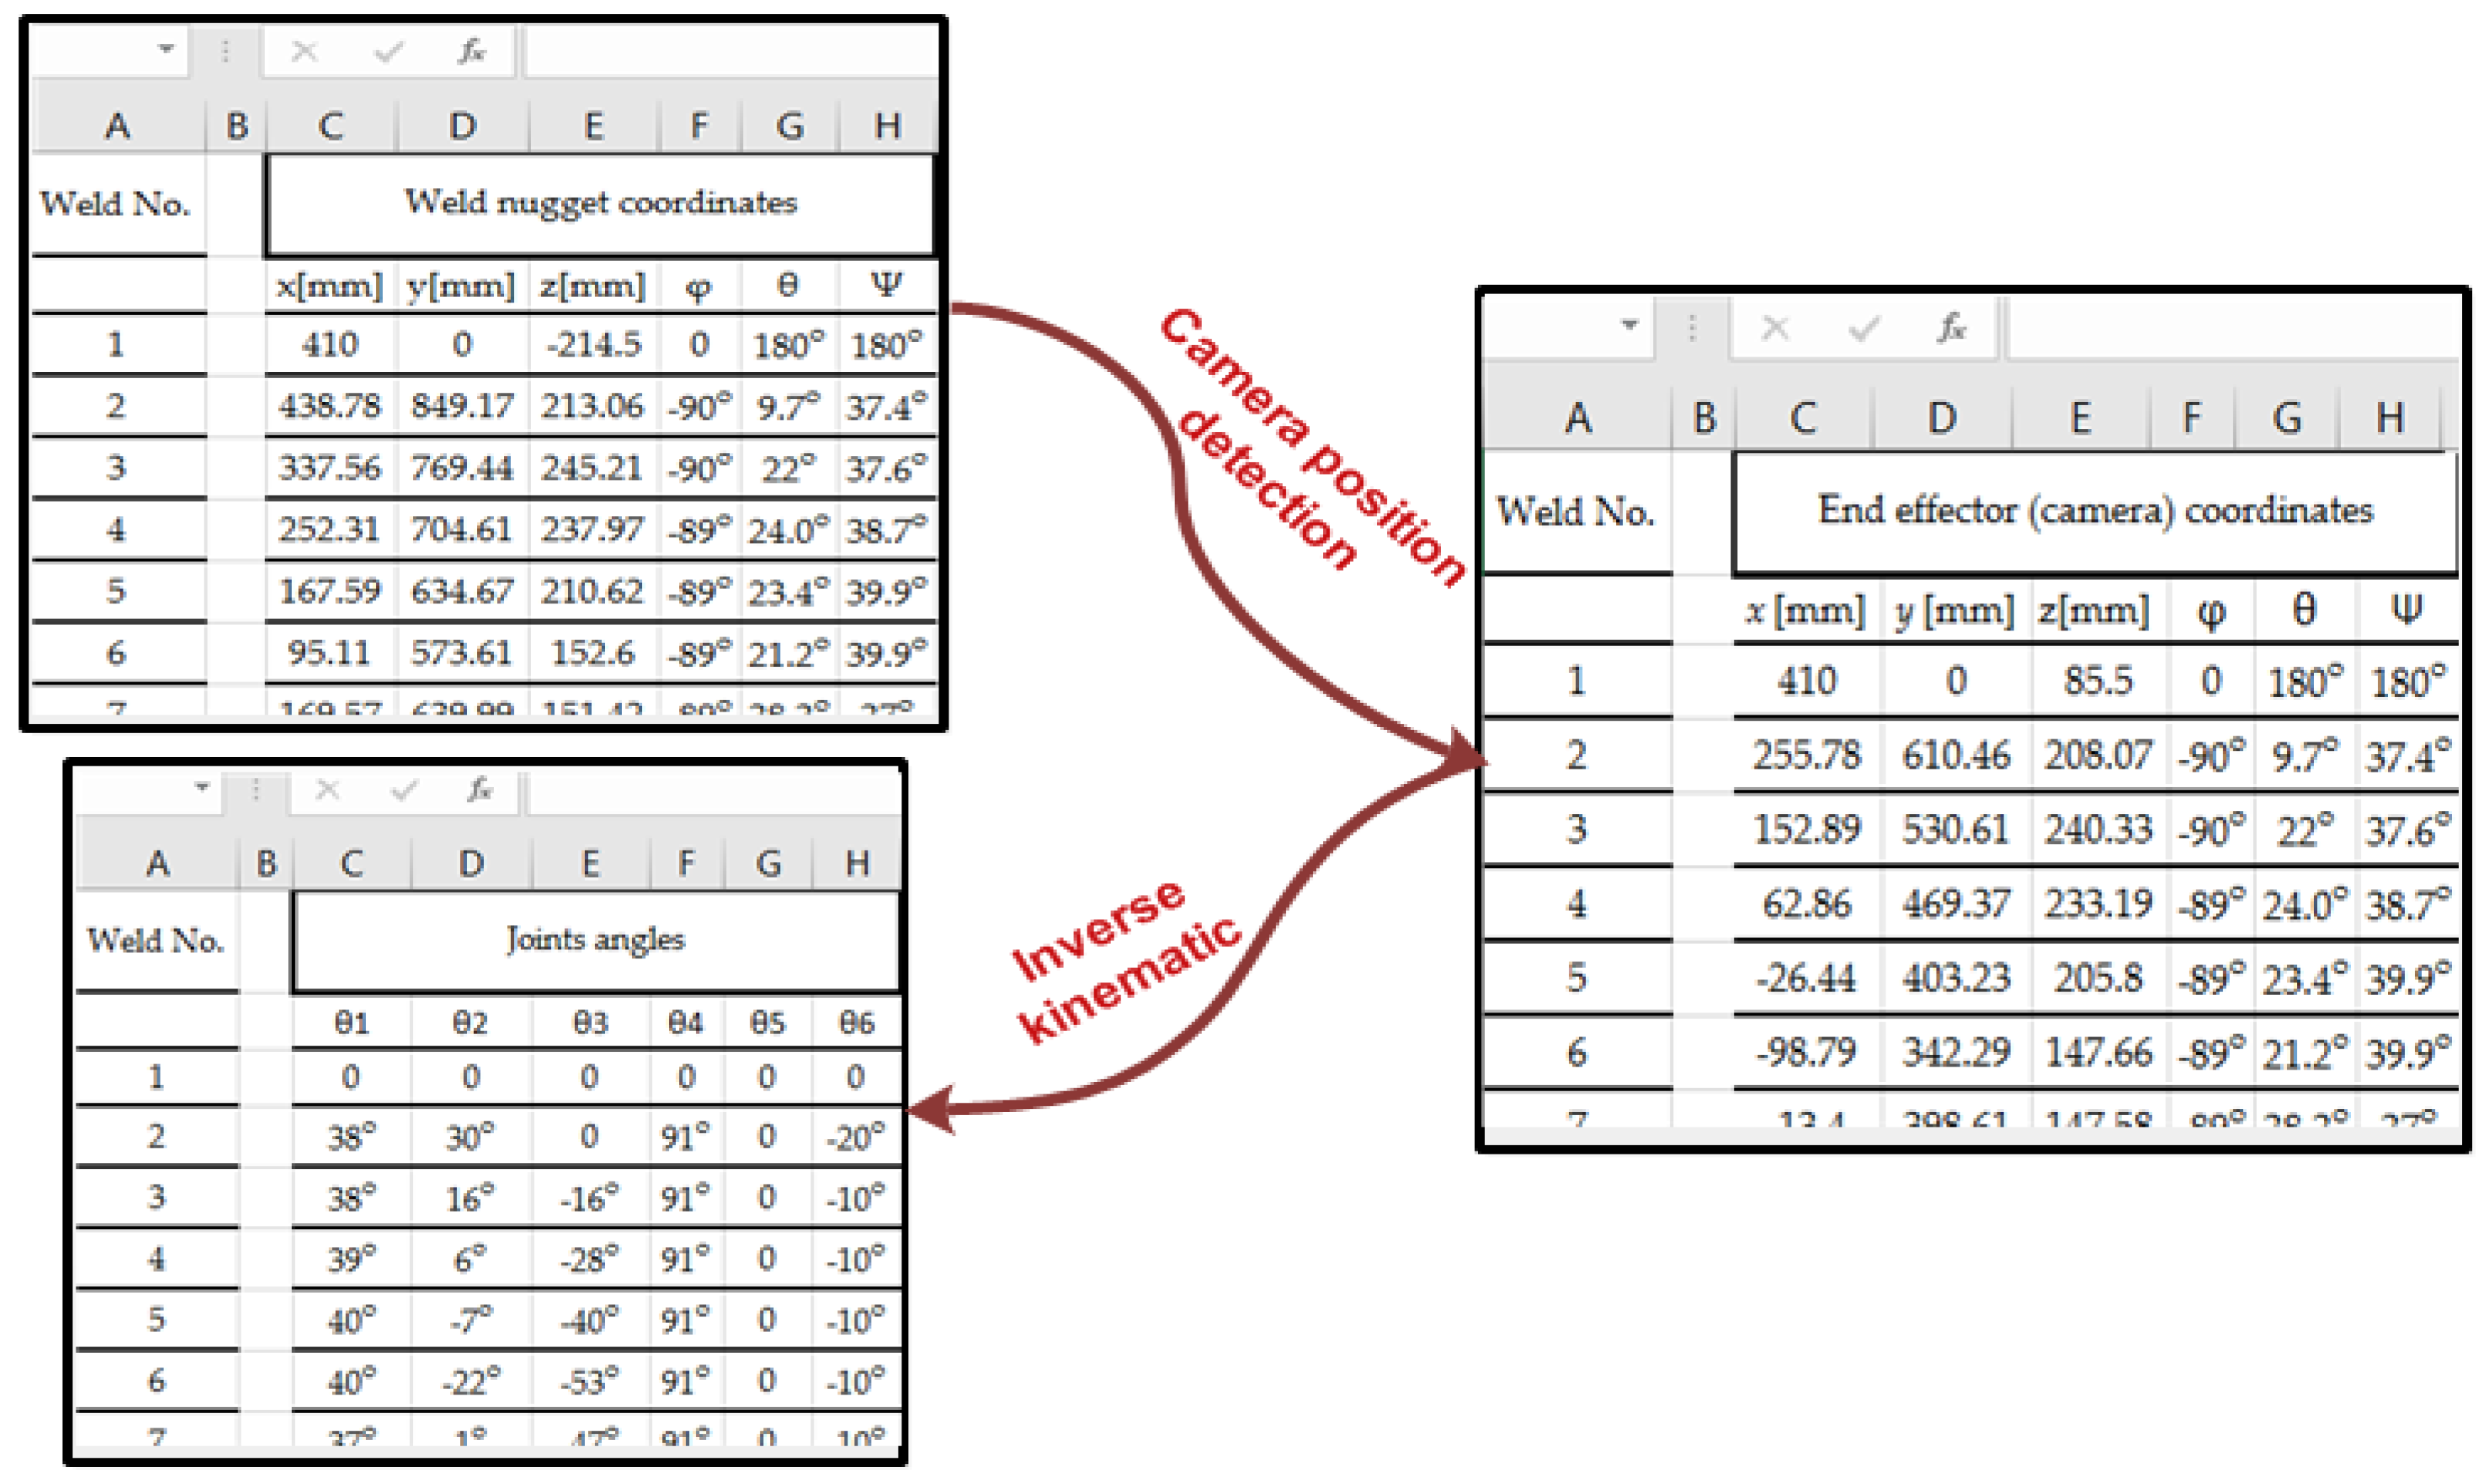
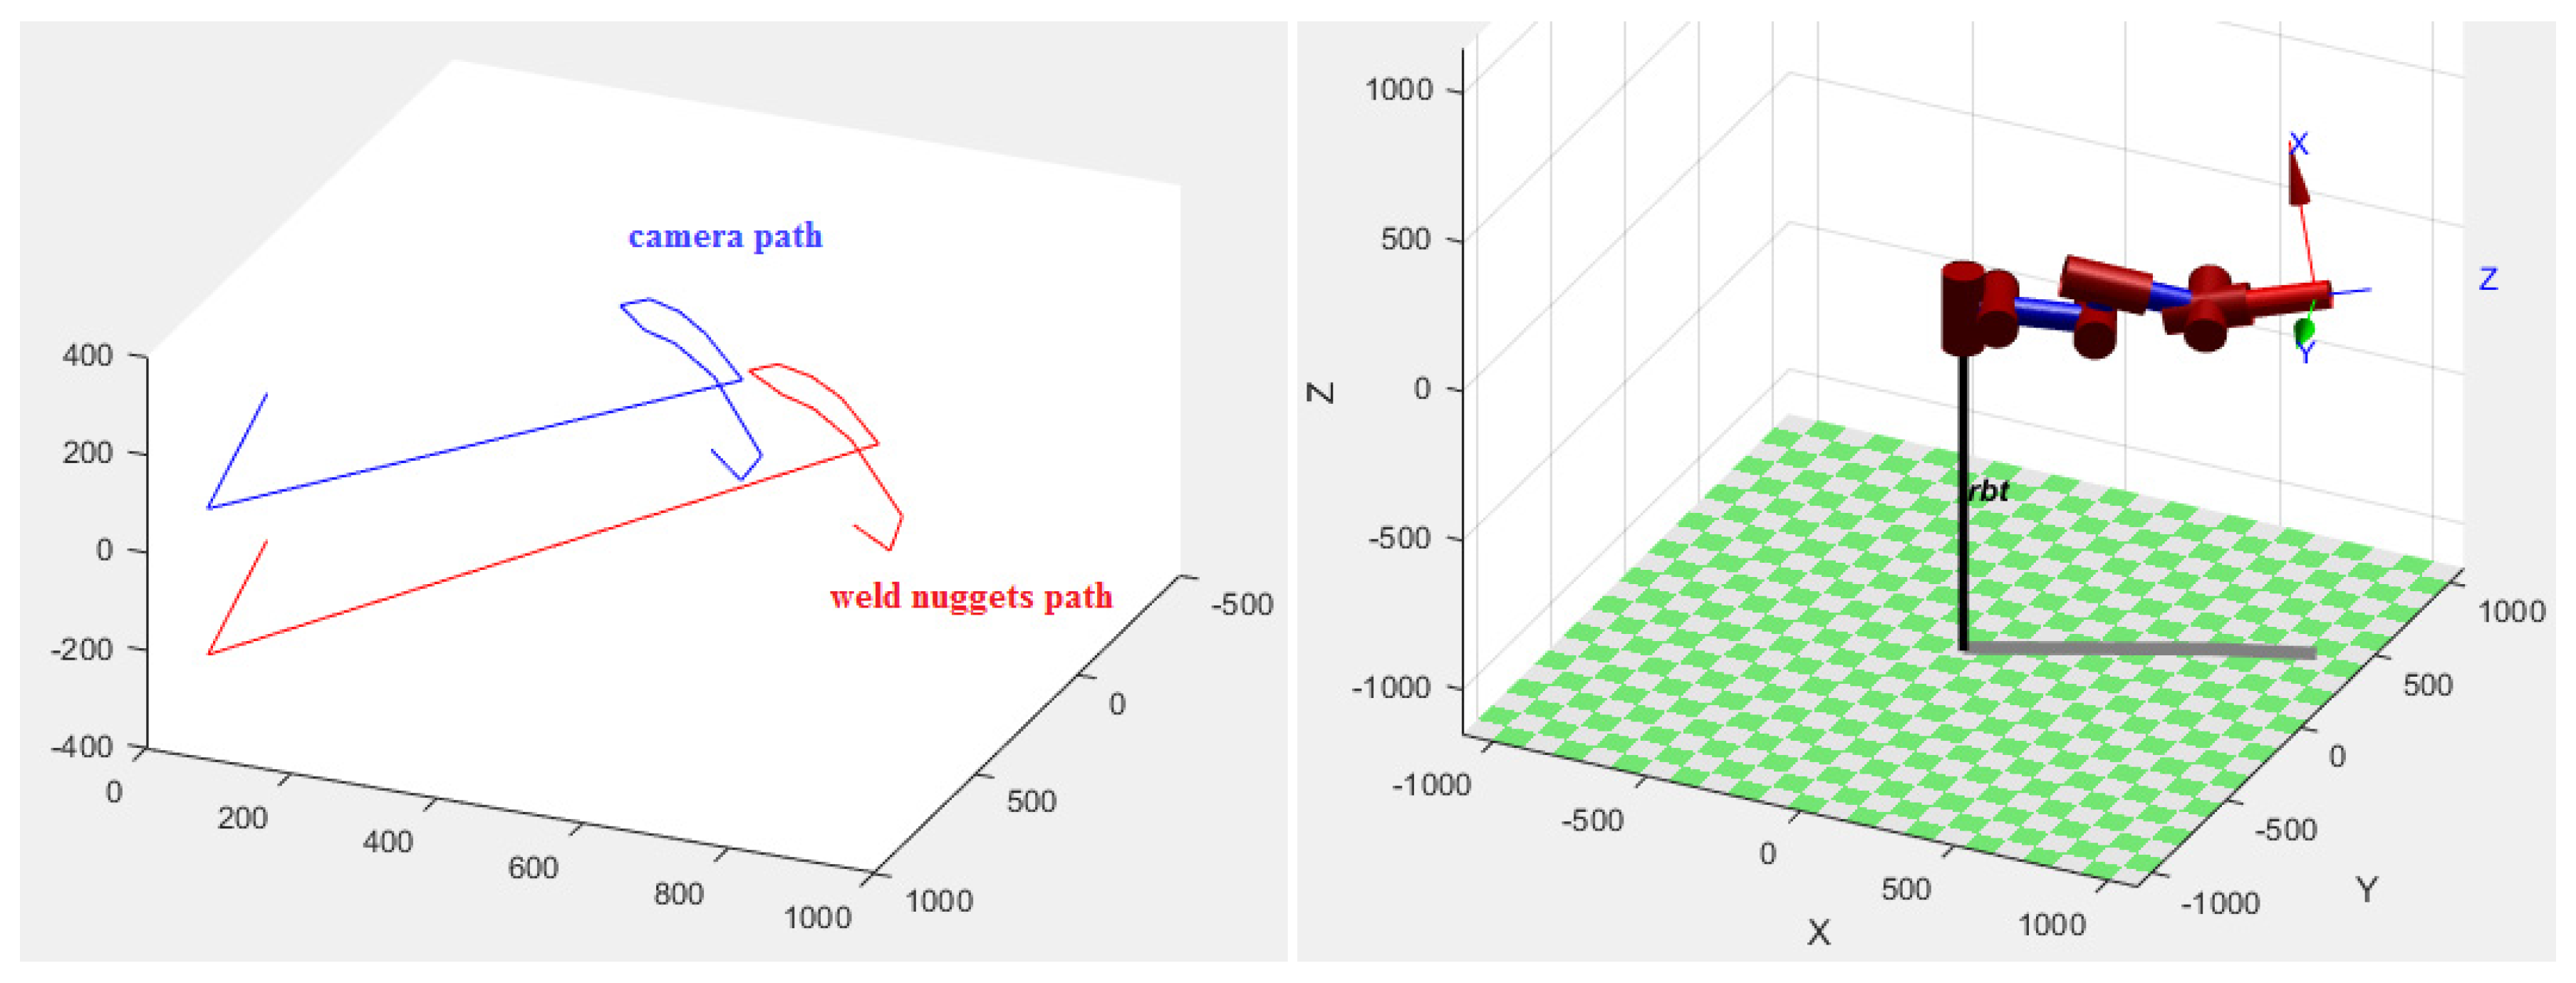
  • The weld nuggets’ position detection is taken into consideration mathematically and the required end-effector path of the 6-degrees of freedom (6-DOF) robotic arm is planned to take a perfect picture of each weld nugget.
The experimental results show that the improvement of comprehensive automatic real-time quality evaluation of RSW surfaces is satisfactory, and the execution time of the whole process for each weld nugget is 0.5 s, with very high accuracy.

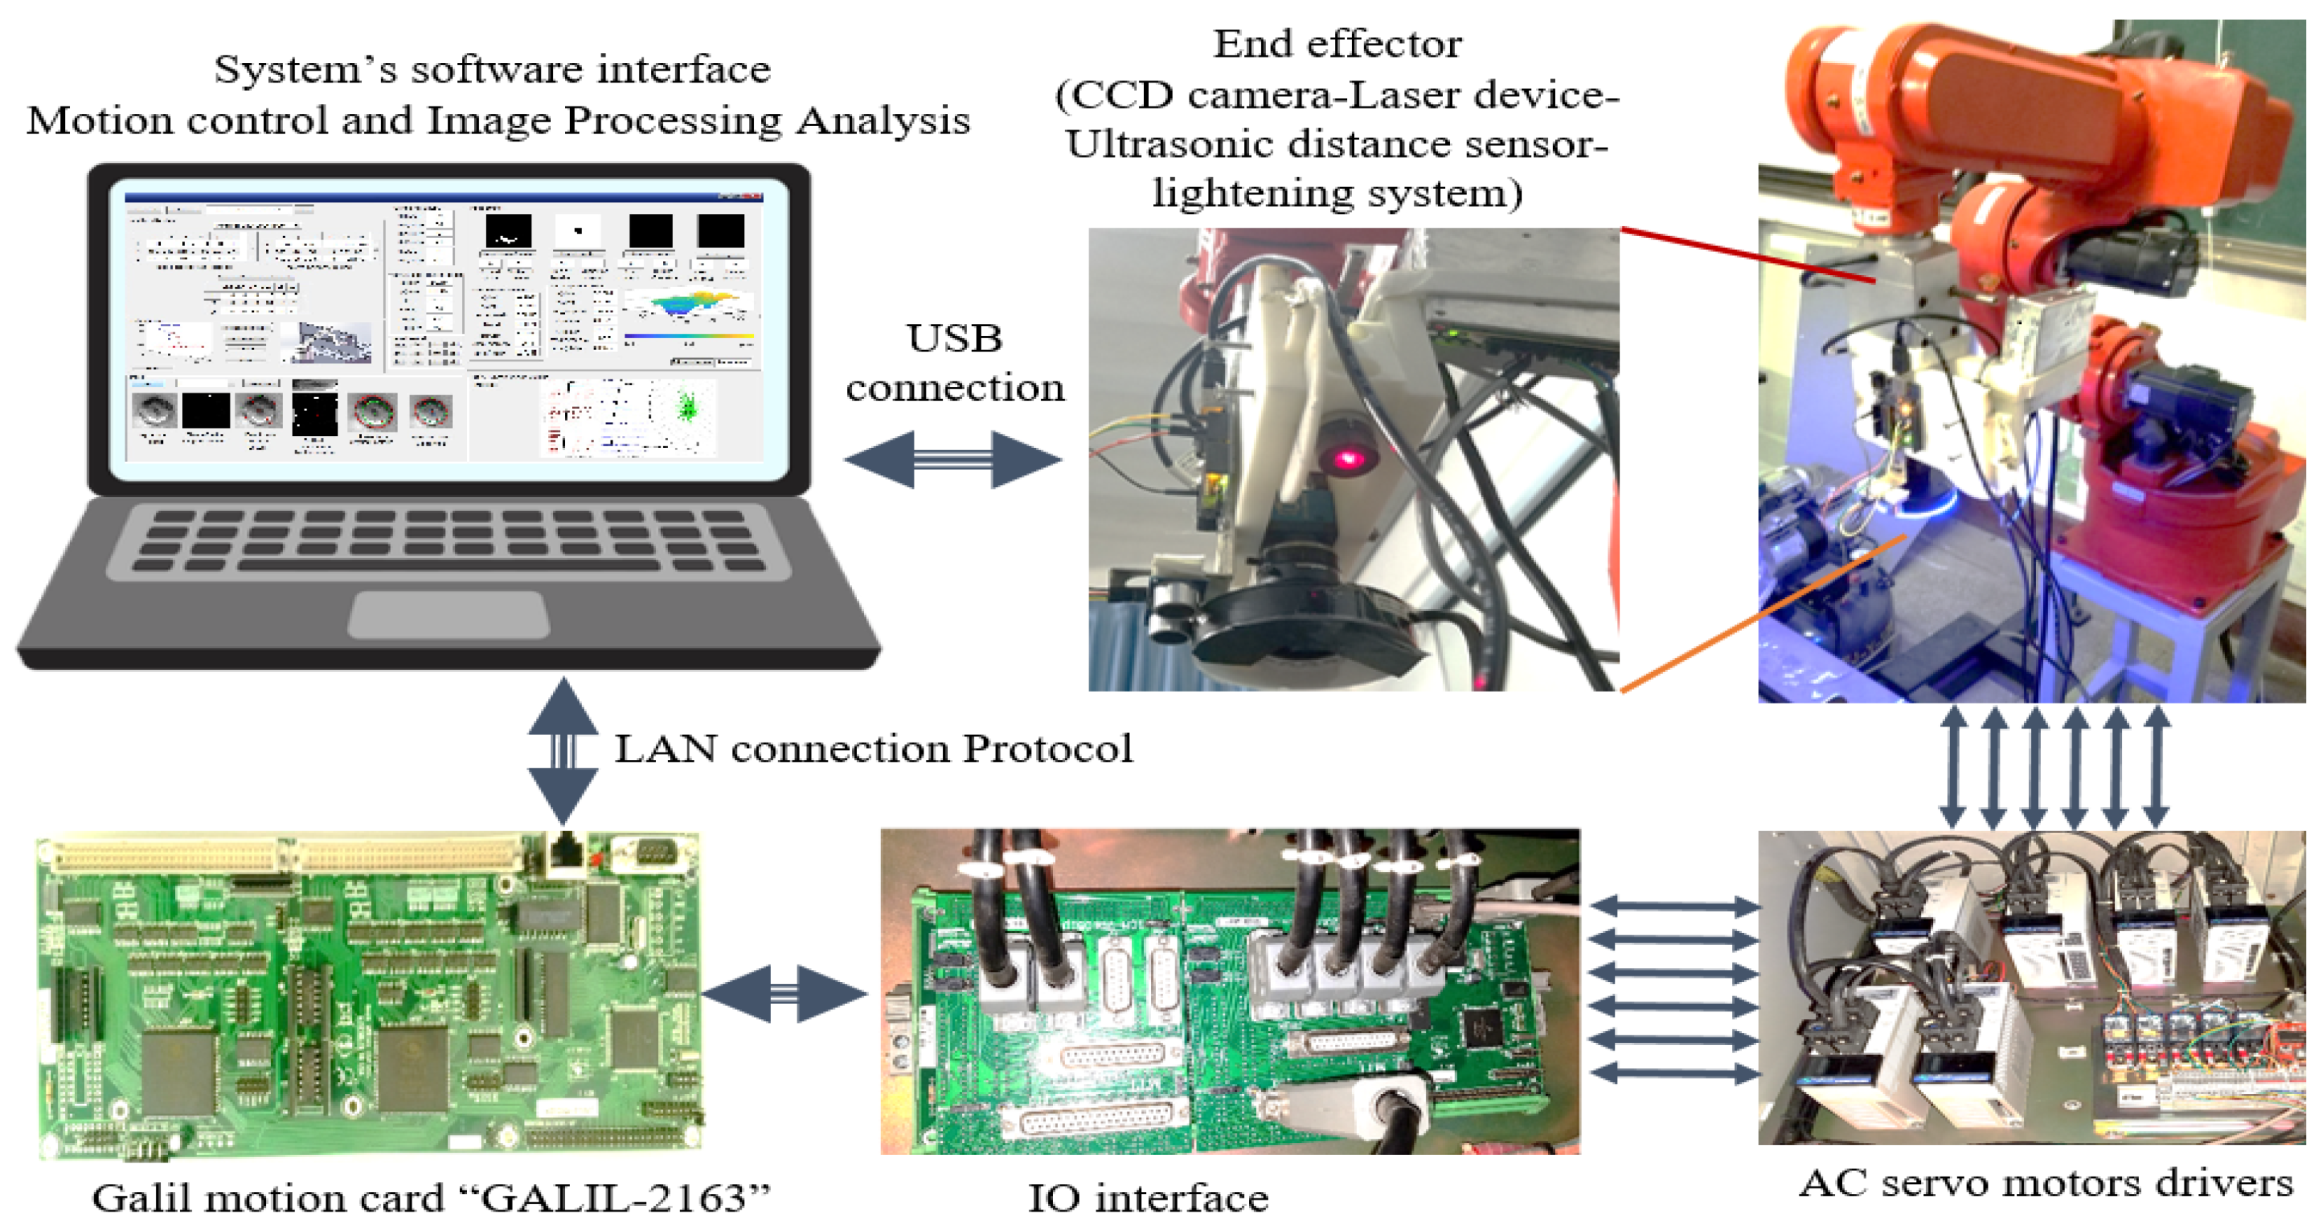
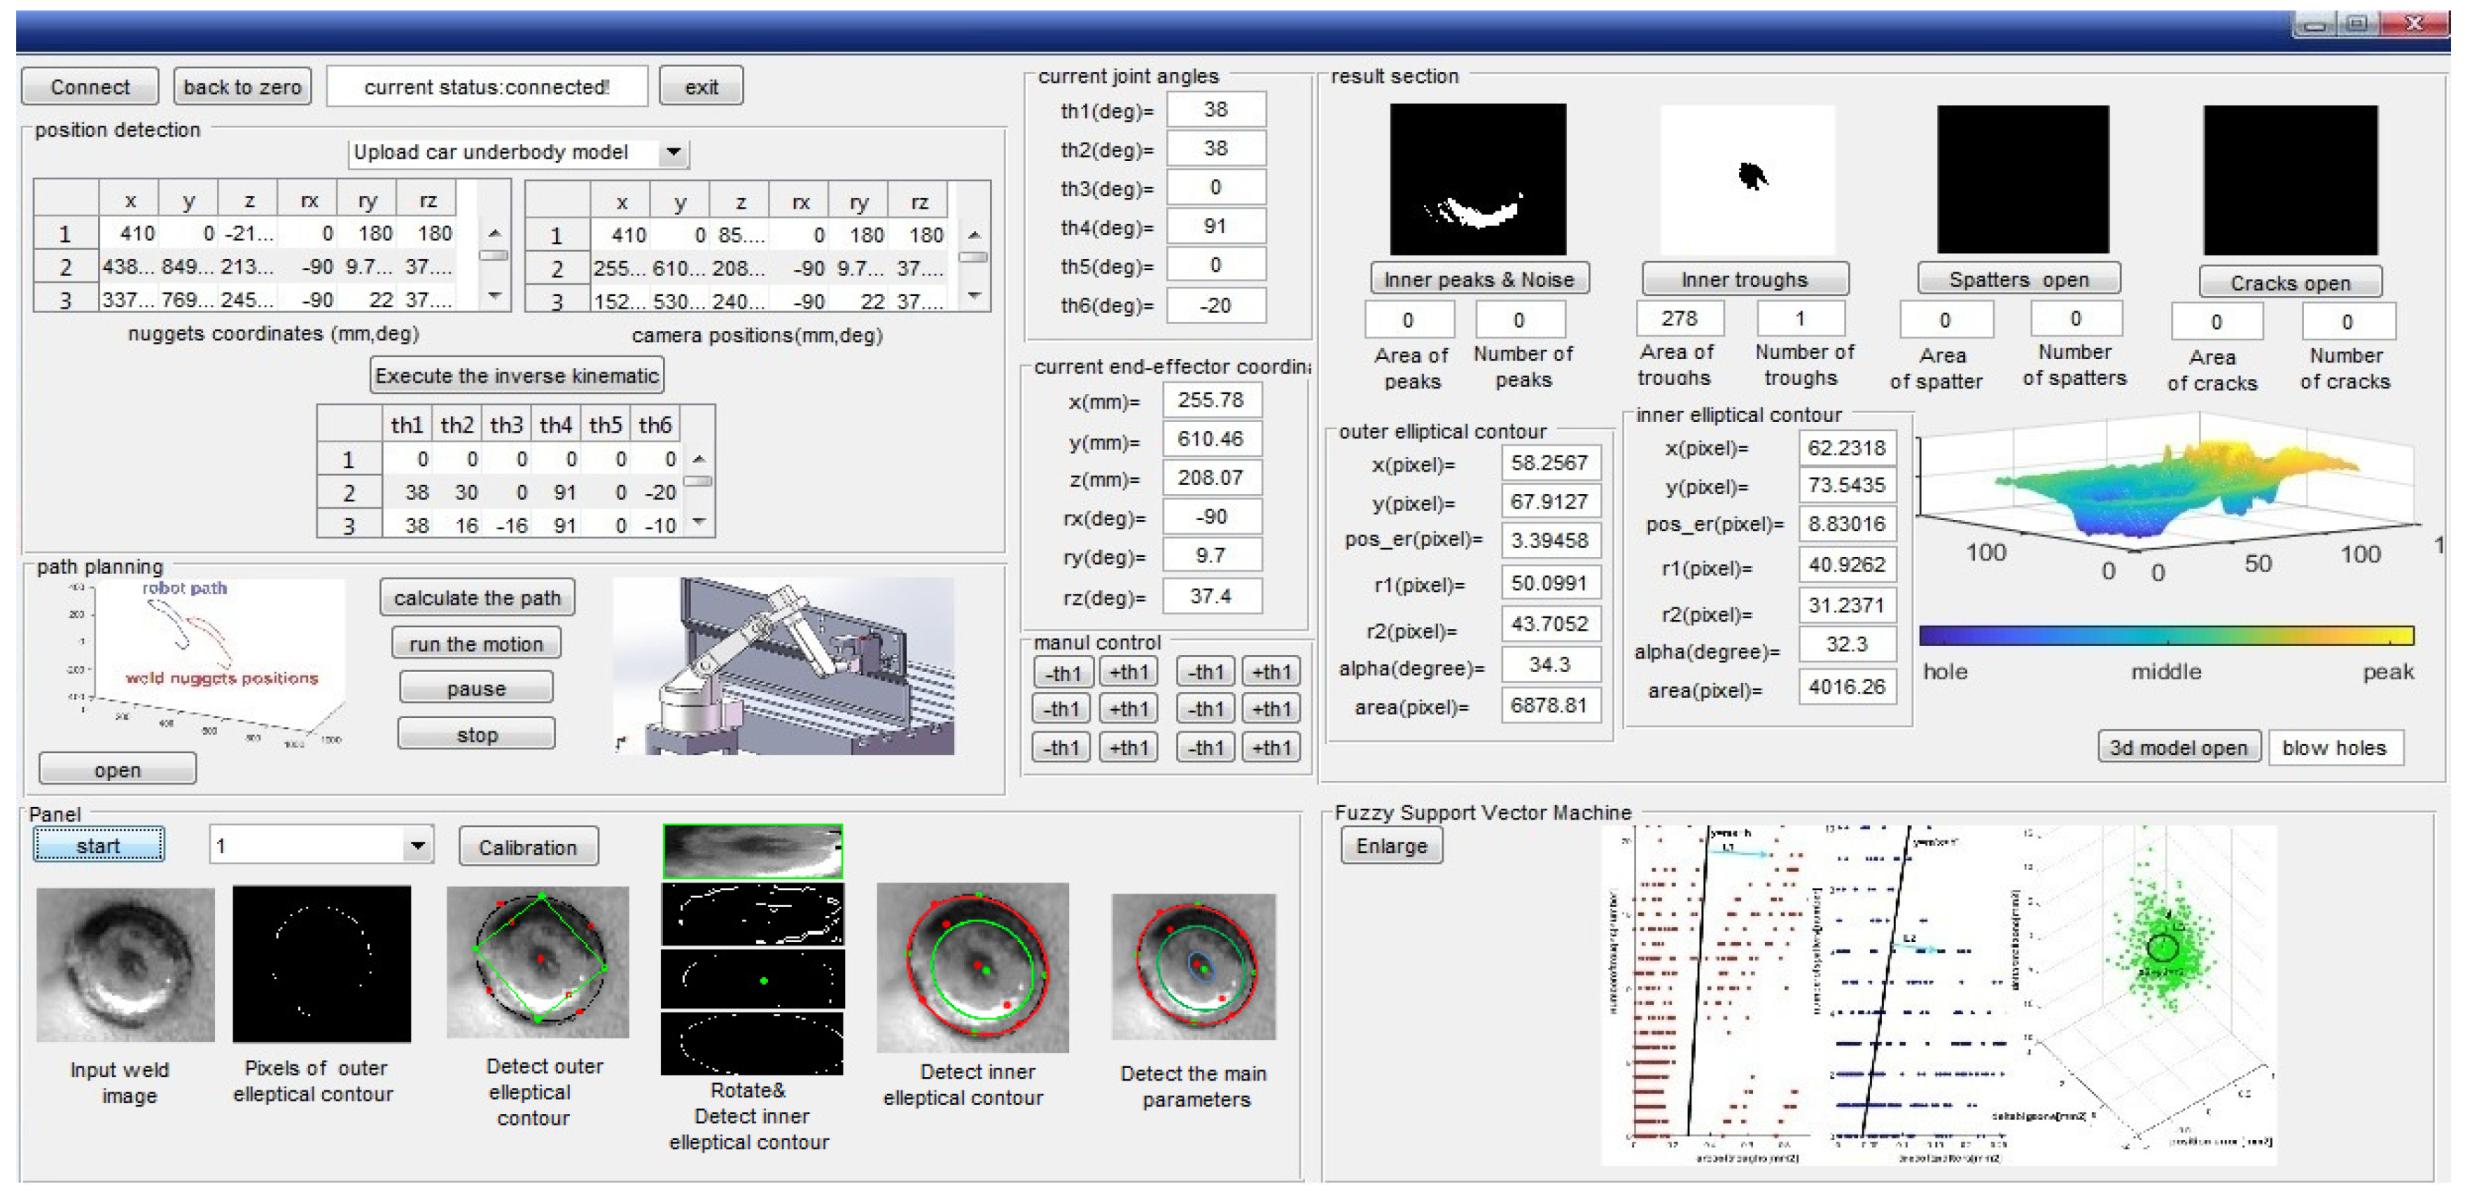
2. Hardware and Software Interface

The proposed work presents an integrated approach of a vision system (as shown in Figure 1) to estimate the quality of RSW in the car underbodies. The hardware of the system consists of a 6-DOF robotic arm with six AC servo motors which are driven by six AC servo drivers and controlled by Galil motion card (DMC-2163) to achieve the robot movement in real-time as well. The feedback to the Galil motion card has been achieved using six absolute position encoders with a resolution of 131,072 pulses per revolution, installed directly on the rotation axes of the AC servo motors. The end effector of the robotic arm is a fixture that carries a charge-coupled device (CCD) digital camera, HC-SR04 ultrasonic sensor, variable intensity lightning, and linear laser light device. A digital camera “MER-125-30UM/C”, which has a high resolution at the rate of 30 frames per second and is mainly suitable for the typical machine vision applications such as surface inspection and defect detection, has been used to collect the images of the RSW. The CCD image sensor is a global exposure and monochromatic Sony sensor chip ICX445 with a 1292(H) × 964(V) array of 8-bit pixels, it can be used to acquire a grayscale image with a light intensity ranging from 0 to 255, where 0 represents the lowest light intensity, and 255 represents the highest light intensity. The images in their turn have been transferred to the computer via the USB2.0 data interface. To ensure diffuse lighting on the surface of the car underbody, get more information about the surface of the weld nugget, and detect the failure mode, a controllable white light-emitting diodes (LEDs) lighting system was installed circularly on the front side of the CCD camera lens. This construction nearly prevents the influence of ambient light and ensures constant homogeneous lighting conditions. The linear laser light has been used to scan the weld nuggets’ surface and find the geometrical position of the weld nugget. Arduino was connected to an HC-SR04 ultrasonic sensor to measure the distance between the camera and the weld nugget and send the measurement results to the system interface on the computer in real-time.
A real-time software provided by a graphical user interface (GUI), as shown in Figure 2, has been developed using C++ to analyze the weld nugget pictures, estimate the quality of the weld, display the results to the human, and control the robot movement. The whole process of the software could be executed within 0.5 s, which meets the requirements of the high mass production environment. The forward and inverse kinematic solutions of the used robotic arm have been embedded within the motion control software. The motion commands have been transferred to the Galil motion card through LAN connection protocol, which in turn sends the control commands to six Mitsubishi AC servo drivers to realize the robot movement on all target weld nuggets. The other function of the software is to execute the embedded image processing algorithms in order to analyze the weld nugget images and predict the weld quality.

3. Positions Detection of the Resistance Spot Welding

In order to reach the target position correctly and accurately, the position of the weld nugget needs to be obtained, and the position where a perfect picture of the weld nugget could be taken also need to be calculated and fed back to the motion control system. It is the key to achieving the synchronization between the camera (end-effector) coordinate system and the weld nuggets’ coordinate system (target system), related to the base coordinate system [24].

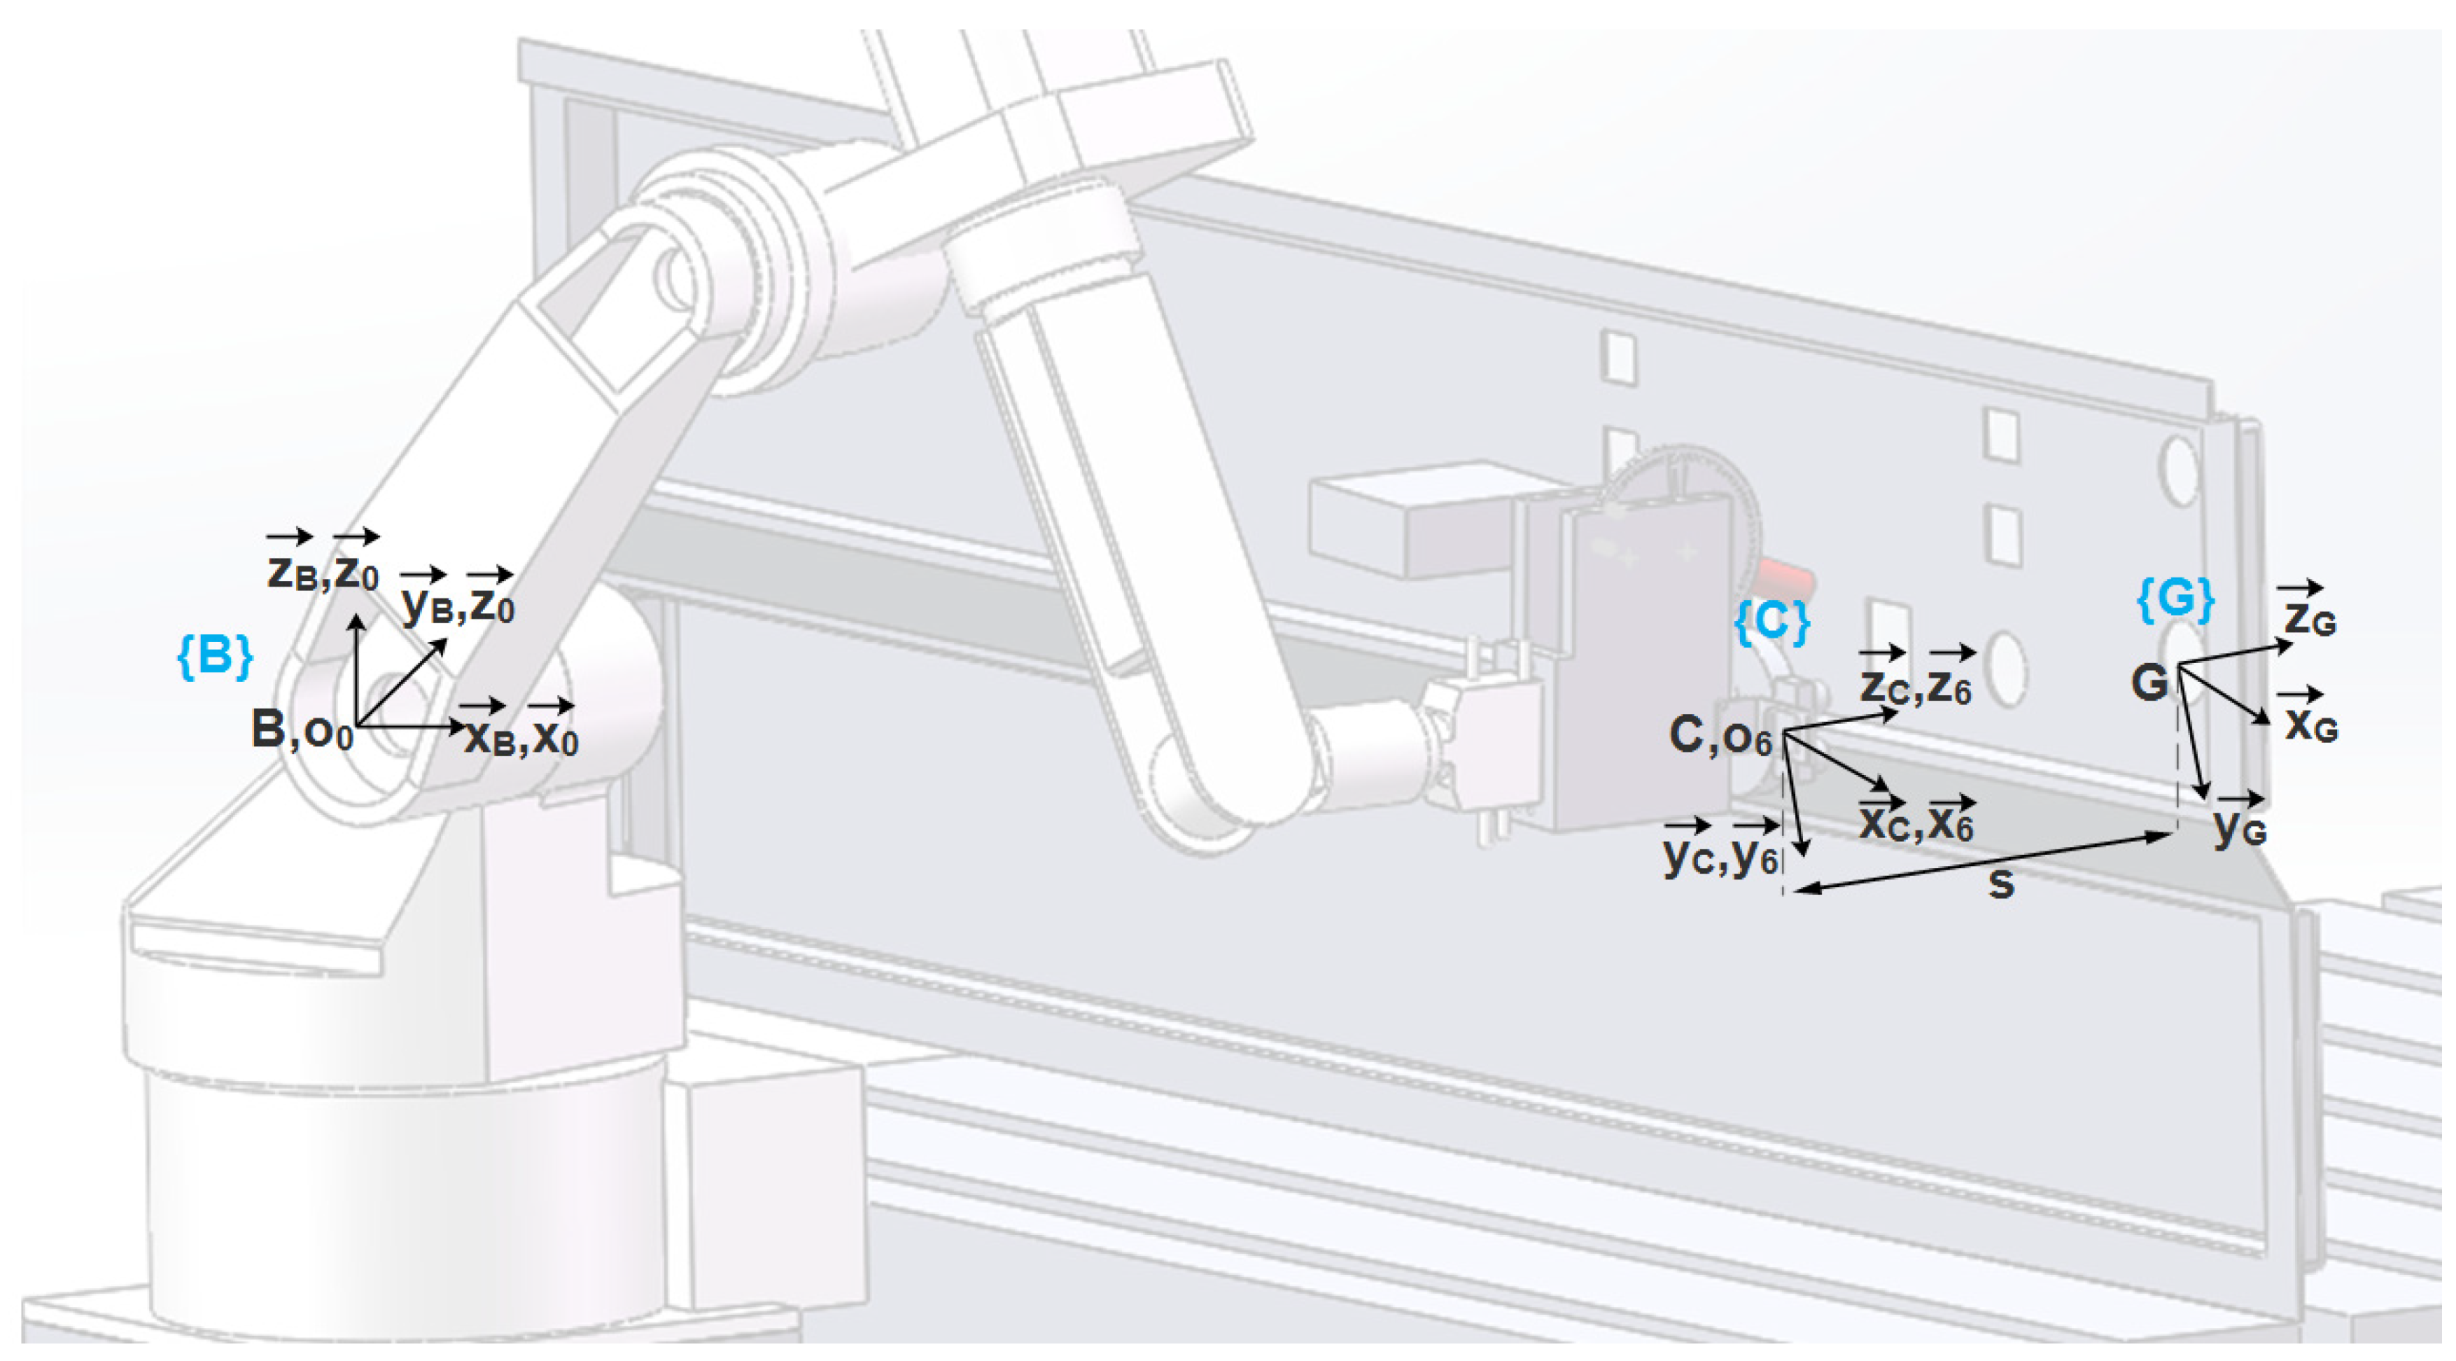
3.1. Weld Nugget’s Position Description

The position description is a description of the relative position and orientation relationship between two coordinate systems (see Figure 3). In the production environment, the 3D model of the car underbody is given so all six coordinates (the position and orientation) of the weld nuggets’ centers relative to the world coordinate system are given. The coordinates of the weld nugget, G, relative to the base coordinate system {B} are given as: G = [ x G y G z G ψ z θ y φ x ] T . Where, x G , y G , and z G refer to the translation coordinates, and ψz, θy, and φx refer to the Roll Pitch Yaw (RPY) angles.
The coordinates of C relative to the base coordinate system { B } can be calculated using the following equation:
[ x C | B y C | B z C | B ] = [ x G s . c φ x s θ y c ψ z s . s φ x s ψ z y G s . c φ x s θ y s ψ z + s . s φ x c ψ z z G s . c φ x c θ y ]
where, S θ and C θ represent sin θ and cos θ respectively, and s represents the best distance between the weld nugget’s center, G , and the end-effector, C . The final results of all the weld nuggets will be used to write a G-code in order to plan and control the motion of the robotic arm.

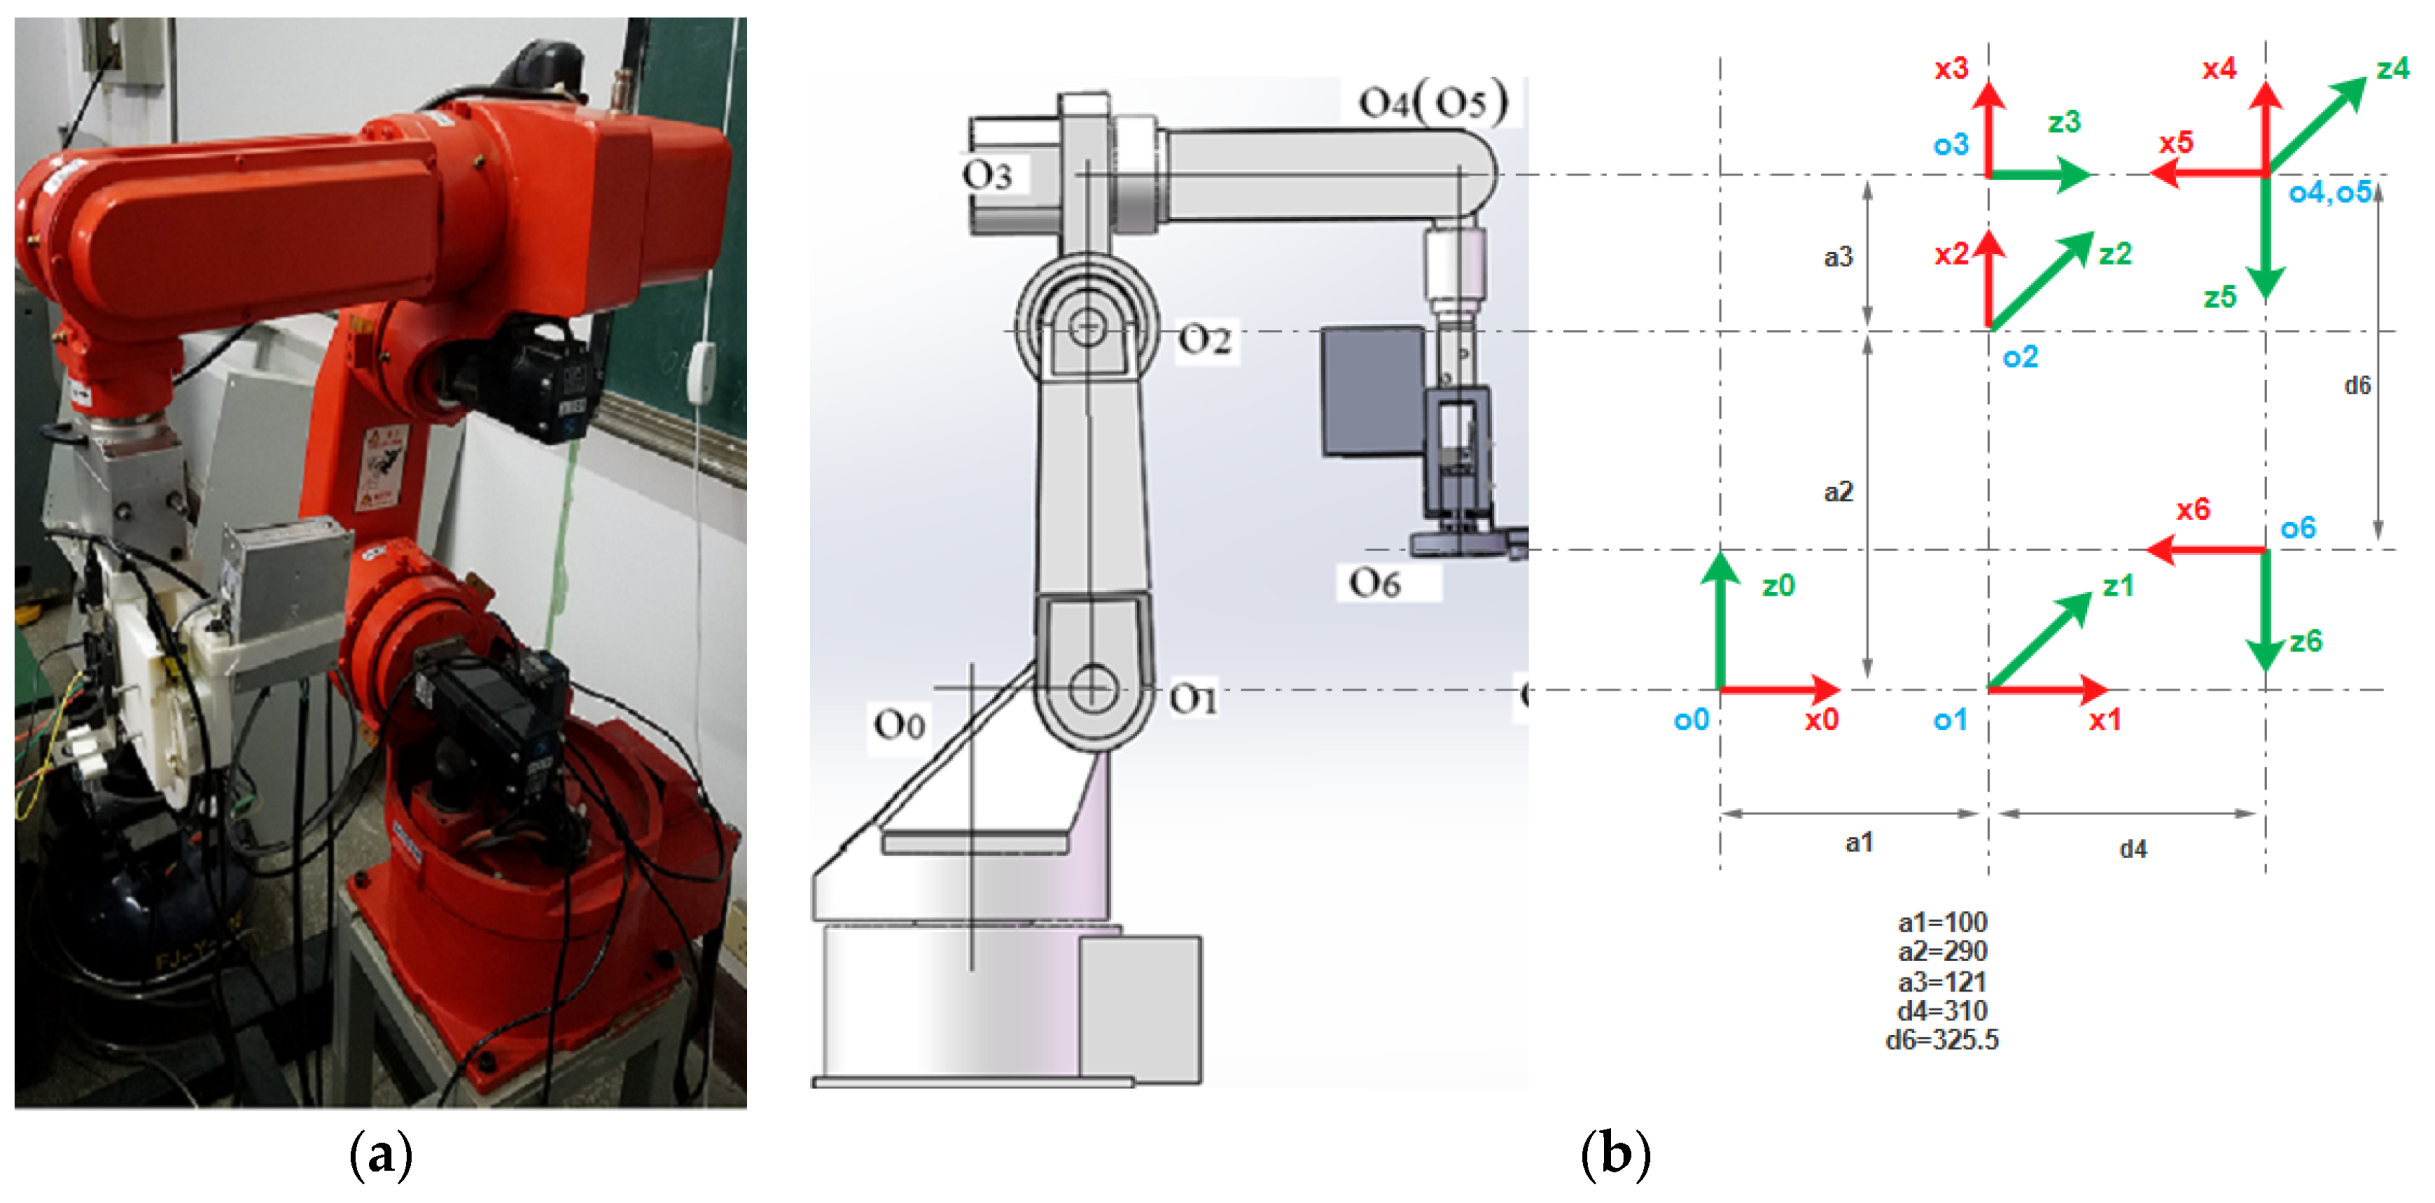
3.2. Establishing the Forward Kinematics of the Robotic Arm

According to the D-H description method [25], the kinematics description of the 6-DOF robotic arm is carried out, the fixed-coordinate coordinate system of each link of the manipulator is established, as shown in Figure 4, and the D-H parameters are shown in Table 1.
The homogeneous transformation matrix, T i 1 i , between each two coordinate systems {i − 1} and {i} is defined through two translations a i   and   d i along the x and z axis respectively, and two rotations α i   and   θ i along the x and z axis respectively, as shown in Equation (2).
T i 1 i = [ c θ i s θ i c α i s θ i s α i a i c θ i s θ i c θ i c α i c θ i s α i a i s θ i 0 s α i c α i d i 0 0 0 1 ]
Equation (2) has been used to calculate the homogeneous transformation matrix for each joint, and the results are shown in Table 2.
The comprehensive transformation matrix of the 6-DOF robotic arm is obtained by multiplying the above transformation matrices in turn:
T B C = T 0 6 = T 0 1 T 1 2 T 2 3 T 3 4 T 4 5 T 5 6
T 0 6 = [ c θ c ψ s φ s θ c ψ c φ s ψ c φ s θ c ψ + s φ s ψ x o 6 / B c θ s ψ s φ s θ s ψ + c φ c ψ c φ s θ s ψ s φ c ψ y o 6 / B s θ s φ c θ c φ c θ z o 6 / B 0 0 0 1 ] = [ s x n x a x p x s y n y a y p y s z n z a z p z 0 0 0 1 ]
Moving from a given position to another with an industrial robot can be a challenging problem. Lozano-Pérez et al. [26] presented a collision-free algorithm for planning a safe path for a polyhedral object moving through known polyhedral objects. This algorithm converts the obstacles so that they represent the place of prohibited positions for an arbitrary reference point on the moving object. Another approach was presented in Reference [27], which posed the path planning problem as a finite time, nonlinear control problem which can be solved by a Newton-Raphson-type algorithm together with an exterior penalty function method. As defined previously, it is simple to detect the robotic arm joints’ configurations from the position and orientation of the end-effector. To move the end-effector to a particular point, the inverse kinematic is solved and instructions are given to the robotic arm’s micro-controller. A specific direction of rotation is provided to each servo motor of each joint.

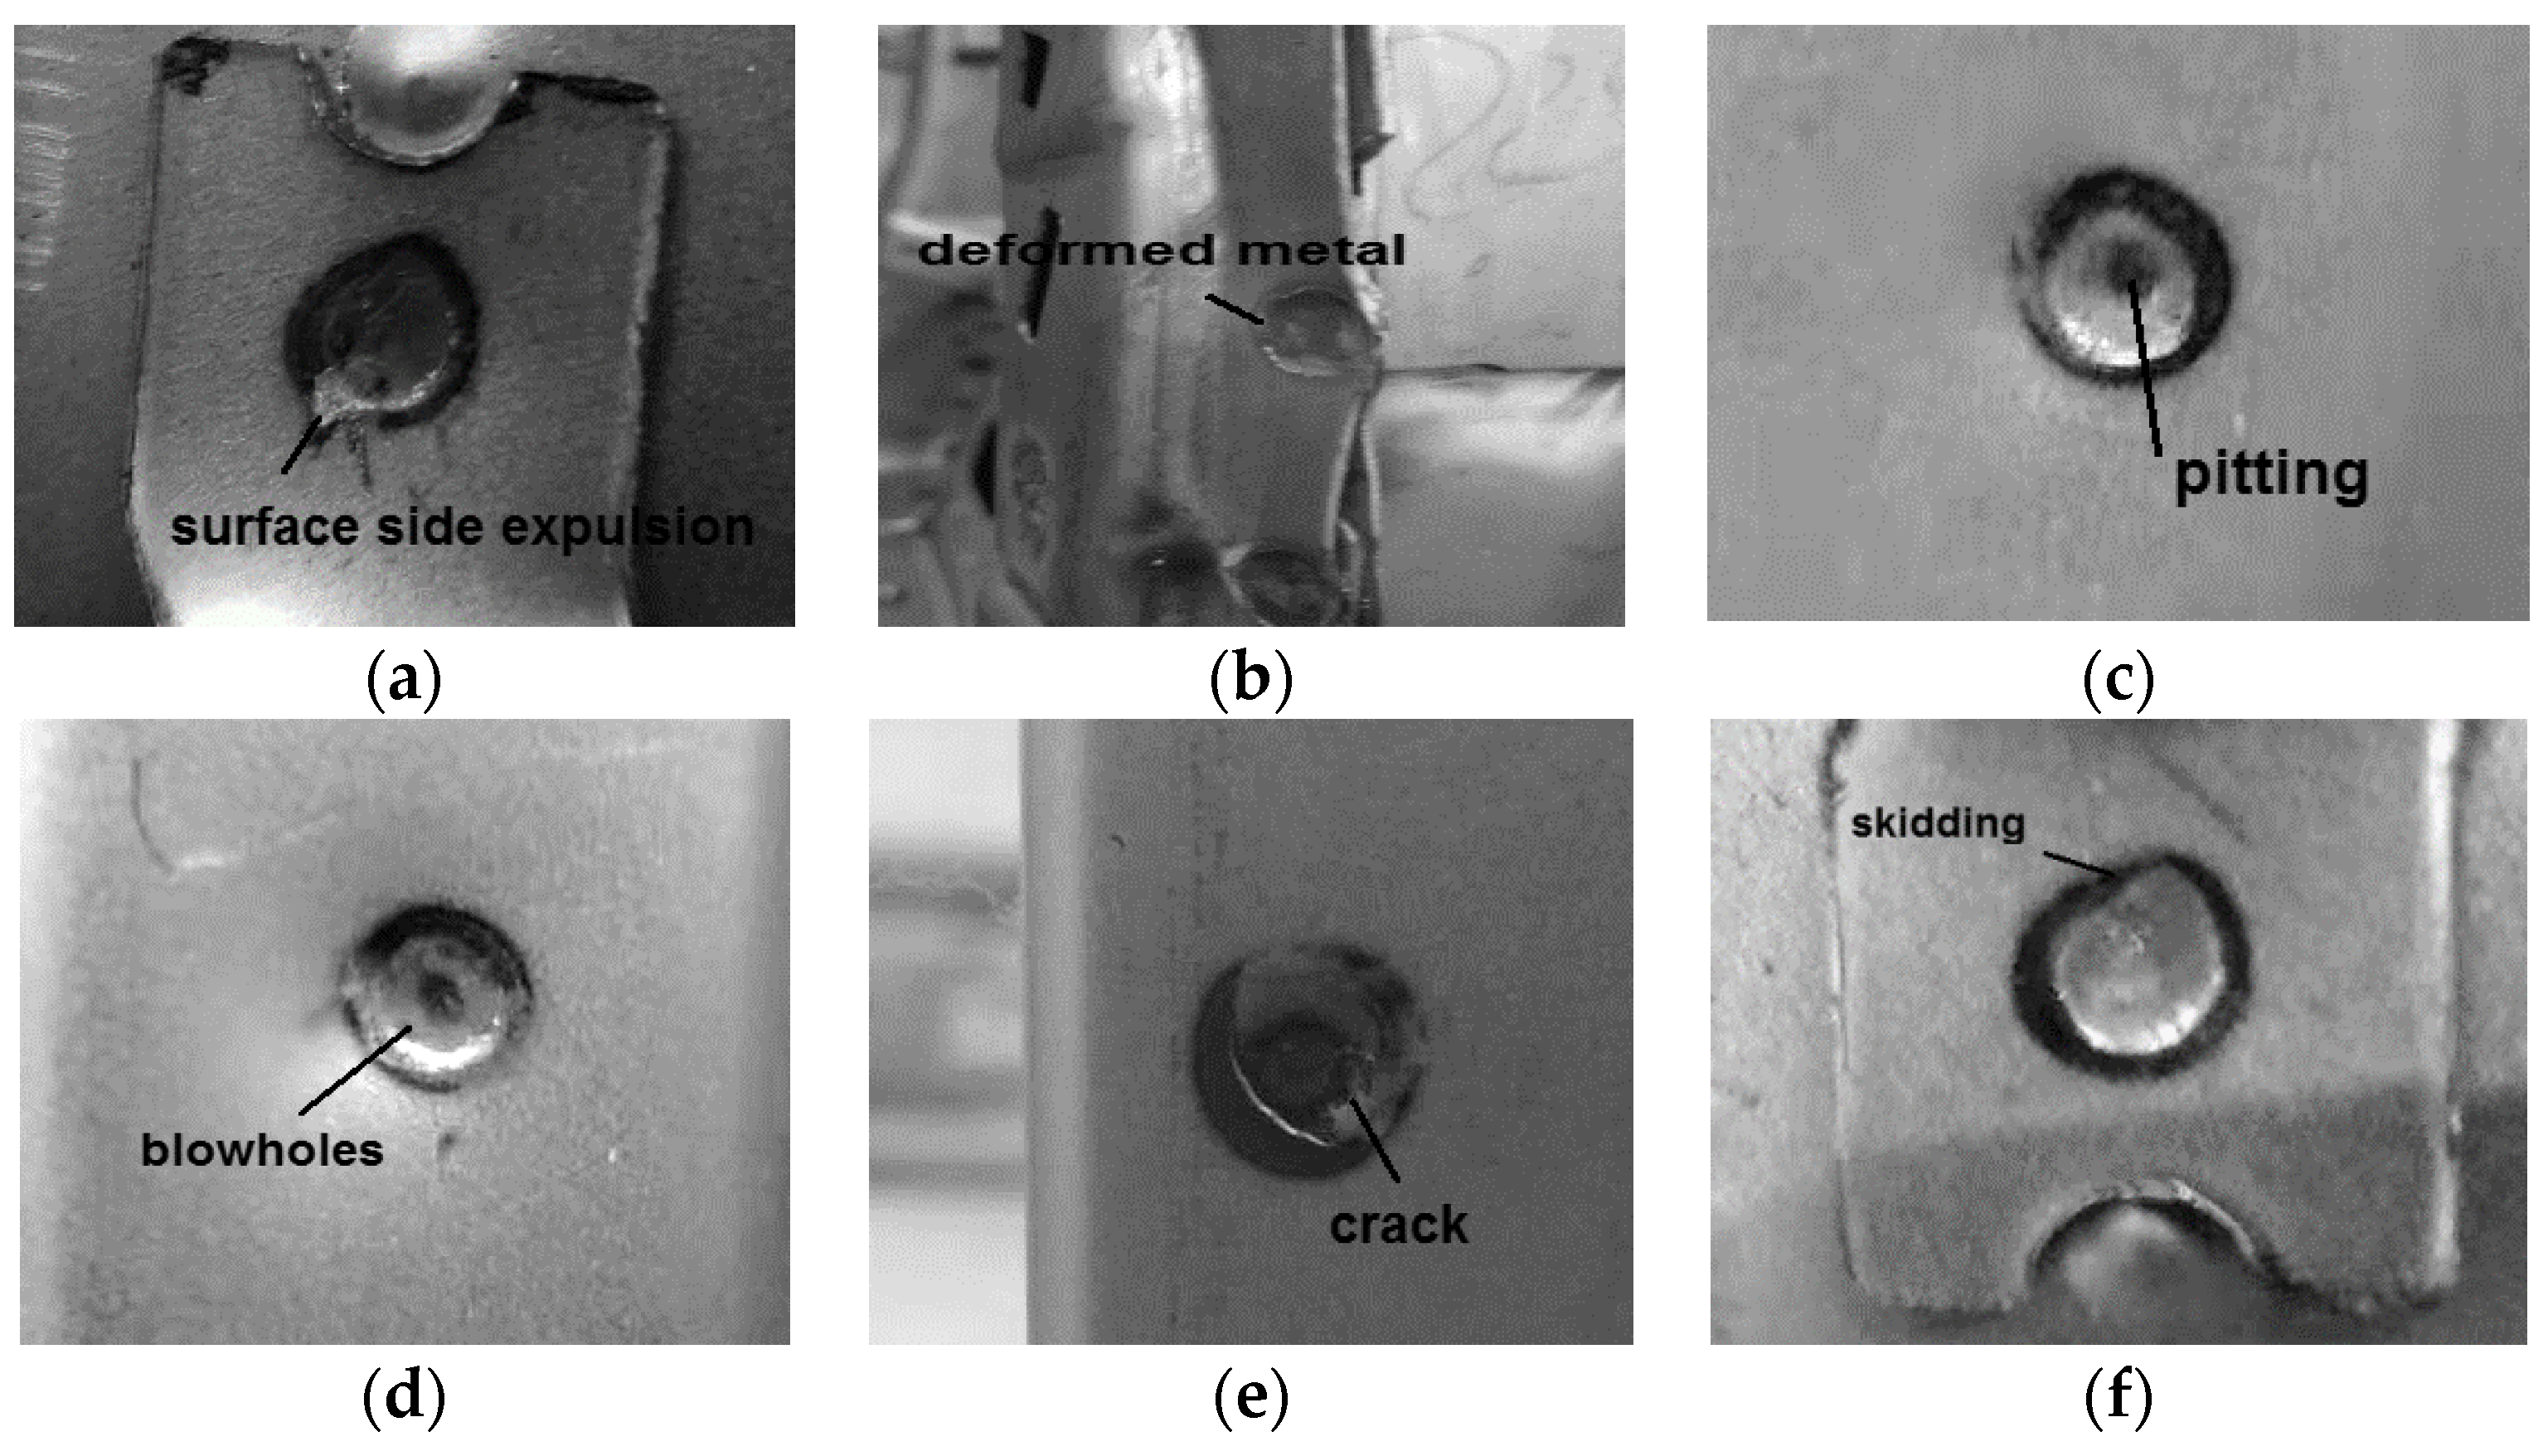
4. Resistance Spot Welding’s Failure Modes

The car underbodies used in this paper are made up of high-strength steels of 300–700 MPa with 1.2–2 mm thickness and include various modes of weld nuggets. The weld nuggets are mainly distributed in the car underbody on the left and right sides, the front and rear floors, the engine room, and the wheel cover area. For some parts, it is not easy to see the weld nuggets on them. Some are covered by other parts and the weld nuggets on them cannot be checked easily. The typical good RSW is shown in Figure 5.
For a specific sheet metal density, the selection of the right size of the welding is critical. The weakness could occur as a result of the subside weld nuggets, while more cost is needed in case of oversized weld nuggets. Regarding a front panel used for the experimental work in this study, which has average thickness t = 2 mm and is made up of steel, the optimal nugget’s diameter is d = 4 t = 5.6   mm . The weld nuggets are elliptical-shaped. During the welding process, various types of flaws may happen. Some flaws can be found by visual inspection, such as those which include cracks. There are surface conditions that may cause premature failure of the weld: excessive wear or damage to the hardware, equipment downtime, or unacceptable surface appearance. The CCD camera with suitable parameters is very sensitive to the surface conditions of the weld nugget and very practical to detect different kinds of spot-welding failure modes. Common surface conditions are as shown in Figure 6.
Figure 5 and Figure 6 show images of weld nuggets with their geometrical characteristics. The inner fusion zone of the weld nugget is contoured by the inner elliptical contour, while the heat-affected zone of the weld nugget is detected by the outer elliptical contour. Surface side expulsion is when molten metal is blown out from under the weld tips to form spatters located close and outside of the outer elliptical contour in the base metal zone. This occurs when too much heat is generated at the weld tip interface. The most likely causes are low weld tip force, high weld current, and excessively large weld tips.
Deformed metal is when the metal surrounding the weld nugget is bent or distorted. Deformed metal is most likely caused by incorrect weld gun position, angle or movement, incorrectly aligned weld tips, or incorrect part position.
Pitting is when the arcing current burns a black hole into the weld nugget’s surface. It is most likely caused by short squeeze time, the buildup of sealant on the weld tips, dirt contamination on the metal, or short hold time. A blowhole is created when molten metal is squeezed between the weld tips. This occurs when too much heat is generated at the weld tip interface. Inner troughs refer to the existence of voids (blowholes) or cracks inside the fusion zone. The inner peaks refer to the superficial protuberances around the blowhole.
Interfacial failure is governed by a crack. The crack occurs when there is an extreme heat change in the weld area. Crack is most likely caused by high weld current or long hold time. Skidding occurs when the weld tips slide on the surface of the metal. Skidding is most likely caused by excessive weld tip force or incorrect weld tip alignment. Weld tip force presses the metal together.
We tested our systems on different kinds of spot welding with different kinds of materials and thicknesses. Also, we asked the workers to play with the target values of the welding parameters, such as current, hold time, weld time, aligned electrodes vs. misaligned ones, and new or worn electrodes, in order to create welds with defects, because normally it is easy to make normal welds and not easy to make welds with failures. The following table shows the target values of the welding parameters of the RSW machine, where the cycle is 1/50 s in a 50 Hz power system (Table 3).

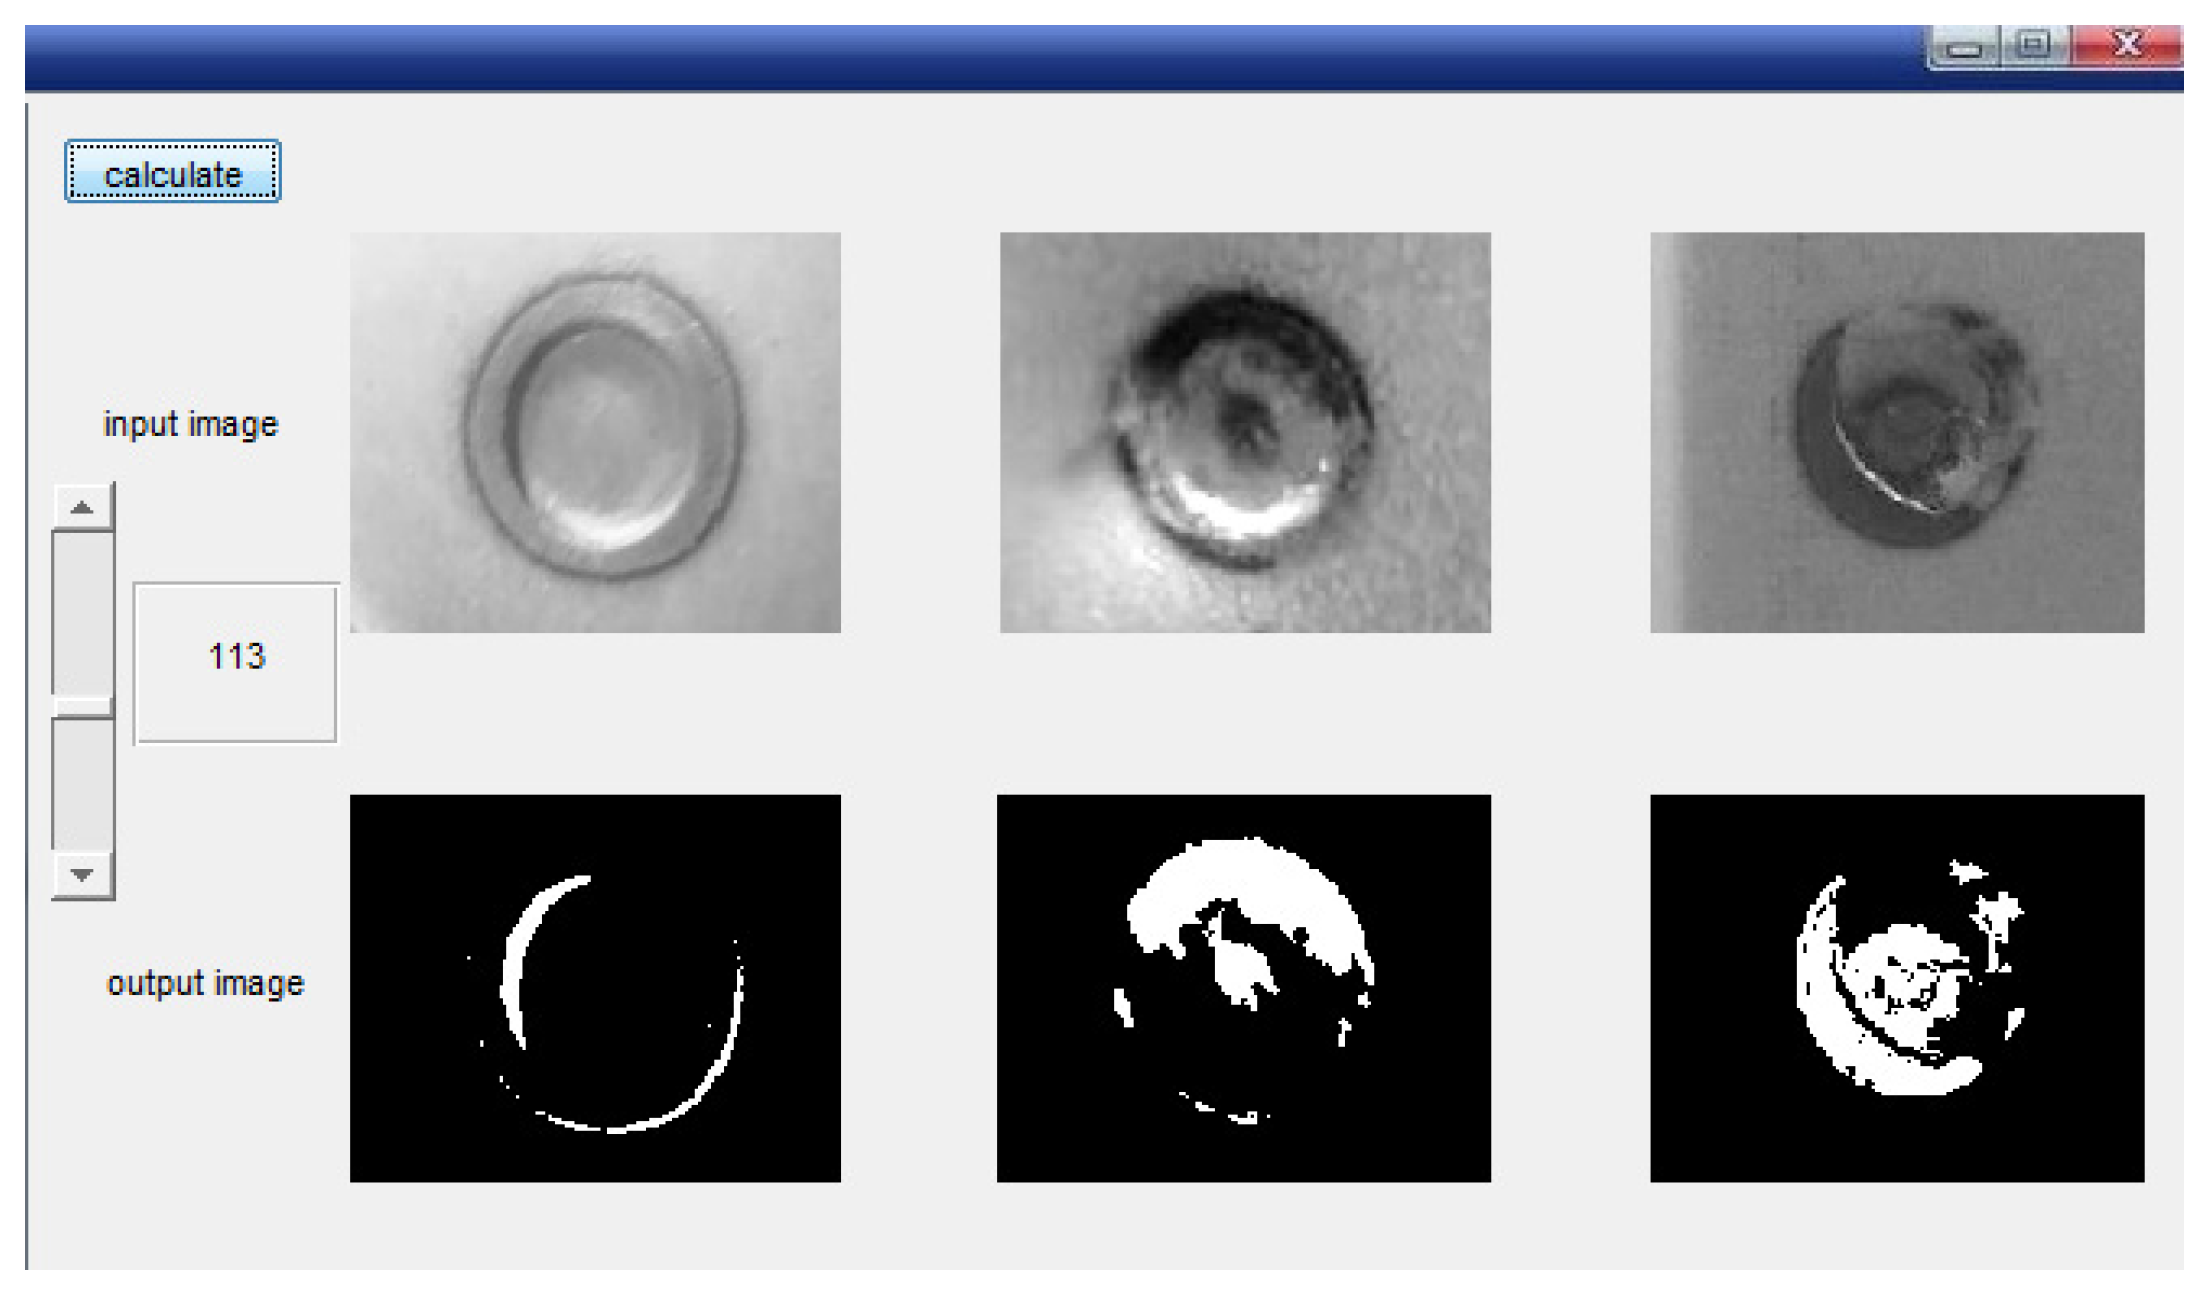
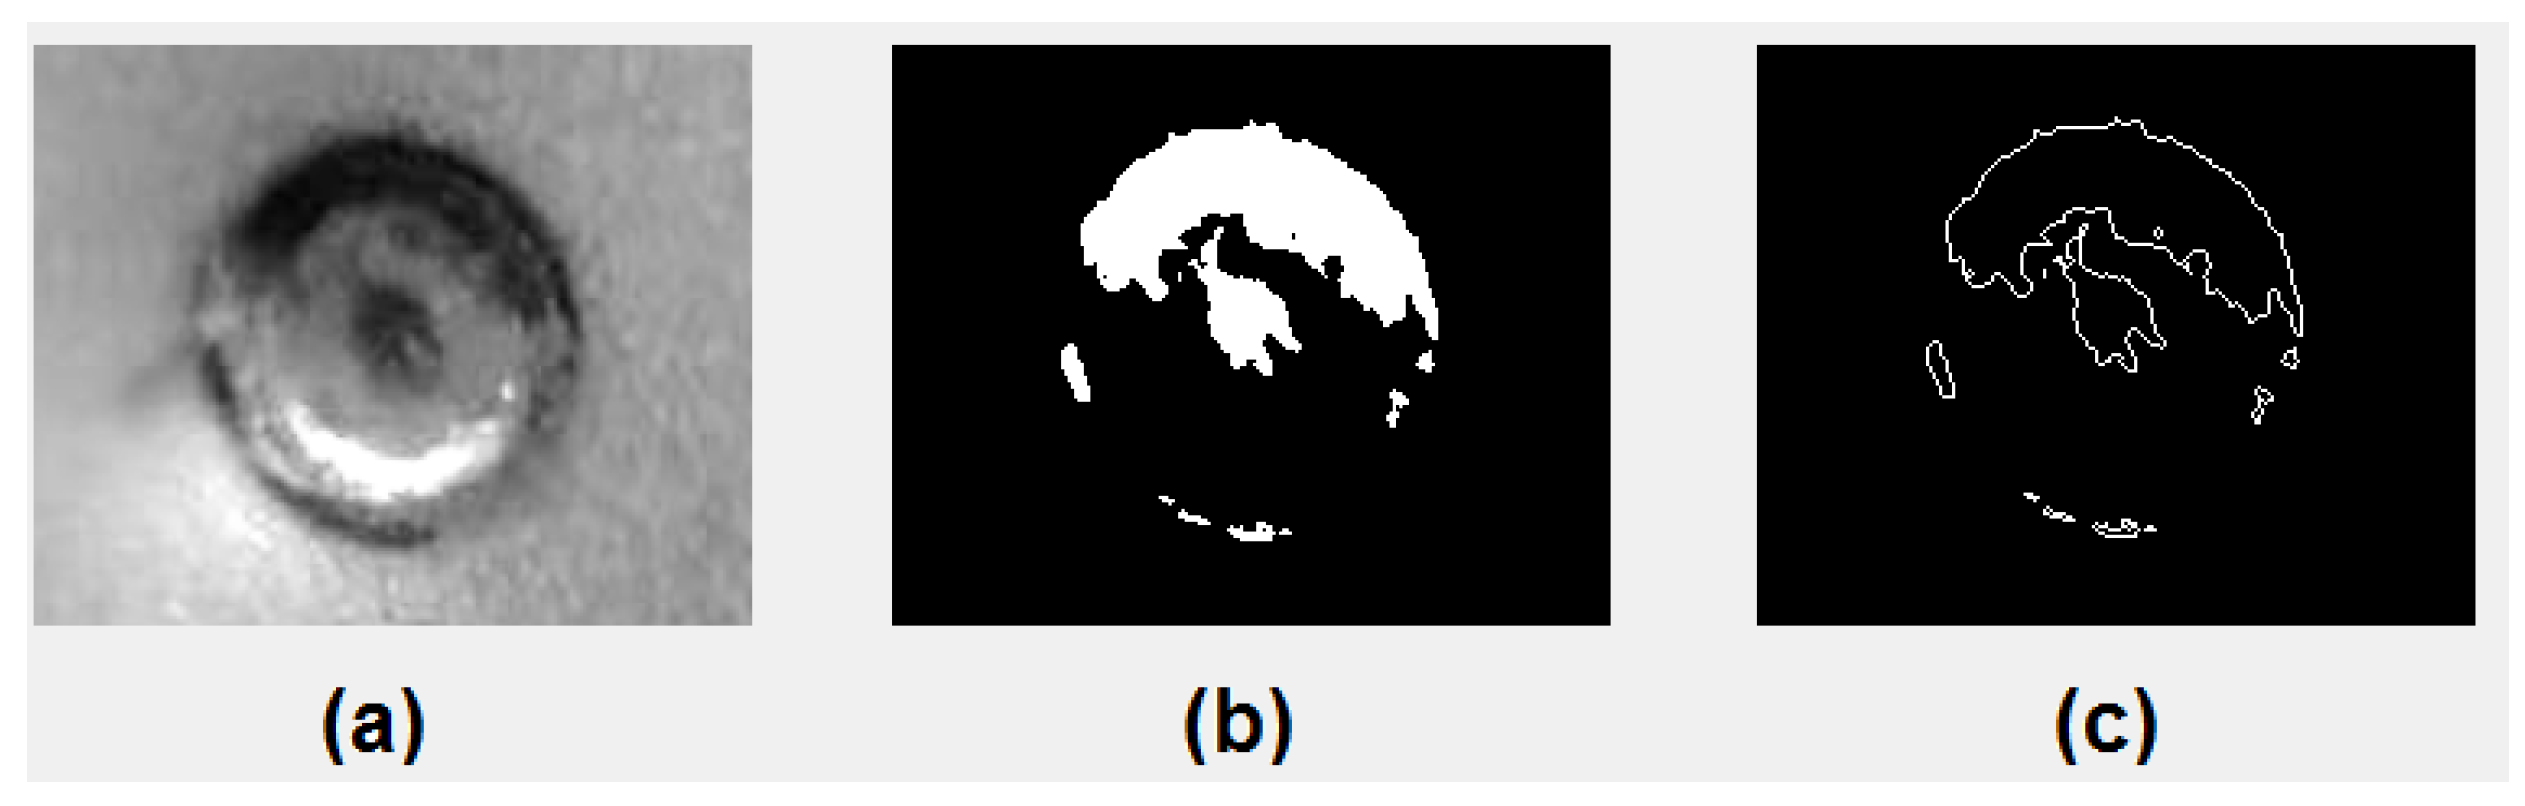
5. Data Extraction from the Weld Nugget’s Surface Using Improved Image Processing Methods

5.1. Calibration

The image processing algorithms, which are embedded in the system software on the supervisor computer, are employed to process the weld nugget images and extract features mentioned previously. These data will be used in the next training process in order to finally predict the weld quality. The original grey images, which are taken by the CCD camera, are inputted to the algorithms. The best illumination density of the controllable lightening device and the best gradient value of these images have been tuned to get the best difference in contrast between the weld nugget and the metal background and to reduce the effect of the salt and pepper noise in the weld image. Sobel operators and thresholding functions have been used to achieve the image segmentation. These factors could be obtained separately during the preliminary calibration stage of the proposed system based on the lightening conditions of the environment. The main interface, which was designed by C++, is provided with this function to tune these values for each work environment. By clicking on the pushbutton called “Calibration” in the main interface shown in in Figure 2, the following interface will appear (see Figure 7):

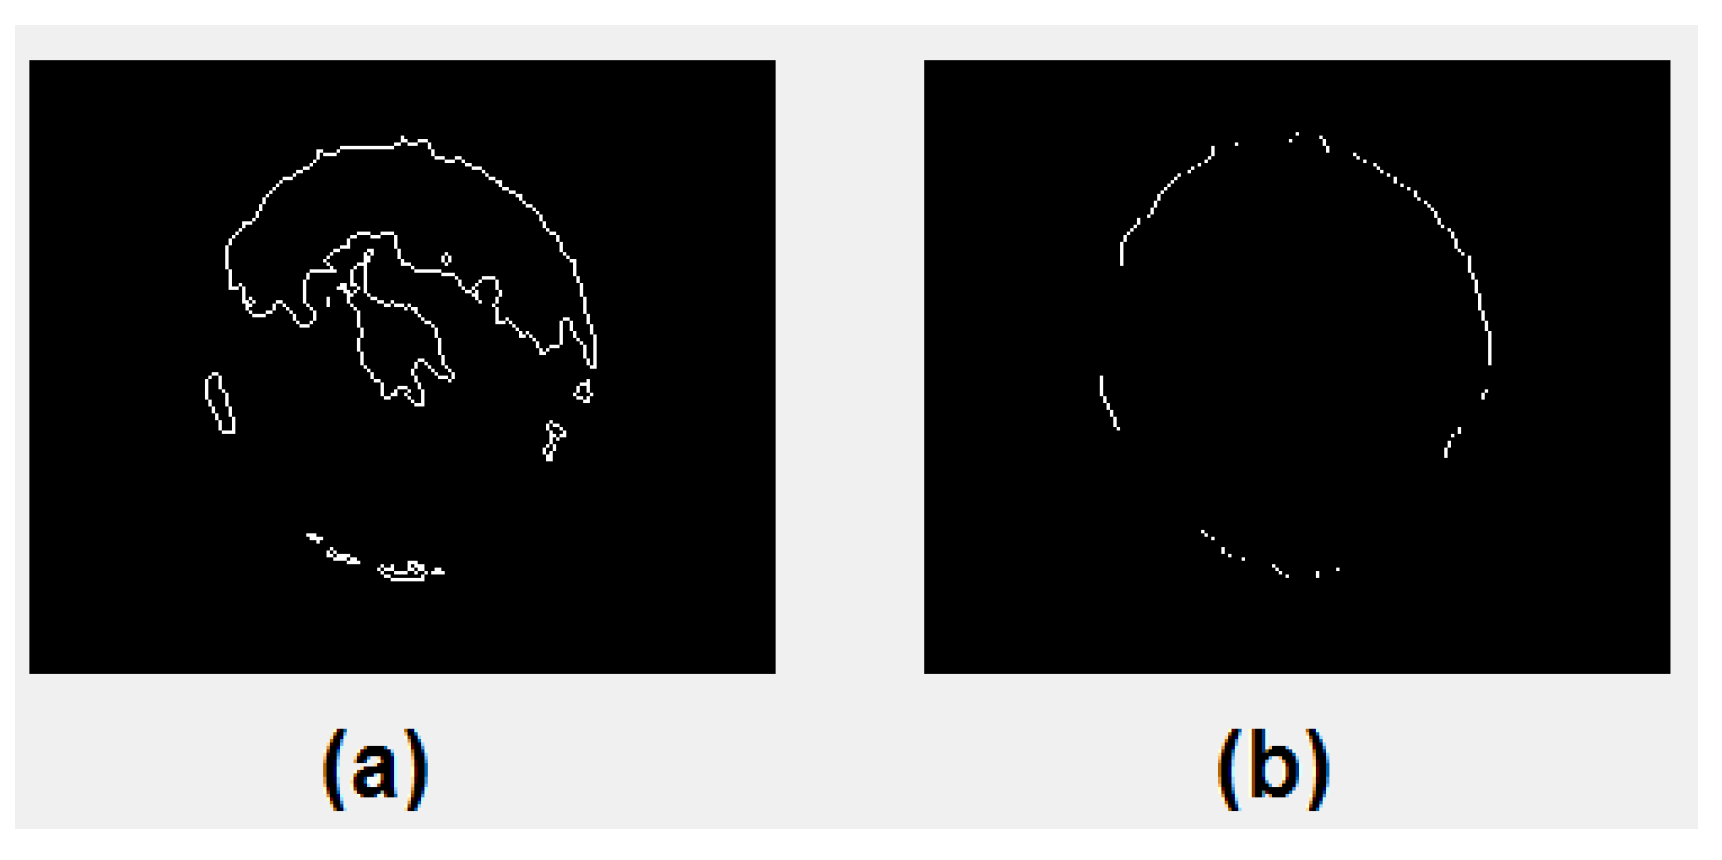
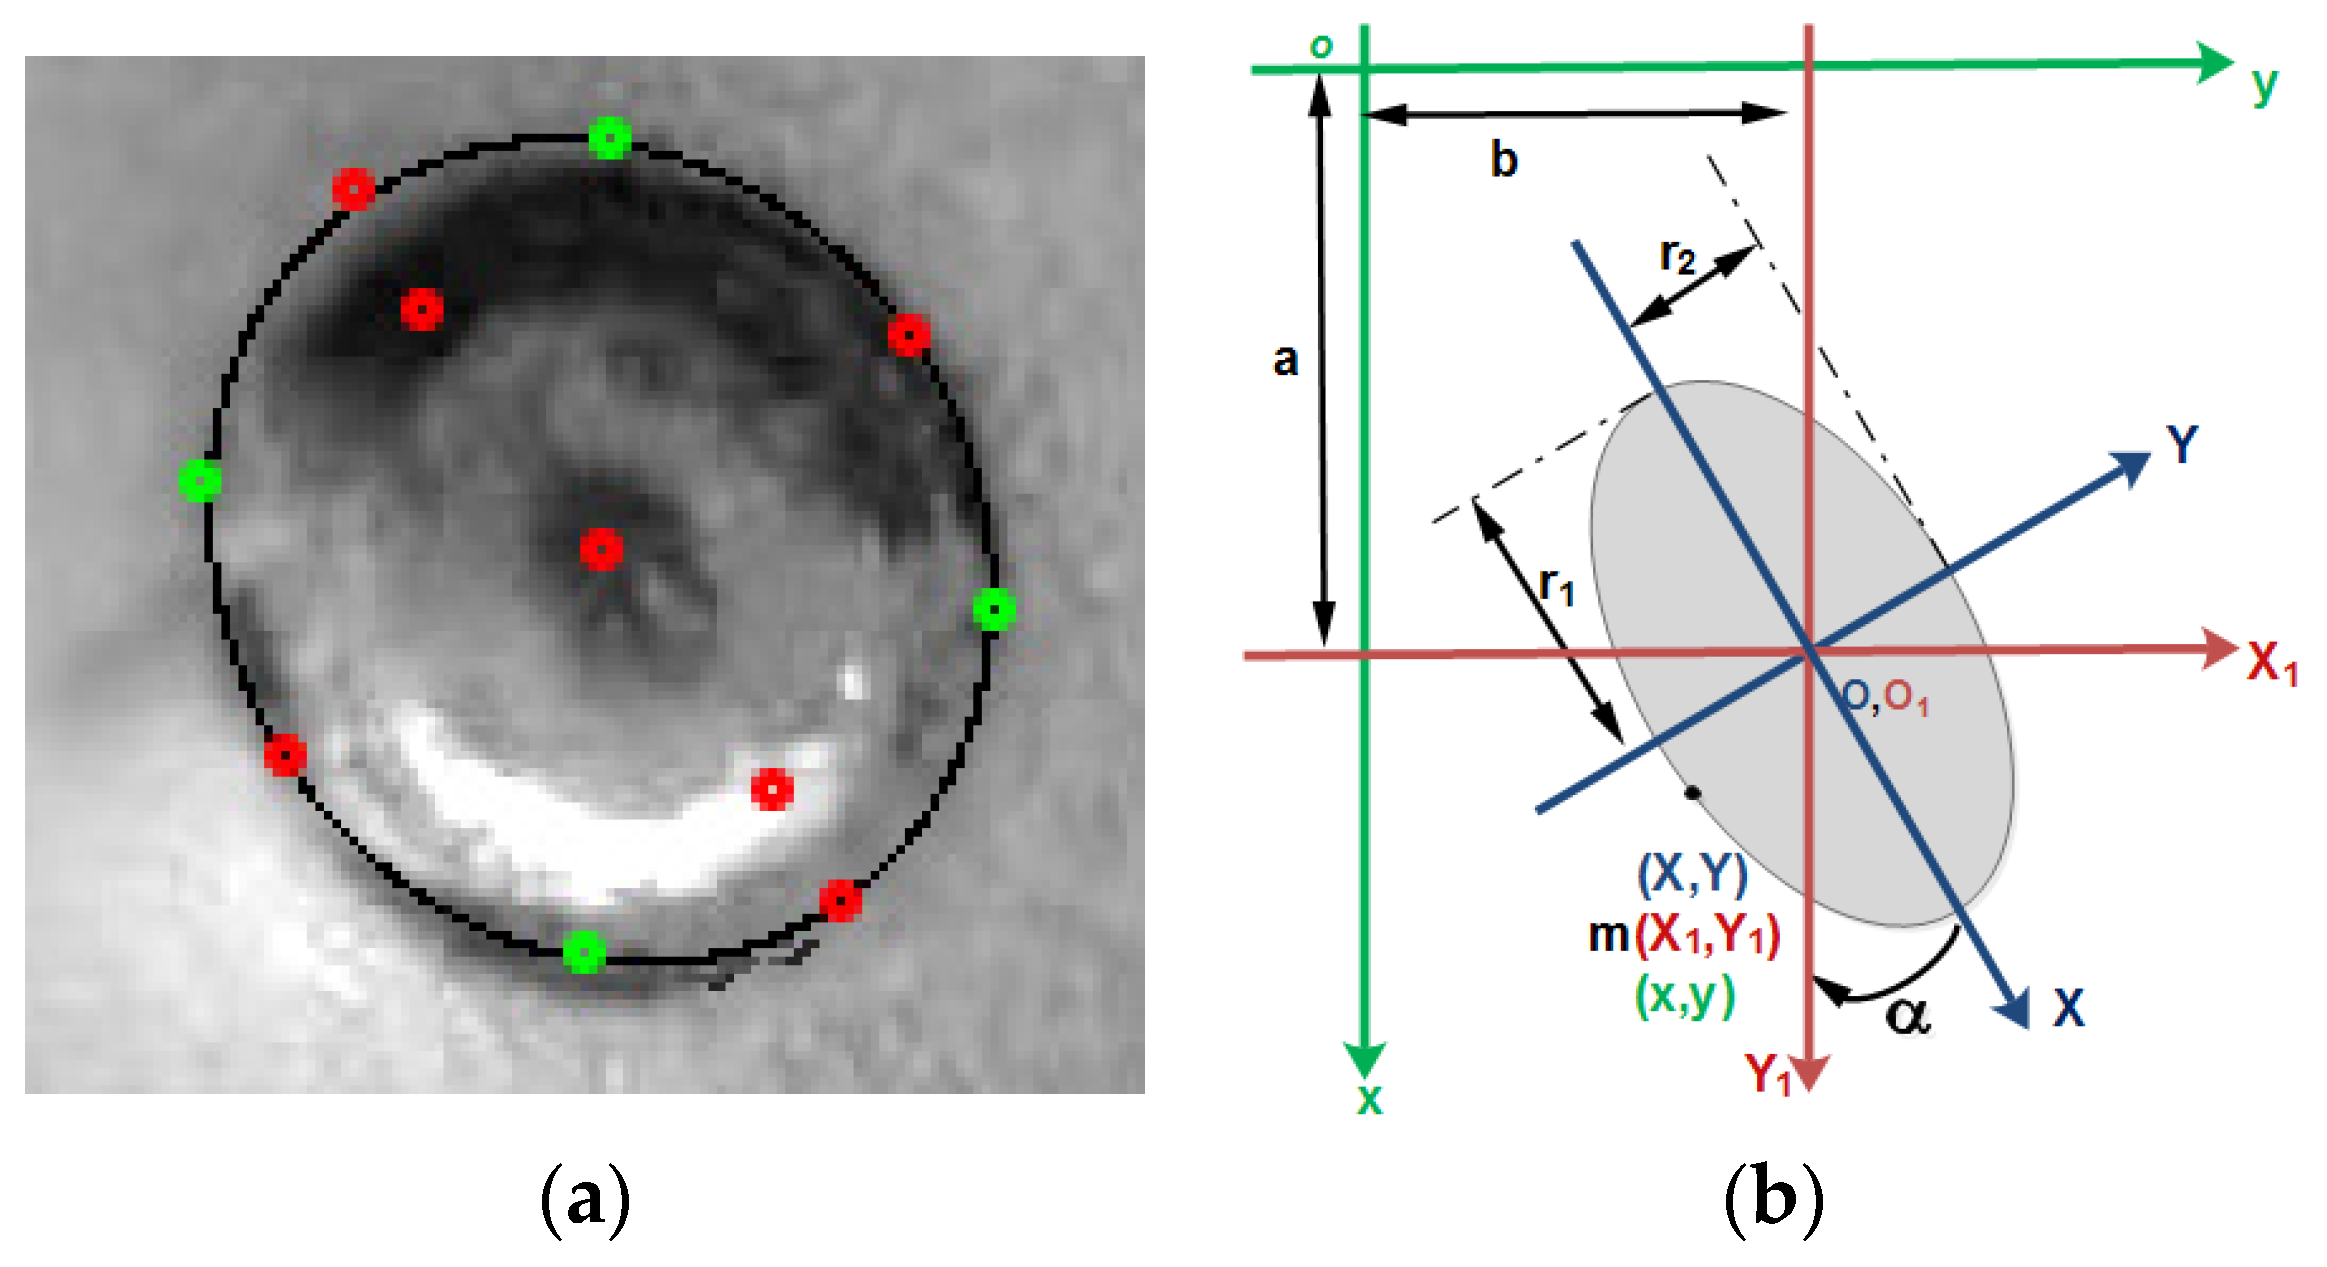
5.2. Heat-Affected Zone Contour Detection

Then, morphological dilation operators with two linear vertical and horizontal structuring elements and flood-fill operations have been used to remove the gaps and fill the holes respectively, in the resulting binary gradient image. Gaps and holes refer to a small area of the black background pixels surrounded by white forward pixels. Next, all the objects, which may be connected to the borders, have been removed by using border clear function. After that, all the pixels which belong to the perimeters (a pixel is part of the perimeter if it is nonzero and connected to at least one zero-valued pixel) of the segmented areas are isolated while other pixels are converted into a background pixel. The resulting image is shown in Figure 8 below:
Figure 8c shows the most intense lines in the original picture of the weld nugget in white colors with a black background. These lines refer to the most likely locations for the pixels’ existence. Usually, those pixels belong to the inner and outer contours of the whole weld nugget, or they belong to inside the fusion zone, and very few out of the outer contour of the weld nugget. The goal is to split these pixels into two images. Figure 9b contains only the pixels which belong to the outer contour of the weld nugget. To execute that, Figure 8c has been divided into 4 quarters in order to check the white pixels’ locations separately. In each row, only those white pixels closest to the image border were selected, while the rest are converted to zero. Whenever white pixels are found in two consecutive rows, the one closest to the border is preserved and the other one turns into zero.
The information gathered from all four quarters is then displayed, according to their original location, in Figure 9b. This method is called the “location-based selection of pixels” and its process is shown in Figure 10.
By using the newton method with the “least-squares fitting curve” algorithm for fitting an ellipse to a set of points, the most likely ellipse curve of the white pixels has been detected as shown in Figure 11a. In Figure 11b, the coordinates system of the weld nugget has been established.
A x 2 + B x y + C y 2 + D x + E y + F = 0
The least-squares fitting curve algorithm is used to determine the coefficients A, B, C, D, E, and F in the last equation of the outer elliptical contour.
The center coordinates, radius, and angle of the ellipse are determined using the following equations:
a = 4 A C D + B 2 D + 2 A E B D B 2 8 A 2 C 2 A B 2 b = 2 A E D B 4 A C + B 2 r 1 , 2 2 = ( A + C ) ± ( A + C ) 2 4 ( A a 2 + C b 2 + a b B F ) 2
where ( a , b ) , the center coordinates of the weld nugget related to the image, are the coordinates system. r 1 , 2 represents the small and big radius of the ellipse. The angle α of the ellipse is calculated by solving these equations:
A = r 2 2 cos 2 α + r 1 2 sin 2 α B = 2 ( r 1 2 r 2 2 ) cos α sin α C = r 2 2 sin 2 α + r 1 2 cos 2 α
In the case of α = 0 :
A = r 2 2 B = 0 C = r 1 2 D = 2 a r 2 2 E = 2 b r 1 2 F = r 1 2 r 2 2 + r 2 2 a 2 + r 1 2 b 2
The previous three equations are concluded using these formulas:
( X ) 2 r 1 2 + ( Y ) 2 r 2 2 = 1 X = X 1 cos α Y 1 sin α , Y = X 1 sin α + Y 1 cos α X 1 = x a , Y 1 = y b

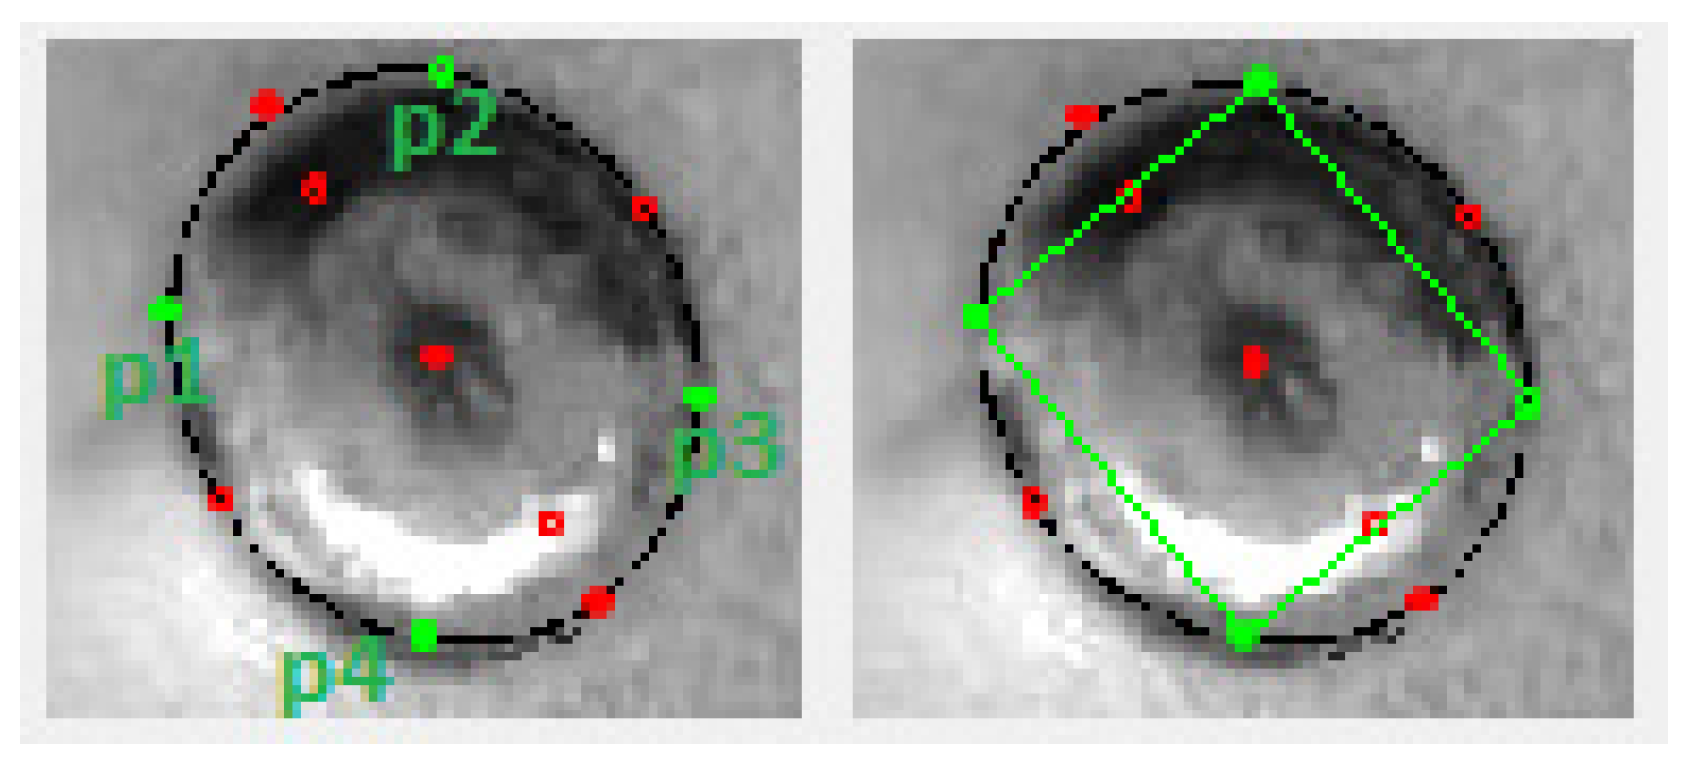
5.3. Detect the Biggest Rectangle Area Inside the Outer Contour of the Weld Nugget

After detecting the outer contour, the inner contour is wanted. To detect it, the biggest rectangle area, p 1 p 2 p 3 p 4 , inside the outer contour of the weld nugget has been taken. The four corners have been detected based on the focus points f 1 and f 2 and the latus rectums of the ellipse p 1 p 2 and p 3 p 4 , as shown in Figure 12.
The parameter f f is called the foci of the ellipse, and is calculated using this formula:
f f = r 1 2 r 2 2
The coordinates of f 1 and f 2 are:
X f 1 = r 1 2 r 2 2 , X f 2 = r 1 2 r 2 2 Y f 1 = Y f 2 = 0
Using Equations (9), (10), and (11), the coordinates of f 1 and f 2 can be calculated related to the image frame.

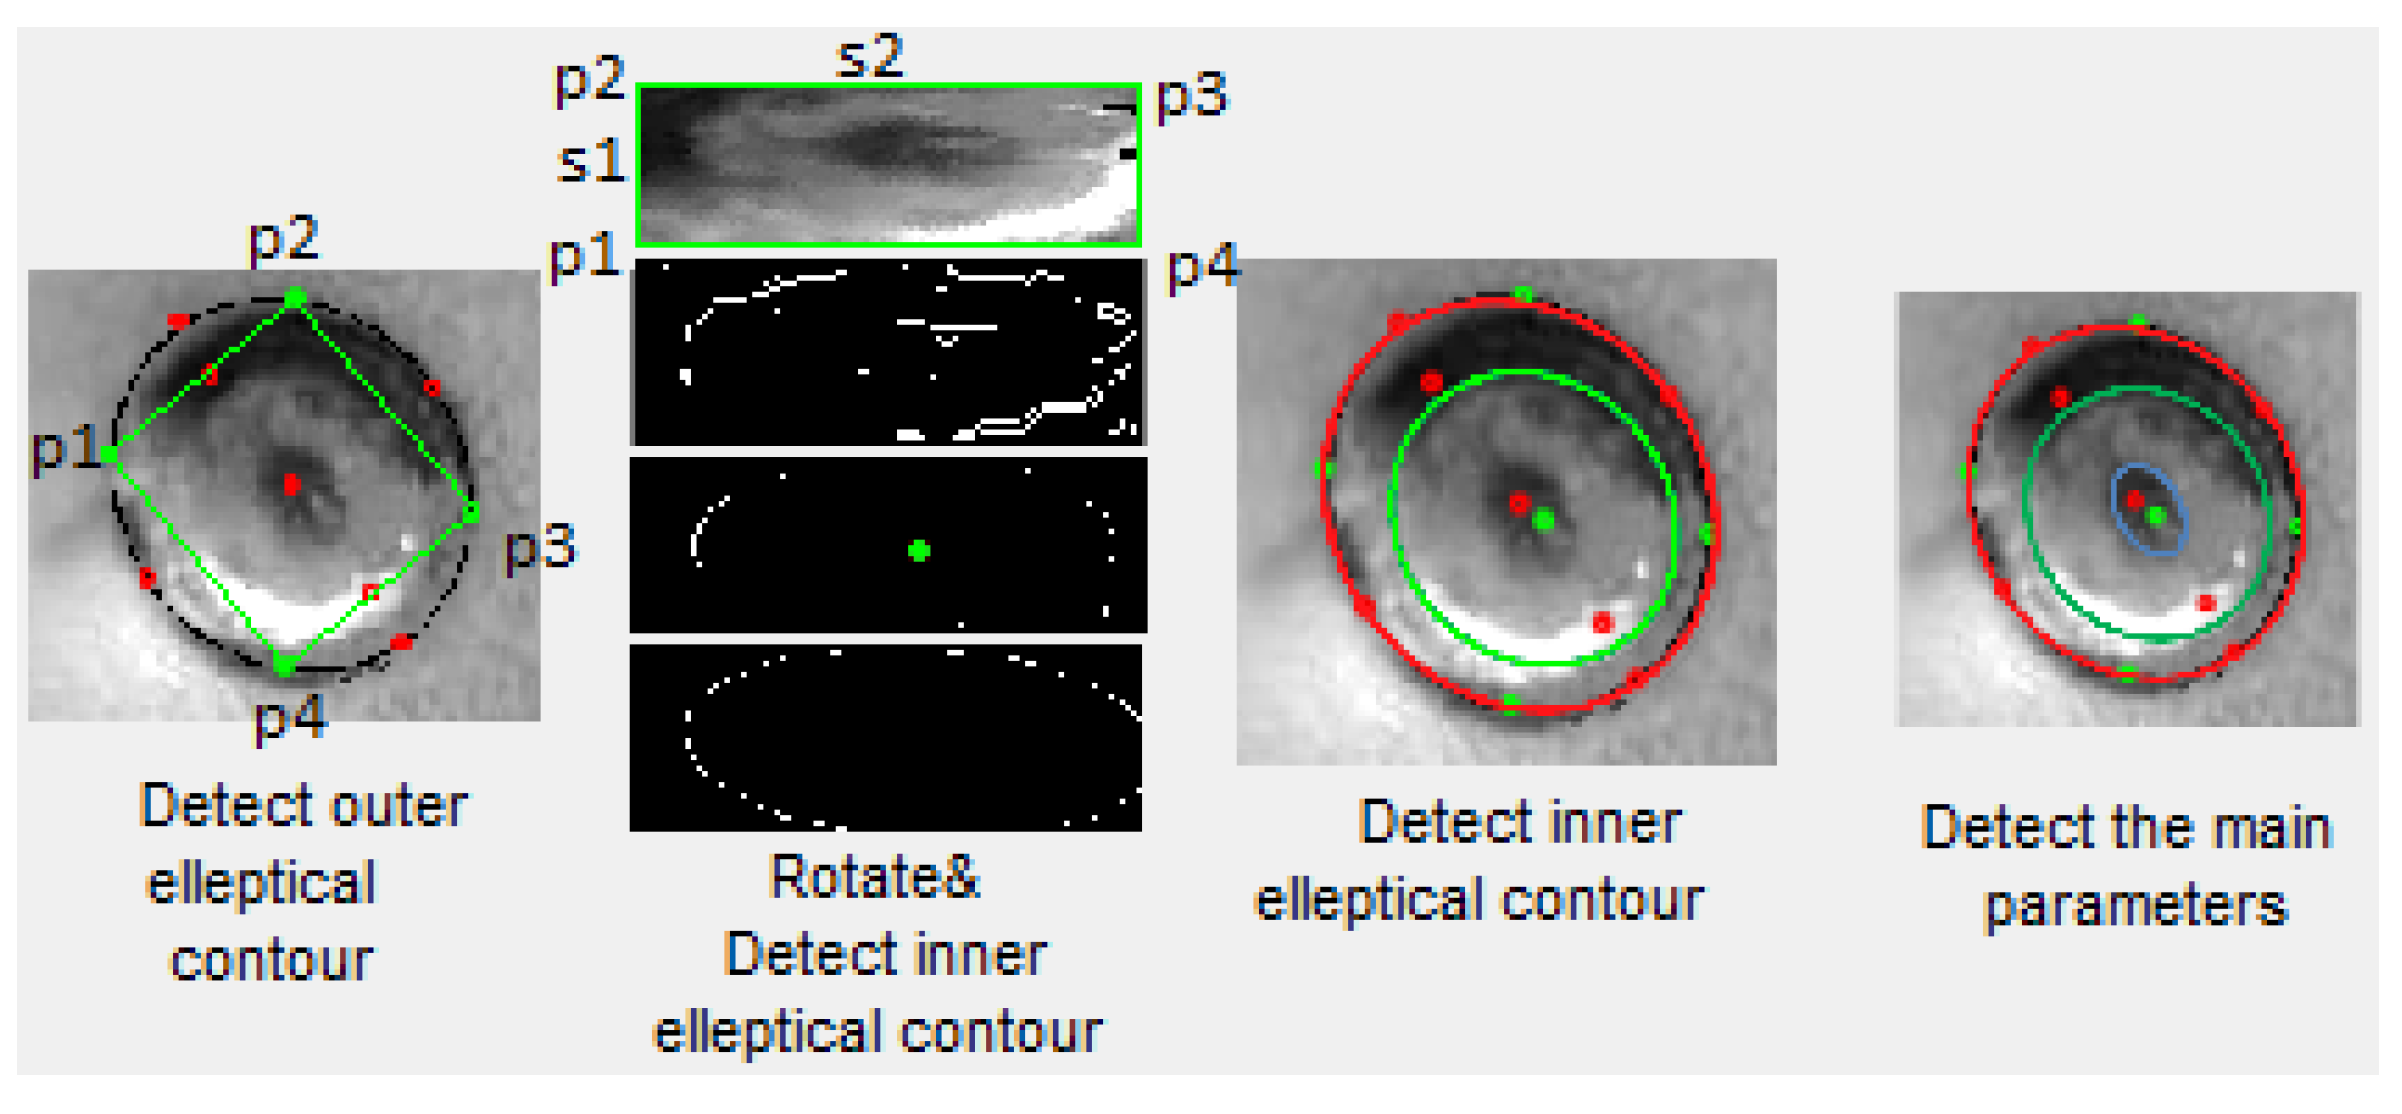
5.4. Rotate the Irregular Rectangle Area and Inner Contour Detection

As it is shown above, the rectangle is not regular, and its angle is α . To display all the pixels inside this irregular rectangle, a method has been used to rotate all the pixels inside it with an angle “-α” until this rectangle becomes regular. The method is illustrated in Figure 13. The distances s 1 and s 2 between p 1 and p 2 , and between p2 and p3 respectively, have been calculated. A matrix has been established with s1 rows and s2 columns. The equation of line p 2 p 3 has been calculated. All the pixels which belong to this line have been inserted into the first row in the matrix. Then, another line has been considered between the second top pixel of the line p 2 p 1 and the second top pixel of the line p 3 p 4 . The equation of this line has been calculated and all the pixels which belong to this line have been inserted in the second row of the matrix. The last row of the matrix includes all the pixels which belong to the line p 1 p 4 . Finally, the matrix has been displayed as shown in Figure 13.

5.5. 3D Model

In order to show more details of the weld nugget’s surface, the appearance’s accuracy of the topography of the weld nugget’s surface is enhanced in the concluded 3D model. After extracting the results from the methods of image processing, these results have been combined and shown in a 3D model. All experiments in this work are tested in an indoor environment. Also, the camera is always perpendicular to the weld surface, and it is provided with a controllable lightening system around it. So, the illuminated area of the surface is caused by the curvature of the surface. The brightest areas refer to the location of the ridges and the darkest areas refer to the location of the hollows. This has been used to discover the locations of the hollows and ridges and determine their numbers and areas in order to estimate the 3D model. As a result, the extracted 3D model accurately shows the locations of the blowholes, pitting, or other defects. Also, a kind of salt and pepper noise could appear in the 3D model due to the variety of illumination. The lighting system reduced this kind of noise, however it can still affect estimating the quality of the weld, so FSVM is used to remove this effect during the data training process (Figure 14).

6. Estimation Methods Based on Fuzzy Support Vector Machine

The artificial data of eight-hundred samples of the weld nuggets, which are extracted based on the improved image processing methods, are shown in Figure 15. Figure 15a shows the error in the weld position of the samples. It is calculated using the following equation:
e = ( ( x o x i ) 2 + ( y o y i ) 2 )
where, ( x o , y o ) and ( x i , y i ) are the ellipse parameters of the outer and inner contours, respectively.
Figure 15b shows results of the area difference between the heat-affected zones and the fusion zones of the actual weld nuggets compared with the ideal weld nuggets. Also, it shows the areas’ results of the troughs and spatters of the actual weld nuggets. Figure 15c shows the counting results of troughs and spatters of the actual weld nuggets.
Next, the extracted weld nugget data were separately divided into three classifiers (as shown in Figure 16) to execute the training using the FSVM method. The first and second classifiers consist of two types of data in two training sets respectively, while the third one consists of three types of data in a training set. As mentioned above, FSVM is proposed to handle the salt and pepper noise in the weld image. The FSVM learning algorithm is formed by assigning membership values for the training data in each classifier and then applying the fuzzy membership functions.
The input fuzzy variables L1, L2, and L3 are based on the distance of a sample to the best hyperplane in each classifier, while the output fuzzy variable is the quality. The fuzzy approach has been shown in Figure 17. Finally, the classification results of the three classifiers have been used to predict the final failure result of the weld quality. In other words, the category of the weld quality that receives the most votes in the three classifiers will be the most probable result in the prediction process.
The efficiency of the proposed system is increased by using an excessive number of samples for data training. Also, the FSVM machine learning method is carried out by applying the fuzzy functions to three groups of the extracted data in order to improve data training and classify the failure modes of the RSW effectively. The improved image processing with the proposed FSVM method shows good performance in classifying the failure modes and dealing with the image noise. The results show that the training process based on FSVM is very sensitive to those outliers or noises in the training dataset which are far away from their own class. Unlike the equal treatment in standard SVM, this kind of SVM fuzzifies the penalty term to reduce the sensitivity of less important data points.

7. Experimental Work

7.1. Path Planning Simulation and Execution

Experimental investigation of surface quality estimation of RSW has been applied on the car underbody for DFM S50, which contains 1000 weld nuggets. Based on the previous method, the best coordinates, where perfect pictures of the weld nuggets could be taken, have been extracted and are shown in the following table. Also, the following table represents the camera coordinates or the end-effector coordinates, or the coordinates of the best point in the space, where a perfect picture of the target weld nugget could be taken. These six coordinates were calculated using the “12 forward kinematics equations” by the means of the joint angles of the robotic arm, which were measured by using the AC servo absolute encoders. Figure 18 shows the RPY angles and the coordinates of the camera and the weld nugget’s center related to the base coordinate frame system. Also, it shows the required robot joint angles to reach to each position after solving the inverse kinematic.
Figure 19 shows the end-effector path to collect the pictures of the target weld nuggets.

7.2. Experimental Results

Table 4 shows different cases and results of applying the previous methods on different images of RSW types.
Compared with other works, the proposed system in this work enhanced the quality estimation of the RSW and solved the problem of the bad lighting conditions by using a controllable lighting system, as shown, and FSVM. The results showed improved efficiency and high accuracy of our new system in the detection of the failure modes of the RSW. The common types of RSW failure modes can be judged by using the proposed vision inspection system of the weld nuggets’ surfaces and the FSVM learning algorithm. Ultrasonic inspection is also used to verify the efficiency of our methods as shown in Table 5.

8. Conclusions

(1)
In this study, the vision system for detecting the defects and quality estimation of RSW has been developed using image processing methods and FSVM to evaluate an elliptical-shaped nugget’s surface on the car underbody.
(2)
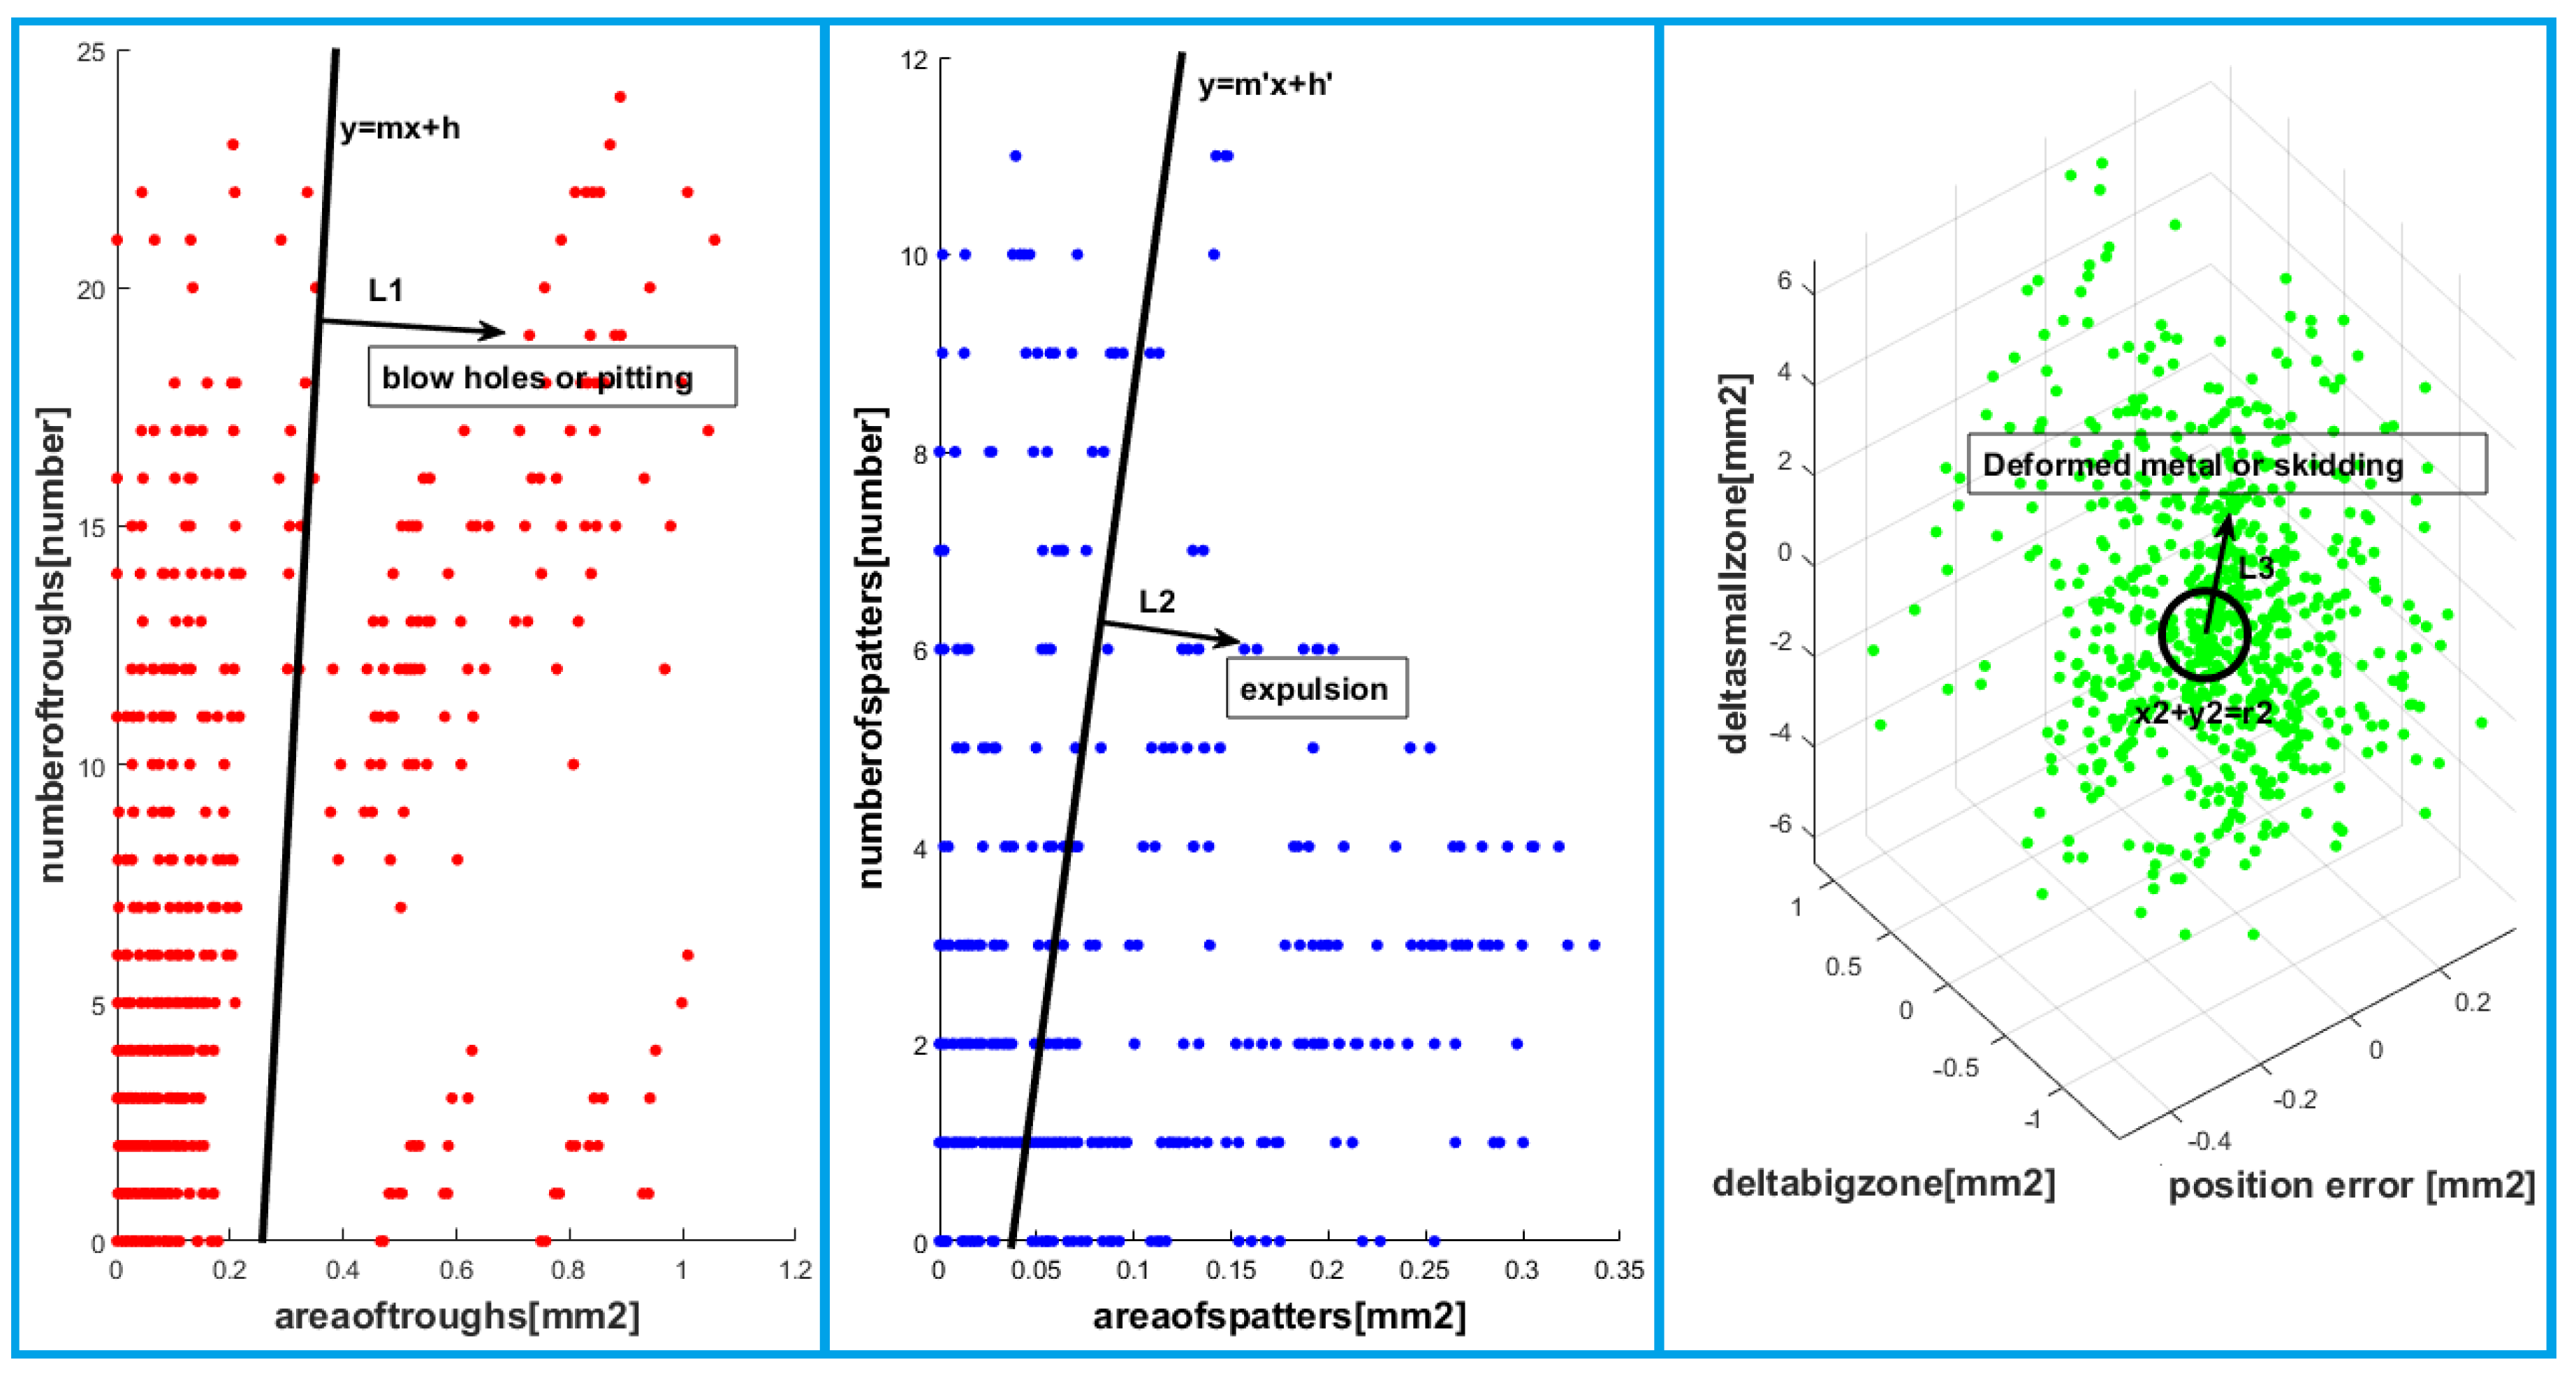
Different kinds of failure modes, such as surface side expulsion, deformed metal, pitting, blowholes, crack, and skidding, were utilized as the input for the system built in this research to estimate the weld quality of RSW.
(3)
The full experimental results were developed and successfully tested in the car underbody in the Dongfeng Motor (DFM) factory in China. The experimental results conclude that the estimation of the 3D reconstruction model of the weld’s surface and the automatic quality inspection of RSW surfaces can reach higher accuracy based on the proposed methods.
(4)
In our future work, the inner quality of the RSW will be considered by developing our system and installing a suitable measuring ultrasonic sensor to the end-effector of the robotic arm with a CCD camera. Using visual inspection and ultrasonic inspection with a robotic arm will help to create a valuable quality inspection technology of RSW.

Author Contributions

Conceptualization, D.Y., E.A., and Y.T.; methodology, D.Y.; resources, D.Y. and E.A.; software, E.A.; supervision, Y.T. and H.L.; writing—original draft, D.Y.; writing—review and editing, D.Y., E.A., and Y.T. All authors have read and agreed to the published version of the manuscript.

Funding

This work is supported by the Fundamental Research Funds for the Central Universities (No.175104003).

Conflicts of Interest

The authors declare no conflict of interest.

References

  1. Tianhu, S. Application of welding technology in automotive manufacturing. Aeronaut. Manuf. Technol. 2004, 3, 24–27. [Google Scholar]
  2. Akkaş, N. Welding time effect on tensile-shear loading in resistance spot welding of SPA-H weathering steel sheets used in railway vehicles. Acta Phys. Pol. A 2017, 131, 52–54. [Google Scholar] [CrossRef]
  3. Kaars, J.; Mayr, P.; Koppe, K. Generalized dynamic transition resistance in spot welding of aluminized 22MnB5. Mater. Des. 2016, 106, 139–145. [Google Scholar] [CrossRef]
  4. Boriwal, L.; Sarviya, R.M.; Mahapatra, M.M. Failure modes of spot welds in quasi—Static tensile—Shear loading of coated steel sheets. Mater. Today Proc. 2017, 4, 3672–3677. [Google Scholar] [CrossRef]
  5. Nieto, J.; Guerrero-Mata, M.P.; Colás, R.; Maní, A. Experimental investigation on resistance spot welding of galvannealed HSLA steel. Sci. Technol. Weld. Join. 2006, 11, 717–722. [Google Scholar] [CrossRef]
  6. Pouranvari, M.; Marashi, S.P.H. Key factors influencing mechanical performance of dual phase steel resistance spot welds. Sci. Technol. Weld. Join. 2010, 15, 149–155. [Google Scholar] [CrossRef]
  7. Lee, H.T.; Wang, M.; Maev, R.; Maeva, E. A study on using scanning acoustic microscopy and neural network techniques to evaluate the quality of resistance spot welding. Int. J. Adv. Manuf. Technol. 2003, 22, 727–732. [Google Scholar] [CrossRef]
  8. Baradarani, A.; Khanli, L.M.; Chertov, A.M.; Regalado, P.W.; Maev, R.G. Efficient Feature Extraction in Ultrasonic Spot Weld Inspection. In Proceedings of the 2017 IEEE 30th Canadian Conference on Electrical and Computer Engineering (CCECE), Windsor, ON, Canada, 30 April–3 May 2017. [Google Scholar]
  9. Tsai, C.L.; Papritan, J.C.; Dickinson, D.W.; Jammal, O. Modeling of resistance spot weld nugget growth. Weld. J. 1992, 71, 47–54. [Google Scholar]
  10. Needham, J.C.; Johnson, K.I. New design of resistance spot welding machine for quality control. Weld. J. 1972, 51, 122–131. [Google Scholar]
  11. Patange, S.; Anjaneyulu, T.; Reddy, G. Microprocessor-based resistance welding monitor. Weld. J. 1985, 25, 33–38. [Google Scholar]
  12. Brown, J.D.; Rodd, M.G.; Williams, N.T. Application of artificial intelligence techniques to resistance spot welding. Ironmak. Steelmak. 1998, 25, 199–204. [Google Scholar]
  13. Shimamoto, A.; Yamashita, K.; Inoue, H.; Yang, S.; Iwata, M.; Ike, N. A Nondestructive evaluation method: Measuring the fixed strength of spot-welded joint points by surface electrical resistivity. J. Press. Vessel Technol. 2013, 135, 21501. [Google Scholar] [CrossRef] [PubMed] [Green Version]
  14. Yu, J. Adaptive resistance spot welding process that reduces the shunting effect for automotive high-strength steels. Metals 2018, 8, 775. [Google Scholar] [CrossRef] [Green Version]
  15. Duan, R.; Luo, Z.; Li, Y.; Zhang, Y.; Liu, Z.M. Novel postweld heat treatment method for improving mechanical properties of resistance spot weld. Sci. Technol. Weld. Join. 2015, 20, 100–105. [Google Scholar] [CrossRef]
  16. Tsukada, K.; Miyake, K.; Harada, D.; Sakai, K.; Kiwa, T. Magnetic nondestructive t-Test for resistance spot welds using magnetic flux penetration and eddy current methods. J. Nondestruct. Eval. 2013, 32, 286–293. [Google Scholar] [CrossRef]
  17. Ruisz, J.; Biber, J.; Loipetsberger, M. Quality evaluation in resistance spot welding by analysing the weld fingerprint on metal bands by computer vision. Int. J. Adv. Manuf. Technol. 2007, 33, 952–960. [Google Scholar] [CrossRef]
  18. Hongwei, Z.; Zhigang, F. Computing method of fractal dimension of imageand its application. J. Jiansu Sci. Technol. 2001, 22, 92–95. [Google Scholar]
  19. Zhenguo, S.; Yong, X.; Qiang, C. Application of fractal theory in welding image processing. J. Image Graph. 2002, 7, 86–90. [Google Scholar]
  20. Wang, Y.; Sun, Y.; Lv, P.; Wang, H. Detection of line weld defects based on multiple thresholds and support vector machine. Indep. Nondestruct. Test. Eval. Int. 2008, 41, 517–524. [Google Scholar] [CrossRef]
  21. Lashkia, V. Defect detection in X-ray images using fuzzy reasoning. Image Vision Comput. 2001, 19, 261–269. [Google Scholar] [CrossRef]
  22. Boersch, I.; Füssel, U.; Gresch, C.; Großmann, C.; Hoffmann, B. Data mining in resistance spot welding. Int. J. Adv. Manuf. Technol. 2018, 99, 1085–1099. [Google Scholar] [CrossRef]
  23. Alghannam, E.; Lu, H.; Ma, M.; Cheng, Q.; Gonzalez, A.A.; Zang, Y.; Li, S. A Novel Method of Using Vision System and Fuzzy Logic for Quality Estimation of Resistance Spot Welding. Symmetry 2019, 11, 990. [Google Scholar] [CrossRef] [Green Version]
  24. Bottin, M.; Giulio, R. Trajectory Optimization of a Redundant Serial Robot Using Cartesian via Points and Kinematic Decoupling. Robotics 2019, 8, 101. [Google Scholar] [CrossRef] [Green Version]
  25. Craig, J.J. Introduction to Robotics: Mechanics and Control, 3rd ed.; Pearson Education: London, UK, 2009. [Google Scholar]
  26. Lozano-Pérez, T.; Wesley, M.A. An algorithm for planning collision-free paths among polyhedral obstacles. Commun. ACM 1979, 22, 560–570. [Google Scholar] [CrossRef]
  27. Seereeram, S.; Wen, J.T. A global approach to path planning for redundant manipulators. IEEE Trans. Robotics Automation 1995, 11, 152–160. [Google Scholar] [CrossRef]
Figure 1. System integration diagram.
Symmetry 12 01380 g001
Figure 2. The software interface of a system.
Symmetry 12 01380 g002
Figure 3. The coordinate systems of the base, camera, and weld nugget’s center.
Symmetry 12 01380 g003
Figure 4. Real robot (the initial state and the link coordinate system): (a) Initial state, and (b) initial state (model) and the link coordinate system.
Symmetry 12 01380 g004
Figure 5. Typical good resistance spot welding.
Symmetry 12 01380 g005
Figure 6. Failure modes: (a) Surface side expulsion, (b) deformed metal, (c) pitting, (d) blowholes, (e) crack (interfacial failure), and (f) skidding.
Symmetry 12 01380 g006
Figure 7. Typical good resistance spot welding.
Symmetry 12 01380 g007
Figure 8. Heat-affected zone contour detection: (a) input gray image, (b) segmentation and morphological operations, and (c) contours detection.
Symmetry 12 01380 g008
Figure 9. The outlined contours of the segmented areas of the weld nugget: (a) smoothing the image, and (b) the most obvious boundaries.
Symmetry 12 01380 g009
Figure 10. Location-based selection of pixels method.
Symmetry 12 01380 g010
Figure 11. The coordinate system of the weld nugget and image: (a) The oval contour detection, and (b) coordinates system of the weld nugget.
Symmetry 12 01380 g011
Figure 12. The rectangle area segmentation inside the outer contour of the weld nugget.
Symmetry 12 01380 g012
Figure 13. Irregular rectangle area segmentation and rotation and inner contour detection.
Symmetry 12 01380 g013
Figure 14. The three-dimensional (3D) model of the weld nugget’s surface.
Symmetry 12 01380 g014
Figure 15. The artificial data of eight-hundred samples of the weld nuggets. (a) the error in the weld position of the samples; (b) area difference between the heat-affected zones and the fusion zones of the actual weld nuggets compared with the ideal weld nuggets; (c) counting results of troughs and spatters of the actual weld nuggets.
Symmetry 12 01380 g015
Figure 16. Support vector machine classification.
Symmetry 12 01380 g016
Figure 17. Fuzzy input and output functions.
Symmetry 12 01380 g017
Figure 18. The Roll Pitch Yaw (RPY) angles and the coordinates of the camera, and weld nugget’s center related to the base coordinate frame system.
Symmetry 12 01380 g018
Figure 19. The end-effector path.
Symmetry 12 01380 g019
Table 1. The 6-degrees of freedom (6-DOF) robot Denavit-Hartenberg (D-H) parameters.
j i : l i 1 l i a i ( m m ) α i ( o ) d i ( m m ) θ i ( o ) Initial Configuration AngleInitial End-Effector Position/Base
j 1 : l 0 l 1 O0O1 = a1 = 100−90°0 θ 1 X = a1 + d4 = 410 mm
j 2 : l 1 l 2 O1O2 = a2 = 2900 θ 2 90 Y = 0 mm
j 3 : l 2 l 3 O2O3 = a3 = 121−90°0 θ 3 Z = a2 + a3d6 = 85.5 mm
j 4 : l 3 l 4 090°O3O4 = d4 = 310 θ 4 φ = 0°
j 5 : l 4 l 5 090°0 θ 5 90 θ = 180°
j 6 : l 5 l 6 0O5O6 = d6 = 325.5 θ 6 ψ = 180°
Table 2. The homogeneous transformation matrices.
T 0 1 = [ c θ 1 0 s θ 1 a 1 c θ 1 s θ 1 0 c θ 1 a 1 s θ 1 0 1 0 0 0 0 0 1 ] T 1 2 = [ s θ 2 c θ 2 0 a 2 s θ 2 c θ 2 s θ 2 0 a 2 c θ 2 0 0 1 0 0 0 0 1 ]
T 2 3 = [ c θ 3 0 s θ 3 a 3 c θ 3 s θ 3 0 c θ 3 a 3 s θ 3 0 1 0 0 0 0 0 1 ] T 3 4 = [ c θ 4 0 s θ 4 0 s θ 4 0 c θ 4 0 0 1 0 d 4 0 0 0 1 ]
T 4 5 = [ s θ 5 0 c θ 5 0 c θ 5 0 s θ 5 0 0 1 0 0 0 0 0 1 ] T 6 5 = [ c θ 6 s θ 6 0 0 s θ 6 c θ 6 0 0 0 0 1 d 6 0 0 0 1 ]
Table 3. Target values of the welding parameters (cycle: 1/50 s, 50 Hz power system).
Sheet Metal Thickness
t (mm)
Electrode Force
F (kN)
Weld Current
I (A)
Weld Time
(Cycles)
Hold Time
(Cycles)
Electrode Diameter
d (mm)
1.00 + 1.002.5095001026
1.12 + 1.122.8097501126
1.25 + 1.253.1510,00013367
1.40 + 1.403.5510,30014367
1.50 + 1.503.6510,45015367
1.60 + 1.604.0010,60016367
1.80 + 1.804.5010,90018367
2.00 + 2.005.0011,20023468
Table 4. Experimental results.
Weld No.Input
Gray Image
Nugget Features Extractions
Contours Detection
3D Model Failure Mode
1 Symmetry 12 01380 i001 Symmetry 12 01380 i002 Symmetry 12 01380 i003Normal weld
2 Symmetry 12 01380 i004 Symmetry 12 01380 i005 Symmetry 12 01380 i006expulsion
3 Symmetry 12 01380 i007 Symmetry 12 01380 i008 Symmetry 12 01380 i009Blowholes
4 Symmetry 12 01380 i010 Symmetry 12 01380 i011 Symmetry 12 01380 i012pitting
5 Symmetry 12 01380 i013 Symmetry 12 01380 i014 Symmetry 12 01380 i015Deformed metal
6 Symmetry 12 01380 i016 Symmetry 12 01380 i017 Symmetry 12 01380 i018cracks
7 Symmetry 12 01380 i019 Symmetry 12 01380 i020 Symmetry 12 01380 i021skidding
Table 5. Ultrasonic inspection results.
Ultrasonic Diameter (mm)Ultrasonic Indentation Depth (mm)Ultrasonic Detection of the Plate Thickness (mm)Ultrasonic Inspection
15.510.162.11no defects
25.420.082.11no defects
35.510.132.12no defects
45.420.062.12no defects
55.510.112.30no defects
65.110.182.31no defects
75.130.122.30defective

