Article

Animated Character Style Investigation with Decision Tree Classification

1
College of Fine Art and Design, Quanzhou Normal University, Dong Hai Rd. 398, Feng ze, Quanzhou 362000, China
2
Department of Children’s Animation, Zhejiang Normal University Hangzhou Kindergarten Teachers’ College, Geng wei Rd.1108, Xiao shan, Hangzhou 311231, China
3
Department of Photonics and Communication Engineering, Asia University, Taichung 41354, Taiwan
4
Department of Medical Research, China Medical University Hospital, China Medical University, Taichung 40402, Taiwan
5
College of Creative Design, Asia University, Liou feng Rd. 500, Wu feng, Taichung 41354, Taiwan
*
Author to whom correspondence should be addressed.
Symmetry 2020, 12(8), 1261; https://doi.org/10.3390/sym12081261
Submission received: 23 June 2020 / Revised: 25 July 2020 / Accepted: 25 July 2020 / Published: 30 July 2020

Abstract

:
Although animated characters are based on human features, these features are exaggerated. These exaggerations greatly differ by country, gender, and the character’s role in the story. This study investigated the characteristics of US and Japanese character designs and the similarities and differences or even the differences in exaggerations between them. In particular, these similarities and differences can be used to formulate a shared set of principles for US and Japanese animated character designs; 90 Japanese and 90 US cartoon characters were analyzed. Lengths for 20 parts of the body were obtained for prototypical real human bodies and animated characters from Japan and the United States. The distributions of lengths were determined, for all characters and for characters as segmented by country, gender, and the character’s role in the story. We also compared the body part lengths of animated characters and prototypical real human bodies, noting whether exaggerations were towards augmentation or diminishment. In addition, a decision tree classification method was used to determine the required body length parameters for identifying the classification conditions of animated characters by country, gender, and character’s role in the story. The results indicated that both US and Japanese male animated characters tend to feature exaggerations in head and body sizes, with exaggerations for US characters being more obvious. The decision tree only required five length parameters of the head and chest to distinguish between US and Japanese animated characters (accuracy = 94.48% and 67.46% for the training and testing groups, respectively). Through a decision tree method, this study quantitatively revealed the exaggeration patterns in animated characters and their differences by country, gender, and character’s role in the story. The results serve as a reference for designers and researchers of animated character model designs with regards to quantifying and classifying character exaggerations.

1. Introduction

The introduction part includes three aspects of related works. Through the discussion of the relevant literature in these three aspects, the significance of finding out the law of body proportions and shapes of animation characters is put forward. How to distinguish the characteristics of different types of animation characters through AI is proposed to explain the law of body proportions and shapes of animation characters.
Section 1 is the discussion of the work related to the proportion design of animation characters. By discussing the phenomenon of exaggeration designs of animation characters’ body proportions, we propose to take the characters in American and Japanese animation as examples to analyze the rules of exaggeration of different types of animation characters. Section 2 is the analysis of the related research on American and Japanese animations and cartoons. It includes the characteristics of the body proportions of American and Japanese animation and cartoon characters, as well as the analysis of their differences. In Section 3, we mention the research related to AI recognitions of human faces, human bodies, and genders. It also puts forward the method of using AI to distinguish the nationality, gender, main role, and supporting role of animation characters.

1.1. Exaggerated Body Proportions in Animated Characters

Animated characters differ in style and appearance depending on which country they come from, often taking after how people of a country tend to look [1]. The exaggeration of human features is a universal design technique employed by animated character designers [2], exemplifying the characteristic of personification design in animated characters. In particular, the body proportions of animated characters are often exaggerated for humorous or aesthetic effects [3], making bodily proportion exaggerations an often-used technique in animated character model designs [4]. Lasseter proposed the application of the 12 Disney principles in 3D animation, arguing that 3D-animated characters should have exaggerated movements and facial expressions and that such exaggerations have to be appropriate, with a harmony between the overall and partial exaggerations [5]. Exaggerations in animated characters alter, but are based on, actual human features; exaggerations differ from distortions in that a distorted character completely diverges from the essential appearance of its human prototype [6]. Body-proportion exaggerations should thus be moderate. Body proportion is key to the construction of animated characters. To quantify the character’s body proportion, animation designers express the character’s body length in multiples of the character’s head height. “Cute” characters have shorter body lengths, typically thrice their head height, whereas “fearsome” characters have longer body lengths, typically five times their head height [7]; see Figure 1.
Since most Western animated characters have only either three-or five-head-height body lengths, the public can recognize Western animated characters by their body proportions. The facial features of Western animated characters also differ more from their real-life human prototypes relative to non-Western characters. Some of the aforementioned scholars have noted that traits should be exaggerated selectively and in moderation [6,8]. This raises the question of which bodily features should be exaggerated, and by how much, as well as what the similarities and differences between US and Japanese animated characters are.

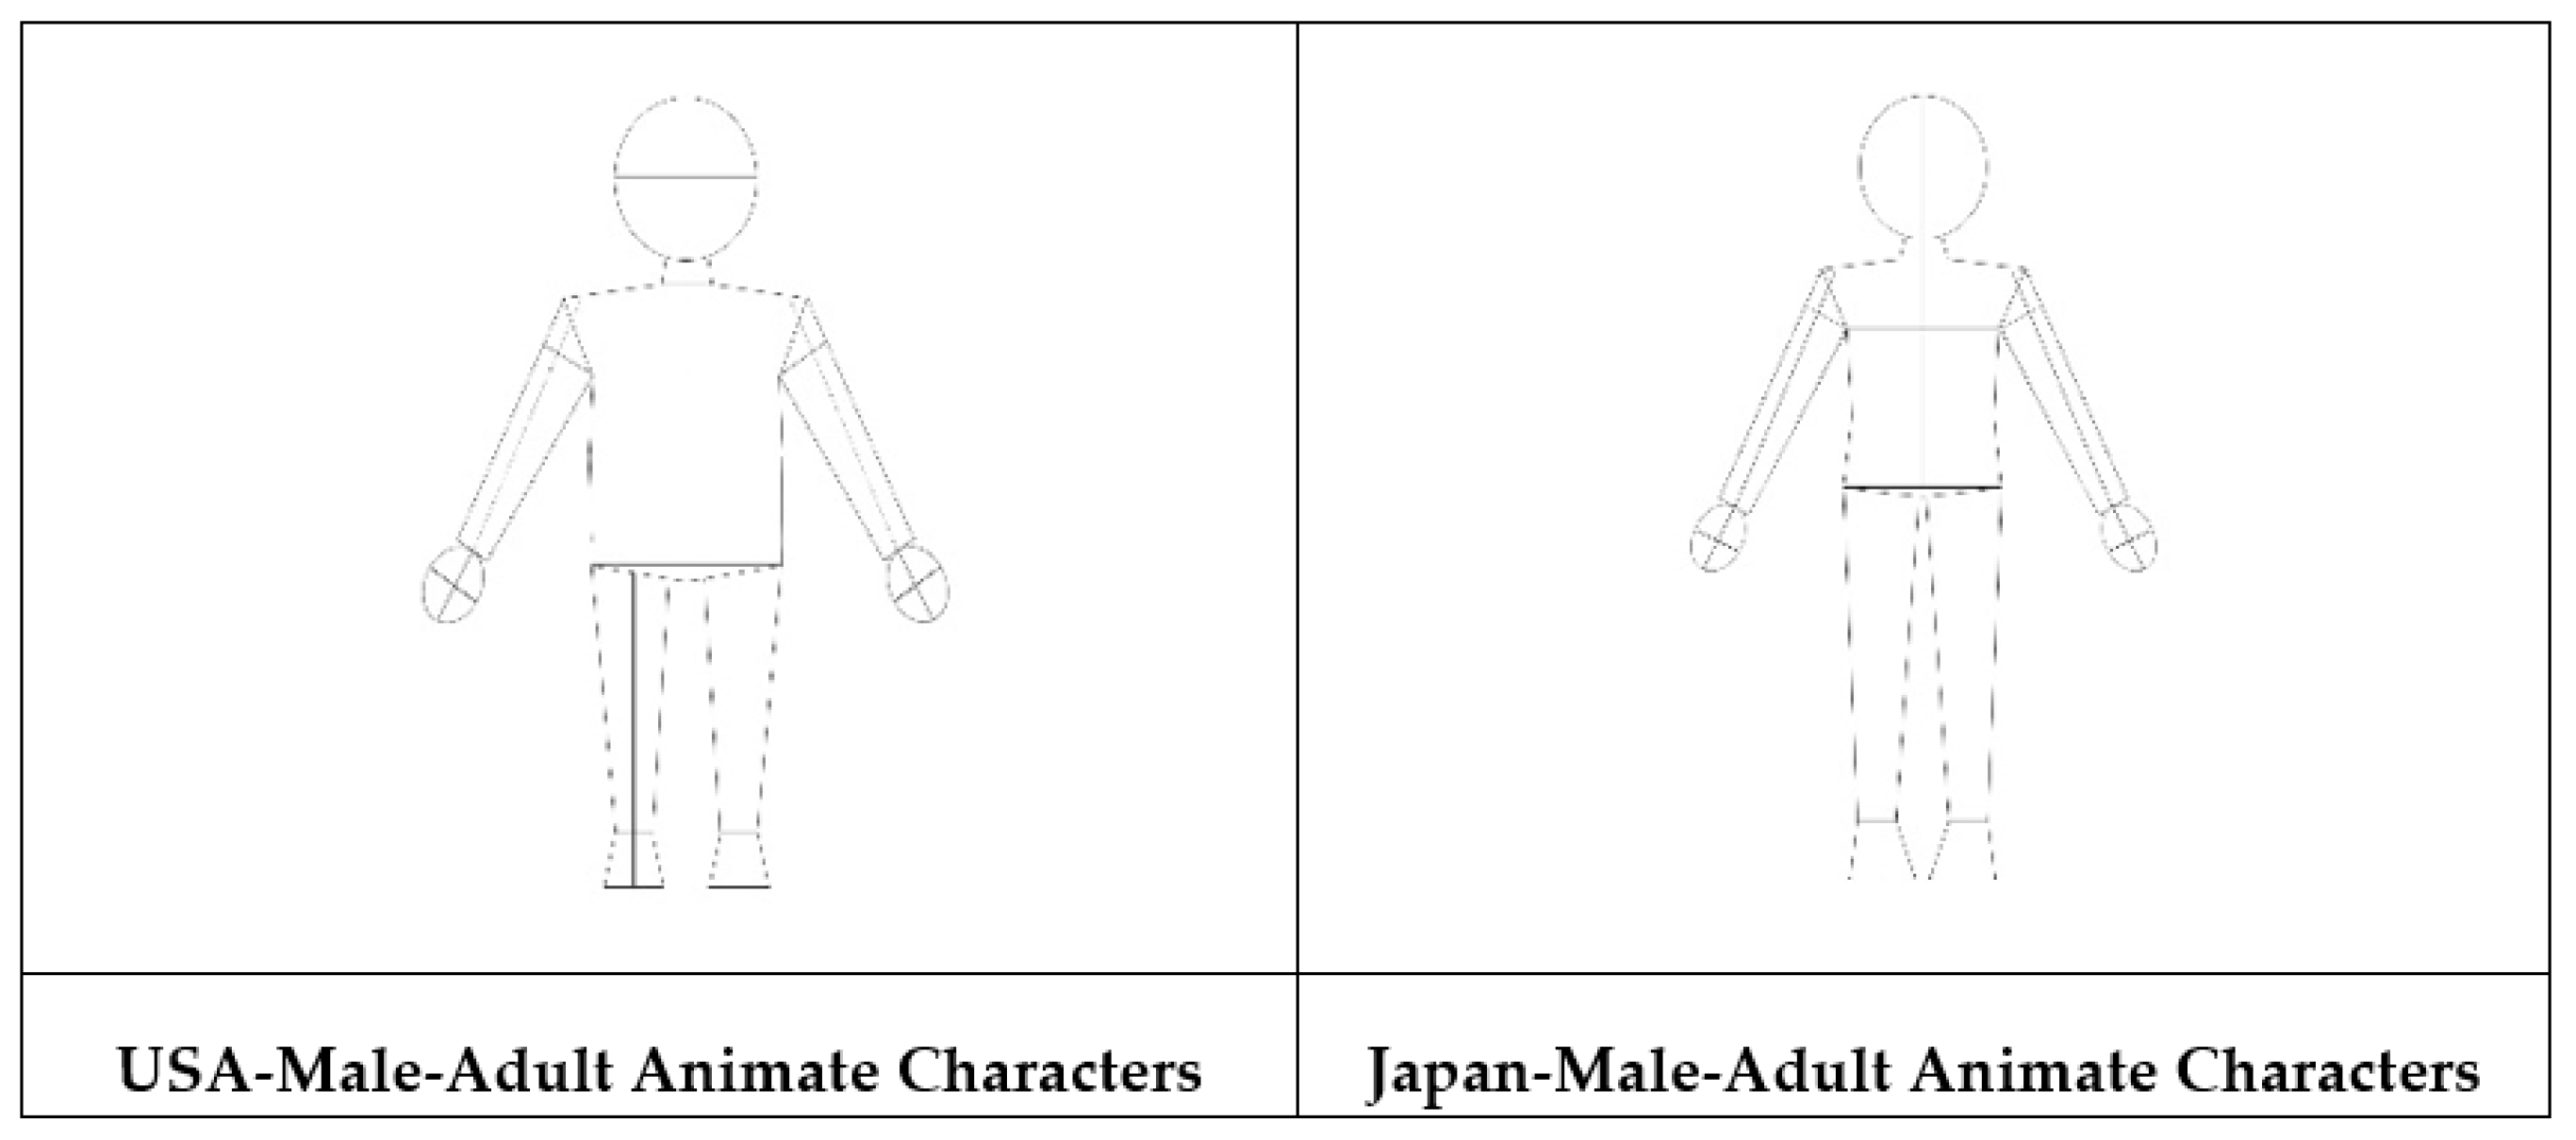
1.2. US and Japanese Animated Character Differences

Analyzing 300 pages each of comics from Japan and the United States, Cohn [9] noted that US and Japanese characters are depicted differently [9]. US animated characters feature greater exaggerations and deformations for humorous effects. US animated characters have also evolved from having large hands and feet to being portrayed in a diversity of styles [10]. This evolution also reflects the evolution across eras in the aesthetic preferences of people toward body proportions. Some Disney animated characters’ bodies are designed in strict accordance with the golden ratio [11].
In Japan, shōjo manga (comics for teenage girls) became popular in the 1970s. Ikeda Riyoko was a popular shōjo manga artist who depicted beautiful characters with exaggerated body proportions: these characters had long bodies, large eyes, and small noses. Some characters were also depicted with 14 heads [10]. This style that was totally different from the Western Disney characters was highly popular and became the foundation for character designs in subsequent and present-day Japanese animation (or anime). Characters in this design style have features that are more similar to people from Europe than people from East Asia; these characters were intentionally designed as such to appeal to a Western audience [1]. Liu and Wang [12] judged Japanese male anime protagonists to be “handsome” and noted that female anime protagonists tend to have long hair, an oval face, enormous eyes, a very small nose, and a slim figure [12].
Now, we have learned that animation characters are exaggerated according to people’s appearances. Nonetheless, regardless of the country or era, animated character models feature subtle changes in body proportions to distinguish them and highlight their personalities, and there are many differences between American and Japanese animation characters. So, how can we confirm the differences between American and Japanese animation characters in body exaggerations?

1.3. AI Identification

Few studies have investigated how exaggerations in cartoon characters can be identified, and only differences in characters’ facial features have been studied [13]. However, much research has been conducted on using information systems to automatically identify human bodies. For example, identification techniques for faces [14,15], gender [16,17,18], walking posture [19,20],and body posture and hand gestures [21,22] have been proposed. Commonly used AI algorithms include the decision tree [23,24], support vector machine [25,26], neural network [27,28], and deep-learning [29] methods. The advantage of the decision tree method is that it yields interpretable classification results, which allows users to make sense of the classification procedure. For some specific cases, a decision tree is more effective in the classification analysis than other machine-learning classification models [30]. Therefore, this study used the decision tree method to quantitatively model the exaggeration patterns of animated characters.
Through the research of the above scholars, we know that exaggeration is a universal rule and a crucial method in the process of animation character creation [4]. Animation designers often achieve exaggerated artistic effects by changing the proportions of normal people’s bodies, so as to design a new animation character [3]. The exaggeration degree of the body proportions gives people different feelings; for example, the three-head body is more lovely, and the five-head body is less lovely [7]. There are also differences in the use of the “exaggeration” method in different countries and regions. Therefore, there are obvious differences in the appearances of animation characters [1].
Meanwhile, there are many differences between American and Japanese animations, which are reflected in the facial features of animation characters in different times, the proportion of hands and feet, the body, and other details of the design [9,10,11,12]. The above scholars mainly discuss the phenomenon related to animation character design. What is the nature of the exaggeration of body proportions in American and Japanese animation characters? In the previous research, we explained the rules of facial exaggerations of American and Japanese animation characters by comparing the facial features of real faces and animation characters and combining the classification method of AI [13]. What is the exaggeration of American and Japanese animation characters’ bodies? Can we give the answer in a similar way? AI can recognize and distinguish human facial features through some data [14,15] and some gender [16] postures [17] and so on. In last year’s research, we extracted the data of facial features of animation characters and tried to classify them with AI. Finally, AI successfully distinguished which faces belong to American animation characters and which faces belong to Japanese animation characters according to the values of several key features [13].
So, can AI also identify their nationality, gender, and age through the body proportions of animation characters? Based on the research of the above scholars, this study attempts to use the method of comparison between the real human body proportions and the body proportions of anime characters in the United States and Japan, combined with the recognition method of AI, to explain the exaggerated preferences and degree of the three attributes of American and Japanese anime characters in different nationalities, genders, and ages.
Our research contributions are as follows:
  • We prove that AI can automatically recognize animated characters. The results of the AI automatic recognition of character image categories in animation also provide some algorithm references for AI to automatically generate animation images.
  • We find the rules of animation character shapes and proportion designs, which can let beginners follow these rules to learn the designs of certain animation character images as soon as possible. Some mature designers can also avoid these rules to design some more innovative animation characters.

2. Methods

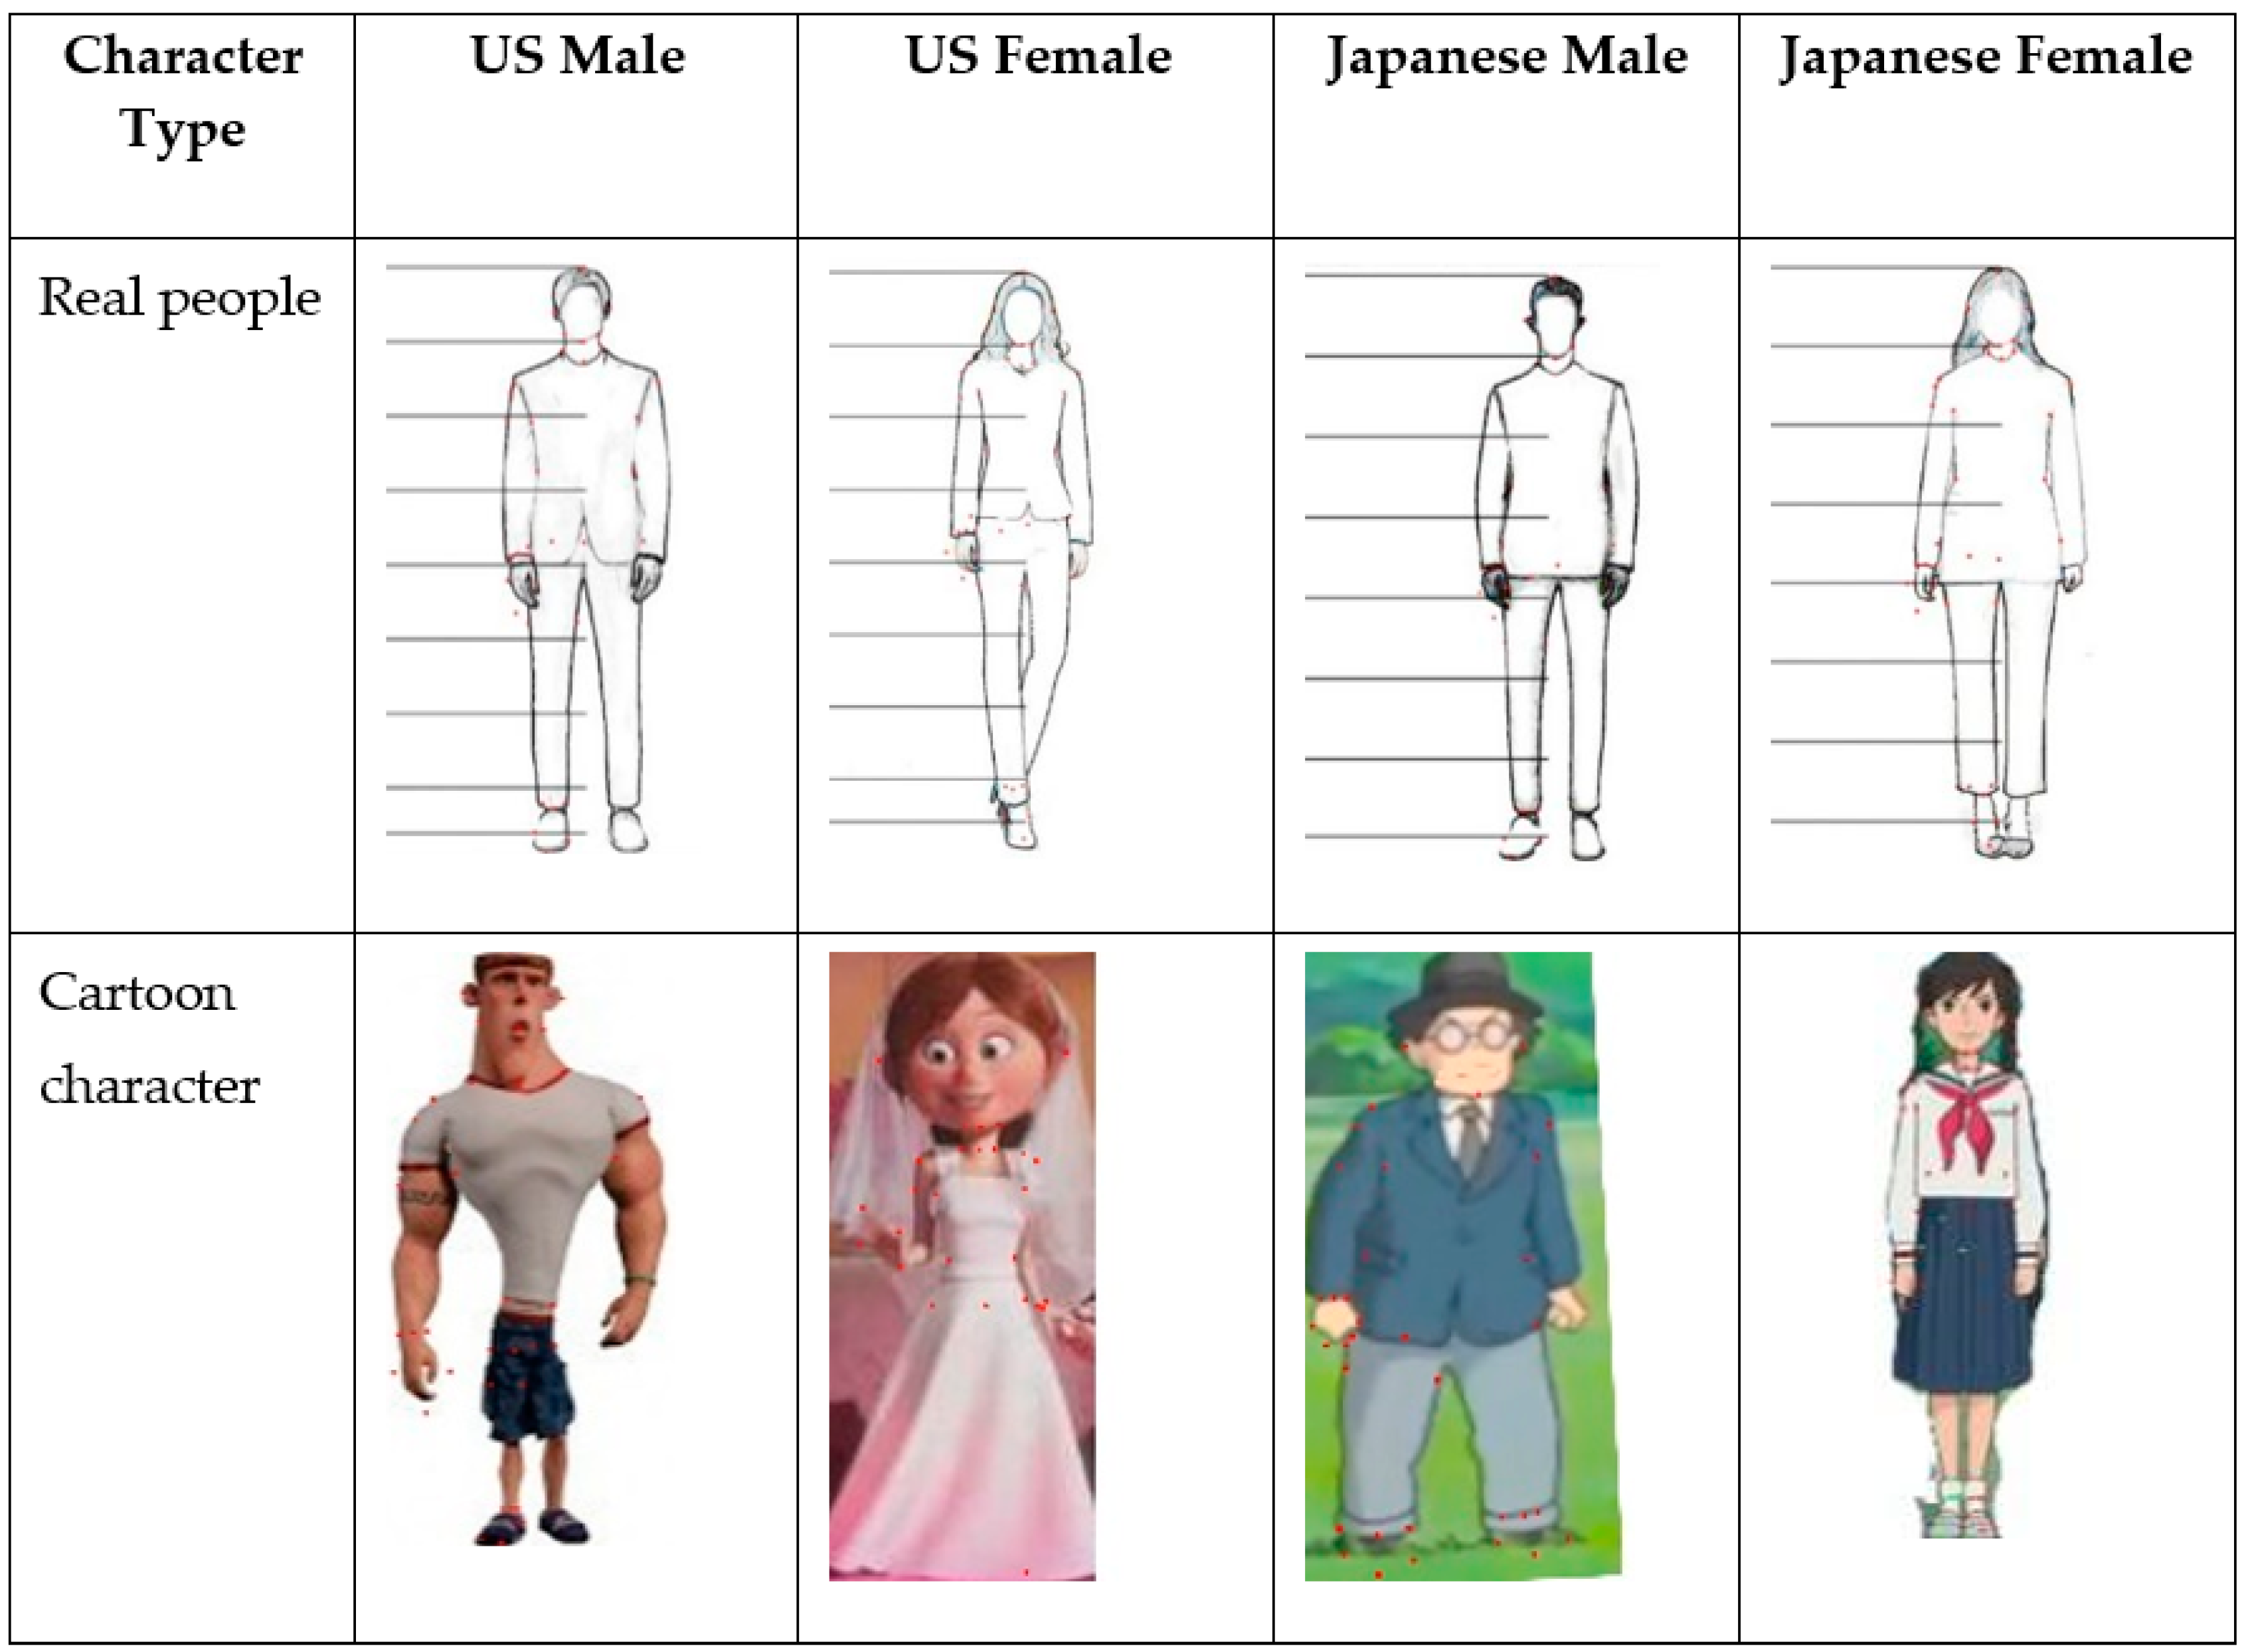
2.1. Data Collection of US, Japanese, and Regular Models

The study sample comprised characters from popular US and Japanese cartoons over the last 20 years. A US cartoon was defined as being popular if it won or was nominated for an Academy Award or was ranked top ten in the box office ranking between 2000 and 2019. A Japanese cartoon was defined as being popular if it was ranked top 30 in the box office ranking between 2000 to 2019. Approximately five to seven characters from each film were used as measurement objects, with no consideration as to whether they were leading or supporting characters. In total, 90 US and 90 Japanese characters were selected. The 180 characters are listed in Appendix A and Appendix B. We also present an outline of a typical male and female adult from Japan and the United States to allow for comparisons between the body proportions of cartoon characters and real people. Each character was labeled with information on the country they came from, their gender, whether they are an adult or child, and whether they played a leading or supporting role. In Figure 1, the real-people outlines are presented with representative animated characters from our sample.

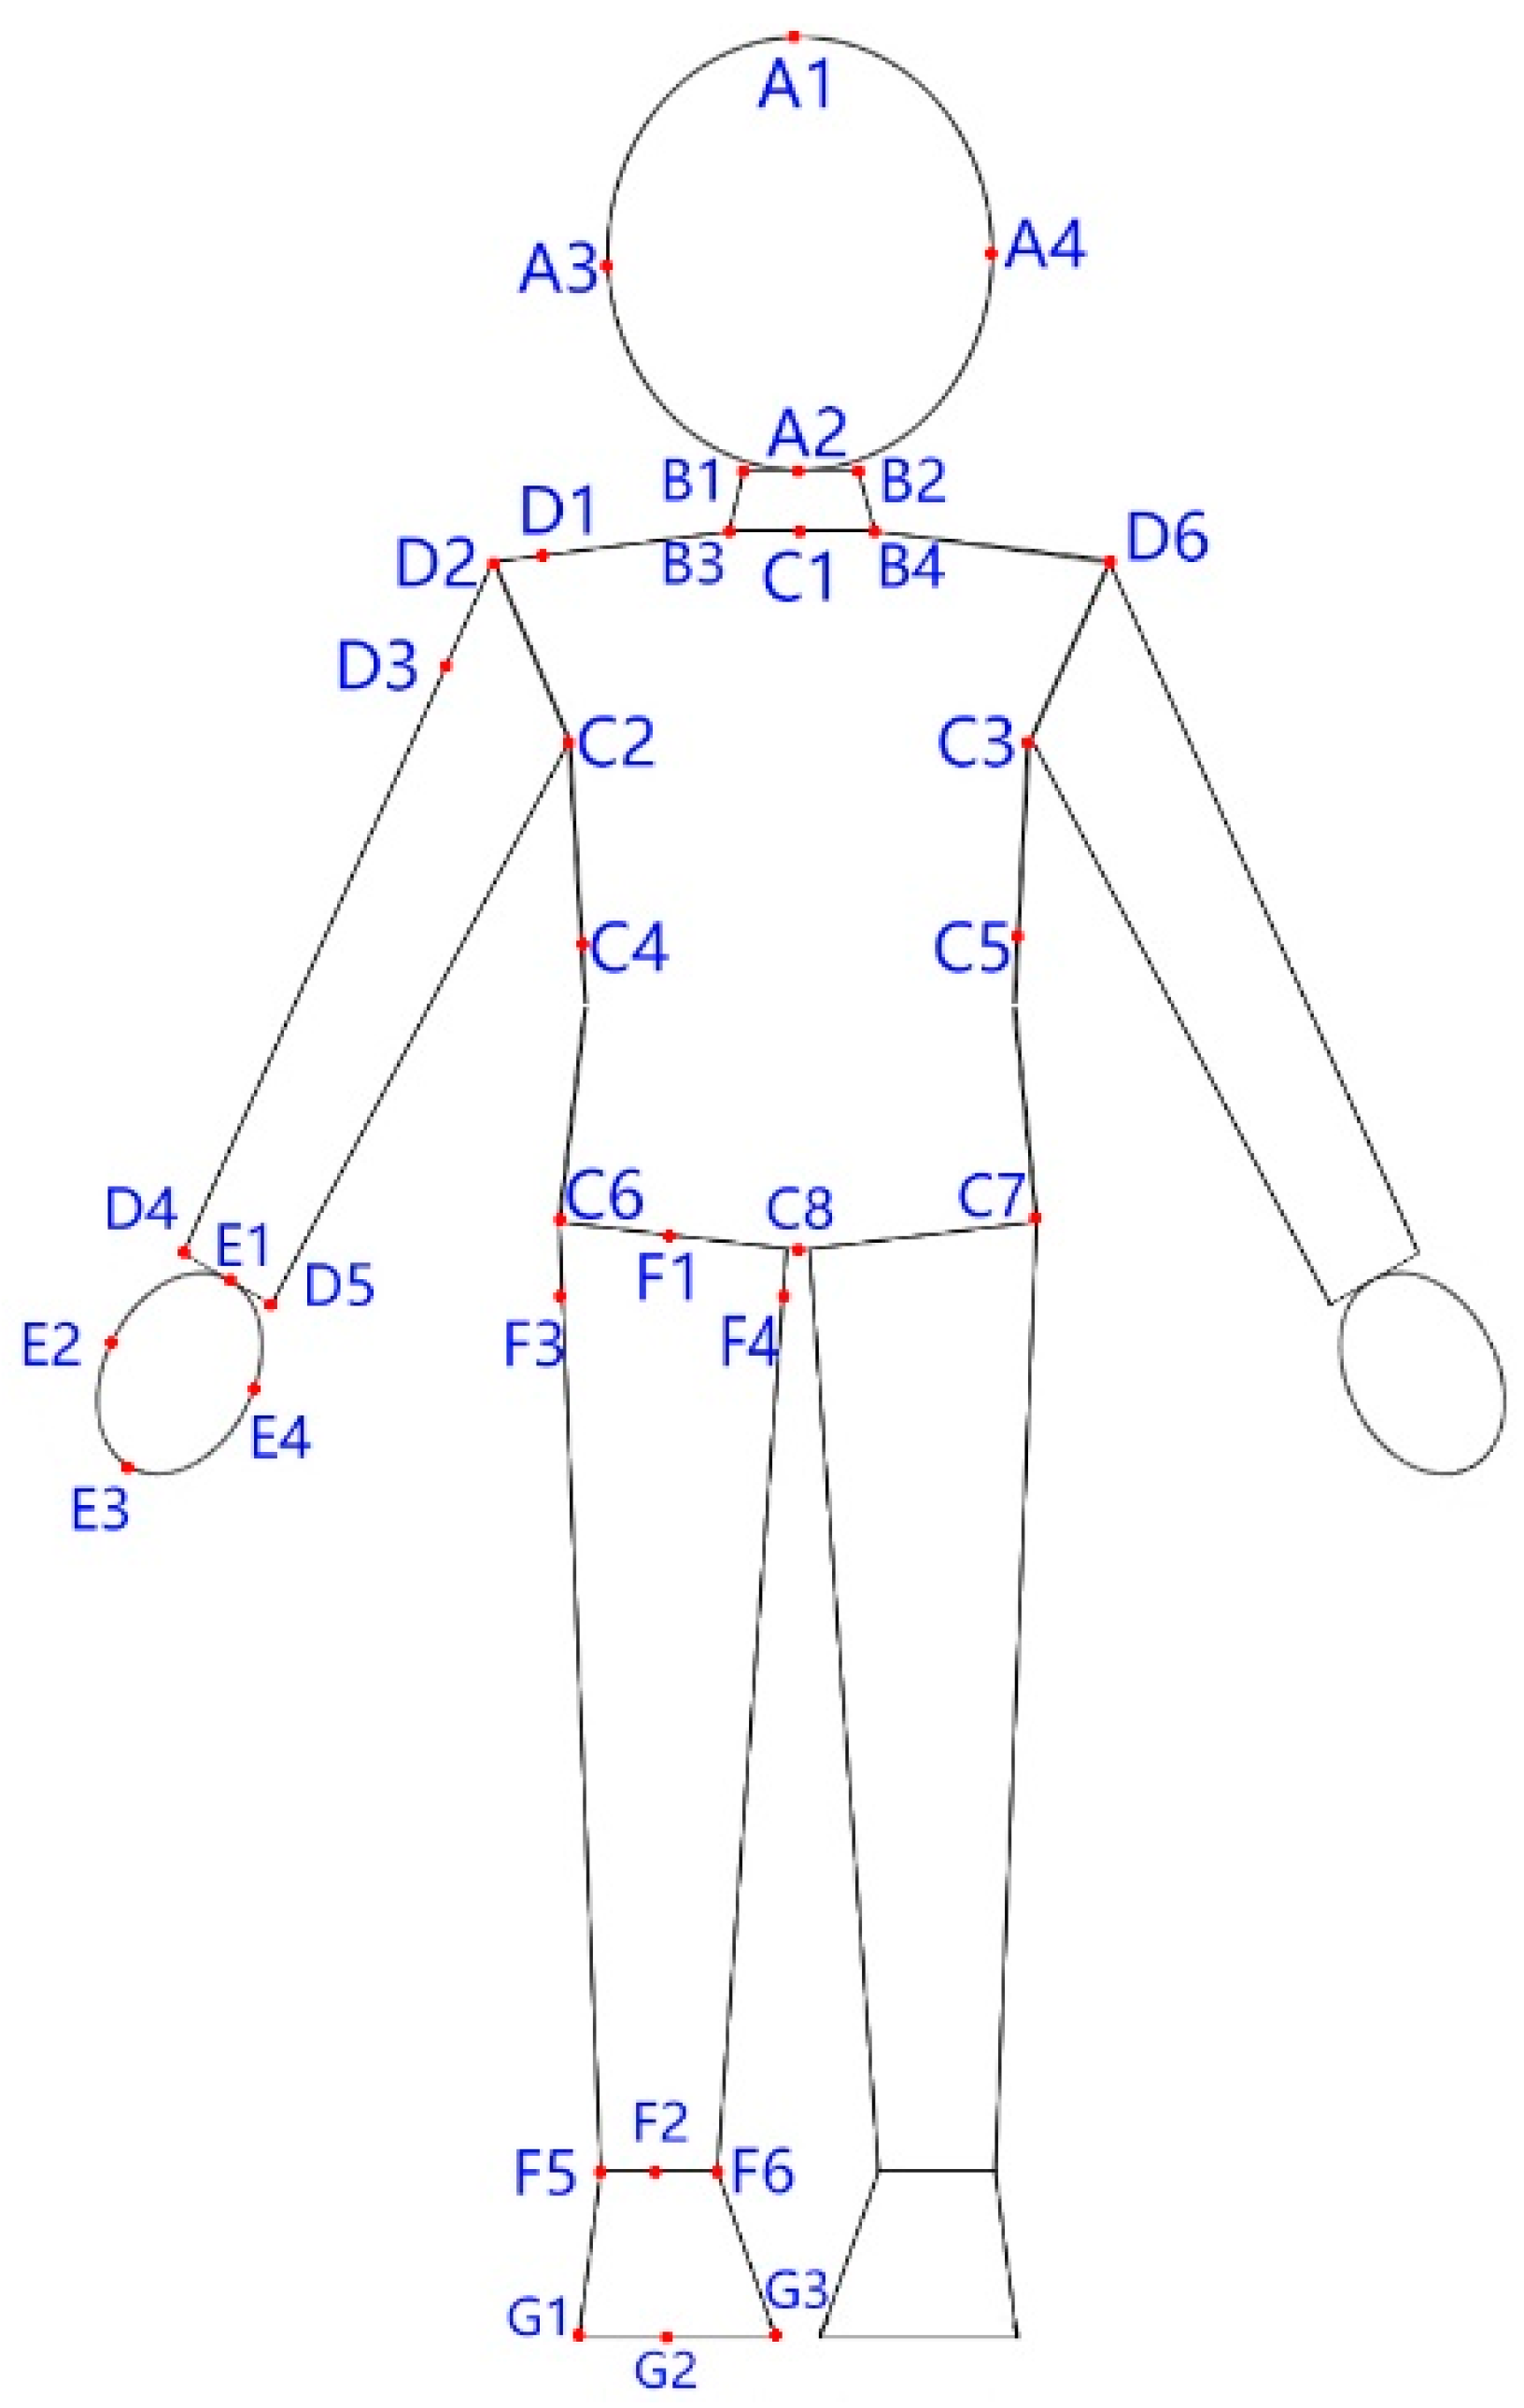
2.2. Physique Parameter Definitions and Regular Models

A 100 × 100-cm square frame was used in this study. The regular model and all character samples were enlarged in the vertical axis to the top and bottom of the frame to achieve a uniform match in position and size. Subsequently, the “scale” tool was used to collect coordinate data of the trait-tracking points on the characters and regular models. The body positioning is illustrated in Figure 2. After the bodies were positioned, the lengths of different parts of the body were measured, and these length parameters are listed in Table 1.
Regular model:
The lengths of typical US adult male and female bodies are approximately seven point five head heights [31], and those for typical Japanese adult male and female bodies are approximately seven heads heights [32]. Based on these proportions, we constructed four regular models (US female, US male, Japanese female, and Japanese male), as depicted in Figure 3. In our analysis, these regular models were compared with the animated adult characters. Since body proportions change greatly with age and older-adult characters are rare in cartoons, regular models of children and older adults were not constructed. In this study, the traits of the human regular models were normalized, and the total lengths of the models from head to toe were defined as unit one. The exaggerated character traits were compared with the traits of the models to understand the exaggeration levels (and whether the exaggerations were toward augmentation or diminishment) of different parts of the characters’ bodies.

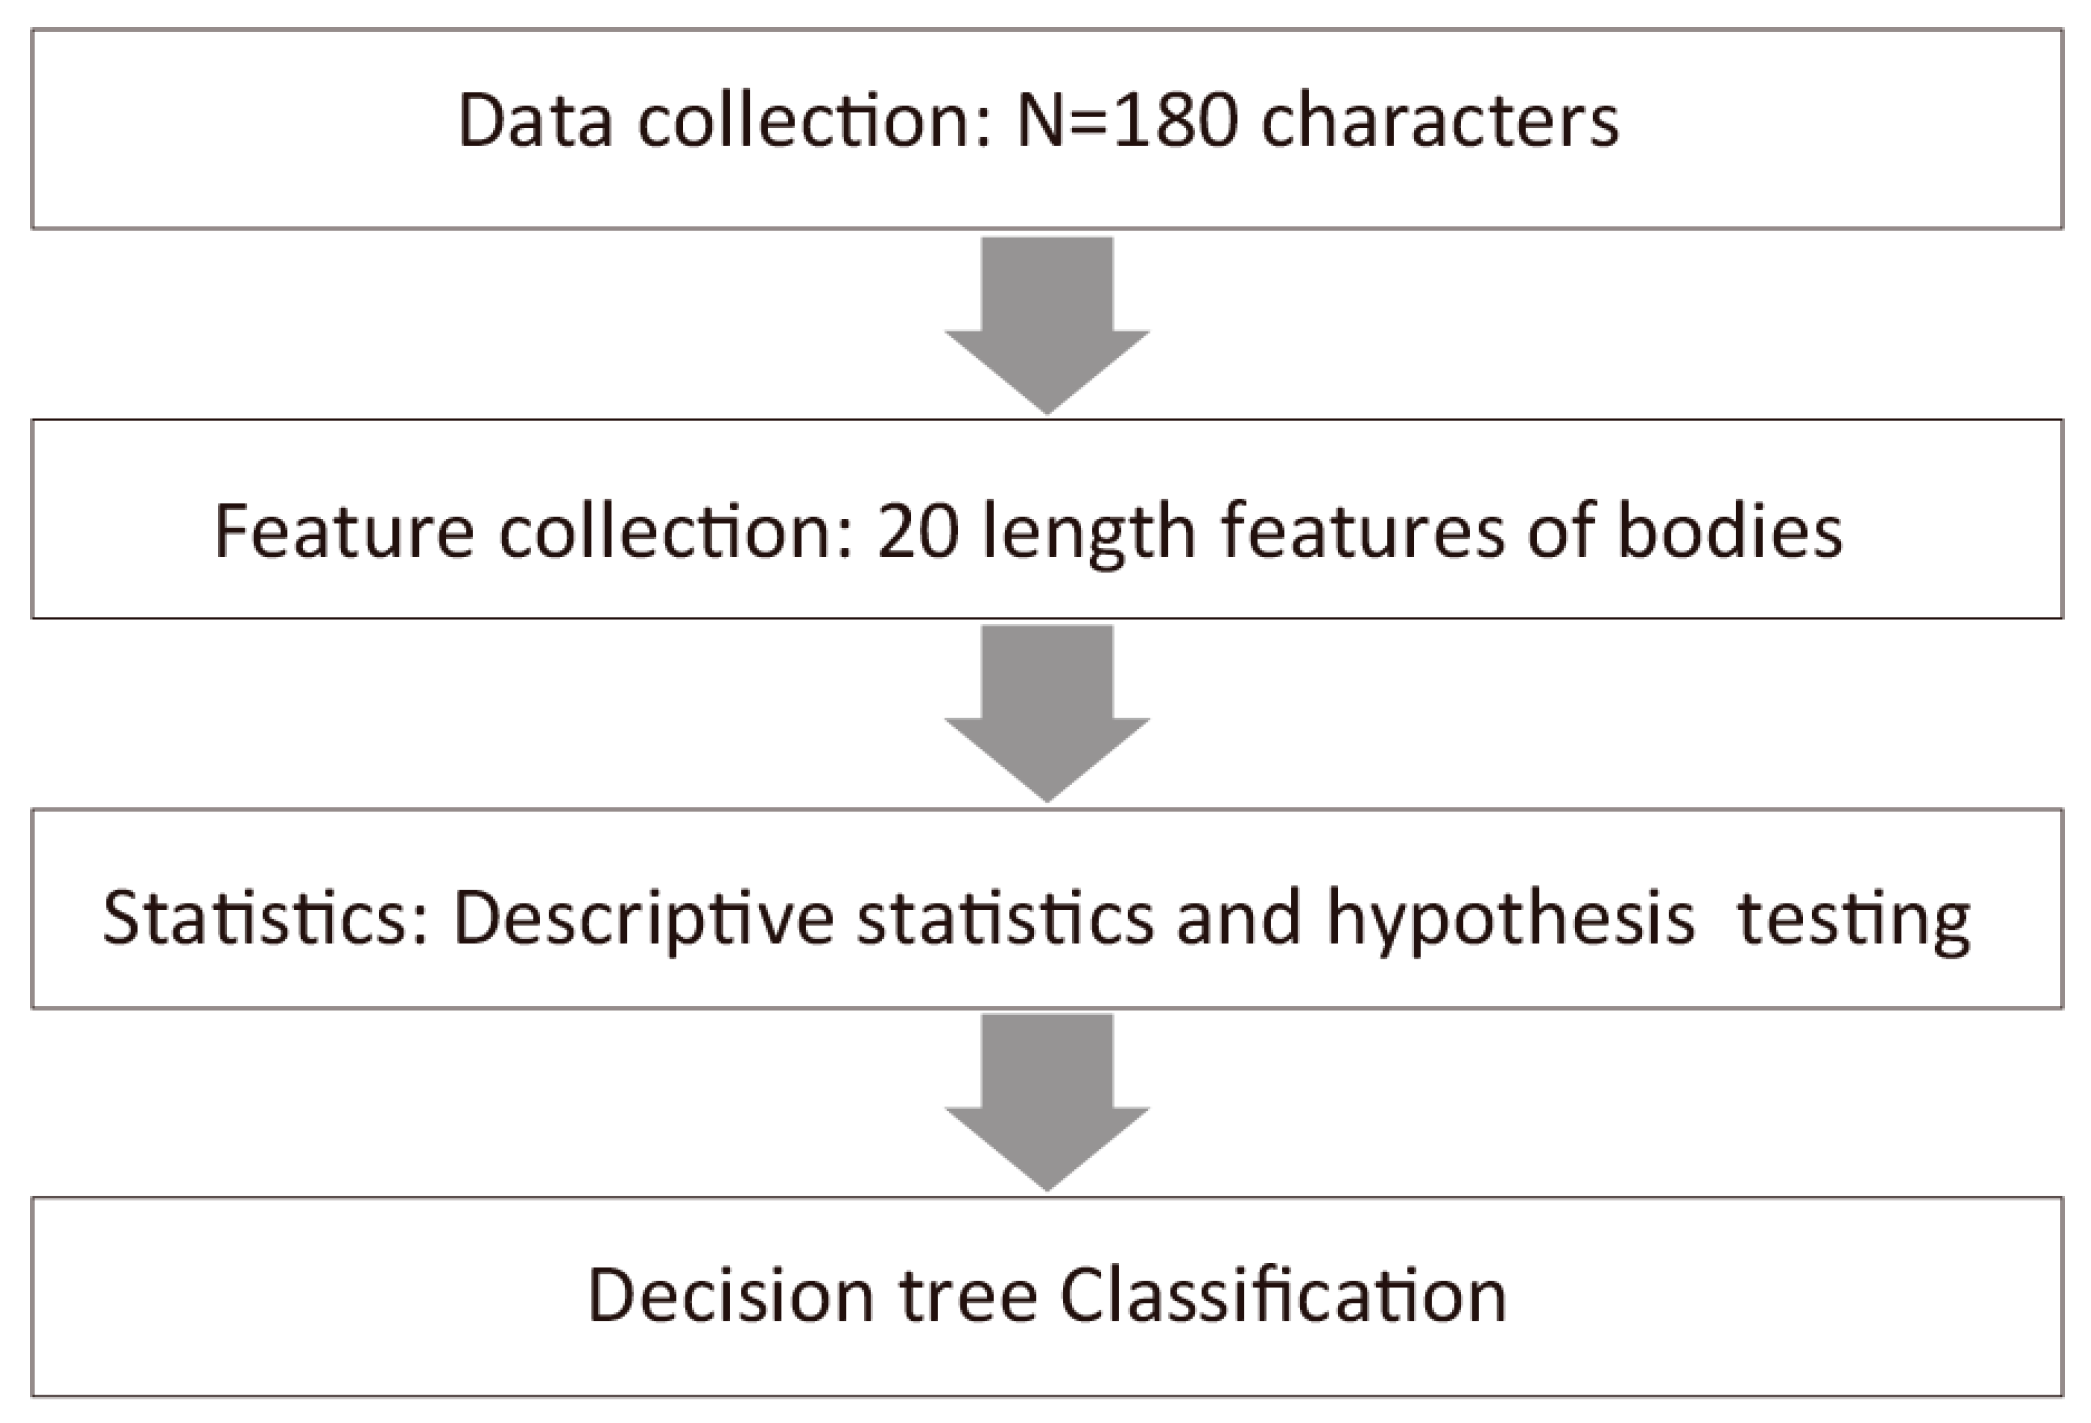
2.3. Decision Tree Implementation

In general, the decision tree algorithm is based on recursive partitioning and regression trees. We implemented the decision tree algorithm using the rpart [33] package written in R language. Our three main classification categories were country, sex, and leading or supporting role. Each identical condition was repeated 1000 times, and the testing ratio was set at 20%. After entering all the parameters, the decision tree was produced through 1000 iterations. Each node parameter generated corresponding importance values. The importance values of the 1000 calculations were summed up, and the relative multiples of importance value were sorted with the minimum parameter of 1. Each parameter training was iterated 1000 times, and the classification performances were accuracy, sensitivity, and specificity, as defined below. Every iteration yielded 6 total output parameters, including training group, testing group, and corresponding classification performances.
Accuracy = (TP + TN)/(TP + TN + FP + FN)
Sensitivity = TP/(TP + FN)
Specificity = TN/(TN + FP)
where TP is true positive, TN is true negative, FP is false positive, and FN is false negative [34].
For trait parameter numbers, the overall parameters and parameters included for each body part and the combination of each body part were examined. The principle of the parameter increases is based on the sequential forward selection [35], based on the accuracy of the training group. The single parameter with the highest classification result was determined and set as the reference. Subsequently, the combinations of the reference parameter with other parameters were tested individually, and the two parameter combinations with the highest classification results were obtained. The parameter number was gradually increased according to this principle, and the highest training group accuracy results corresponding to each parameter number combination were also obtained. The classification category numbers, used testee numbers, and testee categories are listed in Table 2. The classification results of this method are interpretable, and users can directly use the classification results for multiple 2D classifications. For this experiment, different testing number ratios were assessed beforehand. The six classification results revealed a negligible difference. Consequently, the testing ratio was fixed at 20%. Different categories of identification—country, sex, leading or supporting role, and whether the character was a child—were also used in this experiment.

2.4. Statistics

Statistical analysis was conducted using Excel, and the following calculations were executed separately.
  • Descriptive statistics: The means and standard deviations of 20 body lengths by country, sex, and leading or supporting roles were calculated. In addition, the averages and standard deviations of the results after 1000 iterations of decision tree analysis were calculated by country, sex, and leading or supporting roles.
  • Difference tests: Single sample t-tests and t-tests were used to compare animated characters and the real-people reference pictures with respect to the classification categories in Table 2. The α-value for significance in the t-test was 0.05.
The experimental process is illustrated in Figure 4.

3. Results

3.1. Parameter Statistics and Tests

The descriptive statistics and test results are listed in Table 3, Table 4 and Table 5, by country, sex, and leading or supporting role, respectively.
With respect to the country, relative to Japanese characters, US characters had greater length parameters in L1, L2, L6, L7, L8, L9, L13, L15, and L17 and a shorter length parameter in L16.
Relative to the regular models, both US and Japanese male characters had significantly greater length parameters in L1, L2, L7, L8, and L15, whereas both US and Japanese female characters had significantly greater length parameters in only L1 and L2 and significantly shorter length parameters in L18, the calves. This indicates that adult female animated characters are less exaggerated than their male counterparts.
For child characters, relative to Japanese characters, US characters had greater length parameters in L1, L2, L7, L11, L12, L14, and L15 and a shorter length parameter in L16.
With respect to sex, relative to female characters, male characters had greater length parameters in L6, L7, L8, L10, L12, L13, L14, L15, L17, L18, and L20 and a shorter length parameter in L16. This result is similar to the comparisons between all adult male and female characters, as well as US adult male and US adult female characters. Relative to Japanese female characters, Japanese male characters had greater length parameters in only L3, L4, L8, L17, L18, and L2; these were body parts in which Japanese characters (of both genders) had longer length parameters relative to their US counterparts.
As for leading or supporting roles, relative to supporting characters, leading characters had significantly smaller length parameters in only L8 and L11. Specifically, both leading and supporting US adult characters did not significantly differ in their length parameters; among Japanese adult characters, relative to supporting characters, lead roles had significantly smaller length parameters in only L7, L8, and L9.
The effects of converting animation character data in Table 3 and Table 4 into a figure scale diagram is as follows. Figure 5 is a comparison of the proportions of the body parts of adult male animation characters between the United States and Japan. Compared with Japanese adult male animation characters, it is obvious that many parts of the body have made exaggerated designs. In particular, the head, arm, and body are exaggerated, while the length of the legs is relatively short; Japanese adult male animation characters tend to exaggerate the hands, lengthen the legs, and shorten the lengths and widths of the upper body.
Figure 6 shows the comparison of the proportion of body parts of adult female animation characters between the United States and Japan. Compared with Japanese adult female animation characters, American adult female animation characters have obvious exaggerations in the head, and the ends of the limbs are relatively slender. The Japanese adult female animation character body design is more inclined to shorten the length and width of the upper body, lengthen the legs, and shape a slender body.

3.2. Decision Tree Classification Results

To test the classification effects of different testing ratios, all parameters for all testees in the two categories of US and Japan were input. The testing ratio was 4%–40%, and the step was 5%. Since all six classification performances did not exhibit significant changes, the testing ratio was set at 20% for all following tests. A testing group ration is a common standard procedure for data mining to classify and test whether different testing ratios will affect the classification results in advance. Under normal circumstances, it will not have a great impact. At this time, we will choose the right choice, such as 20%. This passage just means that the author has followed the rules of normal data classification calculation and understood the possible impacts of the testing ratio in advance. If the impact is significant, a special article is needed to discuss the testing ratio effect.
All 20 parameters were tested with the 20% testing ratio, and the classification results under 2, 4, 5, 6, and 8 classification numbers are listed in Table 6. All parameters were classified into the two categories: US and Japan, and the training accuracy reached 96.20%. After excluding children, the training accuracy increased by 0.1% at 96.30%, the highest training accuracy among the results in Table 6. The classification effect for adult male characters was slightly higher than that for female characters, at 96.00% and 95.25%, respectively. After all parameters were input, the training accuracy gradually decreased with increases in the category number.
All classification execution results for classification by US and Japanese characters for all testees in the first column in Table 6 were output, and the parameter importance value of every classification could be obtained. The importance values obtained in 1000 iterations of classifications were added, and L19 (feet length) had the smallest summed value. The importance value sum of L19 was set as one, and the importance value sums of other parameters were divided by the L19 importance value sum to obtain a relative importance value for every parameter. These relative importance values are listed in descending order in Table 7.
Data for the bodies were divided into those for the head, chest, hands, and legs. Two to three parameters with the highest-ranked importance values among those in Table 7 were selected for every part. In addition, the classification effects of individual parameters and the parameter combinations of the same parts were calculated. All testees were divided into the two categories of US and Japan. The data is shown in Table 8. The single parameter with the highest training data accuracy classification effect was L13 (shoulder width) of the chest, and the single part with the highest effect was the chest. The highest two-part combination was head + chest, and the highest three-part combination was head + chest + hands. The classification result of the total four parts was 94.79%. The optimal classification results from single parameters to combinations of different parts are presented in Figure 7. The classification results for all eight parameters of the four major parts was 97.79%. The classification results for all 20 parameters was 96.20%. Consequently, four parts sufficed for classification. The accuracy of the testing data was lower than the training data. The highest testing data accuracy classification effect was also on L13. The highest two-part and three-part combinations of the testing data were the same as the training data, which was head + chest and head + chest + hands, respectively. These eight parameters were input, and the decision tree was rerun. The results are presented in Figure 8.

4. Discussion

Some animation practitioners and researchers [2,3,4,5,6,7,8] have all mentioned that exaggeration is a necessary method for animation character design, but no one has analyzed how the body proportions of previous animation characters are exaggerated.
By measuring the body proportions of animation characters of different genders and ages in the excellent animations of the United States and Japan and comparing them with the body proportions of the real human body models, we can prove that almost all animation characters’ bodies contain exaggeration factors in a quantitative way. Exaggeration is not only the most important method of animation character appearance design, but also, there are some differences in the appearance designs of animation characters in different countries and regions.
It is not uncommon to use the human body as a standard to measure other design objects. For example, the human body structure, proportion, and other factors in ergonomics have to be considered in product designs. However, it is still a new attempt to introduce human proportions as a reference in the research of animation character designs.
This study found that using the method of comparing the proportions of the human body with the data of each part of the animation character’s body can find out which features the character’s body exaggerates, respectively, compared with the real human body and how much these features exaggerate, respectively. Therefore, this study not only uses the quantitative method to confirm that the animation character is designed in the form of anthropomorphism. It also proves the point of view from another angle: Based on the understanding and changes of human body proportions, an animated character with exaggerated appearances can be designed [9]. So, when designing a character, animation character designers should first think about how to achieve interesting results by changing the proportion of the body and, then, consider other decorative ideas.
The animation character of the three-head body is more lovely, and the five-head body is less lovely [9]. American animation characters are quite different from Japanese animation characters [9]. According to the data comparisons between American and Japanese animation character exaggeration research, the heads of American animation characters are relatively larger, and many Japanese animation characters are close to the proportions of real human bodies. Therefore, compared with American animation characters, these kind of Japanese animation characters do have a less lovely feeling.
Cohn once mentioned that there are many differences in the concepts between American cartoons and Japanese cartoons [9]. However, we use some data to show that the animation characters of different genders and ages in America and Japan have their own obvious characteristics. For example, the overall body areas of American male animation characters are larger—the legs are shorter, generally speaking, and they are fatter, while the legs of Japanese male animation characters are longer. However, there are similarities in some places, such as the US female anime characters—in addition to the larger heads, many other places are closer to the Japanese female anime characters.
When we understand the differences of these features, it will help us to follow these features in the designs of animation characters in the future to design animation characters that conform to the style of a certain country or consciously avoid these features to design some more novel animation characters.
As Lu said, animation characters in different countries or regions are designed according to the looks of people in different regions [9], which we have previously confirmed through AI to identify the faces of animation characters. Can a computer effectively distinguish its nationality, age, and gender through the body shape of an animated character?
This study adopted a decision tree algorithm for classification. Two to eight categories were used, and if the standard was training data accuracy, the use of two categories yielded the highest accuracy of 96.20%, and the use of eight categories yielded the highest accuracy of 79.24%. The classification accuracy decreased with the number of categories used. For the classification of body parts trait-value combinations of US and Japanese categories, the classification accuracy for the chest length parameter was the highest. If the eight major parameters of the four major parts of head, chest, hands, and legs were used, the classification result accuracy could reach 94.79%. Consequently, this study selected eight body parameters using the decision tree analysis and the method of selection of features to correctly identify the differences between US and Japanese animated characters with 94.79% accuracy. Future developments of these algorithms can be used to identify the styles of animated characters that are specific to a region or even animation company. The different levels of exaggeration of animated characters can be used to effectively identify the differences in the styles of animated characters. The parameterization of animated characters can quantify the differences between animated characters.
The decision tree algorithm used in this article is only traditional recursive partitioning and regression trees, implemented as the rpart code in R. There are novel decision tree models that can enhance the classification performance, such as IntruDTree, which takes into account the ranking of security features according to their importance [36]. A behavioral decision tree based on the context-aware predictive model is also very impressive on the classification performance [37]. The drawbacks of decision trees are a low reliability, lacking in flexibility, and generalization. Overfitting and inductive bias decrease the accuracy of the testing group [38]. As shown in Table 6, in two-class classifications between all US characters and all Japan characters, the accuracy of the training data and testing data are 96.20% and 69.52%, respectively.
Our research contributions:
  • We proved that AI, in addition to the facial features, posture, gender, age, and facial features of humans, the recognizable content can also identify in animated characters which country or region it comes from, as well as its gender and age, through a basic body proportion form.
  • We found that different types of animation characters have different design rules. The cognition of this law can help designers to break some rules to design more innovative character images or help novices to follow a certain pattern to design animation characters that some groups like.

5. Conclusions

As is well-known, animated character features exaggerate human facial features. These exaggerations greatly differ by country, gender, and the character’s role in the story, and our study investigated these differences. This study adopted a decision-tree algorithm and used the lengths of different parts of the animated characters’ bodies as trait parameters for identification. For the 180 animated characters, which country they were from, which gender they are, and whether they played a leading or supporting role could be effectively identified; the maximum accuracy reached 96.20%. In addition, the body length parameters of the four most important parts of the body—head, chest, hands, and legs—were computed. For US and Japanese animated characters, the combination of the eight parameters yielded an identification accuracy of 96.20%. These parameters indicated that US male animated characters were the most exaggerated. The analytical method of this study can be used to analyze the exaggeration patterns of characters by country, gender, and their role in the story. The study results can be used by designers and researchers of animated character shapes and proportion designs for classifying and quantifying character exaggerations.

Author Contributions

Conceptualization, K.L., K.-M.C. and J.-H.C.; methodology, K.-M.C.; software, K.L. and Y.-J.L.; validation, K.L. and K.-M.C.; formal analysis, K.L. and K.-M.C.; investigation, K.L. and K.-M.C.; resources, K.L. and K.-M.C.; data curation, K.L. and K.-M.C.; writing—original draft preparation, K.L.; writing—review and editing, K.L. and K.-M.C.; visualization, K.L., K.-M.C. and Y.-J.L.; supervision, J.-H.C.; project administration, K.-M.C.; funding acquisition, K.-M.C. All authors have read and agreed to the published version of the manuscript.

Funding

This research received no external funding.

Conflicts of Interest

The authors declare no conflict of interest.

Appendix A

Ninety samples of American animated characters:

Appendix B

Ninety samples of Japanese animated characters:

References

  1. Lu, A.S. What race do they represent and does mine have anything to do with it? Perceived racial categories of anime characters. Animation 2009, 4, 169–190. [Google Scholar] [CrossRef]
  2. Gard, T. Building Character. Available online: http://nideffer.net/classes/270-08/week_05_design/BuildingCharacter.doc (accessed on 20 June 2000).
  3. Gombrich, E. Art and Illusion (New York). Pantheon 1960, 20, 1–46. [Google Scholar]
  4. Islam, M.T.; Nahiduzzaman, K.M.; Peng, W.Y.; Ashraf, G. Learning from humanoid cartoon designs. In Proceedings of the Industrial Conference on Data Mining, Berlin, Germany, 12–14 July 2010; pp. 606–616. [Google Scholar]
  5. Lasseter, J. Principles of traditional animation applied to 3D computer animation. In Proceedings of the 14th Annual Conference on Computer Graphics and Interactive Techniques, Anaheim, CA, USA, 21–25 July 2013; pp. 35–44. [Google Scholar]
  6. Redman, L. How to Draw Caricatures; McGraw-Hill Education: New York, NY, USA, 1984. [Google Scholar]
  7. Blair, P. Animation: Learning How to Draw Animated Cartoons. In Walter T. Foster Art Books; Foster Art Service: Laguna Beach, CA, USA, 1949. [Google Scholar]
  8. Hughes, A. Learn to Draw Caricatures; HarperCollins: New York, NY, USA, 1999. [Google Scholar]
  9. Cohn, N. A different kind of cultural frame: An analysis of panels in American comics and Japanese manga. Image Narrat. 2011, 12, 120–134. [Google Scholar]
  10. Cavalier, S.; Chomet, S. The World History of Animation; University of California Press Berkeley: Berkeley, CA, USA, 2011. [Google Scholar]
  11. Meisner, G. The Golden Ratio is Stephen Silver’s Secret Weapon of Character Design. Available online: https://www.goldennumber.net/golden-ratio-cartoon-character-design/ (accessed on 31 October 2016).
  12. Liu, M.; Wang, P. Study on image design in animation. Asian Soc. Sci. 2010, 6, 39. [Google Scholar] [CrossRef] [Green Version]
  13. Liu, K.; Chen, J.-H.; Chang, K.-M. Study of Facial Features of American and Japanese Cartoon Characters. Symmetry 2019, 11, 664. [Google Scholar] [CrossRef] [Green Version]
  14. Yu, H.; Yang, J. A direct LDA algorithm for high-dimensional data—with application to face recognition. Pattern Recognit. 2001, 34, 2067–2070. [Google Scholar] [CrossRef] [Green Version]
  15. Larrain, T.; Bernhard, J.S.; Mery, D.; Bowyer, K. Face recognition using sparse fingerprint classification algorithm. IEEE Trans. Inf. Forensics Secur. 2017, 12, 1646–1657. [Google Scholar] [CrossRef]
  16. Lee, P.-H.; Hung, J.-Y.; Hung, Y.-P. Automatic gender recognition using fusion of facial strips. In Proceedings of the 2010 20th International Conference on Pattern Recognition, Istanbul, Turkey, 23–26 August 2010; pp. 1140–1143. [Google Scholar]
  17. Mahmood, S.F.; Marhaban, M.H.; Rokhani, F.Z.; Samsudin, K.; Arigbabu, O.A. A fast adaptive shrinkage/thresholding algorithm for extreme learning machine and its application to gender recognition. Neurocomputing 2017, 219, 312–322. [Google Scholar] [CrossRef]
  18. Zhou, Y.; Li, Z. Facial Eigen-Feature based gender recognition with an improved genetic algorithm. J. Intell. Fuzzy Syst. 2019, 37, 4891–4902. [Google Scholar] [CrossRef]
  19. Wang, L.; Tan, T.; Ning, H.; Hu, W. Silhouette analysis-based gait recognition for human identification. IEEE Trans. Pattern Anal. Mach. Intell. 2003, 25, 1505–1518. [Google Scholar] [CrossRef] [Green Version]
  20. Gadaleta, M.; Rossi, M. Idnet: Smartphone-based gait recognition with convolutional neural networks. Pattern Recognit. 2018, 74, 25–37. [Google Scholar] [CrossRef] [Green Version]
  21. Gunes, H.; Schuller, B.; Pantic, M.; Cowie, R. Emotion representation, analysis and synthesis in continuous space: A survey. In Proceedings of the Face and Gesture 2011, Santa Barbara, CA, USA, 21–25 March 2011; pp. 827–834. [Google Scholar]
  22. Oyedotun, O.K.; Khashman, A.J. Deep learning in vision-based static hand gesture recognition. Neural Comput. Appl. 2017, 28, 3941–3951. [Google Scholar] [CrossRef]
  23. Song, Y.-Y.; Ying, L.U. Decision tree methods: Applications for classification and prediction. Shanghai Arch. Psychiatry 2015, 27, 130. [Google Scholar] [PubMed]
  24. Hoai, M.; Lan, Z.-Z.; De la Torre, F. Joint segmentation and classification of human actions in video. In Proceedings of the CVPR 2011, Colorado Springs, CO, USA, 20–25 June 2011; pp. 3265–3272. [Google Scholar]
  25. Wang, L. Support Vector Machines: Theory and Applications; Springer Science & Business Media: Berlin, Germany, 2005. [Google Scholar]
  26. Thanh Noi, P.; Kappas, M. Comparison of random forest, k-nearest neighbor, and support vector machine classifiers for land cover classification using Sentinel-2 imagery. Sensors 2018, 18, 18. [Google Scholar] [CrossRef] [PubMed] [Green Version]
  27. Da Silva, I.N.; Spatti, D.H.; Flauzino, R.A.; Liboni, L.H.; dos Reis Alves, S.F. Artificial Neural Networks; Springer International Publishing: Cham, Switzerland, 2017; pp. 21–28. [Google Scholar]
  28. Rauber, P.E.; Fadel, S.G.; Falcao, A.X.; Telea, A.C. Visualizing the hidden activity of artificial neural networks. IEEE Trans. Vis. Comput. Graph. 2016, 23, 101–110. [Google Scholar] [CrossRef]
  29. Schofield, D.; Nagrani, A.; Zisserman, A.; Hayashi, M.; Matsuzawa, T.; Biro, D.; Carvalho, S. Chimpanzee face recognition from videos in the wild using deep learning. Sci. Adv. 2019, 5, eaaw0736. [Google Scholar] [CrossRef] [Green Version]
  30. Sarker, I.H.; Kayes, A.; Watters, P. Effectiveness analysis of machine learning classification models for predicting personalized context-aware smartphone usage. J. Big Data 2019, 6, 57. [Google Scholar] [CrossRef]
  31. Gordon, C.C.; Churchill, T.; Clauser, C.E.; Bradtmiller, B.; McConville, J.T. Anthropometric Survey of US Army Personnel: Methods and Summary Statistics 1988; Anthropology Research Project Inc: Yellow Springs, OH, USA, 1989. [Google Scholar]
  32. Hatakeyama, K.; Fukui, Y.; Okumura, S. On the proportion of the japanese according to the change of the period. Jpn. J. Ergon. 1990, 26, 378–379. [Google Scholar] [CrossRef] [Green Version]
  33. Terry Therneau, Beth Atkinson, Brian Ripley. CARN-Package Rpart. Available online: https://cran.r-project.org/web/packages/rpart/index.html (accessed on 12 April 2019).
  34. Sokolova, M.; Lapalme, G. A systematic analysis of performance measures for classification tasks. Inf. Process. Manag. 2009, 45, 427–437. [Google Scholar] [CrossRef]
  35. Jain, A.; Zongker, D. Feature selection: Evaluation, application, and small sample performance. IEEE Trans. Pattern Anal. Mach. Intell. 1997, 19, 153–158. [Google Scholar] [CrossRef] [Green Version]
  36. Sarker, I.H.; Abushark, Y.B.; Alsolami, F.; Khan, A.I. IntruDTree: A Machine Learning Based Cyber Security Intrusion Detection Model. Symmetry 2020, 12, 754. [Google Scholar] [CrossRef]
  37. Sarker, I.H.; Colman, A.; Han, J.; Khan, A.I.; Abushark, Y.B.; Salah, K. Behavdt: A behavioral decision tree learning to build user-centric context-aware predictive model. Mob. Netw. Appl. 2020, 25, 1151–1161. [Google Scholar] [CrossRef] [Green Version]
  38. Sarker, I.H. Context-aware rule learning from smartphone data: Survey, challenges and future directions. J. Big Data 2019, 6, 95. [Google Scholar] [CrossRef] [Green Version]
Figure 1. Images of seven-heads-high, three-heads-high, and five-heads-high (modified from [7]).
Symmetry 12 01261 g001
Figure 2. Parameter definitions. A: head ratio, B: neck, C: torso, D: arms, E: hands, F: legs, and G: feet.
Symmetry 12 01261 g002
Figure 3. Animated characters and prototypical real-life adults. Body/head ratios for typical American and Japanese adults are 7.5 and 7, respectively.
Symmetry 12 01261 g003
Figure 4. Flowchart of this study.
Symmetry 12 01261 g004
Figure 5. Comparison of the body proportions of male adult animation characters between the United States and Japan.
Symmetry 12 01261 g005
Figure 6. Comparison of the body proportions of female adult animation characters between the United States and Japan.
Symmetry 12 01261 g006
Figure 7. Training data accuracy for the selected features. Acc denotes accuracy. Train denotes training group, and test denotes testing group.
Symmetry 12 01261 g007
Figure 8. Illustration of the decision tree classifications between the USA and JAPAN.
Symmetry 12 01261 g008
Table 1. Definitions of the lengths and body parts of characters.
Length Code Tracking Point CodeLength Definition
L1A1-A2Head length
L2A3-A4Head width
L3B1-B2Neck upper width
L4B3-B4Neck bottom width
L5A2-C1Neck length
L6C1-C8Body length
L7C2-C3Chest width
L8C4-C5Waist width
L9C6-C7Buttock width
L10D1-E1Arm length
L11D3-C2Upper arm width
L12D4-D5Forearm width
L13D2-D6Shoulder width
L14E1-E3Hand length
L15E2-E4Hand width
L16F1-F2Leg length
L17F3-F4Thigh width
L18F5-F6Calf width
L19F2-G2Feet length
L20G1-G3Feet width
Table 2. Classification groups used in this study.
Class numbers and featuresClass NumberClass Features
2USA (N = 90); Japan (N = 90)
Male (N = 105); Female (N = 75)
USA—adult animated characters (N = 71); Japan—adult animated characters (N = 77)
USA—male adult animated characters (N = 42); Japan—male adult animated characters (N = 41)
USA—female adult animated characters (N = 29);
Japan—female adult animated characters (N = 36)
4USA—male adult animated characters; Japan—male adult animated characters
USA—female adult animated characters; Japan—female adult animated characters
5USA—male adult animated characters; Japan—male adult animated characters
USA—female adult animated characters;
Japan—female adult animated characters
All children animated characters (N = 32)
6USA—male adult animated characters; Japan—male adult animated characters
USA—female adult animated characters
Japan—female adult animated characters
USA—children animated characters (N = 19);
Japan—children animated characters (N = 13)
8USA—male adult animated characters; Japan—male adult animated characters
USA—female adult animated characters; Japan—female adult animated characters
USA—boy animated characters (N = 15);
USA—girl animated characters (N = 4)
Japan—boy animated characters (N = 7);
Japan—girl animated characters (N = 6)
Body partAll body features
All head features
All chest features
All feet features
All hand features
Table 3. Length features distribution and differences between countries.
Code NumberLength DefinitionsUSAJAPANUSA_MUSA_MNJAPAN_MJAPAN_MNUSA_FUSA_FNJAPAN_FJAPAN_FNUSA-ChildJAPAN-Child
L1Head length314.52
(135.22)
226.77 ***
(95.28)
259.39
(95.13)
151 C214.20 *
(96.24)
169 β277.73
(108.72)
152 C201.03 **
(93.55)
149 β458.63
(131.87)
293.85 ***
(54.29)
L2Head width282.75
(137.87)
193.13 ***
(133.78)
222.98
(95.98)
114.35 C192.52
(161.21)
119 β242.78
(90.00)
118 C172.76 *
(121.15)
115 β446.51
(135.01)
241.72 ***
(60.95)
L3Neck upper width61.02
(65.26)
52.07
(28.77)
66.43
(76.39)
62.0058.91
(31.79)
67.0363.35
(49.15)
40 A44.57
(24.02)
46.2746.33
(53.98)
58.95
(11.23)
L4Neck bottom width71.86
(80.78)
63.72
(39.66)
79.18
(92.68)
73.0373.47
(47.23)
67.0075.64
(68.01)
50.00 A53.64
(29.56)
52.0050.14
(55.62)
72.35
(16.01)
L5Neck length38.58
(59.06)
27.46
(16.10)
36.98
(43.01)
28.2829.4
(20.11)
28.0239.85
(21.15)
30.36 A26.82 **
(10.75)
23.0948.29
(111.99)
27.96
(7.05)
L6Body length413.27
(142.32)
359.50 **
(76.07)
473.07
(143.03)
366 C357.49 ***
(68.99)
373.00338.10
(63.00)
328.00350.49
(65.74)
398 γ399.32
(140.78)
354.38
(37.33)
L7Chest width260.72
(154.51)
215.60 *
(84.17)
294.90
(163.23)
210 B229.48 *
(72.28)
206 α181.43
(103.86)
176.05191.59
(90.53)
196.43277.34
(143.62)
193.56 *
(35.45)
L8Waist width267.29
(180.42)
204.69 **
(88.59)
306.60
(204.66)
197.04 B214.72 *
(76.4)
188 α168.03
(121.45)
141.00170.71
(95.81)
167.00301.23
(154.24)
214.00
(39.29)
L9Buttock width282.36
(159.73)
243.73 *
(99.78)
302.81
(187.64)
234.07 A238.99 *
(66.55)
239.00230.46
(111.57)
200.00226.13
(124.81)
242.10297.38
(156.32)
254.36
(61.51)
L10Arm length386.24
(106.39)
368.18
(79.62)
433.07
(102.92)
356.05 C384.55 *
(77.93)
360.14349.32
(44.80)
350.07363.32
(64.28)
371.56336.50
(100.62)
319.28
(41.99)
L11Upper arm width86.11
(66.17)
66.97
(73.98)
91.43
(56.75)
50.21 C72.69
(67.96)
53.7167.62
(41.99)
44.40 B68.86
(97.66)
40.0290.59
(70.82)
46.35 *
(12.82)
L12Forearm width52.80
(30.85)
45.78
(32.41)
60.44
(34.15)
45.89 A52.02
(44.65)
39.8135.22
(11.91)
35.1339.27
(16.03)
36.6757.59
(25.04)
38.96
(10.82)
L13Shoulder width332.64
(178.71)
285.88 *
(122.55)
384.49
(199.07)
295.81 B307.13
(142.69)
271.64239.43
(113.02)
239.01256.81
(99.23)
250.24337.92
(155.60)
250.76
(44.35)
L14Hand length115.91
(41.14)
97.42 ***
(29.83)
123.85
(35.76)
120.00105.19 *
(27.14)
107.0292.59
(23.36)
100.1894.66
(31.76)
93.94118.14
(48.10)
79.45 **
(12.80)
L15Hand width91.90
(38.73)
68.33 ***
(32.55)
91.25
(36.29)
65.62 C75.84 *
(39.77)
61.98 α71.98
(18.09)
60 C61.09
(24.74)
58.05110.19
(45.34)
59.27 ***
(12.84)
L16Leg length413.44
(151.32)
491.92 ***
(146.41)
413.49
(124.90)
538.00 C492.71 **
(88.51)
478.00510.13
(120.07)
542.53505.04
(155.26)
478.65267.44
(104.75)
478.21 **
(221.70)
L17Thigh width110.13
(62.03)
90.06 *
(40.45)
115.49
(70.81)
101.02 C110.43
(30.16)
8689.23
(45.64)
90.1465.46 *
(35.34)
102.02 γ120.42
(61.37)
83.96
(30.37)
L18Calf width54.04
(40.20)
48.78
(24.69)
59.51
(48.06)
48.0459.66
(26.09)
42.1031.93
(16.71)
44.18 C36.91
(18.39)
46.04 β67.91
(33.56)
47.52
(17.33)
L19Feet length109.19
(158.63)
98.99
(125.31)
85.15
(31.43)
83.0286.24
(22.86)
98.23153.61
(279.30)
104.92122.17
(208.88)
104.2499.53
(39.10)
86.94
(15.89)
L20Feet width89.01
(49.12)
86.48
(32.92)
96.48
(48.94)
71.56 B99.49
(31.74)
71.17 γ56.91
(36.15)
59.2370.35
(31.68)
48.04 γ120.28
(45.80)
84.35 *
(18.70)
“USA” standard for American animation characters, and “Japan” standard for Japanese animation characters. Data are represented as mean (standard derivation). * Standard for the p-value between American animation characters and Japanese animation characters. A, B, and C standards for the p-value between American animation characters and American regular models; α, β, and γ standards for the p-value between Japanese animation characters and Japanese regular models. *, A, α: p < 0.05; **, B, β: p < 0.01; and ***, C, γ: p < 0.001. USA_M: USA—male adult, USA_MN: USA—male adult regular model, JAPAN_M: JAPAN male adult, JAPAN_MN: JAPAN male adult regular model, USA_F: USA female adult, USA_FN: USA female adult regular model, JAPAN_F: JAPAN female adult, and JAPAN_FN: JAPAN female adult regular model.
Table 4. Length feature distribution and differences between genders.
Code NumberLength of Body PartsMaleFemaleM_AF_AUSA_MUSA_FJAPNA_MJAPAN_F
L1Head length275.62
(127.85)
263.83
(113.78)
235.60
(97.75)
241.89
(106.25)
259.39
(95.13)
277.73
(108.72)
214.20
(96.24)
201.03
(93.55)
L2Head width247.14
(154.76)
225.34
(119.96)
206.95
(134.34)
205.44
(112.52)
222.98
(95.98)
242.78
(90.00)
192.52
(161.21)
172.76
(121.15)
L3Neck upper width61.37
(57.40)
49.94
(38.27)
62.47
(57.12)
53.33
(38.70)
66.43
(76.39)
63.35
(49.15)
58.91
(31.79)
44.57 *
(24.02)
L4Neck bottom width73.48
(71.36)
60.01
(50.35)
76.17
(71.95)
63.90
(51.95)
79.18
(92.68)
75.64
(68.01)
73.47
(47.23)
53.64 *
(29.56)
L5Neck length35.41
(55.21)
29.74
(18.34)
32.99
(32.98)
32.90
(17.57)
36.98
(43.01)
39.85
(21.15)
29.4
(20.11)
26.82
(10.75)
L6Body
Length
length
409.99
(127.63)
354.09 ***
(69.49)
412.24
(124.08)
344.71 ***
(64.23)
473.07
(143.03)
338.10 ***
(63.00)
357.49
(68.99)
350.49
(65.74)
L7Chest width265.11
(132.72)
201.28 ***
(101.41)
260.47
(127.41)
186.85 ***
(96.27)
294.90
(163.23)
181.43 **
(103.86)
229.48
(72.28)
191.59
(90.53)
L8Waist width266.59
(154.08)
194.12 ***
(116.85)
258.24
(157.21)
169.46 ***
(107.59)
306.60
(204.66)
168.03 **
(121.45)
214.72
(76.4)
170.71*
(95.81)
L9Buttock width273.06
(138.15)
249.34
(122.82)
269.22
(140.58)
228.15
(117.84)
302.81
(187.64)
230.46
(111.57)
238.99
(66.55)
226.13
(124.81)
L10Arm length391.66
(96.62)
357.44 **
(64.21)
407.54
(93.25)
356.79 ***
(56.03)
433.07
(102.92)
349.32 ***
(44.80)
384.55
(77.93)
363.32
(64.28)
L11Upper arm width83.85
(71.45)
66.54
(68.55)
81.57
(63.19)
68.28
(76.28)
91.43
(56.75)
67.62
(41.99)
72.69
(67.96)
68.86
(97.66)
L12Forearm width56.15
(37.81)
39.91 ***
(15.85)
56.01
(39.98)
37.38 ***
(14.28)
60.44
(34.15)
35.22 ***
(11.91)
52.02
(44.65)
39.27
(16.03)
L13Shoulder width341.17
(168.96)
265.60 ***
(112.13)
343.77
(174.91)
248.70 ***
(105.34)
384.49
(199.07)
239.43 **
(113.02)
307.13
(142.69)
256.81
(99.23)
L14Hand length115.78
(37.08)
94.19 ***
(28.98)
114.03
(32.68)
93.70 ***
(27.94)
123.85
(35.76)
92.59 ***
(23.36)
105.19
(27.14)
94.66
(31.76)
L15Hand width87.94
(42.01)
69.41 ***
(24.62)
83.14
(38.69)
66.17 **
(22.39)
91.25
(36.29)
71.98 *
(18.09)
75.84
(39.77)
61.09
(24.74)
L16Leg length424.78
(127.35)
490.86 **
(163.16)
455.19
(113.75)
507.41 *
(138.82)
413.49
(124.90)
510.13 **
(120.07)
492.71
(88.51)
505.04
(155.26)
L17Thigh width113.51
(52.99)
81.73 ***
(45.92)
112.83
(53.10)
76.55 ***
(41.86)
115.49
(70.81)
89.23
(45.64)
110.43
(30.16)
65.46 ***
(35.34)
L18Calf width61.37
(37.31)
37.78 ***
(19.51)
59.59
(37.84)
34.59 ***
(17.66)
59.51
(48.06)
31.93 **
(16.71)
59.66
(26.09)
36.91 ***
(18.39)
L19Feet length88.73
(28.67)
125.11
(216.59)
85.73
(27.08)
136.84
(242.64)
85.15
(31.43)
153.61
(279.30)
86.24
(22.86)
122.17
(208.88)
L20Feet width100.48
(40.21)
70.32 ***
(35.27)
98.07
(40.54)
64.08 ***
(34.22)
96.48
(48.94)
56.91 **
(36.15)
99.49
(31.74)
70.35 ***
(31.68)
* p < 0.05, ** p < 0.01, and *** p < 0.001.
Table 5. Length features distributions and differences between leading role and supporting role.
Code NumberLength of Body PartsLeading
Role
Supporting RoleAL_rAS_rUSA_AL_rUSA_AS_rJAPAN_AL_rJAPAN_AS_r
L1Head length260.31
(115.85)
276.07
(125.12)
216.32
(60.22)
245.94
(115.90)
251.37
(68.63)
273.21
(110.32)
195.04
(43.31)
216.82
(115.83)
L2Head width226.14
(113.12)
244.14
(153.96)
184.85
(67.97)
216.88
(144.01)
234.42
(68.58)
230.64
(101.28)
154.75
(47.49)
202.19
(178.90)
L3Neck upper width54.45
(43.71)
57.65
(53.75)
61.50
(46.46)
56.93
(51.67)
76.86
(67.86)
60.82
(64.72)
52.17
(23.47)
52.77
(32.73)
L4Neck bottom width68.61
(58.33)
67.36
(66.35)
77.56
(63.03)
67.40
(64.52)
97.85
(93.97)
70.31
(77.32)
65.24
(28.71)
64.28
(47.94)
L5Neck length30.56
(17.11)
34.31
(52.48)
34.06
(15.70)
32.41
(31.42)
39.52
(21.60)
37.77
(38.85)
30.74
(9.73)
26.67
(19.67)
L6Body length369.94
(84.69)
395.03
(121.04)
369.50
(85.42)
388.85
(116.37)
416.87
(112.94)
412.99
(140.33)
340.73
(45.40)
363.06
(77.20)
L7Chest width218.46
(110.81)
248.51
(130.05)
207.97
(103.69)
237.89
(126.75)
250.82
(155.18)
243.24
(150.40)
181.95
(37.29)
232.17 *
(96.76)
L8Waist width205.97
(108.91)
251.77 *
(157.20)
187.04
(104.40)
234.91
(158.19)
234.87
(151.88)
249.99
(197.52)
158.00
(42.15)
218.80 **
(100.63)
L9Buttock width239.12
(104.77)
275.62
(143.17)
224.56
(98.76)
264.22
(144.59)
269.01
(147.04)
271.93
(168.42)
197.57
(32.90)
255.99 *
(115.23)
L10Arm length362.68
(72.74)
384.85
(91.50)
376.58
(64.46)
389.38
(90.43)
401.64
(85.94)
394.55
(95.17)
361.37
(41.95)
383.86
(85.83)
L11Upper arm width60.91
(34.66)
84.75 *
(82.43)
62.96
(36.26)
82.00
(80.27)
84.75
(49.28)
79.66
(53.18)
49.74
(14.92)
84.51
(102.22)
L12Forearm width47.03
(27.69)
50.48
(33.38)
45.63
(26.37)
48.86
(35.38)
55.40
(39.61)
47.24
(24.99)
39.69
(10.31)
50.59
(44.12)
L13Shoulder width286.62
(140.78)
321.16
(156.80)
282.10
(145.39)
311.58
(159.72)
336.21
(224.69)
315.53
(164.86)
249.26
(39.61)
307.36
(155.83)
L14Hand length105.35
(32.32)
107.36
(37.12)
106.12
(30.92)
104.53
(32.98)
116.34
(39.37)
107.94
(32.70)
99.92
(23.10)
100.88
(33.25)
L15Hand width74.83
(31.60)
82.89
(39.09)
71.90
(31.76)
77.51
(34.35)
89.41
(42.21)
80.43
(26.07)
61.28
(16.65)
74.38
(41.51)
L16Leg length458.46
(101.73)
449.64
(166.01)
491.65
(72.00)
471.59
(147.52)
450.01
(90.8)
457.85
(143.68)
516.94
(42.50)
486.26
(151.79)
L17Thigh width93.36
(46.12)
103.63
(55.29)
91.66
(44.11)
99.38
(54.93)
102.75
(62.11)
104.46
(62.70)
84.92
(27.57)
93.96
(45.30)
L18Calf width50.77
(31.62)
51.75
(34.00)
48.72
(28.91)
48.48
(34.96)
48.82
(41.68)
46.95
(39.71)
48.65
(18.23)
50.11
(29.42)
L19Feet length89.48
(28.48)
111.77
(175.21)
89.61
(31.05)
117.51
(198.61)
89.64
(38.43)
124.31
(217.49)
89.59
(26.39)
110.24
(178.48)
L20Feet width87.90
(35.69)
87.67
(43.57)
82.66
(37.51)
83.27
(43.36)
79.89
(54.04)
78.91
(45.93)
84.35
(23.54)
87.94
(40.44)
* p < 0.05, ** p < 0.01, and *** p < 0.001. AL_r: adult leading role, AS_r: adult supporting role, USA_AL_r: USA—adult leading role, JAPAN_AL_r: JAPAN—adult leading role, USA_AS_r: USA—adult supporting role, and JAPAN_AS_r: JAPAN—adult supporting role.
Table 6. Classification performances among all features. Acc denotes accuracy, Sen denotes sensitivity, and Sep denotes specificity. Train denotes training group, and test denotes testing group. Data is represented as %.
Two ClassAcc. TrainSen. TrainSpe. TrainAcc. TestSen. TestSpe. Test
USA all vs. Japan all96.2095.7396.6769.5269.9269.51
male vs. female95.6494.4196.5260.7153.2466.53
USA-adult vs. Japan-adult96.3096.1096.5167.0768.7765.77
USA_M vs. JAPAN_M96.0095.7196.2065.7967.4364.98
USA_F vs. JAPAN_F95.2596.0094.1068.1373.0463.12
Four class:90.18 43.03
Five class:89.24 43.23
Six class:88.24 38.29
Eight class:79.24 19.82
Table 7. Importance ranking derived in the decision tree for each length features. Data derived from classifications between USA all vs. Japan all.
FeatureImportanceFeatureImportanceFeatureImportance
L210.06L184.67L52.73
L19.54L64.13L151.73
L86.67L103.93L41.32
L166.00L113.40L31.07
L135.64L203.13L141.06
L95.37L173.11
L75.33L122.90
Table 8. Decision tree classification performances for the body parts. The features were selected from the high importance values in Table 7. H denotes head, C denotes chest, L denotes leg, and Ha denotes hand. The highest classification accuracy of each part are bold marked for both the training and testing groups.
Body PartFeaturesAcc. TrainSen. TrainSpe. TrainAcc. TestSen. TestSpe. Test
HL183.9686.7480.8356.3160.5552.46
L282.5283.0181.9061.4964.8558.39
L1 + L289.4190.2688.4263.4466.1660.99
CL884.9086.5783.0158.6163.4554.28
L982.6683.9481.1357.2759.8555.35
L1385.6685.0186.2964.3466.6062.34
L8 + L988.7989.1288.3757.9561.9054.61
L8 + L1390.6692.2188.9261.5364.2059.26
L9 + L1389.0489.5988.3960.8464.3957.49
L8 + L9 + L1391.4291.9590.8260.7263.8457.79
LL16 + L1781.8482.0181.5455.0458.9051.36
L18 + L1972.7579.0865.6045.6051.8939.95
L16 + L1888.0588.9087.0757.2760.1254.74
HaL10 + L1183.6086.4980.3757.4860.4555.00
H + CL1 + L2 + L8 + L9 + L1394.4895.4893.3767.4668.9666.27
H + LL1 + L2 + L16 + L1892.8893.2192.5065.2867.9362.70
H + HaL1 + L2 + L1092.0992.2291.9163.9767.5360.72
C + L93.5693.8893.1865.2667.3363.32
C + Ha92.5592.8992.1459.0662.3356.12
L + Ha90.6990.6790.6658.4360.0357.30
H + C + L94.5895.1893.9166.2069.0363.55
H + C + Ha94.96 95.9793.8666.8369.2864.95
C + L + Ha93.7893.9993.4964.2066.4562.40
H + C + L + Ha94.7995.5893.9166.2869.8362.88

