Article

Bimetallic Mo–Fe Co-Catalyst-Based Nano-Carbon Impregnated on PAC for Optimum Super-Hydrophobicity

1
Nanotechnology & Catalysis Research Centre (NANOCAT), IPS Building, University of Malaya, Kuala Lumpur 50603, Malaysia
2
National Chair of Materials Sciences and Metallurgy, University of Nizwa, Sultanate of Oman, Nizwa 611, Oman
3
Department of Civil Engineering, Faculty of Engineering, Al-Maaref University College, Ramadi, Anbar 31001, Iraq
4
Research Centre for Carbon Dioxide Capture and Utilization, School of Science and Technology, Sunway University, Bandar Sunway, Petaling Jaya 47500, Malaysia
5
Department of Engineering, Lancaster University, Lancaster LA1 4YW, UK
6
Petroleum and Chemical Engineering Department, Sultan Qaboos University, P.O. Box 33, Muscat 123, Oman
7
Department of Electrical Engineering, Faculty of Engineering, University of Malaya, Kuala Lumpur 50603, Malaysia
8
Department of Chemical and Petrochemical Engineering, Faculty of Engineering, Faculty of Engineering and Architecture, University of Nizwa, Birkat Al-Mouz, Nizwa 611, Oman
9
Al Manara College of Medical Sciences Amara, 126 Misan, Iraq
10
Chemical Engineering Department, Faculty of Engineering and architecture, University of Nizwa, Birkat Al-Mouz, Nizwa 611, Oman
*
Authors to whom correspondence should be addressed.
Symmetry 2020, 12(8), 1242; https://doi.org/10.3390/sym12081242
Submission received: 14 August 2019 / Revised: 20 September 2019 / Accepted: 27 September 2019 / Published: 28 July 2020
(This article belongs to the Special Issue Nanocatalysis and Symmetry in Chemistry)

Abstract

:
The application of super-hydrophobic nanomaterials for synthesizing membranes with unique physiochemical properties has gained a lot of interest among researchers. The presence of super-hydrophobic materials inside the membrane matrix can play a vital role not only in the separation of toxins, but also to achieve higher water flux with lower fouling tendencies required for an efficient membrane distillation process. In this research, super-hydrophobic carbon nanomaterials (CNMs) were synthesized using powder activated carbon (PAC) as a precursor, whereby the growth was initiated using a bimetallic catalyst of iron (Fe) and molybdenum (Mo). Until recently, no research has been conducted for synthesis and to observe the catalytic influence of bimetallic catalysts on the physiochemical characteristics of the derived CNMs. The synthesis process was carried out using the chemical vapor deposition (CVD) process. The CVD process was optimized using Box–Behnken factorial design (BBD), whereby 15 experiments were carried out under different conditions. Three input variables, which were percentage composition of catalysts (percentage of Fe and Mo) and reaction time (tr), were optimized with respect to their impact on the desired percentage output of yield (CY) and contact angle (CA). Analysis of variance (ANOVA) testing was carried out. It was observed that the developed model was statistically significant. The highest CY (320%) and CA (172°) were obtained at the optimal loading of 5% Fe and 2% Mo, with a reaction time of 40 min. Surface morphological features were observed using field emission scanning electron microscopic (FESEM) and transmission electron microscopic (TEM) analysis. The images obtained from FESEM and TEM revealed the presence of two types of CNMs, including carbon nanofibers (CNFs) and multiwall carbon nanotubes (CNTs). Thermogravimetric analysis was carried out to observe the temperature degradation profile of the synthesized sample. Raman spectroscopic analysis was also used in order to have a better understanding regarding the proportion of ordered and disordered carbon content inside the synthesized sample.

Graphical Abstract

1. Introduction

The fabrication of carbonaceous nanostructured materials is a challenging area of research. Carbon nanomaterials (CNMs), including carbon nanotubes (CNTs), carbon nanofibers (CNFs), and other CNM forms are still attracting great interest in the scientific and industrials communities for their superior surface characteristics and the potential for application in cutting edge technologies to solve environmental and technical challenges [1,2,3,4]. Although there is considerable development required for the fabrication and growth of CNTs, the large-scale synthesis of CNTs is still difficult and constrained by several factors.
Super-hydrophobic carbon nanomaterials (CNMs), which have contact angles (CA) > 150°, play a significant role in tackling many technical problems related to the chemical and physical nature of surfaces and contacts. Therefore, super-hydrophobic CNMs have been involved in various applications, including drug delivery materials [5], adsorbents [6,7], antifouling distillation membrane [8], self-healing membranes [9], and others [10,11]. The fabrication of nanomembrane containing CNMs for membrane distillation (MD) used for desalination depends on the vapor pressure gradients through the super-hydrophobic, carbonaceous, microporous membrane to ensure higher water flux with greater salt rejection rate [8]. The application of CNMs can overall reduce energy consumption, fouling tendencies, and mitigate the frequent replacement of membrane up to a significant level. The physio-chemical properties, including roughness of the surface and surface functional groups, can significantly alter the hydrophobicity of the synthesized nanomaterials [11]. Growing CNMs on other substrates can change the surface chemistry to a greater extent. It can even considerably alter the surface roughness of the synthesized nanoparticles [10]. Therefore, to ensure appropriate surface roughness, as well as the necessary functional groups, over the CNM to retain its super hydrophobicity, an improved fabrication technique is required.
Until recently, CNMs have been synthesized using several methods, including template synthesis, chemical vapor deposition (CVD), crystallization control, electrochemical deposition, etc. [12]. The CVD method is appropriate for the large-scale production of carbon nanomaterials using different carbonaceous sources and can be deposited using various types of transition metal (Fe, Co, and Ni) catalysts at higher temperatures (500–1200 °C). Among all the methods, CVD is considered as the most efficient one owing to its widespread accessibility, and simple operating procedure with higher product yield [13,14]. Silicon oxide and alumina and other oxides are the main conventional substrates utilized for the CVD process. However, to obtain highly pure carbon samples, further chemical purification processes are needed. Therefore, they are not suitable for certain environmental applications. Therefore, powder activated carbon (PAC) can be considered as a promising alternative precursor due to its lower cost, easy availability, and better possibility for surface modification by chemical treatments [12,15,16]. Due to the variation in the types of PAC extracted from different sources as well as the variables for CVD process and catalyst types, the physiochemical properties of the synthesized nanocarbon samples can be unique and vary greatly across different samples. PAC was used earlier to obtain nano-fibrous carbon (CNFs) where iron (Fe) was used as catalyst in presence of ethylene (C2H4) gas flow during the CVD process [12,17,18,19,20]. On the other hand, modification of CNM structure has been done by other researchers to achieve artificial super-hydrophobic surfaces. Optimization of the synthesis of super-hydrophobic CNMs could be hampered due to the aggregation property of CNMs and impurities [21]. The hybrid PAC–CNMs maintain the chemical compatibility between these two materials and combine the characteristics of PAC and CNMs.
The quality and yield of CNMs produced by CVD can be enhanced by using an appropriate catalyst as it plays a substantial part in the synthesis process. The catalyst can initiate the decomposition of hydrocarbons at a lower temperature to accelerate new nucleation to form CNMs compared to the un-catalyzed hydrocarbon decomposition process using heat only. It was reported earlier that some metals such as Ni, Co, or Fe, which have few d-vacancies, are suitable catalyst for nucleation and growth of CNTs [21,22]. Application of appropriate chemical agent or catalyst having optimum ratio can produce CNTs with unique mechanical, physical, chemical, electrical, and thermal properties which are essential for efficient membrane separation [21,22].
Even Some other transition metals have a strong adhesion to grow CNMs as compared to others such as Fe, Ni, and Co, therefore they have been used efficiently to form high-curvature (low-diameter) CNMs [23]. Other transition metals like Mo, Cu, Ag, Cr, Mn, and Pd are also used as catalysts for synthesis of CNMs [24,25]. It was found that not only growth rate and diameter are highly influenced by the catalyst type and composition, but also the CNM’s microstructure and morphology [26]. Moreover, synthesis of CNMs from hydrocarbons has a synergistic catalytic effect with bimetallic catalysts [27,28,29]. For example, the growth of CNMs was improved by using bimetallic catalysts such as Fe–Co, Co–Mo, and Fe–Ni [30,31,32,33,34]. All of the above-mentioned catalysts (single or bimetallic catalysts) were successfully used with substrates other than PAC in most cases, due to the difficulties in formation of metallic nanocluster on the surface of PAC with conventional methods.
The conventional method for any chemical synthesis process by changing one variable at a time and keeping other variables at a fixed level cannot demonstrate the combined effect of all the variables on the desired output. Thus, multivariable processes needs a large number of experiments to be carried out, which is time consuming and not efficient enough to illustrate the interaction effect [35]. In this context, the application of response surface methodology (RSM) using Box Behnken Design (BBD) is considered as an appropriate method which can systematically describe the linear, nonlinear, and interaction effect between the factors [36]. In this research, the CVD process was optimized using BBD design. The combination of more than one catalyst at a time affects the characteristics of the grown CNMs due to the interaction between the substrates’ physiochemical nature and different types of metals’ behavior. To the best of our knowledge, until now, no research has been conducted to observe the effect of binary metal catalysts on the growth of nanostructured carbonaceous materials using powdered activated carbon (PAC) as a starting precursor. In this research work, the combination of a binary metal catalyst (Fe/Mo) is used and PAC is used as a starting precursor to produce super-hydrophobic CNMs which have unique features suitable for membrane fabrication and separation processes. The thermal CVD method was used to decompose acetylene as a carbon source at 650 °C. The Optimum Yield% of carbon and contact angle (CA) were chosen as the output responses using the RSM approach. The goal of this study is to produce super-hydrophobic CNMs which can be used for several applications, such as sorption [6,37], membrane distillation [38], separation of organic components in mixture, purification of water, and catalysis [39].

2. Materials and Methods

2.1. Materials and Reagents

Iron nitrate Fe (NO3)3·9H2O, ammonium molybdate tetrahydrate (NH4)6Mo7O4·4H2O, PAC, and acetone were purchased from Sigma Aldrich, Malaysia. Acetylene gas (C2H2), hydrogen gas (H2), and nitrogen gas (N2) were purchased from GasLink Industrial Gases SDN BHD, Malaysia. Analytical grade reagents and chemicals were used in this research. Thus, no additional purification steps were necessary for conducting the experiments.

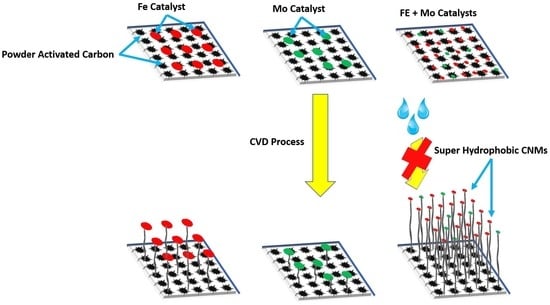
2.2. Synthesis of Binary Metal Catalyst

The bimetallic catalysts (iron and molybdenum) were first dissolved in acetone using their salts. Then incipient wetness method was used to deposit the catalyst over the surface of the PAC. Different weight percent (w/w%) samples of the catalysts (as shown in Table 1) were prepared. The ratios between PAC and catalysts were calculated based on the design matrix provided by BBD design. According to Table 1, the catalysts solution was prepared by dissolving the desired amount of the catalysts in 5 mL of acetone solution. The mixture was kept inside the universal glass bottle and stirred until all the catalysts salts were completely dissolved.

2.3. Impregnation Powdered Activated Carbon (PAC)

The metallic catalysts (iron and molybdenum) were impregnated on powdered activated carbon (PAC). After the catalysts were dissolved in acetone, PAC (2 g) was added into the same solvent in a glass bottle and placed in a sonication bath at 40 KHz and 60 °C for 6 h until all the solvent evaporated, then moved to a conventional oven at 100 °C overnight to ensure complete moisture evaporation. The dried sample thus obtained was finely grounded. The powdered mixture obtained was stored using a desiccator to prevent moisture adsorption and sent for further application.

2.4. Synthesis of Nanostructured Carbon (CNMs)

The desired ratio of catalysts and PAC was mixed and transferred to the ceramic boat (50 mm OD, 40 mm ID, 1500 mm L). This boat was then inserted inside the CVD reaction tube. Under inert atmosphere (N2, 200 mL/min), the sample was first calcinated at 350 °C for 2 h. An in situ reduction process of the calcined sample was carried out by passing hydrogen gas (200 mL/min) at 450 °C for another 2 h. The final product thus obtained was the reduced sample which was then cooled down to room temperature. At this stage, the amount of moisture present in the sample was determined by weighing the sample (WC).
The reduced catalyst mixture was placed inside the tubular ceramic reactor at atmospheric pressure where a mixture of acetylene (50 mL/min) and hydrogen (200 mL/min) gas was flown. For growth of CNMs, the acetylene to hydrogen gas ratio was kept at 1:4 and the reaction was carried out at 650 °C for different reaction time as provided by the design matrix. After the reaction was completed, the reactor was cooled down using N2 gas flow (200 mL/min). As-synthesized CNMs were then collected from the ceramic boat and weighed (WP). The carbon Yield% was calculated using Equation (1).
Y % = ( W p W c ) / W c
where WP and WC are the weight of sample after and before of the reaction, respectively.

2.5. Equipment and Measurements

All the weighing measurements were recorded using four digits weighing balance (HR-202i, Japan) in a range between 0.001 and 220 g. A predetermined weight of powdered activated carbon (PAC) was physically mixed with the catalyst solution and the resultant mixture was placed inside the ultrasonic bath model (JAC 2010 P, South Korea) to ensure proper impregnation of metal catalysts onto PAC substrate. It is equipped with three levels of sonication, a timer up to 99 min, and heater up to 90 °C. The drying of PAC and CNMs samples was carried out in a drying oven (Model 600-Memmert, Germany), where the maximum temperature can be set up to 220 °C. The CVD process was carried out using an OTF-1200-80 mm dual-zone tube furnace for growth of CNMs. The tube furnace contains a tubular reactor which is equipped with a fused quartz tube with a diameter of 50 mm (OD: 80 mm; ID: 72 mm; length: 1000 mm). The heating area was covered with a heat-resistant glass wool procured from Isolite Ceramic Fiber Sdn. Bhd. Malaysia.
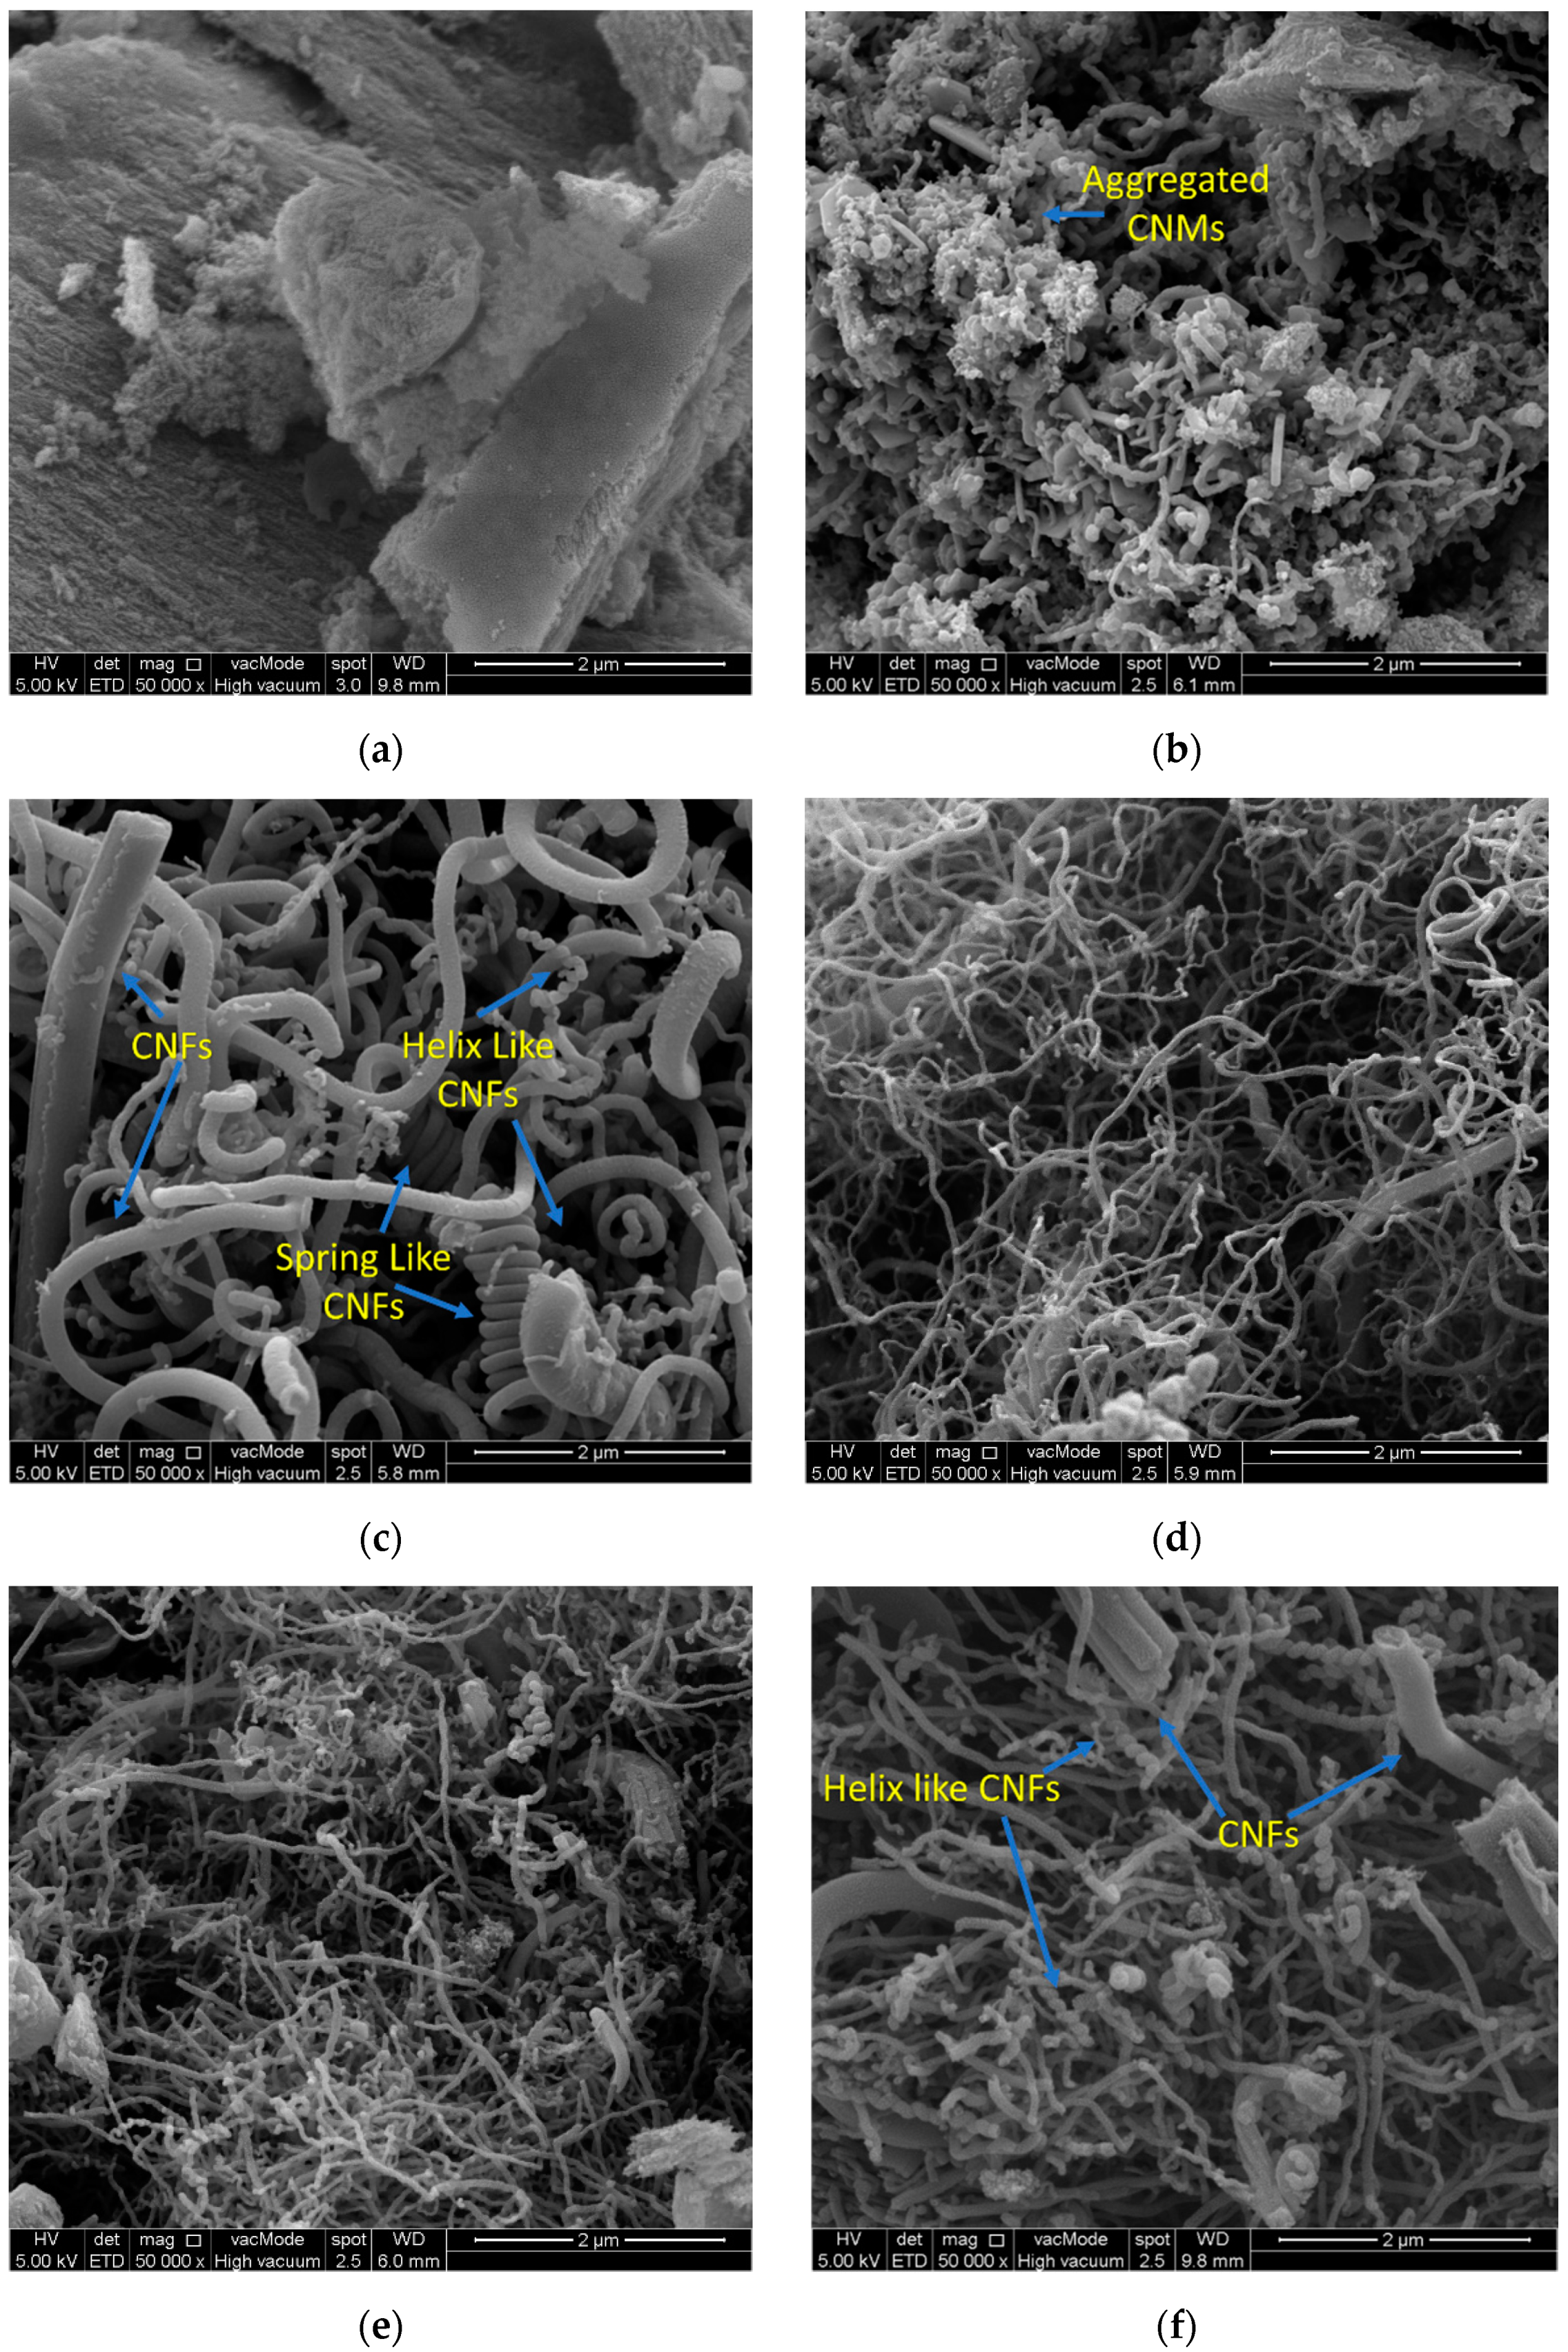
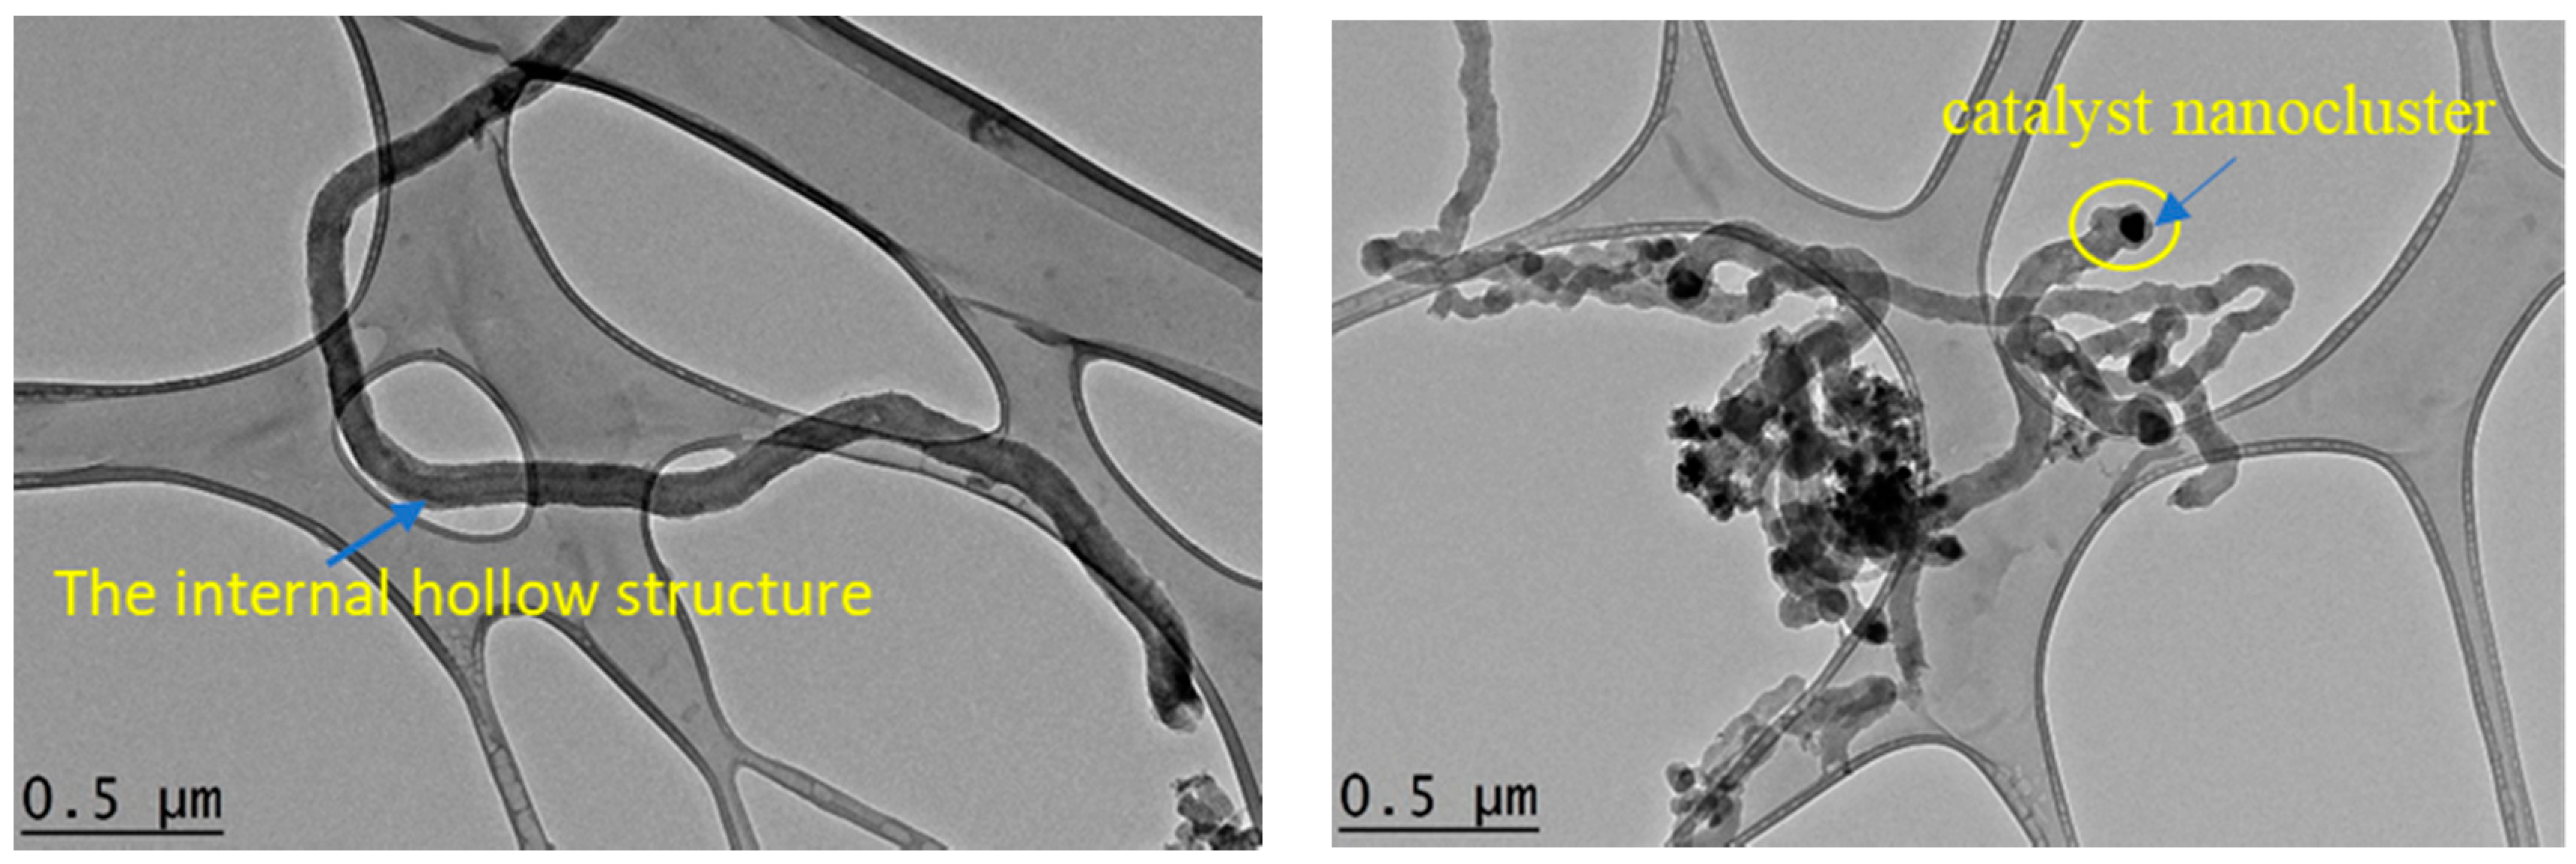
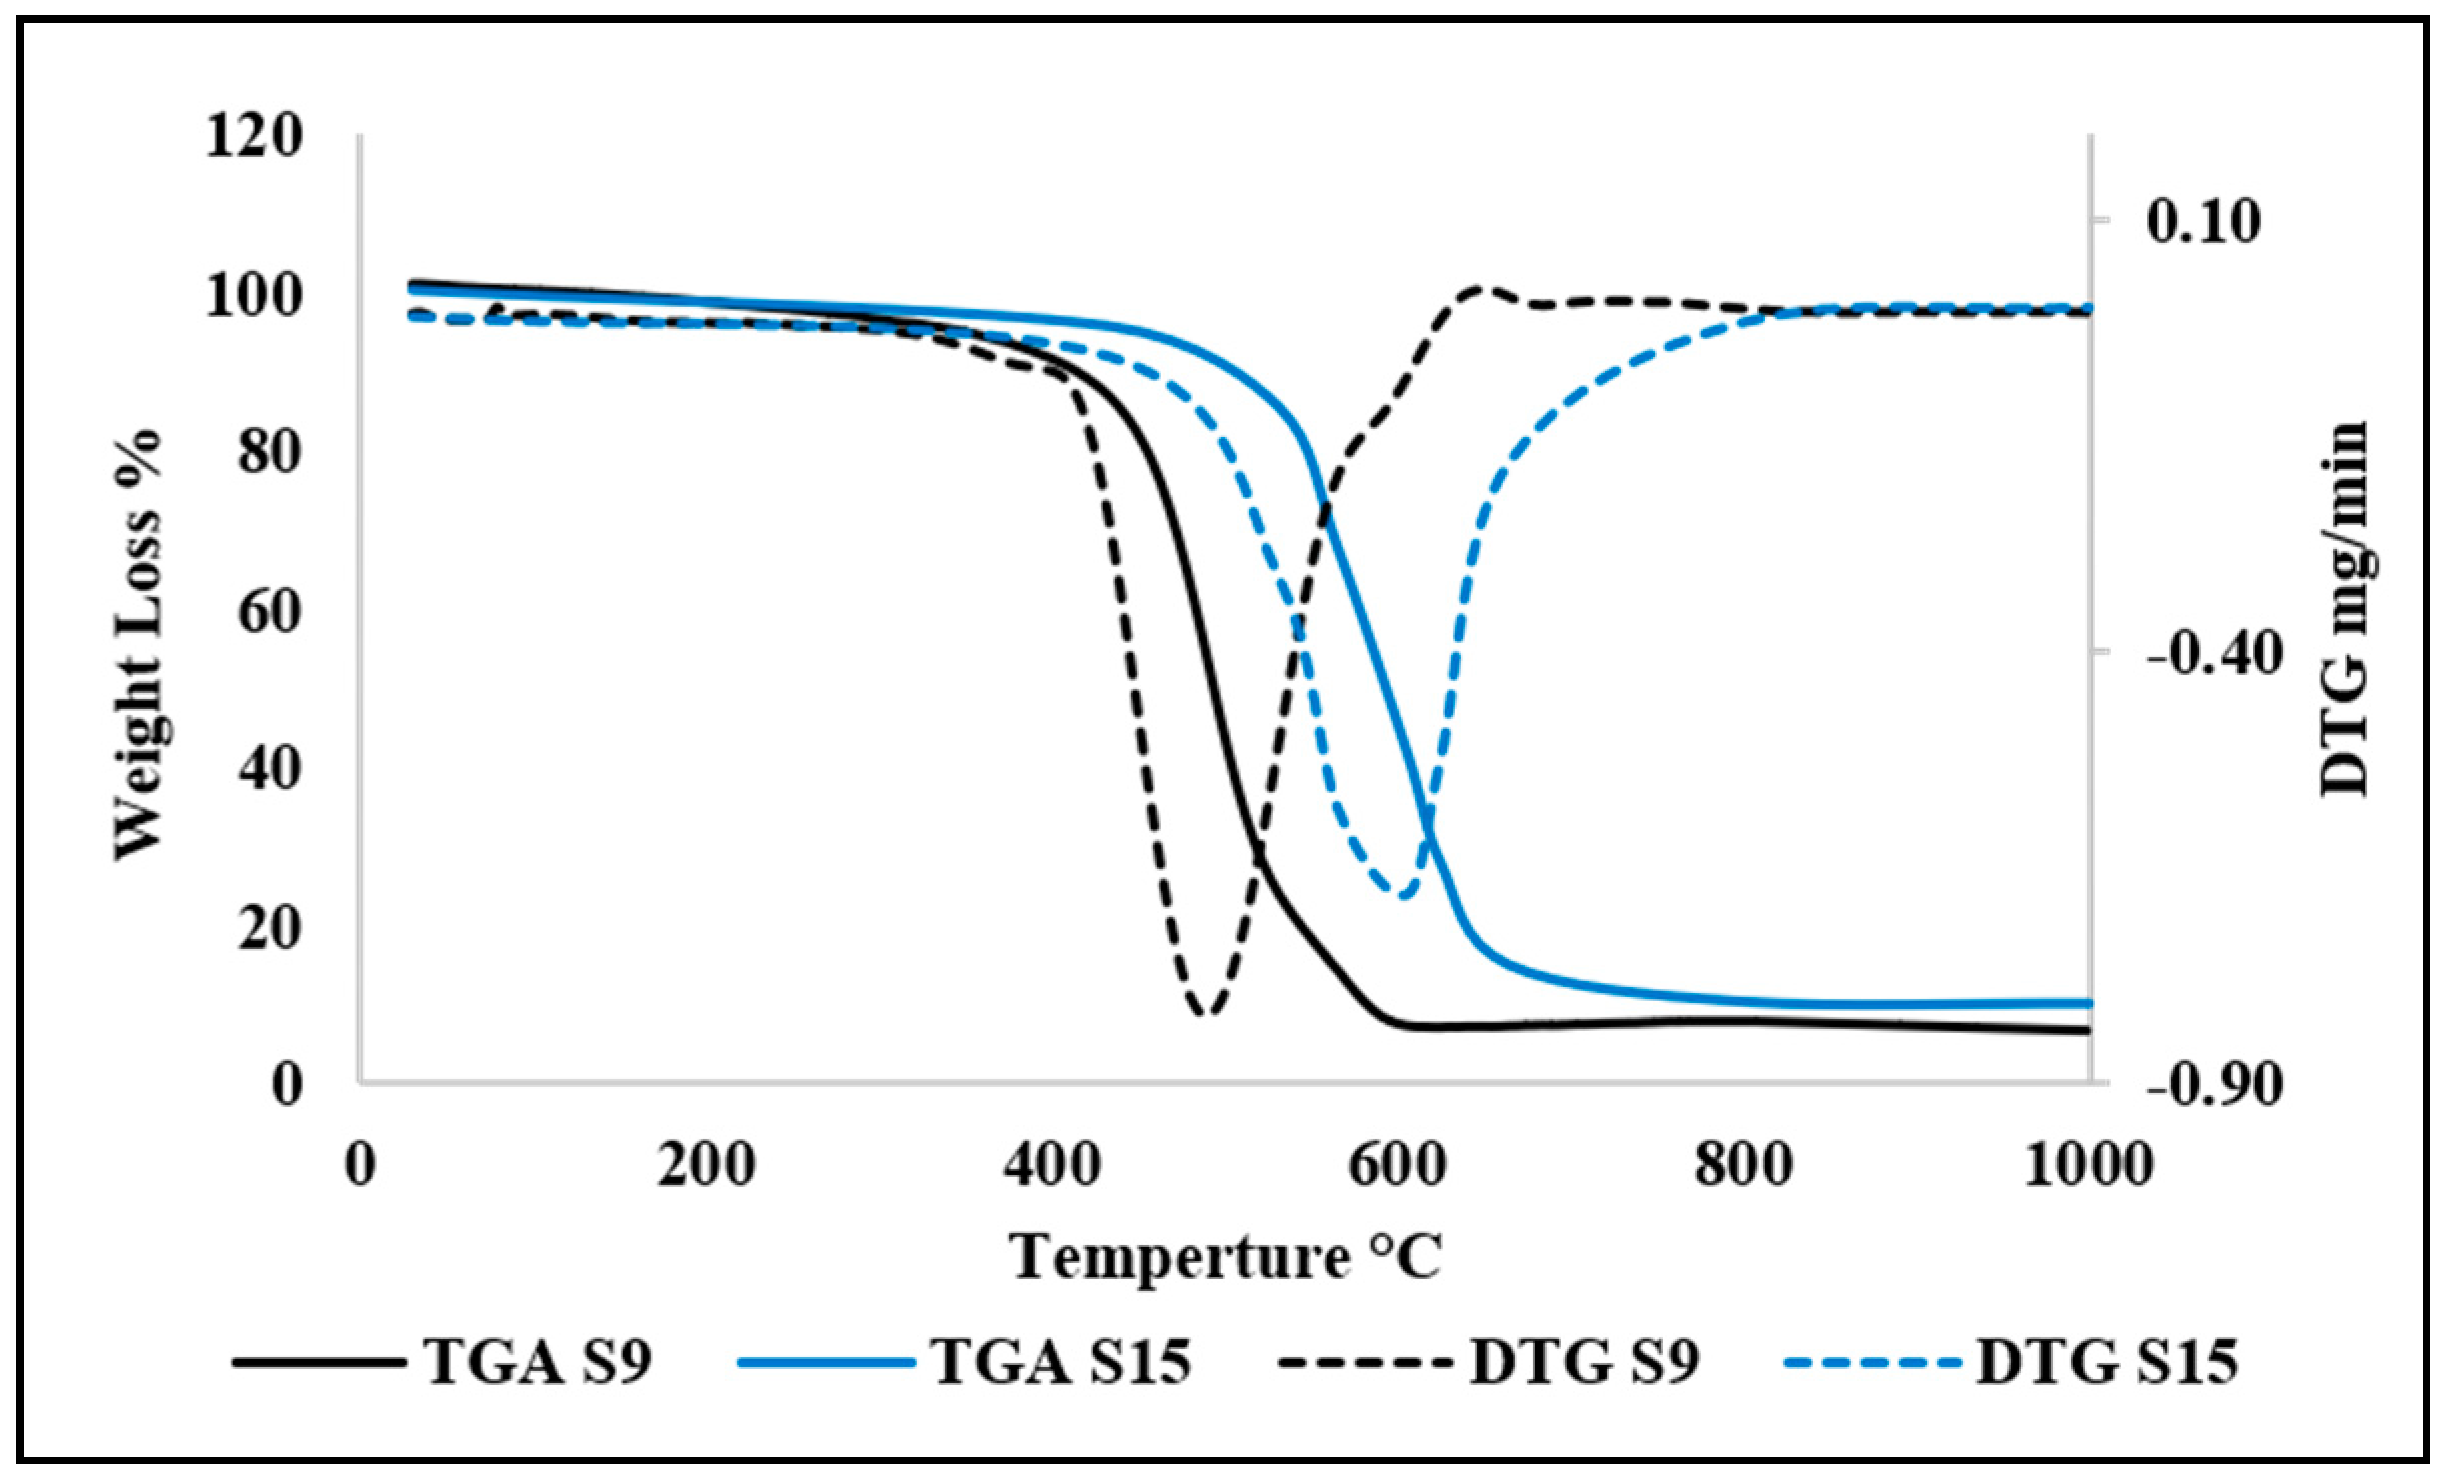
Characterization of the synthesized samples was carried out to classify the type and shape of nanomaterials. Field Emission Scanning Electron Microscopic analysis (FESEM—Hitachi-SU8000, Japan) was used to observe the morphology of the prepared samples. A layer of platinum was coated over the Aluminum stubs by sputtering and the synthesized sample was placed over it for FESEM analysis. Transmission electron microscopic (TEM) analysis was carried out using an Hitachi-HT7700, Japanese microscope at 120 kV. Synthesized samples were mixed with acetone and the mixture was ultrasonicated. After ultrasonication, a drop of the sample was deposited over the copper grid-supported perforated carbon film. The average diameter and particle size distribution of the nanomaterials were calculated using Image-J software. Contact angle measurement (CA) was carried out by KRUSS Goniometer (DSA100). A microscopic slide made of glass (76 × 26 × 1.2 mm) was covered with double-sided adhesive tape and was used to measure the CA between the nanomaterials and water, wherein water drops (4 μL) were placed onto the CNM’s surface that was pasted onto the tape. The average of triplicate measurements for each sample was taken. The oxidation behavior of the prepared nanomaterials was examined by thermal gravimetric analysis (STA-851, Mettler Toledo, Columbus, OH, USA) at the temperature range of 25–800 °C, heating rate of 10 °C/min, and an oxygen flow rate of 20 mL/min. The Raman spectra of the CNMs were obtained, whereby the laser power was kept constant at 100 using an Ar+ laser (514 nm) and it was focused (50× objective) over an area with a size of around 1.5–2.0 μm (Renishaw in Via, UK).

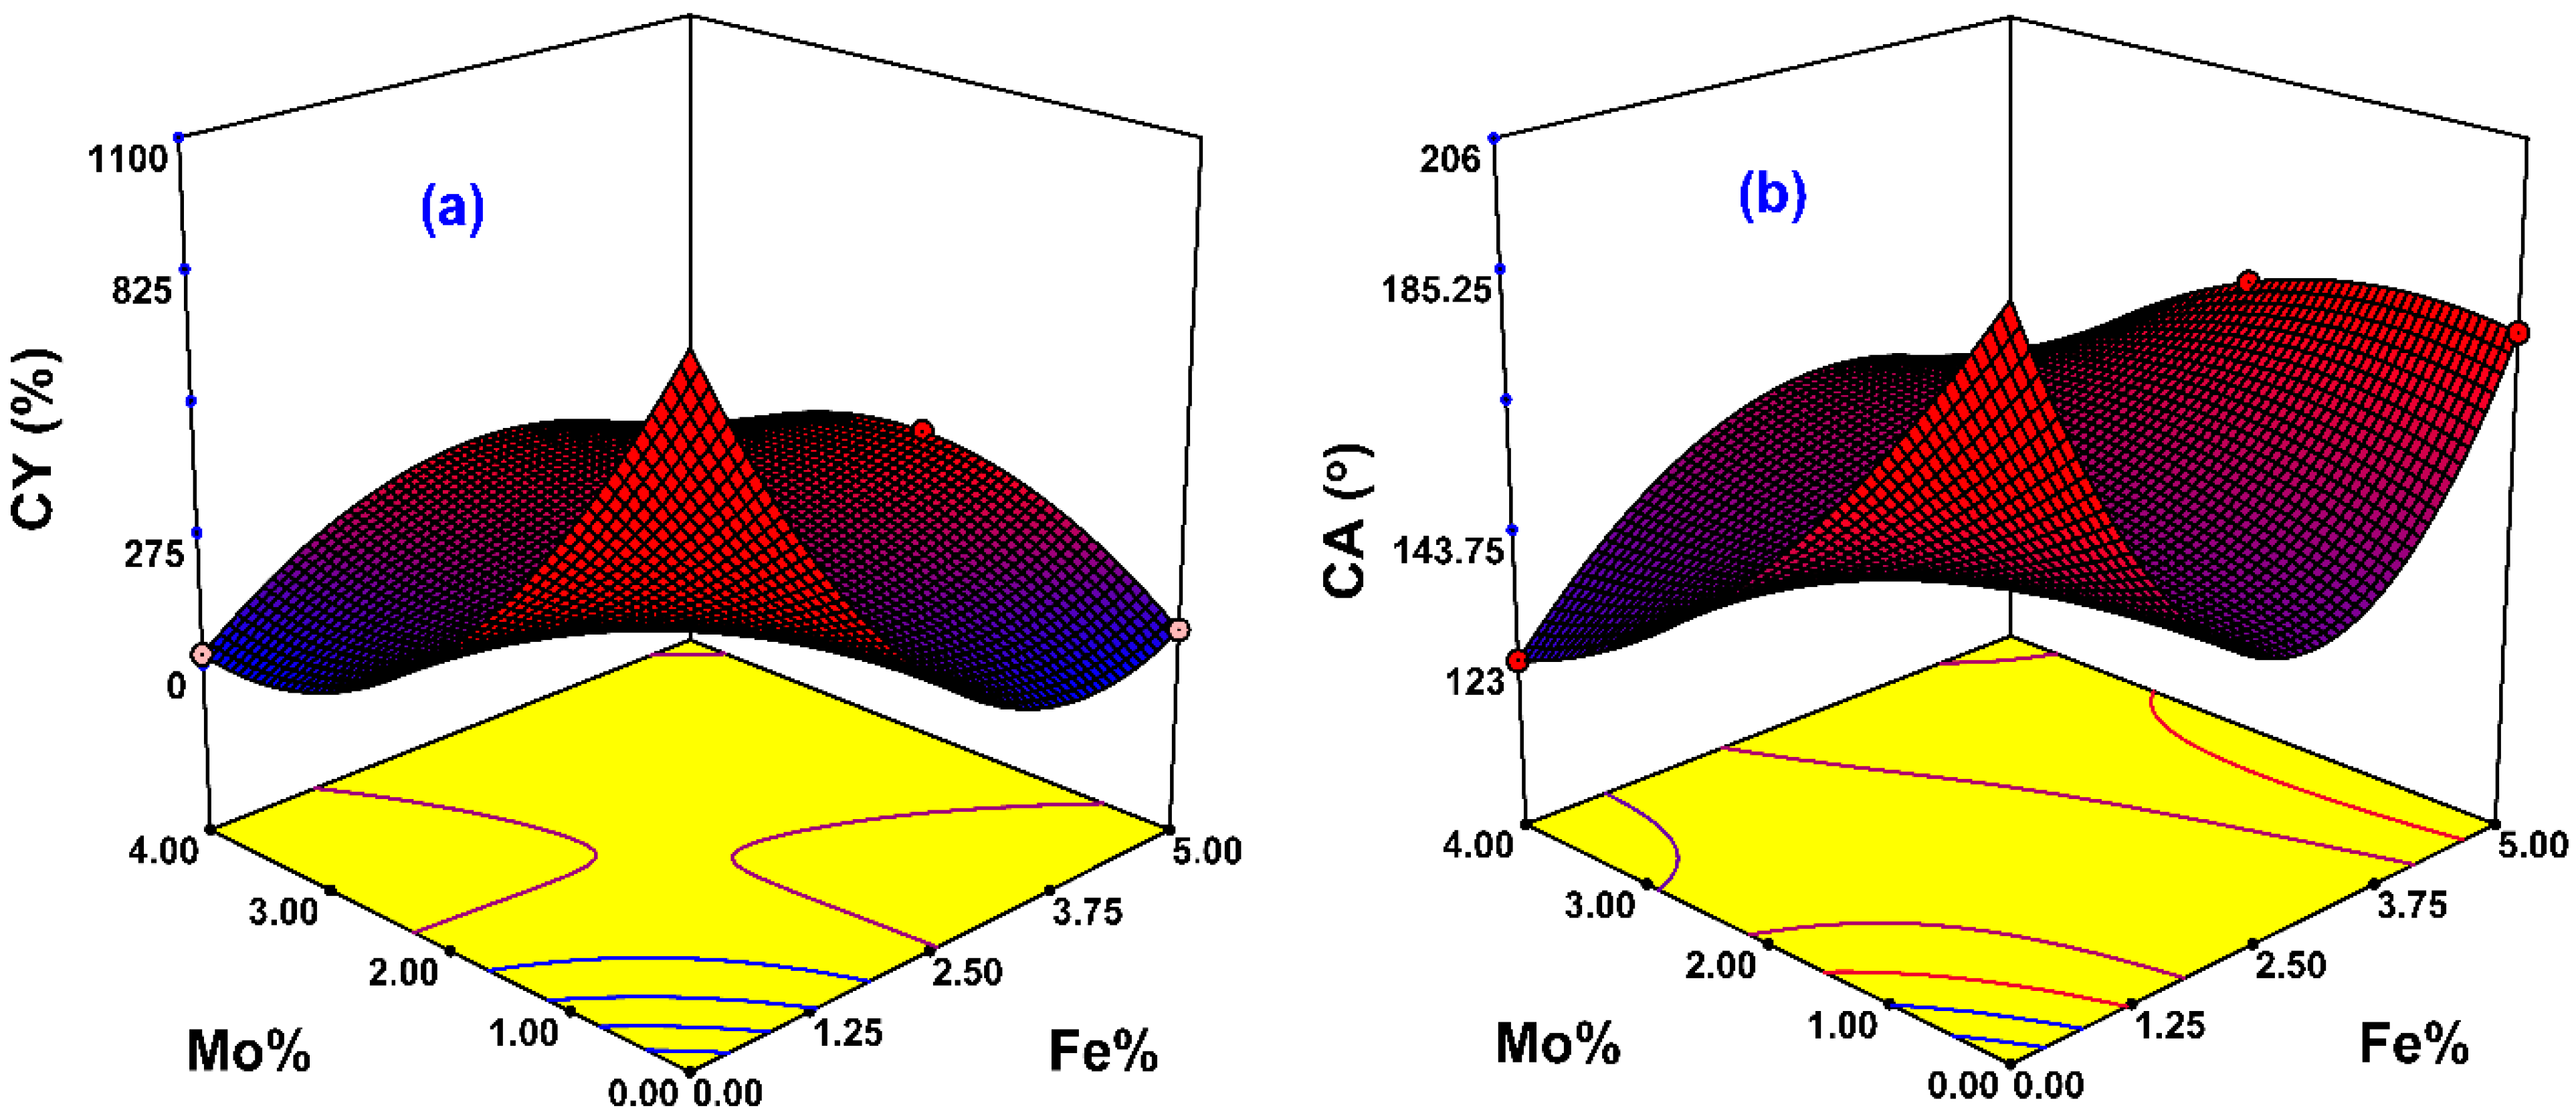
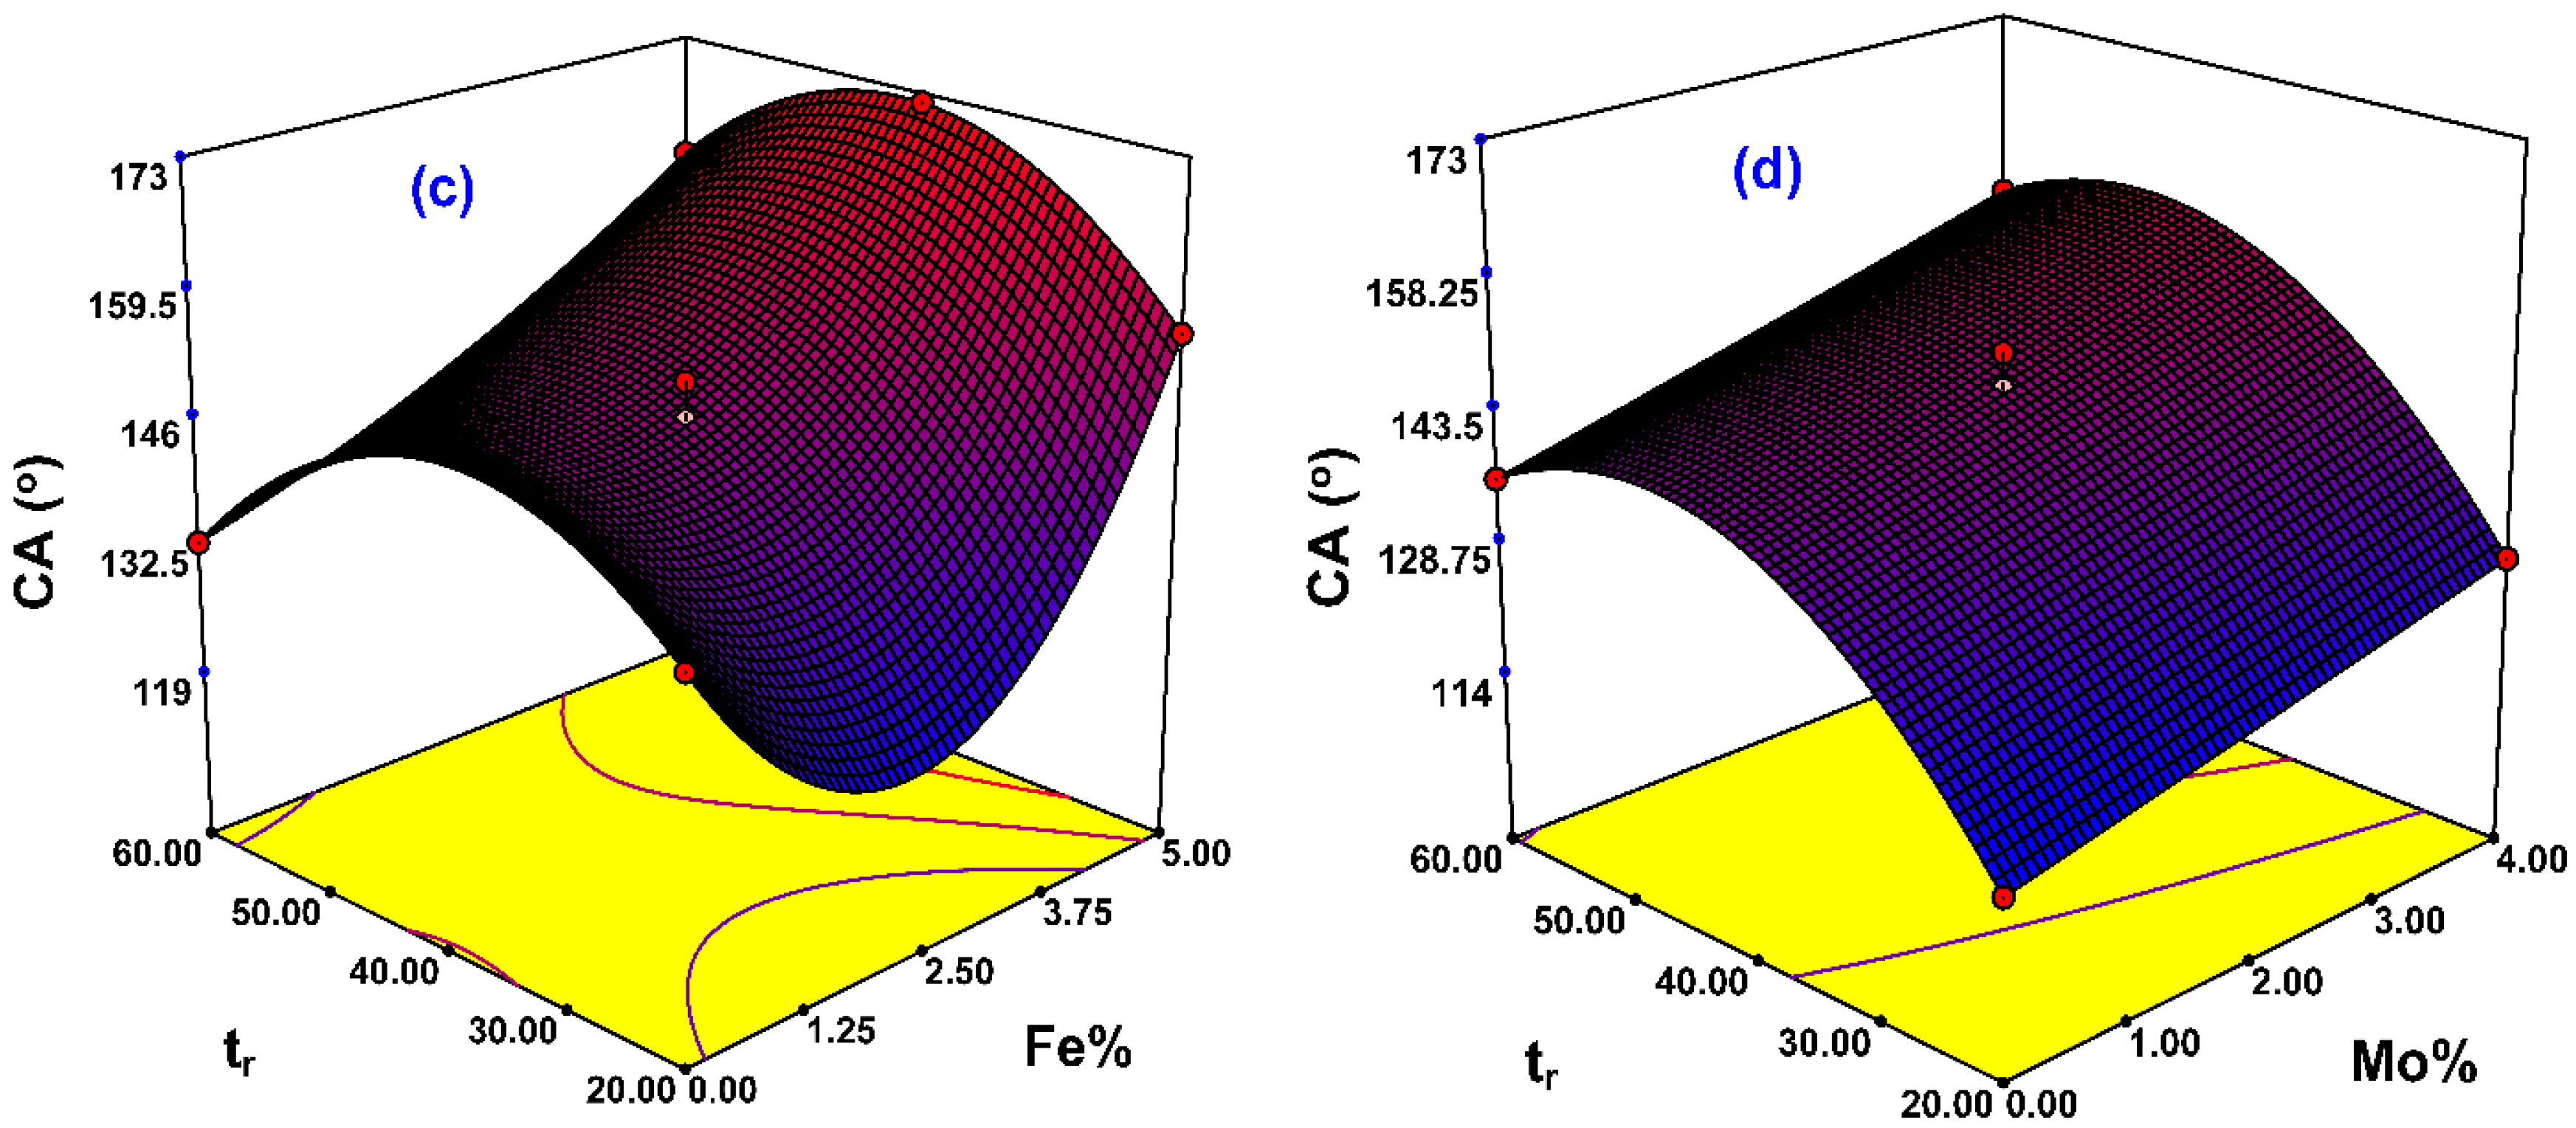
2.6. Response Surface Methodology and Process Optimization

The influence of three sovereign variables, Fe (Fe%), Mo (Mo%), and tr (reaction time), on the two responses, carbon yield (CY) and contact angle (CA), were determined. Design-Expert V7.0 was used and Box–Behnken design (BBD) was employed by using the response surface methodological approach (RSM). RSM was used to elucidate the effects of the main and combined input variables on the output responses selected here (Yield and Contact Angle). It is also used to optimize the process by developing models with the subsequent ANOVA analysis. Therefore, 15 experimental runs were proposed by DOE based on BBD with 3 center points. The independent variable ranges studied were Fe% (0%–5%), Mo% (0%–4%), and reaction time (20–60 min), while gas ratios, temperature, and gas type were fixed at an acetylene to hydrogen ratio of 1:4, 650 °C, and acetylene gas, respectively. The complete design matrix confirming the actual experimental design and the responses are illustrated by Table 1. The adequacy of the developed model was checked using Analysis of variance (ANOVA). The coefficient of determination (R2) was determined to illustrate the certainty of the suggested model.

3. Results and Discussion

The optimum percentage weight of 5% was found to give a high yield% when Fe was impregnated on PAC in a previous study reported by our research group [40]. CA was selected mainly as an objective function response for the modelling and optimization process to investigate the effects of synthesis conditions (catalyst compositions and reaction time). This technique is unusual in such kinds of reactions where other researchers usually focus on yield or the geometry of the nanoproducts, which have also been covered in the current work.

3.1. Modeling and Statistical Analysis

After conducting the 15 experimental runs, the responses (CY and CA) (as shown in Table 1) were fitted to different models. The models including mean, linear, two-factor interaction (2FI), and quadratic model terms (Equation (2)), and the results obtained are presented in Table 2 and Table 3, respectively.
Table 4 illustrates the ANOVA results obtained for Yield% responses. As noticed from Table 4, the main effects on CY, namely the Fe%, the Mo%, the interaction of Fe% and Mo%, the interaction of the Fe% and reaction time, the interaction of the Mo% and reaction time, the second-order effects of the Mo% and the reaction time, the interaction of the second-order effects of the Fe% and the Mo%, and the interaction of the second-order effects of the Mo% and the Fe%, were significant. The Prob > F values were less than 0.05; thus, the model is significant. Therefore, it can be inferred that the Fe, Mo, Fe × Mo, Fe × tr, Mo × tr, Fe2, Mo2, tr2, Fe2 × Mo, and Mo2 × Fe were the main determinants for Yield%. The other factors as can be observed from Table 4 have Prob > F values greater than 0.05. Hence, those parameters had negligible impacts on CY. The polynomial equation for CY% is given by Equation (2).
C Y =   + 190.63   + 49.92 F e + 61.57 M o + 0.82 t r + 256.62 F e . M o + 42.47 F e × t r 10.88 M o × t r + 80.14 F e 2 + 35.14 M o 2 116.90 t r 2 297.59 F e 2 × M o 7.00 F e 2 × t r 258.84 F e × M o 2  
Figure 1a depicts a simulation model as an assessment pictorial representation between model values of Yield% predicted from the above Equation (2) and the experimental results. Figure 1a demonstrates an excellent correspondence between the predicted and experimental values of CY. The ANOVA results obtained for contact angles (CA) are illustrated by Table 5. The effects of Fe and Mo were significant, with Prob > F values less than 0.05. Moreover, it was found that the reaction time (tr) was also significant. As such, we can infer that Fe, Mo, tr, Fe × Mo, Fe2 × MO, and Fe2 × tr were the main determinants of CA. The other equation parameters, such as Fe.tr, Mo.tr, Fe2, Mo2, and Fe.Mo2, showed Prob > F values larger than 0.05. Therefore, it can be concluded that these factors had minimum effect on CA. The polynomial equation for CA is given by Equation (3).
C A = + 146.67   + 10.50 F e + 7.25 M o + 11.75 t r + 12.08 F e . M o + 3.00 F e × t r + 0.75 M o × t r + 14.83 F e 2 + 0.083 M o 2 14.50 t r 2 36.33 F e 2 × M o 12.25 F e 2 × t r 13.08 F e × M O 2
Figure 1b demonstrates the actual values versus predicted values of CA predicted from the above Equation (3), and the experimental results obtained here showed good correspondence with the predicted values of CA.

3.2. Effect of Catalysts Composition on CNMs Yield% and Contact Angle (CA)

The effects of catalysts loading on CY and CA were investigated. Three-dimensional surface contour plots with surface mesh were plotted to observe the interaction effects of the process parameters on CY and CA using Figure 2a,b, respectively. Figure 2 shows the effects of the catalysts loading on Yield% and CA at a fixed reaction time (40 min). A proportion of 5% of Fe loading was effective for maximum CNMs yield% and diameter [36]. In this work, sample S9 showed a yield% of 76.38%. It was found that combining Mo with Fe catalysts gave a higher percentage yield of CNMs, up to certain extent. This is observed for sample S15, which showed the best Yield% of 320.6%. The application of Mo catalyst higher than 2% gave less Yield%. This might be due to the possible agglomeration of Mo metal rather than taking part for the growth of CNMs. Thus, a further increase in Mo% caused drastic weight loss percentage or yield% of CNMs.
Catalysts used in the synthesis of CNMs are mostly transition metals, particularly Fe, due to the limitation of carbon solubility in these metals [41]. Fe is widely used because it has an unfilled “d” orbital and, therefore, it can interact with hydrocarbons and offer its catalytic activity. On the other hand, Mo is known to be catalyst promoter to decompose the hydrocarbon gas into helical and Y-shaped CNMs. Molybdenum was also found to be an effective catalyst dispersive agent. It is used and mixed with other catalysts in optimum conditions [42]. The addition of Mo to an Fe catalyst plays an important role as it can increase the initial conversion of C2H2 and restrain the fast catalyst deactivation. An additional advantage of using Mo as a co-catalyst can be attributed to the formation of Fe–Mo eutectic mixture, resulting in a reduction of melting point, which results in absorption of Fe onto the surface of Mo, which consequently affects the shape of the catalyst, leading to the variation of CNM shapes.
The hydrophobicity of the prepared CNMS samples is presented in Table 1 and Figure 3. PAC films usually have a CA of 65° and it is a hydrophobic substance. But the presence of CNMs which grew using Fe 5% as a catalyst showed an apparent CA of 176°. The CA value started to increase as the Yield% increased, and for the best Yield%, the apparent CA obtained was 172° (Figure 3a). This suggests that the formation of more CNMs was the main reason for the high hydrophobicity. The main two factors that affect the surface wettability of CNMs are the surface roughness and surface chemistry [43,44]. The CNM growth imparts a rougher surface area and reduces the gaps available for droplets of water. Meanwhile, higher CNM growth led to denser unfunctionalized stable carbon atoms which have a low affinity to attract water molecules.

3.3. Effect of Reaction Time on Yield% and Contact Angle (CA)

The effects of the reaction time on yield% and CA were investigated. The combined effects of the reaction time and catalyst percentages (Fe or Mo) on Yield% and CA are demonstrated by 3D surface contour mesh diagrams. These curves were plotted using the empirical model developed earlier and are shown by Figure 4a,c and Figure 4b,d for yield% and contact angle (CA). Figure 4a,b shows the response surface plots for the effects of the reaction time at a fixed 2% Mo on: (a) Yield% and (c) CA, and at fixed 5% Fe on: (b) Yield% and (d) CA. However, the Yield% increases with increasing reaction time from 20 to 40 min, as shown in Figure 4a,c. The increased Yield% can be attributed to the increase in reaction time, which results in increasing the decomposition rate of C2H2. Increased reaction time can increase the catalyst’s activity and ensure its adequate diffusion inside the carbon matrix. However, increasing the reaction time beyond 60 min has a negative effect on yield%. This could be attributed to the degradation of CNMs after 40 min, as there are two main reactions taking place in the CVD reactor, which are the growth and degradation (oxidation) reactions (due to the existence of some trace amounts of oxygen impurities in the gases). After 40 min of CNM growth, the diffusion rate of carbon into the catalyst decreases with increasing reaction time as the catalysts were deactivated due to coverage with CNMs, and eventually approaches zero, allowing the degradation reaction to take place [45].
The effects of the reaction time on CA at 5% Fe and 2% Mo are shown in Figure 4b,d, respectively. Similar to yield%, there was a noticeable increase in CA with increasing reaction time, from 20 to 40 min, as shown in both plots. However, increasing the reaction time to 60 min resulted in a drop in CA due to the direct relation between the reaction time and CY, as it increases the surface roughness, as explained before.

3.4. Optimization Study

After developing a significant empirical statistical model, statistical optimization was carried out. All the input variables were selected between preselected experimental ranges. The ultimate target is to obtain maximum yield%, as well as CA. Some sets of predicted solutions were obtained as potential optimization conditions, which were additionally classified by desirability, as listed in Table 6. The highest desirability for the optimum process conditions solution was 5% Fe, 2.18% Mo, and a reaction time of 40 min, which resulted in a yield% of 315.139% and a CA of 173°. For the purpose of experimental verification, an experiment was carried out under suggested optimum conditions. These results show that the experimental values for yield% and CA were 312.5% and 171°, which were quite consistent with the model predicted values.

3.5. Surface Morphology Analysis

The surface morphological features were analyzed using FESEM images, as illustrated by Figure 5a–f. The images of PAC–CNM for six selected samples (samples 2, 4, 6, 9, 13, and 15, respectively) with 50,000× magnification are shown below. Figure 5d displayed the FESM image of S9, which was found to have the highest CY and CA by using Fe as a catalyst and a reaction time of 40 min. Two types of carbon nanomaterials found in this sample were carbon nanofibers (CNFs) and multiwall carbon nanotubes (CNTs). Figure 5a displayed the FESEM image of S2, which was prepared by using only Mo as a catalyst and a reaction time of 40 min. It was found that using only Mo as a catalyst gave very poor CY, which indicates very poor growth of CNMs. Figure 5b displayed the FESEM image of S4, which was prepared by using 2.5% of Fe and 4% of Mo as catalysts and a reaction time 60 min. This image revealed that using a high amount of Mo and high reaction time produced aggregated CNMs and CNFs, as such these experiment conditions are not preferred. The FESEM image (c) of S6 was prepared by using the same amount of Fe catalyst and reaction time as compared to that of S4, but a lower amount of Mo catalyst of (2%). This image showed 4 different types of CNMs as helix-like CNFs, spring-like CNFs, CNTs, and CNFs. Figure 5e,f displayed the FESM images of S13 and S15, respectively. These images showed 3 different types of CNMs as helix-like CNFs, CNFs, and CNTs.
Figure 6 shows the TEM images of S15. The images revealed the MWCNT internal structure, as well as CNFs, which were attached to the amorphous PAC surface. The internal hollow structure gave clear evidence of the formation of MWCNTs, while the other CNMs were observed as a solid structure. The dark spots in the TEM images are the metallic catalyst nanoclusters where the carbon atoms build up to form the CNTs and other CNM structures around it. It is also clear from the position of the catalyst nanocluster on the top end of the CNTs that the growth mechanism could be a top-down model. In addition, TEM images exhibited a crooked or twisted CNM layout. According to the proposed catalytic growth mechanism, the crooked or twisted CNMs may be the result of a variation of clusters of catalyst crystallization and morphology when conjugated with carbon segregation on the active sites around the catalyst periphery during CNMs growth.
The ImageJ® image processing software (National Institute of Health, Bethesda, MD, USA) was used to determine the average diameter and particles size distribution of CNMs to perform statistically reliable measurements, and several micrographs have been processed for each sample. The minimum number of investigated particles was 200. It was found that the average size diameter (as shown in Table 7) tends to increase as Mo catalyst percentage weight and reaction time increased.
The particle size distribution test result is depicted in Table 7. It was found that using Fe as a catalyst gave around 64% and 20% in the range between 0–50 and 50–100 nm, respectively. However, adding a small percentage weight of Mo increased the size of CNMs. For example, S15 gave around 13% and 68% in the range between 0–50 and 50–100 nm, respectively. It is worth mentioning that the best samples satisfying the definition of CNMs (<100 nm) are those with 2% Mo.

3.6. Raman Analysis

Raman spectroscopy was used to characterize the nature of the prepared CNMs, as shown in Figure 7 for S9 and S15. There was an observation for two unattached peaks at ~1590 cm−1 for G peaks, which corresponds to the movement of the two adjacent carbon atoms moving in opposite directions inside the graphite sheet [45,46], and at ~1350 cm−1 for D peaks, which corresponds to sp3- hybridization of carbon atoms at the sidewalls of CNTs [46]. These peaks usually appear in multiwall CNTs, while the radial breathing mode (RBM) can be spotted in the range of 100–400 cm−1 in SWCNTs. No RBM peaks were observed for the samples, which indicates that no SWCNT was produced. The ID/IG ratios were calculated to estimate the variation of CNMs crystallinity with Fe and Fe/Mo catalysts. The ID/IG for the Fe catalyst sample of 0.63 was lower than those using Fe/Mo bi-catalyst (0.98). This suggests that the use of Fe/Mo bi-catalyst systems will provide the sample containing well developed graphitic structure than that of the sample using the Fe catalyst only [45,46].

3.7. TGA Analyses

Thermogravimetric analysis (TGA) was carried out to study the temperature effect on the synthesized samples here. The TGA and DTG of S9 and S15 are shown by Figure 8. TGA analysis demonstrates the weight loss at a different temperature, which reflects the thermal stability of the finally obtained CNMs. The first weight loss was observed at a temperature of around 100 °C for both samples. This showed the evaporation of adsorbed moisture [47,48]. Oxidation began at approximately 400 °C and 500 °C for sample S9 and S15, respectively, which resulted in a loss of nearly 85 wt%. The oxidation temperatures of different carbon structures are not the same and vary according to the strength of inter-atomic bonds and their network uniformity. The TGA profile of S15 showed more thermal stability due to the presence of more CNMs. It was also noticed that there was no further weight loss after a temperature of 600 and 664 °C for samples S9 and S15, respectively. Some residual material remained for each of the samples, and these residues represented ash content, which were found to be 8% and 10% for samples S9 and S15, respectively. The residues were mainly due to the presence of Fe and/or Fe/Mo catalysts, which were deposited over the surface of PAC during impregnation.

4. Conclusions

In this research, successful growth was achieved for super-hydrophobic CNMS on PAC using a Fe–Mo biocatalyst in CVD following the RSM method experimental design. The output responses of CY and CA were recorded and significant regression models were obtained. Eventually, this led to a clear optimization of the CVD process operational conditions and catalyst loadings. The results concluded that Fe and Mo catalyst composition, as well as reaction time, play a vital role for CY and CA. Process optimization revealed that a binary mixture of 5% Fe, with 2% Mo, is a suitable catalyst for the growth of CNTs and the time period should be 40 min to obtain the highest CY of 320% and CA of 172°. Surface morphological features demonstrated the presence of CNMs containing three different types of nanostructures, including helix-like CNFs, CNFs, and CNTs. Raman analysis showed that a high degree of graphitization took place. This study indicated the pathways for the formation of CNMs with hydrophobic texture, and the appropriate contact angle (CA) which can be subsequently applied for nanomembrane fabrication with superior characteristics. The future perspective of this research is to fabricate a nano-membrane which can exhibit superior performance in membrane distillation and desalination processes.

Author Contributions

Idea of research stated by M.A.A. and B.O.B. Investigation by K.D. Design of Experiment by M.A.A., B.O.B., Z.Z.C. and F.S.M. Conducting experiments and collecting data by B.O.B., M.A.A., Interpreting the results by: M.A.A., B.O.B., Z.Z.C., M.N.H., F.M.E., F.S.M., M.K.A. Writing up the manuscript and revising by B.O.B., Z.Z.C. and M.A.A. Interpreting the results and Funding acquisition by Y.M.A. and H.F.A. All authors have read and agreed to the published version of the manuscript.

Funding

The research was also conducted under 17AET-RP44D under Zaira Zaman Chowdhury as Principal Investigator from University of Malaya, Malaysia. The authors would like to acknowledge the Sultan Qaboos University internal grant number IG/ENG/PCED/19/02 for funding this research.

Acknowledgments

The research was also conducted under 17AET-RP44C and RU grant ST028-2019 under Zaira Zaman Chowdhury as Principal Investigator from University of Malaya, Malaysia. The authors would like to acknowledge the Sultan Qaboos University internal grant number IG/ENG/PCED/19/02 for funding this research.

Conflicts of Interest

The authors declare no conflict of interest.

Abbreviations

TermsAbbreviation
Contact AngleCA
Carbon Nanomaterials YieldCY
Powder Activated CarbonPAC
Carbon NanomaterialsCNMs
Chemical Vapor Deposition CVD
Response Surface Method RSM
Box–Behnken Design BBD
Field Emission Scanning Electron MicroscopyFESEM
Transmission Electron MicroscopyTEM
Carbon Nanofibers CNFs
Carbon Nanotubes CNTs
Analysis of Variance ANOVA
Growth Time tr
Radial Breathing Mode RBM
Thermogravimetric Analysis TGA

References

  1. Odom, T.W.; Huang, J.L.; Kim, P.; Lieber, C.M. Atomic structure and electronic properties of single-walled carbon nanotubes. Nature 1998, 391, 62–64. [Google Scholar] [CrossRef]
  2. Dillon, A.C.; Jones, K.M.; Bekkedahl, T.A.; Kiang, C.H.; Bethune, D.S.; Heben, M.J. Storage of hydrogen in single-walled carbon nanotubes. Nature 1997, 386, 377–379. [Google Scholar] [CrossRef]
  3. Treacy, M.M.J.; Ebbesen, T.W.; Gibson, J.M. Exceptionally high Young’s modulus observed for individual carbon nanotubes. Nature 1996, 381, 678–680. [Google Scholar] [CrossRef]
  4. Lu, J.P. Novel magnetic properties of carbon nanotubes. Phys. Rev. Lett. 1995, 74, 1123–1126. [Google Scholar] [CrossRef] [Green Version]
  5. Yohe, S.T.; Colson, Y.L.; Grinstaff, M.W. Superhydrophobic materials for tunable drug release: Using displacement of air to control delivery rates. J. Am. Chem. Soc. 2012, 134, 2016–2019. [Google Scholar] [CrossRef] [Green Version]
  6. Chowdhury, Z.Z.; Hamid, S.B.A.; Das, R.; Hasan, M.R.; Zain, S.M.; Khalid, K.; Uddin, M.N. Preparation of carbonaceous adsorbents from lignocellulosic biomass and their use in removal of contaminants from aqueous solution. BioResources 2013, 8, 6523–6555. [Google Scholar] [CrossRef]
  7. Chowdhury, Z.Z.; Krishnan, B.; Sagadevan, S.; Rafique, R.F.; Hamizi, N.A.B.; Abdul Wahab, Y.; Khan, A.A.; Johan, R.B.; Al-douri, Y.; Kazi, S.N.; et al. Effect of Temperature on the Physical, Electro-Chemical and Adsorption Properties of Carbon Micro-Spheres Using Hydrothermal Carbonization Process. Nanomaterials 2018, 8, 597. [Google Scholar] [CrossRef]
  8. Huang, F.Y.C.; Medin, C.; Arning, A. Mechanical Vibration for the Control of Membrane Fouling in Direct Contact Membrane Distillation. Symmetry 2019, 11, 126. [Google Scholar] [CrossRef] [Green Version]
  9. Das, R.; Ali, M.E.; Hamid, S.B.A.; Ramakrishna, S.; Chowdhury, Z.Z. Carbon nanotube membranes for water purification: A bright future in water desalination. Desalination 2014, 336, 97–109. [Google Scholar] [CrossRef]
  10. Ma, M.; Mao, Y.; Gupta, M.; Gleason, K.K.; Rutledge, G.C. Superhydrophobic fabrics produced by electrospinning and chemical vapor deposition. Macromolecules 2005, 38, 9742–9748. [Google Scholar] [CrossRef]
  11. Nakajima, A.; Hashimoto, K.; Watanabe, T. Recent studies on super-hydrophobic films. Monatsh. Chem. 2001, 132, 31–41. [Google Scholar] [CrossRef]
  12. Aljumaily, M.M.; Alsaadi, M.A.; Das, R.; Hamid, S.B.A.; Hashim, N.A.; AlOmar, M.K.; Alayan, H.M.; Novikov, M.; Alsalhy, Q.F.; Hashim, M.A. Optimization of the Synthesis of Superhydrophobic Carbon Nanomaterials by Chemical Vapor Deposition. Sci. Rep. 2018, 8, 2778–2789. [Google Scholar] [CrossRef] [PubMed]
  13. Alayan, H.M.; Alsaadi, M.A.; Das, R.; Abo-Hamad, A.; Ibrahim, R.K.; AlOmar, M.K.; Hashim, M.A. The formation of hybrid carbon nanomaterial by chemical vapor deposition: An efficient adsorbent for enhanced removal of methylene blue from aqueous solution. Water Sci. Technol. 2018, 77, 1714–1723. [Google Scholar] [CrossRef] [Green Version]
  14. Mamun, A.A.; Ahmed, Y.M.; Muyibi, S.A.; Al-Khatib, M.F.R.; Jameel, A.T.; AlSaadi, M.A. Synthesis of carbon nanofibers on impregnated powdered activated carbon as cheap substrate. Arab. J. Chem. 2016, 9, 532–536. [Google Scholar] [CrossRef] [Green Version]
  15. Chowdhury, Z.Z.; Abd Hamid, S.B.; Rahman, M.M.; Rafique, R.F. Catalytic Activation and Application of Micro-Spherical Carbon Derived from Hydrothermal Carbonization of Lignocellulosic Biomass: Statistical Analysis Using Box—Behnken Design. RSC Adv. 2016, 6, 102680–102694. [Google Scholar] [CrossRef]
  16. Chowdhury, Z.Z.; Rakibul, M.H.; Abd Hamid, S.B.; Samsudin, E.M.; Zain, S.M.; Khalid, K. Catalytic Pretreatment of Biochar residues derived from Lignocellulosic Feedstock for Equilibrium Studies of Manganese, Mn (II) cations from aqueous solution. RSC Adv. 2015, 5, 6345–6356. [Google Scholar] [CrossRef]
  17. Chen, X.W.; Timpe, O.; Hamid, S.B.; Schlögl, R.; Su, D.S. Direct synthesis of carbon nanofibers on modified biomass-derived activated carbon. Carbon 2009, 47, 340–343. [Google Scholar] [CrossRef]
  18. Delgado, J.J.; Chen, X.-W.; Su, D.S.; Hamid, S.; Schlögl, R. A novel catalyst for synthesis of styrene: Carbon nanofibers immobilized on activated carbon. J Nanosci. Nanotechnol. 2007, 7, 3495–3501. [Google Scholar] [CrossRef]
  19. Chen, X.W.; Su, D.S.; Schlögl, R. Immobilization of CNFs on the surface and inside of the modified activated carbon. Phys. Status Solidi B 2006, 243, 3533–3536. [Google Scholar] [CrossRef] [Green Version]
  20. Su, D.S.; Chen, X.; Weinberg, G.; Klein-Hofmann, A.; Timpe, O.; Abd Hamid, S.B.; Schlögl, R. Hierarchically structured carbon: Synthesis of carbon nanofibers nested inside or immobilized onto modified activated carbon. Angew. Chem. Int. Ed. Engl. 2005, 44, 5488–5492. [Google Scholar] [CrossRef]
  21. Akbarzadeh, O.; Zabidi, N.A.M.; Abdul Wahab, Y.; Hamizi, N.A.; Chowdhury, Z.Z.; Merican, Z.M.A.; Ab Rahman, M.; Akhter, S.; Rasouli, E.; Johan, M.R. Effect of Cobalt Catalyst Confinement in Carbon Nanotubes Support on Fischer-Tropsch Synthesis Performance. Symmetry 2018, 10, 572. [Google Scholar] [CrossRef] [Green Version]
  22. Das, R.; Ali, M.E.; Hamid, S.B.A.; Annuar, M.; Ramakrishna, S. Common wet chemical agents for purifying multiwalled carbon nanotubes. J Nanomater. 2014, 2014. [Google Scholar] [CrossRef]
  23. Ding, F.; Larsson, P.; Larsson, J.A.; Ahuja, R.; Duan, H.; Rosen, A.; Bolton, K. The importance of strong carbon–metal adhesion for catalytic nucleation of single-walled carbon nanotubes. Nano Lett. 2008, 8, 463–468. [Google Scholar] [CrossRef]
  24. Rümmeli, M.H.; Kramberger, C.; Schäffel, F.; Borowiak-Palen, E.; Gemming, T.; Rellinghaus, B.; Jost, O.; Löffler, M.; Ayala, P.; Pichler, T.; et al. Catalyst size dependencies for carbon nanotube synthesis. Phys. Status Solidi B 2007, 244, 3911–3915. [Google Scholar] [CrossRef]
  25. Li, W.Z.; Wen, J.G.; Ren, Z.F. Straight carbon nanotube Y junctions. Appl. Phys. Lett. 2001, 79, 1879–1881. [Google Scholar] [CrossRef]
  26. Huang, Z.P.; Wang, D.Z.; Wen, J.G.; Sennett, M.; Gibson, H.; Ren, Z.F. Effect of nickel, iron and cobalt on growth of aligned carbon nanotubes. Appl. Phys. A 2002, 74, 387–391. [Google Scholar] [CrossRef]
  27. Cassell, A.M.; Raymakers, J.A.; Kong, J.; Dai, H. Large Scale CVD Synthesis of Single-Walled Carbon Nanotubes. J. Phys. Chem. B 1999, 103, 6484–6492. [Google Scholar] [CrossRef]
  28. Flahaut, E.; Govindaraj, A.; Peigney, A.; Laurent, C.H.; Rousset, A.; Rao, C.N.R. Synthesis of single-walled carbon nanotubes using binary (Fe, Co, Ni) alloy nanoparticles prepared in situ by the reduction of oxide solid solutions. Chem. Phys. Lett. 1999, 300, 236–242. [Google Scholar] [CrossRef] [Green Version]
  29. Kiang, C.H.; Goddard III, W.A.; Beyers, R.; Salem, J.S.; Bethune, D.S. Catalytic effects of heavy metals on the growth of carbon nanotubes and nanoparticles. J. Phys. Chem. Solids 1996, 57, 35–39. [Google Scholar] [CrossRef]
  30. Sugime, H.; Noda, S.; Maruyama, S.; Yamaguchi, Y. Multiple “optimum” conditions for Co–Mo catalyzed growth of vertically aligned single-walled carbon nanotube forests. Carbon 2009, 47, 234–241. [Google Scholar] [CrossRef]
  31. Biris, A.R.; Li, Z.; Dervishi, E.; Lupu, D.; Xu, Y.; Saini, V.; Watanabe, F.; Biris, A.S. Effect of hydrogen on the growth and morphology of single wall carbon nanotubes synthesized on a Fe–Mo/MgO catalytic system. Phys. Lett. A 2008, 372, 3051–3057. [Google Scholar] [CrossRef]
  32. Cui, Y.; Wu, X.; Wu, H.; Tian, Y.; Chen, Y. Optimization of synthesis condition for carbon nanotubes by chemical vapor deposition on Fe–Ni–Mo/MgO catalyst. Mater. Lett. 2008, 62, 3878–3880. [Google Scholar] [CrossRef]
  33. Niu, Z.; Fang, Y. Effect of temperature for synthesizing single-walled carbon nanotubes by catalytic chemical vapor deposition over Mo–Co–MgO catalyst. Mater. Res. Bull. 2008, 43, 1393–1400. [Google Scholar] [CrossRef]
  34. Saito, T.; Ohshima, S.; Xu, W.C.; Ago, H.; Yumura, M.; Iijima, S. Size control of metal nanoparticle catalysts for the gas-phase synthesis of single-walled carbon nanotubes. J. Phys. Chem. B 2005, 109, 10647–10652. [Google Scholar] [CrossRef]
  35. Karim, M.Z.; Chowdhury, Z.Z.; Abd Hamid, S.B.; Ali, M.E. Statistical Optimization for Acid Hydrolysis of Microcrystalline Cellulose and Its Physiochemical Characterization by Using Metal Ion Catalyst. Materials 2014, 7, 6982–6999. [Google Scholar] [CrossRef]
  36. Chowdhury, Z.Z.; Chandran, R.R.R.; Jahan, A.; Khalid, K.; Rahman, M.M.; Al-Amin, M.; Akbarzadeh, O.; Badruddin, I.A.; Khan, T.M.Y.; Kamangar, S.; et al. Extraction of Cellulose Nano-Whiskers Using Ionic Liquid-Assisted Ultra-Sonication: Optimization and Mathematical Modelling Using Box—Behnken Design. Symmetry 2019, 11, 1148. [Google Scholar] [CrossRef] [Green Version]
  37. Adebisi, G.A.; Chowdhury, Z.Z.; Alaba, P.A. Equilibrium, Kinetic, and Thermodynamic Studies of Lead Ion and Zinc Ion Adsorption from Aqueous Solution onto Activated Carbon Prepared from Palm Oil Mill Effluent. J. Clean. Prod. 2017, 148, 958–968. [Google Scholar] [CrossRef]
  38. Aljumaily, M.M.; Alsaadi, M.A.; Hashim, N.A.; Alsalhy, Q.F.; Mjalli, F.S.; Atieh, M.A.; Al-Harrasi, A. PVDF-co-HFP/superhydrophobic acetylene-based nanocarbon hybrid membrane for seawater desalination via DCMD. Chem. Eng. Res. Des. 2018, 138, 248–259. [Google Scholar] [CrossRef]
  39. Das, R.; Hamid, S.B.A.; Annuar, M.S.M. Highly efficient and stable novel nanobiohybrid catalyst to avert 3,4-dihydroxybenzoic acid pollutant in water. Sci. Rep. 2016, 6, 33572. [Google Scholar] [CrossRef] [Green Version]
  40. AlSaadi, M.A.; Al-Mamun, A.; Muyibi, S.A.; Alam, M.Z.; Sopyan, I.; Atieh, M.A.; Ahmed, Y.M. Synthesis of various carbon nanomaterials (CNMs) on powdered activated carbon. Afr. J. Biotechnol. 2011, 10, 18892–18905. [Google Scholar]
  41. Dupuis, A.C. The catalyst in the CCVD of carbon nanotubes—A review. Prog. Mater. Sci. 2005, 50, 929–961. [Google Scholar] [CrossRef]
  42. Yu, H.; Zhang, Q.; Zhang, Q.; Wang, Q.; Ning, G.; Luo, G.; Wei, F. Effect of the reaction atmosphere on the diameter of single-walled carbon nanotubes produced by chemical vapor deposition. Carbon 2006, 44, 1706–1712. [Google Scholar] [CrossRef]
  43. Lu, Z.; Sun, M.; Xu, T.; Li, Y.; Xu, W.; Chang, Z.; Ding, Y.; Sun, X.; Jiang, L. Superaerophobic electrodes for direct hydrazine fuel cells. Adv. Mater. 2015, 27, 2361–2366. [Google Scholar] [CrossRef]
  44. Wenzel, R.N. Surface Roughness and Contact Angle. J. Phys. Chem. 1949, 53, 1466–1467. [Google Scholar] [CrossRef]
  45. Hiura, H.; Ebbesen, T.W.; Tanigaki, K.; Takahashi, H. Raman studies of carbon nanotubes. Chem. Phys. Lett. 1993, 202, 509–512. [Google Scholar] [CrossRef]
  46. Bahr, J.L.; Yang, J.; Kosynkin, D.V.; Bronikowski, M.J.; Smalley, R.E.; Tour, J.M. Functionalization of Carbon Nanotubes by Electrochemical Reduction of Aryl Diazonium Salts: A Bucky Paper Electrode. J. Am. Chem. Soc. 2001, 123, 6536–6542. [Google Scholar] [CrossRef]
  47. Eckmann, A.; Felten, A.; Mishchenko, A.; Britnell, L.; Krupke, R.; Novoselov, K.S.; Casiraghi, C. Probing the nature of defects in graphene by Raman spectroscopy. Nano Lett. 2012, 12, 3925–3930. [Google Scholar] [CrossRef] [Green Version]
  48. Maroto-Valer, M.M.; Dranca, I.; Lupascu, T.; Nastas, R. Effect of adsorbate polarity on thermodesorption profiles from oxidized and metal-impregnated activated carbons. Carbon 2004, 42, 2655–2659. [Google Scholar] [CrossRef]
Figure 1. Parity plot of experimental and predicted values of: (a) CY (%) and (b) CA (°).
Symmetry 12 01242 g001
Figure 2. Response surface plots for the effects of the catalyst amount at a fixed reaction time of 40 min on: (a) Yield (%) and (b) CA (°).
Symmetry 12 01242 g002
Figure 3. CA (°) of carbon nanomaterials (CNMs) (a) S9 (b) S15.
Symmetry 12 01242 g003
Figure 4. Response surface plots for the effects of the reaction time at fixed Mo% amount (2%) on: (a) CY (%) and (c) CA (°), and at fixed Fe% amount (5%) on: (b) CY (%) and (d) CA (°).
Symmetry 12 01242 g004aSymmetry 12 01242 g004b
Figure 5. Field emission scanning electron microscopic (FESEM) images of CNMs (a) S2 (b) S4 (c) S6 (d) S9 (e) S13 (f) S15.
Symmetry 12 01242 g005
Figure 6. Transmission electron microscopic (TEM) images of S15.
Symmetry 12 01242 g006
Figure 7. Raman spectra of S9 and S15.
Symmetry 12 01242 g007
Figure 8. Thermogravimetric analysis (TGA) spectra of S9 and S15.
Symmetry 12 01242 g008
Table 1. Box–Behnken factorial design (BBD) Matrix for 15 Experimental Runs.
SampleAmount of Fe%Amount of Mo%Time (min)CY (%)CA (°)
(Fe)-A(Mo)-B(tr)-C(CY)(CA)
S10.002.0060.0055.3133
S20.004.0040.0022.292
S32.504.0020.0090.4127
S42.504.0060.00180.9152
S52.500.0020.0035.698
S65.002.0060.00240.1160
S75.002.0020.00167.5155
S85.004.0040.00117.6142
S95.000.0040.0076.4176
S100.002.0020.00152.6140
S112.502.0040.00193.9144
S122.502.0040.00188.6150
S132.502.0040.00189.4146
S142.500.0060.0059136
S155.002.0040.00320.6172
Table 2. Sequential model sum of squares for carbon nanomaterials yield (CY).
SourceSum of SquaresDFMean SquareF ValueProb > FR2
Linear28,664.2539554.751.560.25520.2981
2FI9239.0333079.680.420.74190.3941
Quadratic13,599.3834533.135.470.04910.8684
Table 3. Sequential model sum of squares for contact angle (CA).
SourceSum of SquaresDFMean SquareF ValueProb > FR2
Linear2117.183290.453.880.04080.5142
2FI351.183117.060.570.65150.5995
Quadratic758.973252.991.420.34030.8938
Table 4. Analysis of variance (ANOVA) for Yield% Surface Model.
SourceSum of SquaresdfMean SquareF ValueProb > F
A9970.0219970.021221.320.0008
B15,165.92115,165.921857.810.0005
C2.7212.720.330.6220
AB10,397.70110,397.701273.710.0008
AC7216.5017216.50884.010.0011
BC473.061473.0657.950.0168
A24056.4314056.43496.910.0020
B2592.771592.7772.610.0135
C29110.4119110.411116.020.0009
A2B13,452.27113,452.271647.890.0006
A2C98.00198.0012.000.0742
AB211,999.82111,999.821469.970.0007
Table 5. ANOVA Analysis for the CA Surface Model.
SourceSum of SquaresdfMean SquareF ValueProb > F
A441.001441.0047.250.0269
B210.251210.2522.530.0205
C552.251552.2559.170.0416
AB23.05123.052.470.0165
AC36.00136.003.860.2566
BC2.2512.250.240.1885
A2138.961138.9614.890.6720
B23.333 × 10313.333 × 1033.571 × 1040.0611
C2140.171140.1715.020.9866
A2B200.521200.5221.480.0435
A2C300.121300.1232.160.0297
AB230.66130.663.280.2116
Table 6. Solutions for CNMs production.
No.Amount of Fe%Amount of Mo%Time (min)CYCA (°)Desirability
15.002.1842.26315.139173.621.000
25.001.8043.06319.296167.310.996
35.001.7843.84318.729163.620.990
45.001.7940.34316.753166.660.987
55.001.8042.66319.311164.640.981
Table 7. Average size and particle size distribution of the prepared CNMs.
SampleAverage Size (nm)Particles Size Distribution (%)
0–50 nm50–100 nm100–150 nm150–200 nm
S485.435324419
S6117.717194133
S956.69642088
S1370.943750103
S1581.681368145

