Article

Traffic Flow Density Model and Dynamic Traffic Congestion Model Simulation Based on Practice Case with Vehicle Network and System Traffic Intelligent Communication

by
Eduard Zadobrischi
1,2,*,
Lucian-Mihai Cosovanu
1,* and
Mihai Dimian
1
1
Department of Computers, Electronics and Automation, Faculty of Electrical Engineering and Computer Science, Stefan cel Mare University, No. 13 Str. Universitatii, 720229 Suceava, Romania
2
Department of Computer Science, Technical University of Cluj-Napoca, Gh. Baritiu St. 26–28, 400027 Cluj-Napoca, Romania
*
Authors to whom correspondence should be addressed.
Symmetry 2020, 12(7), 1172; https://doi.org/10.3390/sym12071172
Submission received: 1 July 2020 / Revised: 6 July 2020 / Accepted: 9 July 2020 / Published: 15 July 2020
(This article belongs to the Special Issue Symmetry and IoT Intelligence in the Post Pandemic Economy)

Abstract

:
The massive increase in the number of vehicles has set a precedent in terms of congestion, being one of the important factors affecting the flow of traffic, but there are also effects on the world economy. The studies carried out so far try to highlight solutions that will streamline the traffic, as society revolves around transportation and its symmetry. Current research highlights that the increased density of vehicles could be remedied by dedicated short-range communications (DSRC) systems through communications of the type vehicle-to-vehicle (V2V), vehicle-to-infrastructure (V2I) or vehicle-to-everything (V2X). We can say that wireless communication technologies have the potential to significantly change the efficiency and road safety, thus improving the efficiency of transport systems. An important factor is to comply with the requirements imposed on the use of vehicle safety and transport applications. Therefore, this paper focuses on several simulations on the basis of symmetry models, implemented in practical cases in order to streamline vehicle density and reduce traffic congestion. The scenarios aim at both the communication of the vehicles with each other and their prioritization by the infrastructure, so we can have a report on the efficiency of the proposed models.

Graphical Abstract

1. Introduction

Traffic congestion is becoming a major and common problem in more and more countries, and especially in developed cities with an increased population density, the number of cars is automatically high. This has a negative impact on a region’s economy and social development. In the case of those who travel, traffic jams not only increase the time and costs of the trip but also the quality. From the point of view of traffic management, the results of road congestion increase operating costs and decrease the efficiency of traffic networks. The chain effect caused by traffic congestion also affects the social factor, causing air pollution, traffic accidents, noise pollution, and also other problems that degrade the environment. With over 1.3 million victims and about 50 million people injured annually in road accidents [1], this problem definitely belongs to our society. The economic cost of these road accidents is estimated at between 1% and 3% of a country’s gross domestic product [2]. According to existing estimates, as a percentage, approximately 90% of road accidents occur due to various causes generated by human error, lack of attention, fatigue, delayed reactions, or lack of distributive attention [1,2]. Current active safety systems have a proven potential to significantly reduce accidents. Such systems are based on sensors that identify and highlight a situation with a potential danger, reducing the danger or avoiding an accident [3].
The analysis carried out in the field of inter-vehicle communications (V2V) and infrastructure-vehicle communications (I2V) has the potential to reduce by up to 80% of dangerous traffic situations, taking vehicle safety to another level. Therefore, communication-based road safety systems allow an infrastructure unit or vehicle to be informed of a high-risk traffic situation by informing the driver and other road users of that situation [3]. Thus, the vehicles that are part of that network can change information on speed and location, but also maintain a constant speed, accelerating and decelerating according to the other vehicles in the network, with their cooperation being useful both for the prevention of traffic situations that can generate accidents, but also for the increase of traffic fluidity [4].
However, supporting the safety of communications-based vehicles is difficult in light of strict requirements and standards. These applications require fairly low latencies that can reach up to 20 ms to detect collisions and pre-crash, so the literature shows that packet data delivery and standard communication varies up to 300 m [4]. Research has been conducted on the formation and spread of traffic congestion, being a rather pressing issue of today’s society and causing quite serious problems. The causes of traffic congestion can be listed in three categories: (1) temporary barrier control, (2) network blockage in key areas, and (3) random fluctuation of a region in the network. All known or unknown causes and events in traffic affect the flow and influence the smooth running of things, and they can be collectively referred to as traffic accidents [5,6].
We can say that a large part of traffic accidents cause congestion and congestion causes traffic accidents. Road traffic works like a network, if the accident or event is remedied in time, the vehicle is put back on track and continues on its way; otherwise, traffic congestion will spread quickly in the network. Studies confirm that exiting the column and leaving the direction of travel is unreasonable, forming loop congestion, a phenomenon that does not dissipate congestion [6]. Forming a closed loop congestion adjusts the time and blockage, even to the starting point of the network. We can say that as long as a closed loop is formed, the traffic congestion itself becomes difficult to dissipate, especially without artificial interventions.
In this paper, simulations are made on the propagation of traffic and the occurrence of congestion depending on the density of cars and the established graphic model, thus obtaining defining elements through which traffic congestion can be dispelled using means to streamline traffic, whether we are talking about intelligent traffic systems, autonomous cars, or dedicated applications. Most traffic events are caused by road accidents or various activities undertaken by road users or even pedestrians, and each delay in starting a car produces a knot in the car network, and from that point to a congestion becomes a matter of a few minutes or even seconds. The simulations performed are based on relevant traffic data, both quantitative and qualitative on the density of cars, but also the hours with an increased flow of vehicles.
Models designed for simulation are based on learning and calibrating parameters, optimizing macro-model, macro-network, node, and intersection simulations [7]. Looking in detail at this research, which is based on detailed analyses of the state of traffic, forecasts for urban road traffic can be made and improved by providing technical assistance solutions in order to establish the impact on the flow of cars transiting a certain area. This direction of research offers development perspectives, being a field of great interest, especially since with the increased living standard of the population, automatically, the number of vehicles has increased exponentially, whereas most road infrastructures have remained the same. The main purpose is to efficiently manage the information and to highlight possible solutions in solving the mentioned problem, whether we are talking about autonomous vehicles, vehicle-to-vehicle (V2V), vehicle-to-infrastructure (V2I), vehicle-to-everything (V2X) communications [8,9], or visible light communication (VLC) [10,11]. All these elements approached in this direction will have a beneficial contribution to the previously mentioned problems, becoming a starting point for the fields dedicated to intelligent traffic systems and safe driving, but especially the reduction of the number of victims of road events, which is a global problem that produces millions of victims annually.

2. Theory Model for Traffic Flow and Simulation Algorithm

2.1. Introduction to Traffic Flow Theory

We can say that traffic patterns can play a very important role in various aspects. Space model analysis, the macro-traffic model, can be used to analyze the main road network, covering a fairly large area, the average traffic model can be used mainly to analyze a smaller local area, ideal for traffic planning and engineering. Thus, the macro-traffic model has as execution time and duration of analysis of a day or a peak hour as a scale, whereas in the case of the average traffic model, it is built and based on a smaller scale that can analyze the data every hour, at every 15 min, or even every minute. In the case of the microscopic traffic model, it can analyze up to a second unit, second-by-second, or every 0.1 s. The average traffic model developed and used in this research is based on all stages of traffic planning. Using this model, the real state of the network traffic is realized and reproduced, but also practical cases by attributing updated instances. The traffic scheme and the analysis of an intersection take into account elements of traffic, systematizing the whole process by synchronizing the signal with the control assembly of the traffic management system [12,13]. Thus, in order to create the simulation scenarios, additional direct simulation tools were used, including macro backgrounds, adjustment of directions and ground, and arrangement of intersections in order to render a real transport system reproduced with the defining elements imposed by legislation [14,15,16].
The current model was conceived and designed based on an area in Suceava, in the immediate vicinity of the university, to establish an example of real traffic to analyze the causes of congestion and to obtain recommendations to improve the flow of vehicles in the network. The analysis of the problems caused by the traffic congestion is the main objective of the research carried out, trying to design ideal scenarios similar to the real traffic conditions. Recent studies in the field of communications applied to the automotive sector have revealed various features that can have a major impact on this issue, whether we are talking about systems designed and dedicated to this field or software architectures dedicated to urban traffic management [17]. The theory regarding the traffic flow model can be divided into macro and micro methods [18,19]. The dynamization of the model can satisfy and increase the accuracy, having performances identical to those obtained in real time.

2.2. Queuing Theory

A first analysis that explains how a car network works is also related to the queue theory; according to this theory, the delay in a queue is identified by i, representing the car in Equation (1):
        i c  
where c represents the total output capacity of the group formed (the exit capacity of the queue is influenced by the traffic flow rate and its control parameters), thus ct is identified by the number of vehicles transiting in the simulated range t, so that if a vehicle reaches the tail of the network represented by Equation (2) in time t, the position of the vehicle is:
q ( t ) = q ( 0 ) + l ( c t m ) ,
where q(0) is the location, t = 0 for the final time and l for the average length of the vehicle, l = 1 for the density of cars, i is the density of the blockage, m is the number of vehicles for the time t = 0, and t is valid in the records of vehicles in the column and in the tail of the network. The number of vehicles entering the queue is taken into account, as presented in the model set out in Equation (3):
        0 < q ( t ) < L .    

2.3. Speed Model Theory

In the case of the average traffic simulation, we can say that the traffic network is divided according to the connection line, node, and starting/loading point. Thus, each connecting line is divided into a multitude of segments, and each segment has one element of movement and another element in the queue [20,21,22]. According to this principle, the speed of the vehicle within the moving element is determined by the density model. The model presented takes into account the slope and the large areas, these being a factor for maintaining the speed of movement. This varies depending on the region in which the vehicle is located, a principle also shown in Figure 1, where νu is characterized as the speed recorded at the end of the model section, νd is the speed recorded at the end of the section, and LS is characterized by the deceleration zone. LS may also contain the characteristics related to the terrain structure, but also the traffic conditions of the analyzed section [23,24]. By setting the ramp area of the straight road section starting from 0 points, we determine the length of the section L, and the lowering factor and the position are determined by the relationship between speed and position, exemplified by Equation (4):
v ( z ) = { v u ,                   0 z L L s   , λ ( z L ) + v d ,       L L s   z , λ = v d v u L s  

2.4. Vehicle Moving Model

In this paper, the classical model is used for the average traffic set for a time interval within a certain time interval. For the section in which the entire simulation is analyzed, the travel speed of the car is determined by the model given by the speed-density ratio, although it is based on a fixed speed of approximately 60 km/h. For the deceleration area, if there are no queues, this can be assumed to start from 0, so the vehicle is located in z 0 and at the time t(z), being defined by Equation (5):
t ( z ) = z z 0 v u  
We can assume that in the case of class t = 0, the vehicle is located in z 0 , thus we determine the position by Equation (6):
z ( t ) = v u   t + z 0 .
If there is a queue for the location z(t), the vehicle at any time, t, can be interpreted by Equation (7):
z ( t ) = e λ ( t ) t ( z 0 + v u λ ( t ) ) v u λ ( t ) , where   λ ( t ) = v u q 0 + l ( c t m ) .

3. Congestion Presentation and Basic Hypotheses

3.1. Introduction to the Basic Hypotheses

In outlining the basic assumptions by which traffic networks were simulated, we have several directions and several subdivided segments with the same physical characteristics, so we can overload the entire infrastructure in order to obtain the most efficient model. Each section or direction of travel depends on the imposed and physical characteristics of the road, such as width, inclination, slope, length, unpredictable events, or problems with traffic lights. Thus, several scenarios have been proposed in which all these aspects are analyzed in the conditions in which the traffic and systems are not automated or communicate in a common network. Subsequently, the aspect regarding the communications within some vehicular networks is analyzed, with the cars having the possibility to run with an exact speed, the distance between them being kept, and their passage through intersections being done in due time to avoid congestion. This paper creates and outlines several hypotheses that could lead to a viable and implementable solution in the near future [16].
  • The traffic on each road segment and in each direction is constant, all data are obtained according to the literature, and there will be no changes in the travel area, regardless of the cause of congestion, except for metered and automated traffic through intelligent traffic light systems.
  • Periodic limitation conditions are used for the delimitation of directions and road sections for all periods of time in which the simulations take place.
  • Intersections are defined and have separate entrances, as well as exits, and are not controlled and limited by signals or thresholds. Everything is based on the set traffic flow, supported by the road segment and the level of reaction of traffic lights, with there being several scenarios with a certain timeframe for free passage.
  • The most common case is when a direction of travel is congested, traffic density and flow are behind the road section. If those obstacles cannot be removed in a timely manner, possibly by changing the lane, the blockage becomes total.
  • If the vehicle network is guided by programmed systems and communications, such as autonomous vehicles, the congestion parameters will be analyzed in such a scenario, verifying the usefulness of communication systems in the case of cars and intelligent traffic light systems.

3.2. Structure of Traffic Jam

If the assumptions are also found in the simulations, when a traffic accident occurs in the traffic network, we can say that it will cause a sharp decrease in traffic capacity in that segment, forming a blockage that later leads to intersection congestion. Avoiding these traffic jams or congestion can be remedied by turning left or right, forming a new network of vehicles, with this being possible only if the vehicles can communicate or intercept messages from the road infrastructure. For the distribution of the degree of traffic congestion in a network a short time after the event, the blockage catches a diamond-like structure, with the degree being reflected on the nearest access roads, regardless of the density of vehicles [17,18].
The extension of the blockage branches over the entire structure of the shaft, confirming the severity and how it affects the traffic network. The spread of the blockage if the event takes place on a less main artery with a low density is much lower in effect. Thus, if the event lasts long enough, the degree of congestion increases, regardless of the possibilities to bypass the affected area. We can say that the propagation will be as noted in the above case for 4–5 directions of traffic, affecting the entire structure up to a buffer zone that can be used as a detour. In order to present the growth process in case of congestion, Figure 1a represents the conditions in which there are no artificial influences in the generated tree and the way in which the congestion propagates, and Figure 1b shows the congestion process caused by the accident that occurs on a secondary artery, where the increase of congestion is slow.
In Figure 1a,b, you can see the routes, the congestion scale, and the network in which each route is located, highlighting the heavily congested areas with a more intense color. We also have the variant of total congestion with blockages in Figure 1b where total loops are formed. When an event of this type lasts a long time, the width of the parking line is divided in an unreasonable way (immobilization of the direction of return), and automatically, the completely closed loop is formed, highlighting the traffic obstruction. The fluidization of the traffic after an incident is achieved by unlocking the first vehicle in the column, so the starting wave is generated, the vehicle leaves the congested area, and the tail of the network at that moment is set in motion. These cases are ideal in a congestion process, without the existence of other fragmentations and events that can cause cascading congestion that automatically lead to a total traffic jam without short-term unblocking solutions [19,20]. That is why it is still considered extremely important to continue the study of traffic congestion and efficient management of problems generated by these events, predominantly created by the human factor, where the driver participating in traffic is being exposed to fatigue, inattention, technical problems, lack of experience, weather conditions, and others [21].

3.3. Representation of Congestion in Traffic Flow

The representation of congestion in the street perimeter is not unidirectional, with there being areas both at the entrance and at the exit from the walking directions where there are blockages and forms of extended congestion. Within a road network with several directions of travel, road segments that are divided into three directions are indicated; here, we are talking about right and left turns but also walking without changing the direction of travel. By prioritizing these road elements, we can consider avoiding the intersection of traffic lines in the congested area so that cars that change direction to avoid the area, effectively limiting the spread of congestion by blocking traffic for a longer period of time. Full control and the development of strategies based on avoiding these congestion-triggering events are possible only if road control and management systems are developed, but also V2X and V2V communication systems dedicated to intelligent vehicle behavior and adaptable to the current context [22,23].
The form presented in the article aims to highlight and trace the defining elements of practical congestion scenarios performed based on real measurements of traffic on public road segments. In order to achieve these scenarios, information was provided, and traffic values were analyzed according to the hours with the highest density and which are the elements that cause congestion. Thus, by performing the simulations, we must deduce which is the most common form of congestion and what are the control strategies that can be applied in order to carry out the implementation of a viable solution in order to remedy the mentioned problem.
Within the 20 scenarios performed, measurements were made in which the data entered by the developed algorithm are taken from traffic and several aspects are analyzed, from favorable and ideal traffic conditions, moving average traffic conditions, but also difficult traffic conditions, due to the overload of the road infrastructure which consequently raises the density of vehicles found in the respective intersections. Thus, you can see exactly the areas of congestion, the directions of travel that offer the highest degree of congestion, and the shape that later developed congestion, even including the waiting time. The simulations were performed within 30 days with waiting times in order to obtain a result of even about 7 h for medium and high traffic simulations [24,25].

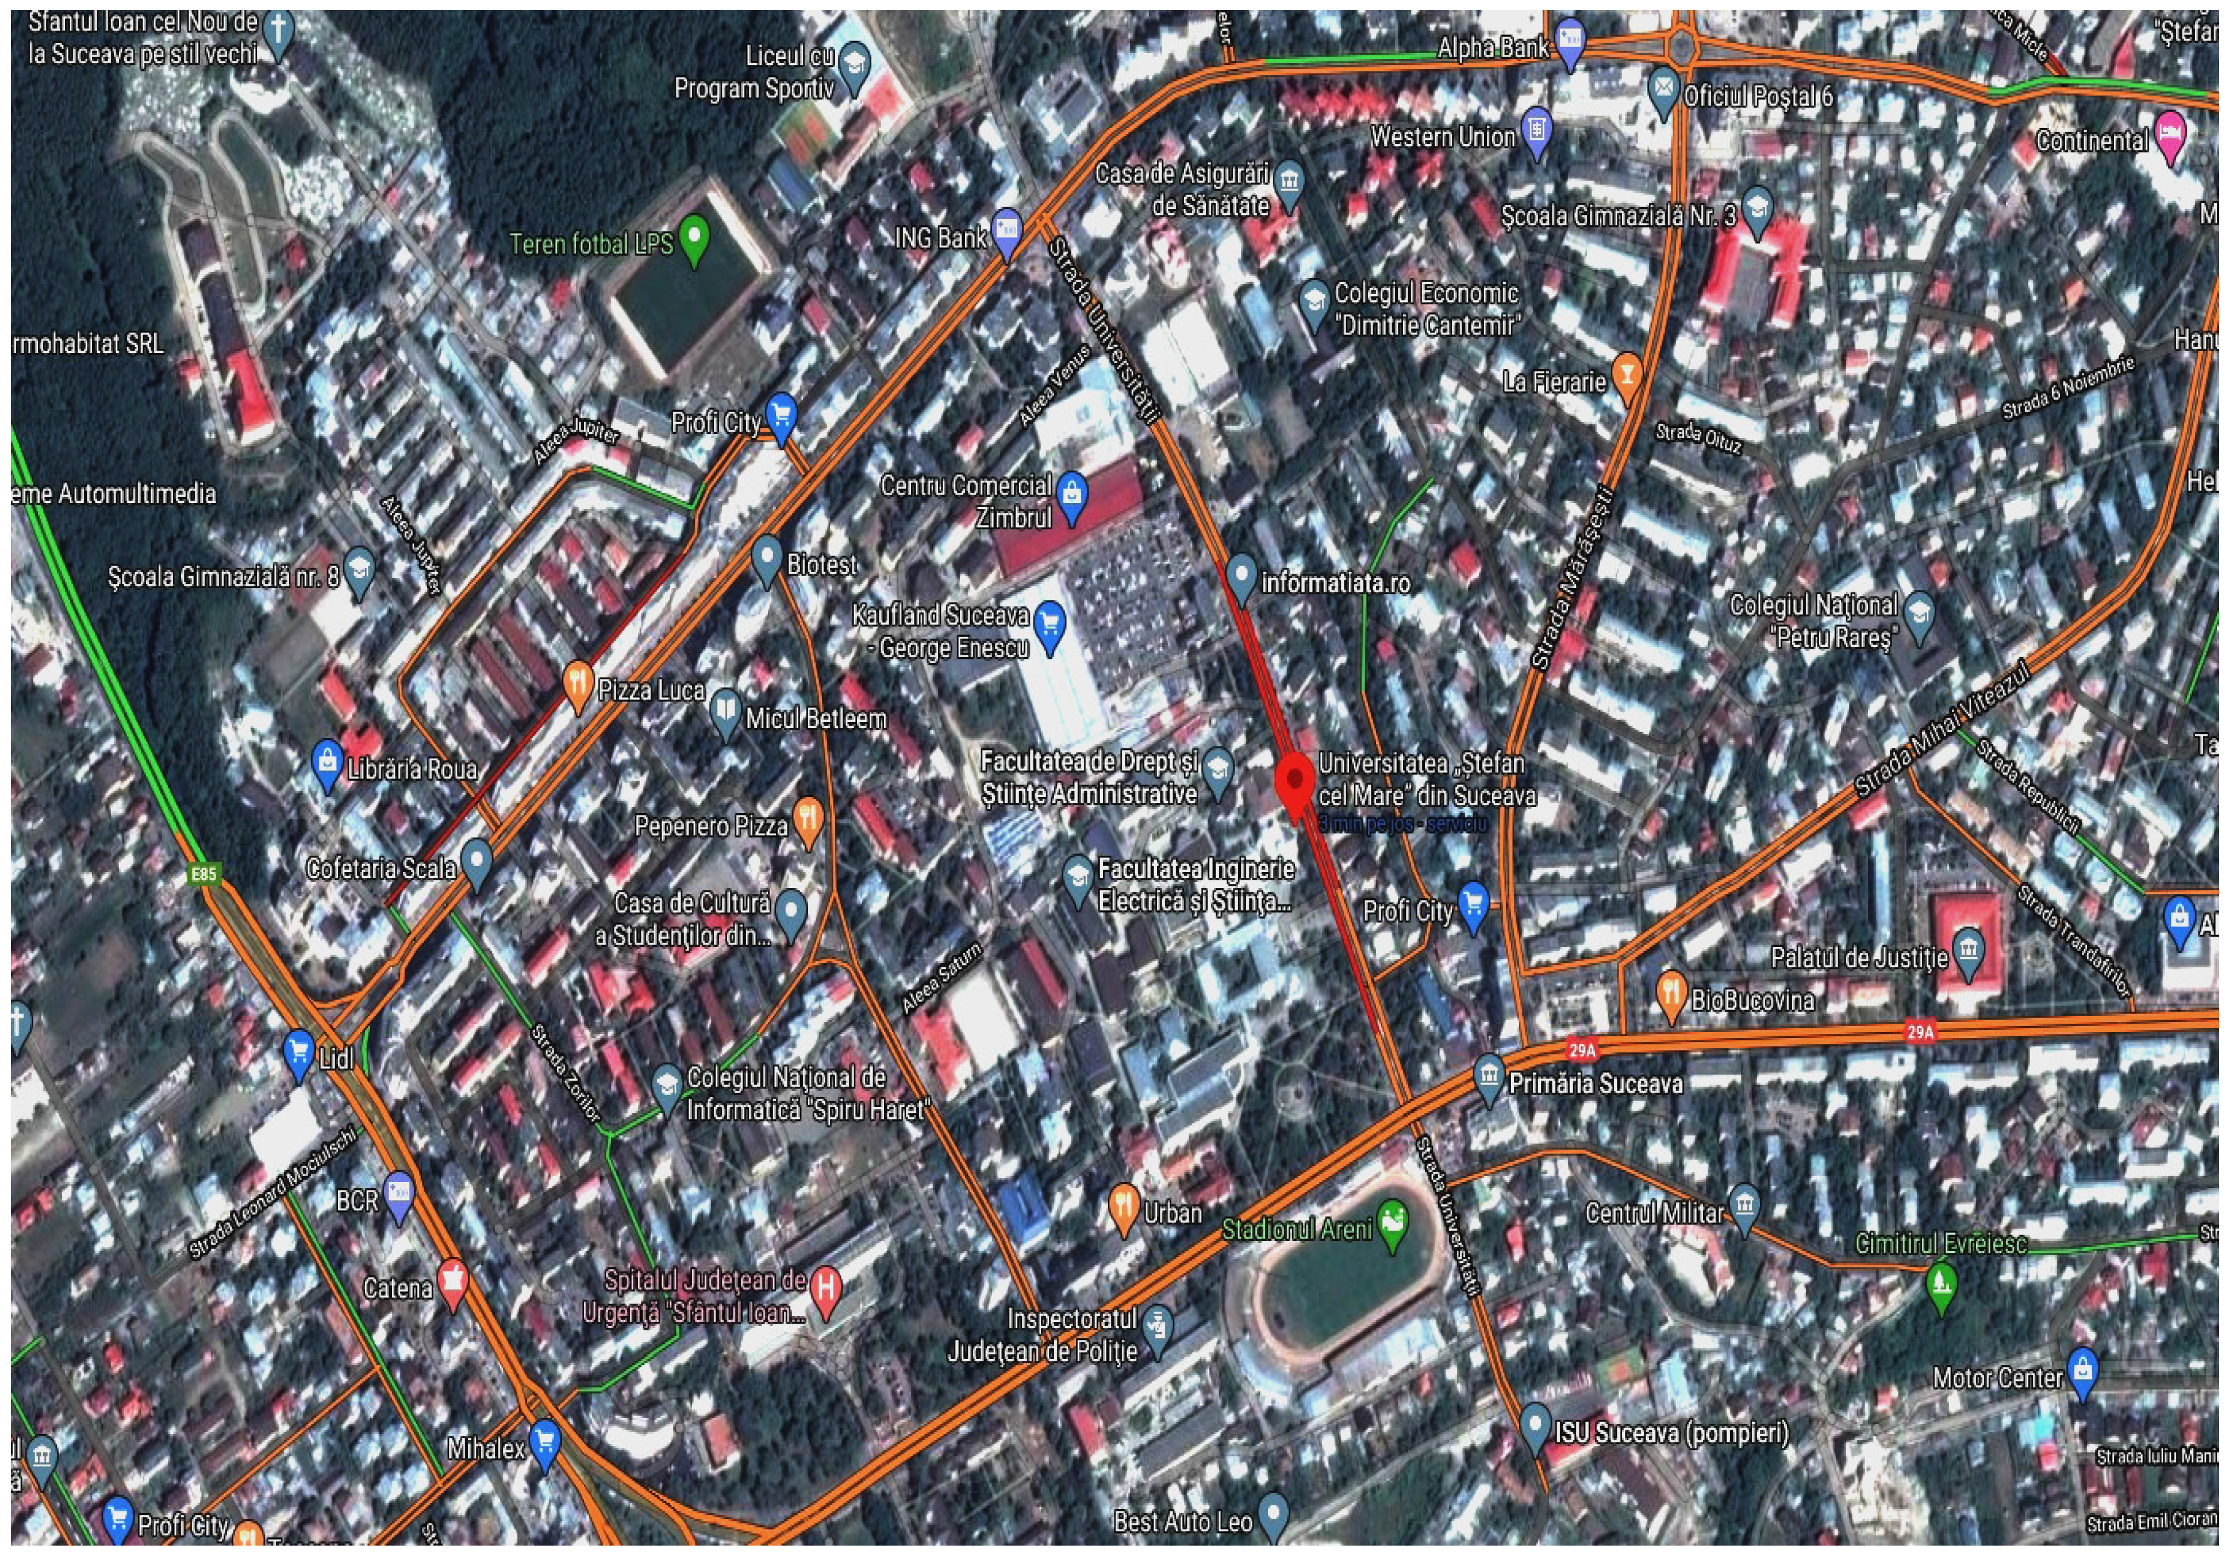
3.4. Flow Distribution for Experimental Area

The distribution of traffic in the analyzed area is represented in Figure 2, the slow traffic being highlighted by the orange color and the heavy traffic with congested areas with the red color. Congestion was found on more than 4 days a week, starting at 09:00 with a spread of blockages of about 30 min in a first phase, then blockages are formed again around 12:00–13:00 with a shorter duration, up to 15 min, paralyzing the entire area. Congestion returns to this area around 16:00–17:00, this time being the time at which the inhabitants of the nearby areas transit the city either from work to home or to educational institutions. The solutions implemented so far have been of a road and legislative nature, so that some streets have become one-way, and this in some situations has made it difficult to move vehicles or avoid the area of congestion.
For the analysis, a scheme was proposed based on real elements using the same route represented graphically and containing the same road characteristics, from the capacity and density of vehicles supported by infrastructure, traffic lights, directions, side streets, and the arrangement of cars in each lane direction. All these analyses will lead to a conclusion that will ultimately generate appropriate solutions for the implementation and management of the situations mentioned above in this article, with general applicability valid for any city or area facing such problems.

4. Control Strategy and Potential Solution

4.1. Introduction to Control Strategy

For a better representation, vehicle generation schemes were designed for each direction of travel, each receiving a synchronized value depending on the desired scenario. Thus, in a first phase, the density of the cars generated for each direction of travel and which reach the intersection is 100 cars per minute in the ideal conditions proposed. The arrangement of the cars is equal in each lane and direction of travel so that there is no possibility of differentiated interpretation of the data obtained. The traffic lights communicate simultaneously, depending on the displays of the other traffic lighting systems and the emitted antennas.
Traffic lights are set to different time categories with a duration ranging from 20 s waiting time at the traffic light to 90 s in cases where traffic is low.

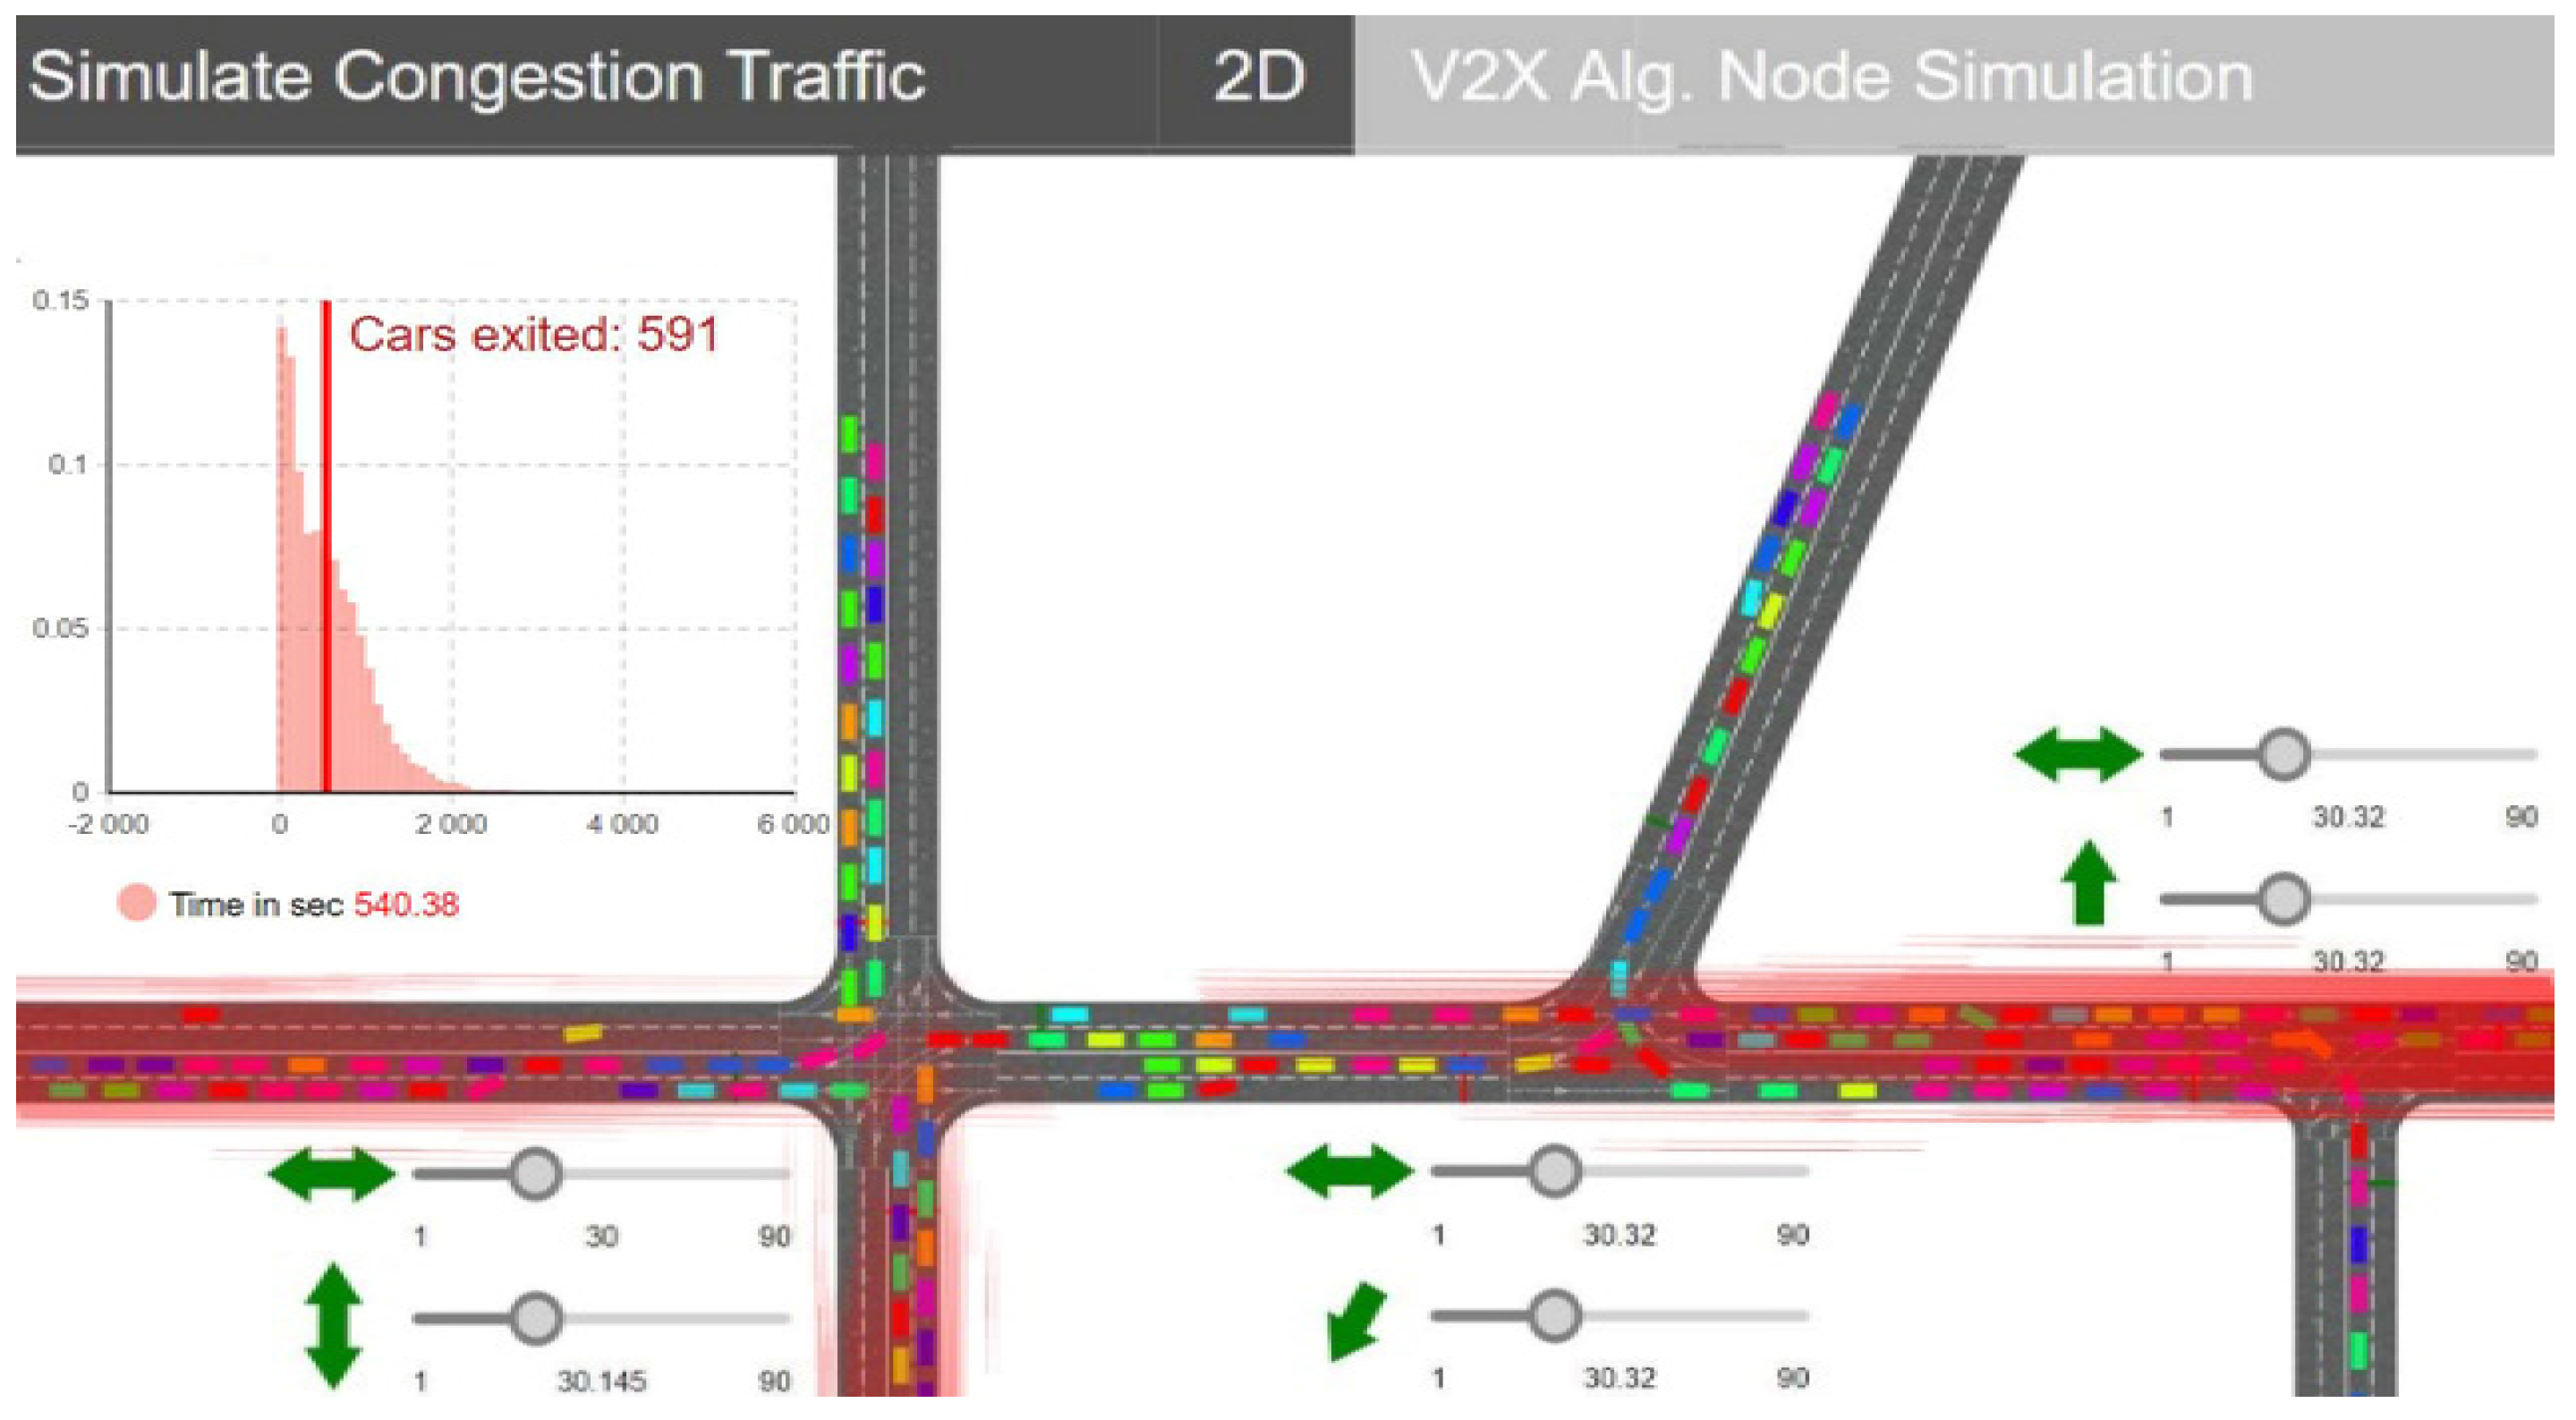
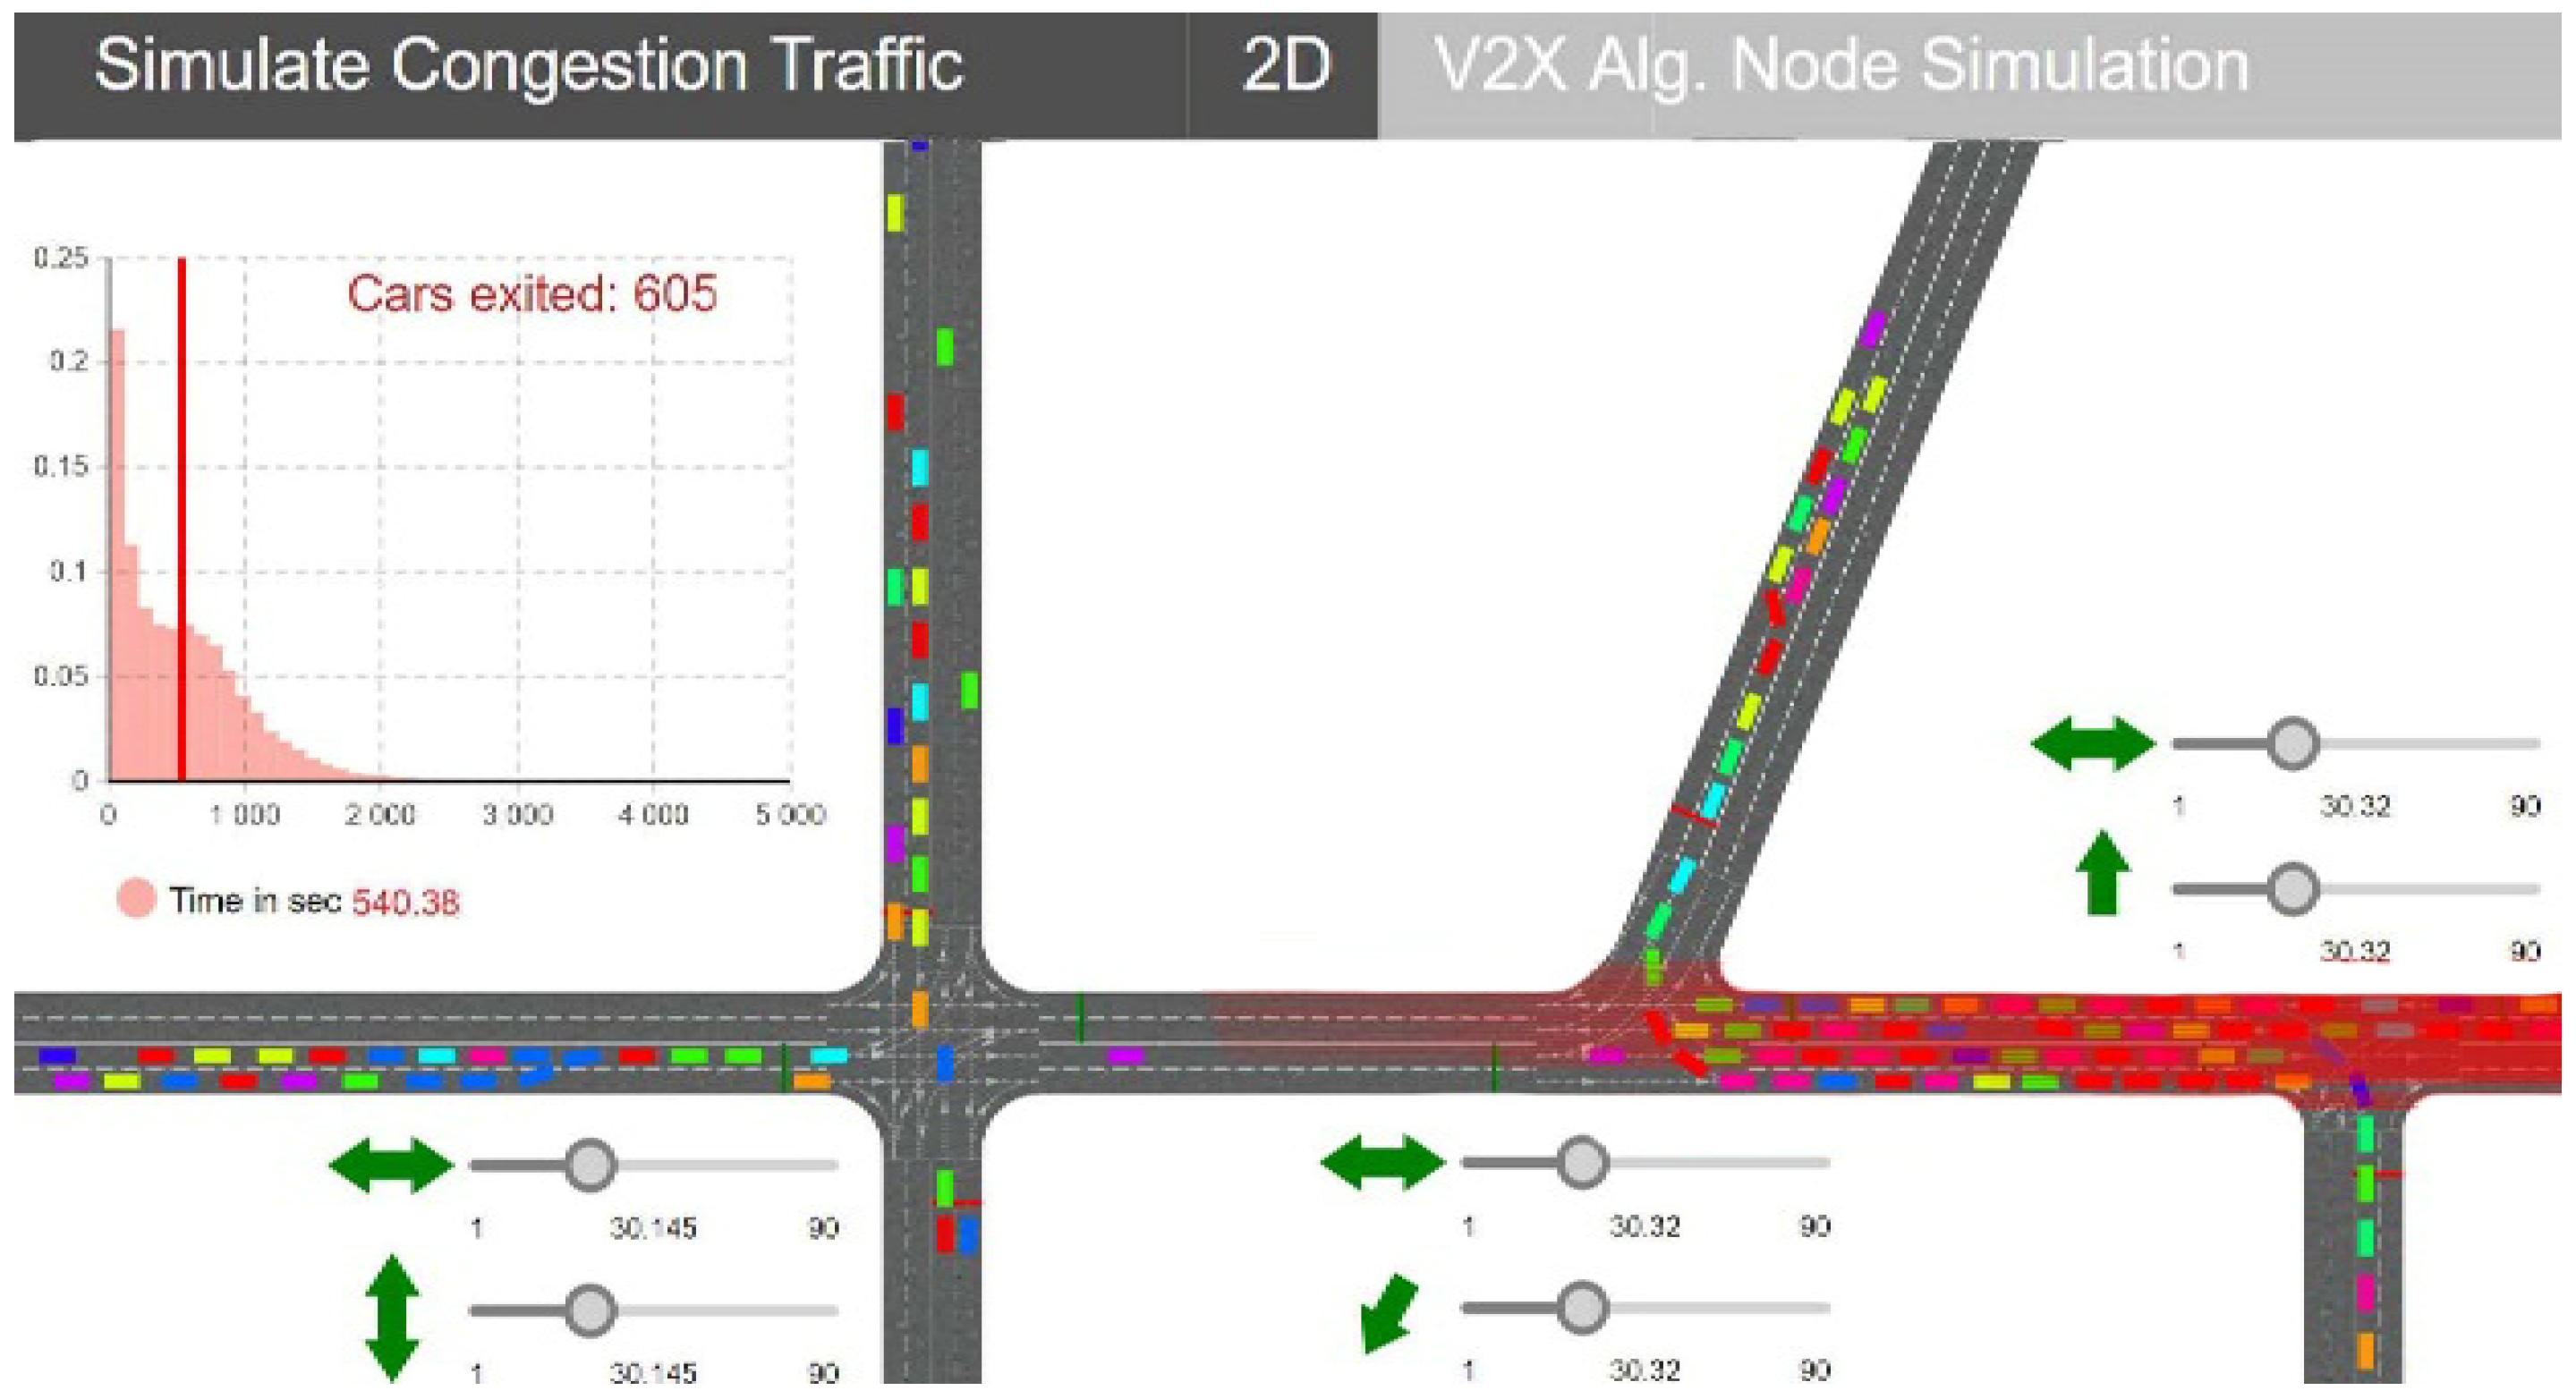
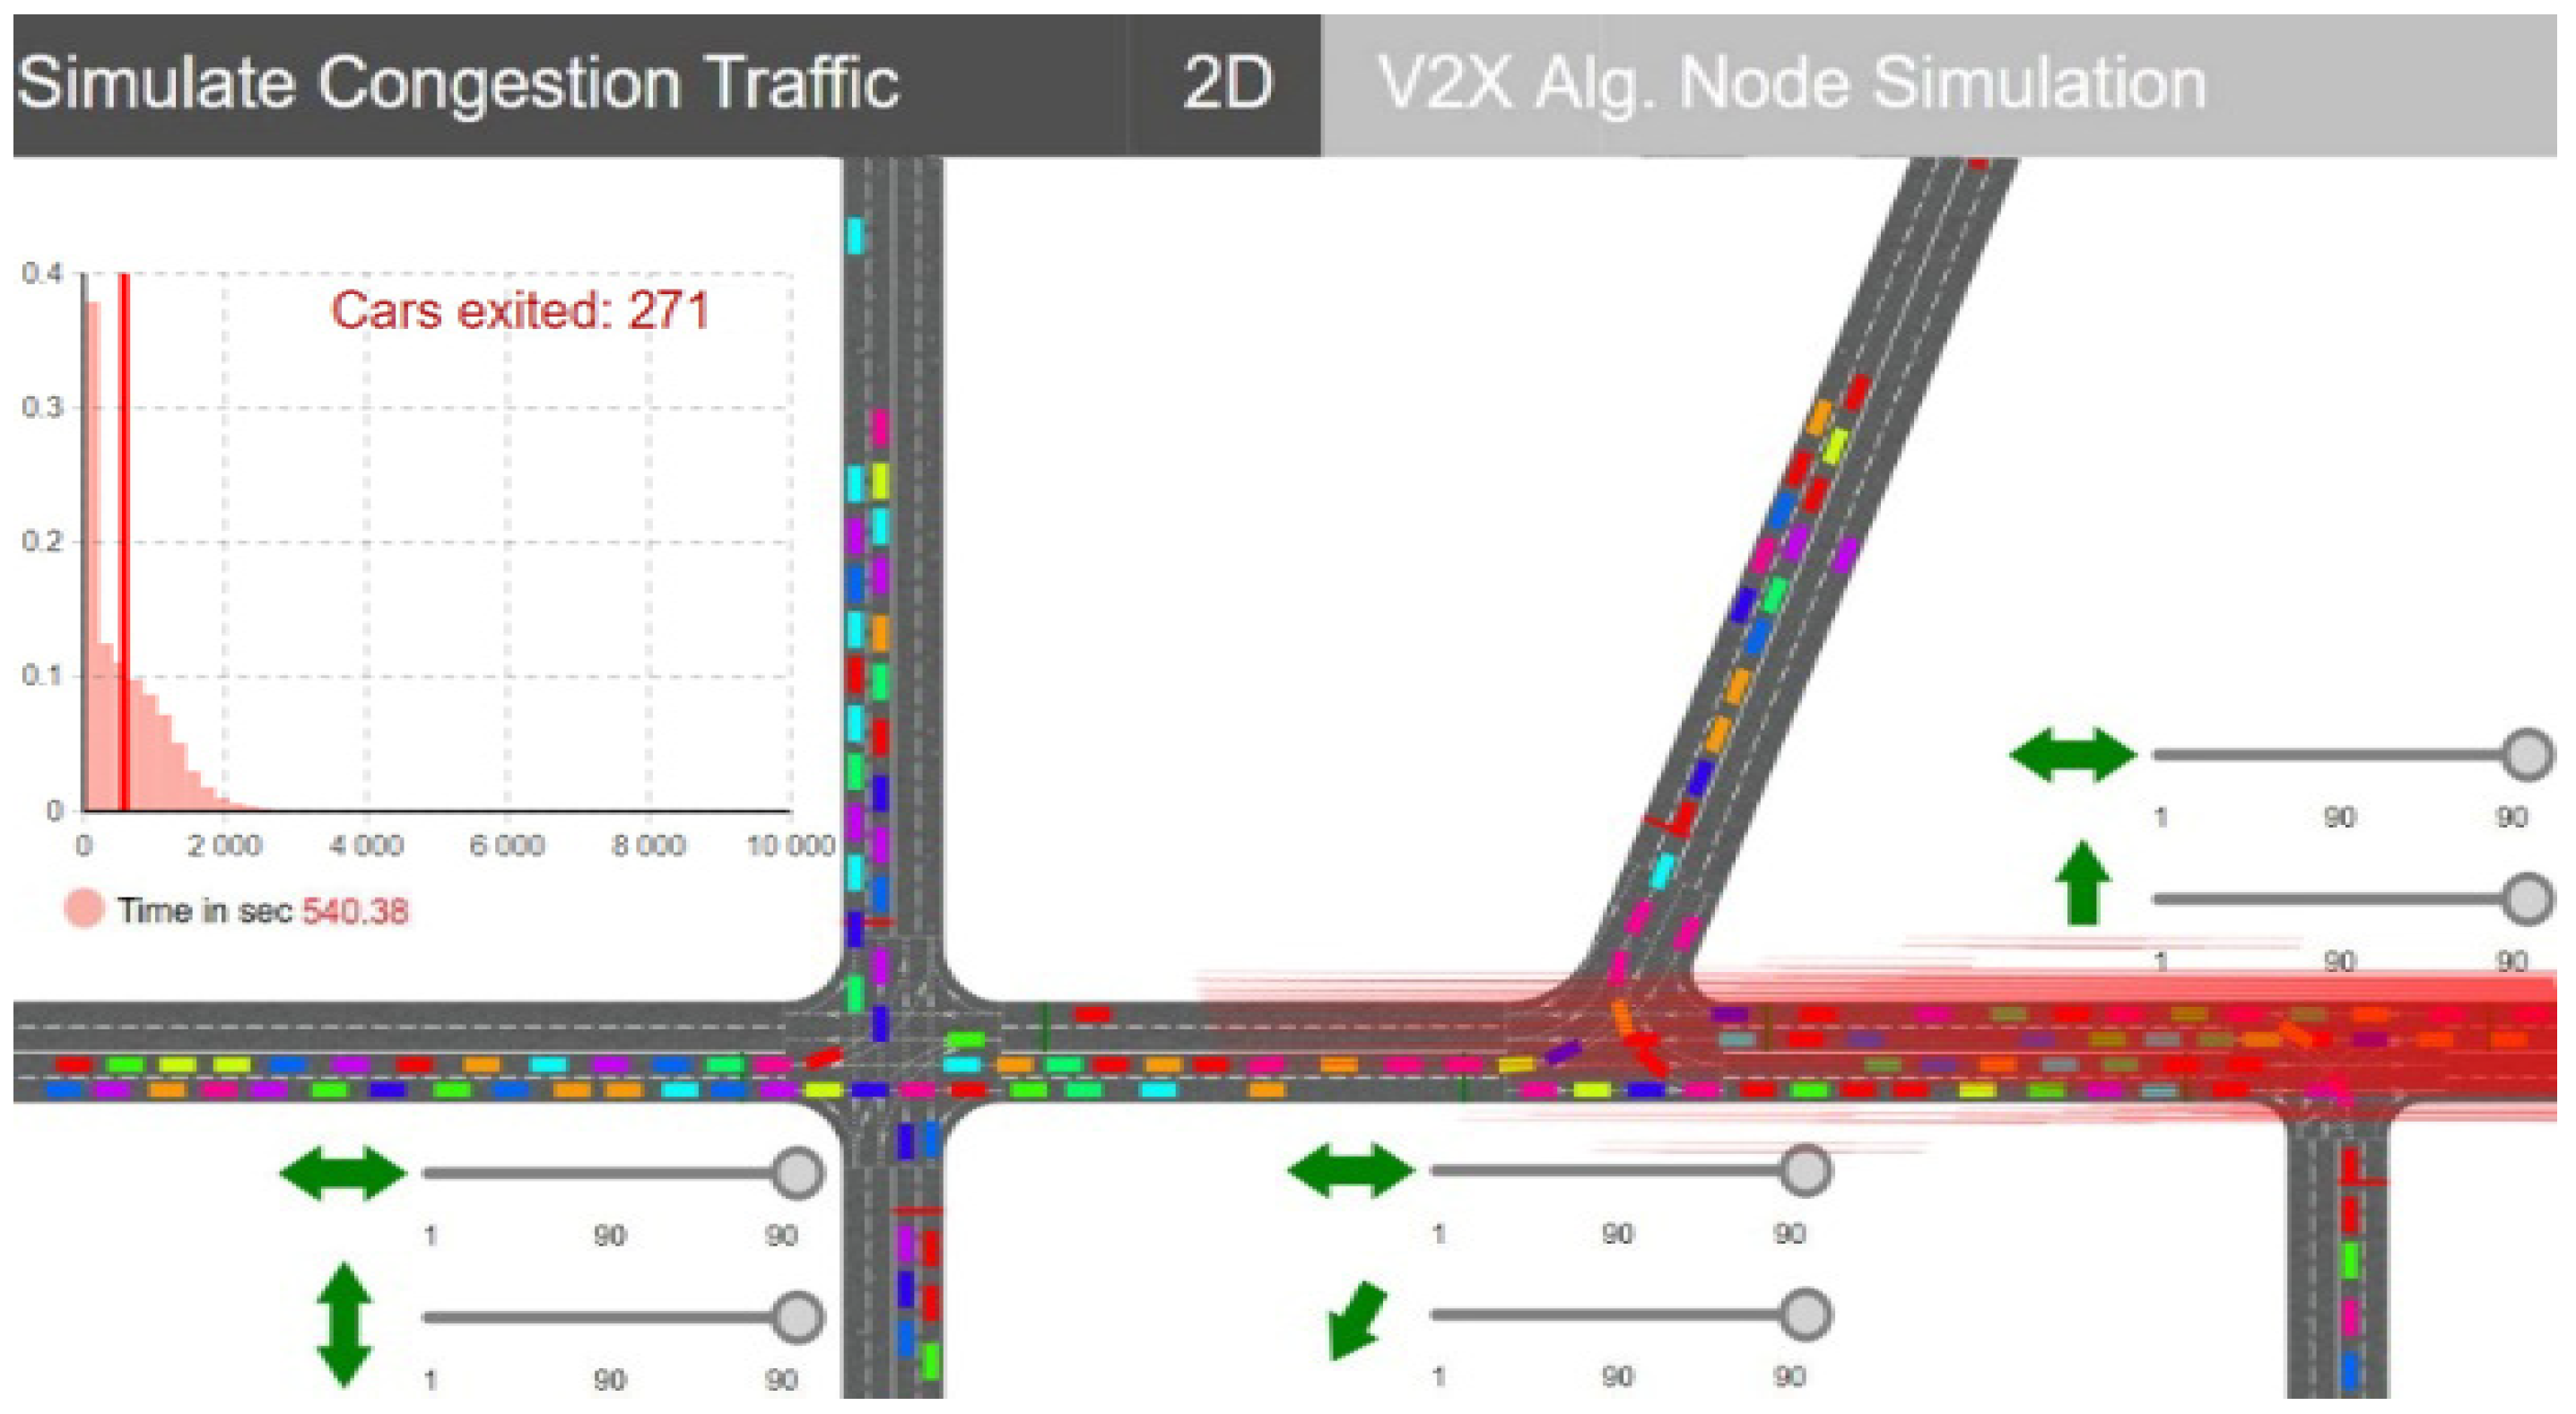
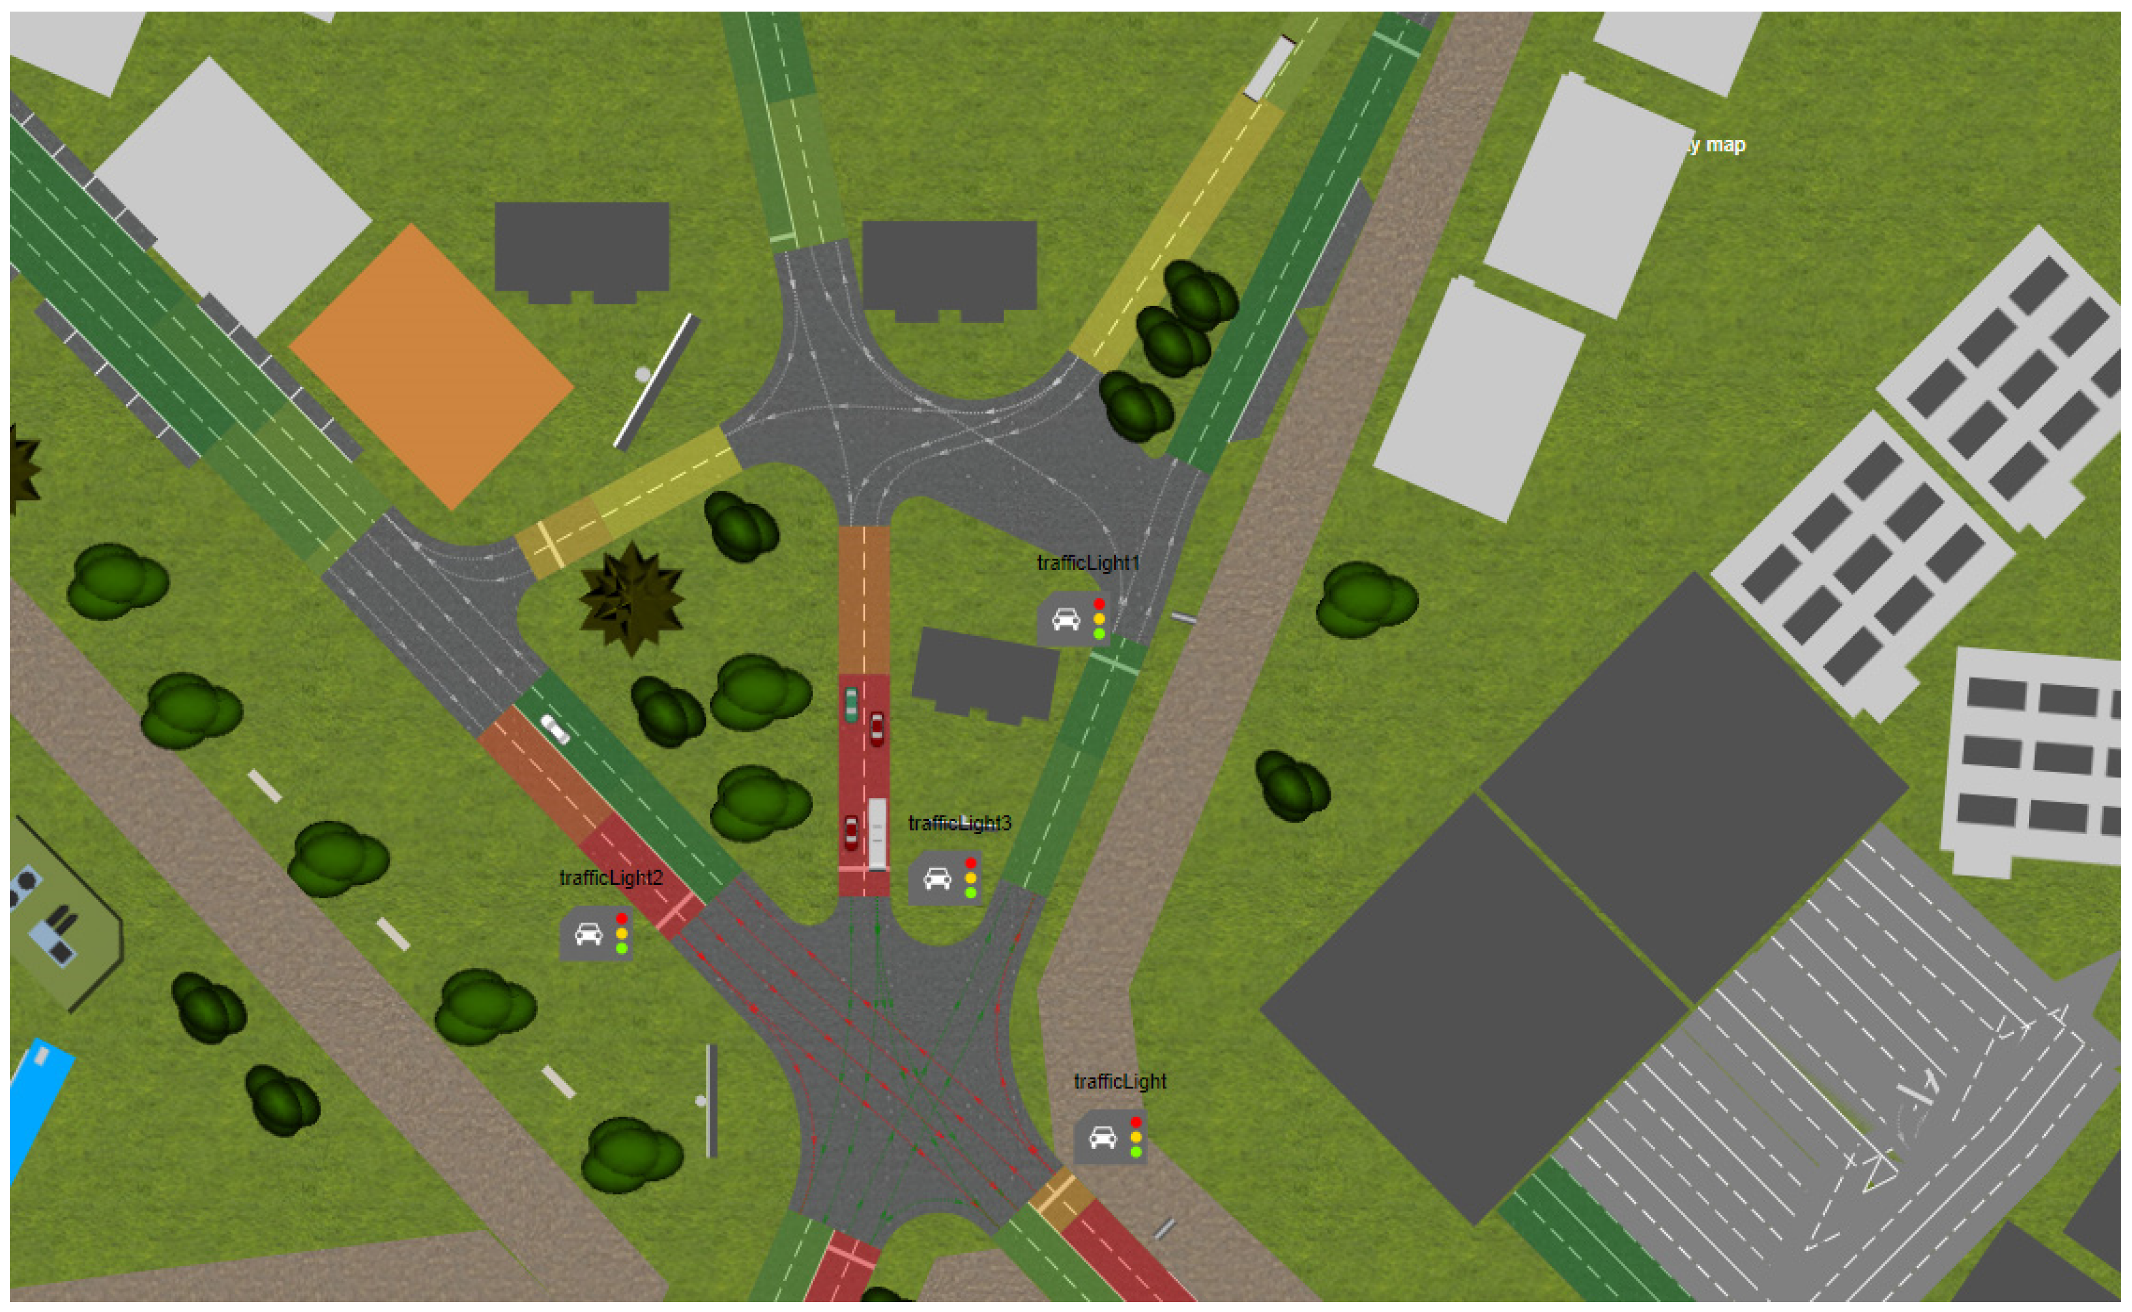
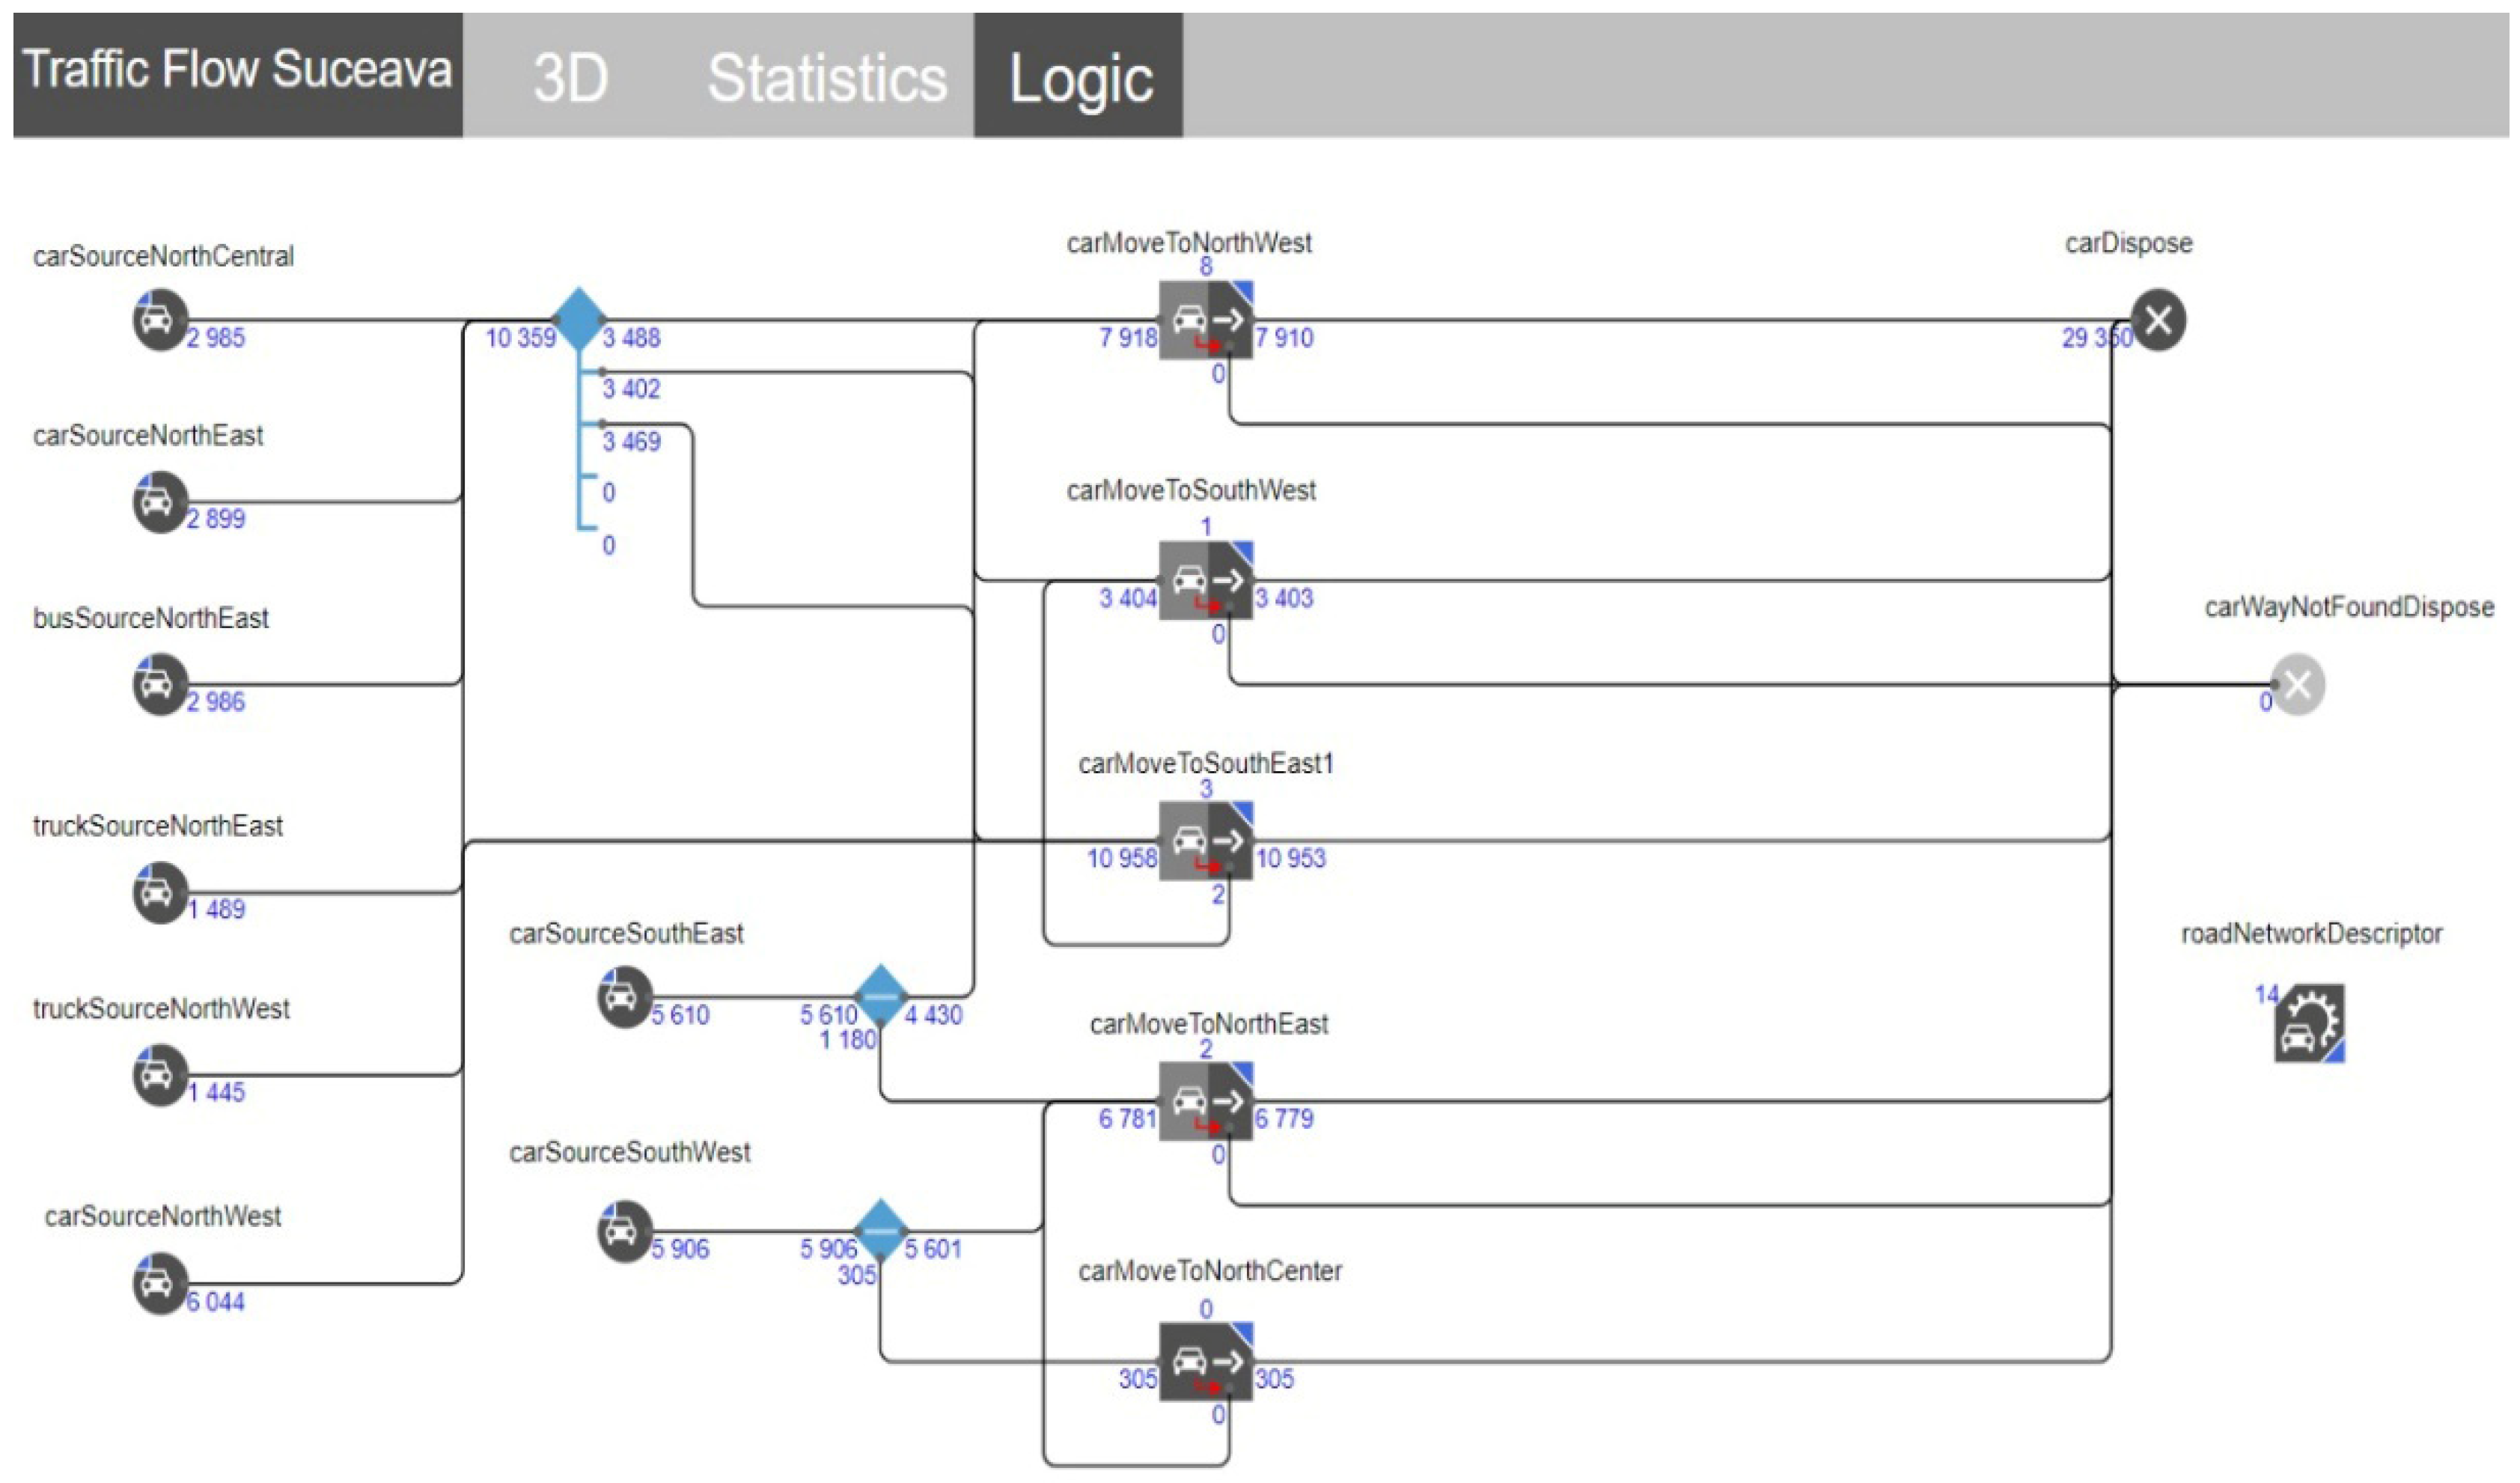
4.2. Simulation Structure of Traffic Flow

All these elements were simulated and analyzed in several stages in order to establish the ideal times and the density of vehicles that can travel in the area without the possibility of traffic congestion. Given the total transit capacity of the area and the way in which the road infrastructure was designed, it cannot withstand a vehicle density of more than 700 vehicles within 1 min. Thus, any delay between 3 and 5 s can lead to a blockage, which turns into a widespread congestion on the other main streets. Therefore, the scenarios were analyzed from the point of view of traffic lights established time, and in a secondary proposal, these are modified depending on the degree of congestion on the road segment. In simulated scenarios based on real data and problems facing this area, we cannot fully control congestion for both directions, the network is not unidirectional, and existing multiple bands on roads are a factor that makes it difficult to solve the problem only from road infrastructure, but we can reduce congestion and gridlocks.
The main goal is to present real solutions and show how important a traffic management system is based on hybrid communications like DSRC, V2X, V2V, and the newer VLC [25,26,27], transforming and improving the prohibitions and behavior of vehicles in the vicinity of the area. Thus, some cars can avoid the area if they are not conditioned by a certain problem, using an alternative route, a temporary way to transit the congested road sector.
The problem is entirely conditioned by the shape and degree of congestion we have in the analyzed area, and these can be decision factors in the traffic control strategy. We can propose one-way traffic control strategies, in both directions, but also a tree-type control strategy. The latter type of control is proposed in a last simulation scheme represented in Figure 3, showing that the route from the incident area to the shortest exit is largely similar to the branches of a tree [28]. The complexity and variety of artificial control measures can lead to the structural peripheries of congestion by controlling the congestion tree. Imposing more than one road restriction through management systems and exposing them in real time for a period of time will lead to traffic jams and blockages, as most of those who transit the area and have embedded a certain procedure will have adaptation deficiencies. Behavior in clearing traffic by modern means of traffic management can help but can also affect the real situation [29].
These decisions are adapted in time and the usefulness is constantly checked, such as the introduction of real-time road selection for each direction of travel and the traffic light system being guided by the flow of vehicles [30].
Each simulated scenario presents a real situation and a simulative situation with a greater number of seconds for the time parked at the traffic light and the flow of vehicles that have transited the analyzed area, automatically outlining the congested areas. The flow of cars was generated starting from about 300 cars per minute given that the part of the road, according to the analyzed traffic information, allows a continuous flow of about 780 cars. In a final scenario, we have presented an extreme case that leads to a total blockage. Figure 4 is the simulated case in which a shorter time for parking vehicles and an efficient traffic light system is recommended, so you can see the degree of congestion in Figure 5, where the actual case where the main traffic light in the forward and left directions is approximately 86 s is exposed. The same scenario was simulated in Figure 6, for a stationary time of 30 s at the main traffic light, the flow of vehicles generated a total passage of 605 vehicles without the formation of a queue or unforeseen blockages. In Figure 7, the real case shows signs that in a long time with a constant flow of cars, queues can occur. The degree of congestion and how a blockage acts can be seen starting with Figure 8, which shows signs of a traffic jam, although the number of cars that managed to leave the intersection is high without encountering problems in transit in the area. Thus, the degree of congestion in scenario 3 is the real version, in which the number of cars is about 500 per minute in all directions and all directions begin to congest the area and show a first blockage factor caused by a poor traffic and management system, given that the main boulevards have priority and that area is transited to connect the two main arteries (see Figure 9). With the help of travel alternatives and bypasses combined with an alternative traffic management system, a fluidization up to 30% more efficient than in the absence of these solutions can be obtained, remedying the previously exposed problems, a percentage that would automatically avoid congestion of the road section. In scenario 4, both Figure 10 as well as Figure 11 have a degree of congestion exceeding the transit limits, with a blockage and queues for all directions. We can see from this scenario that an alternative route that could break the blockage is urgently needed and an intelligent traffic management system with information panels with the traffic situation in the area is a viable solution.

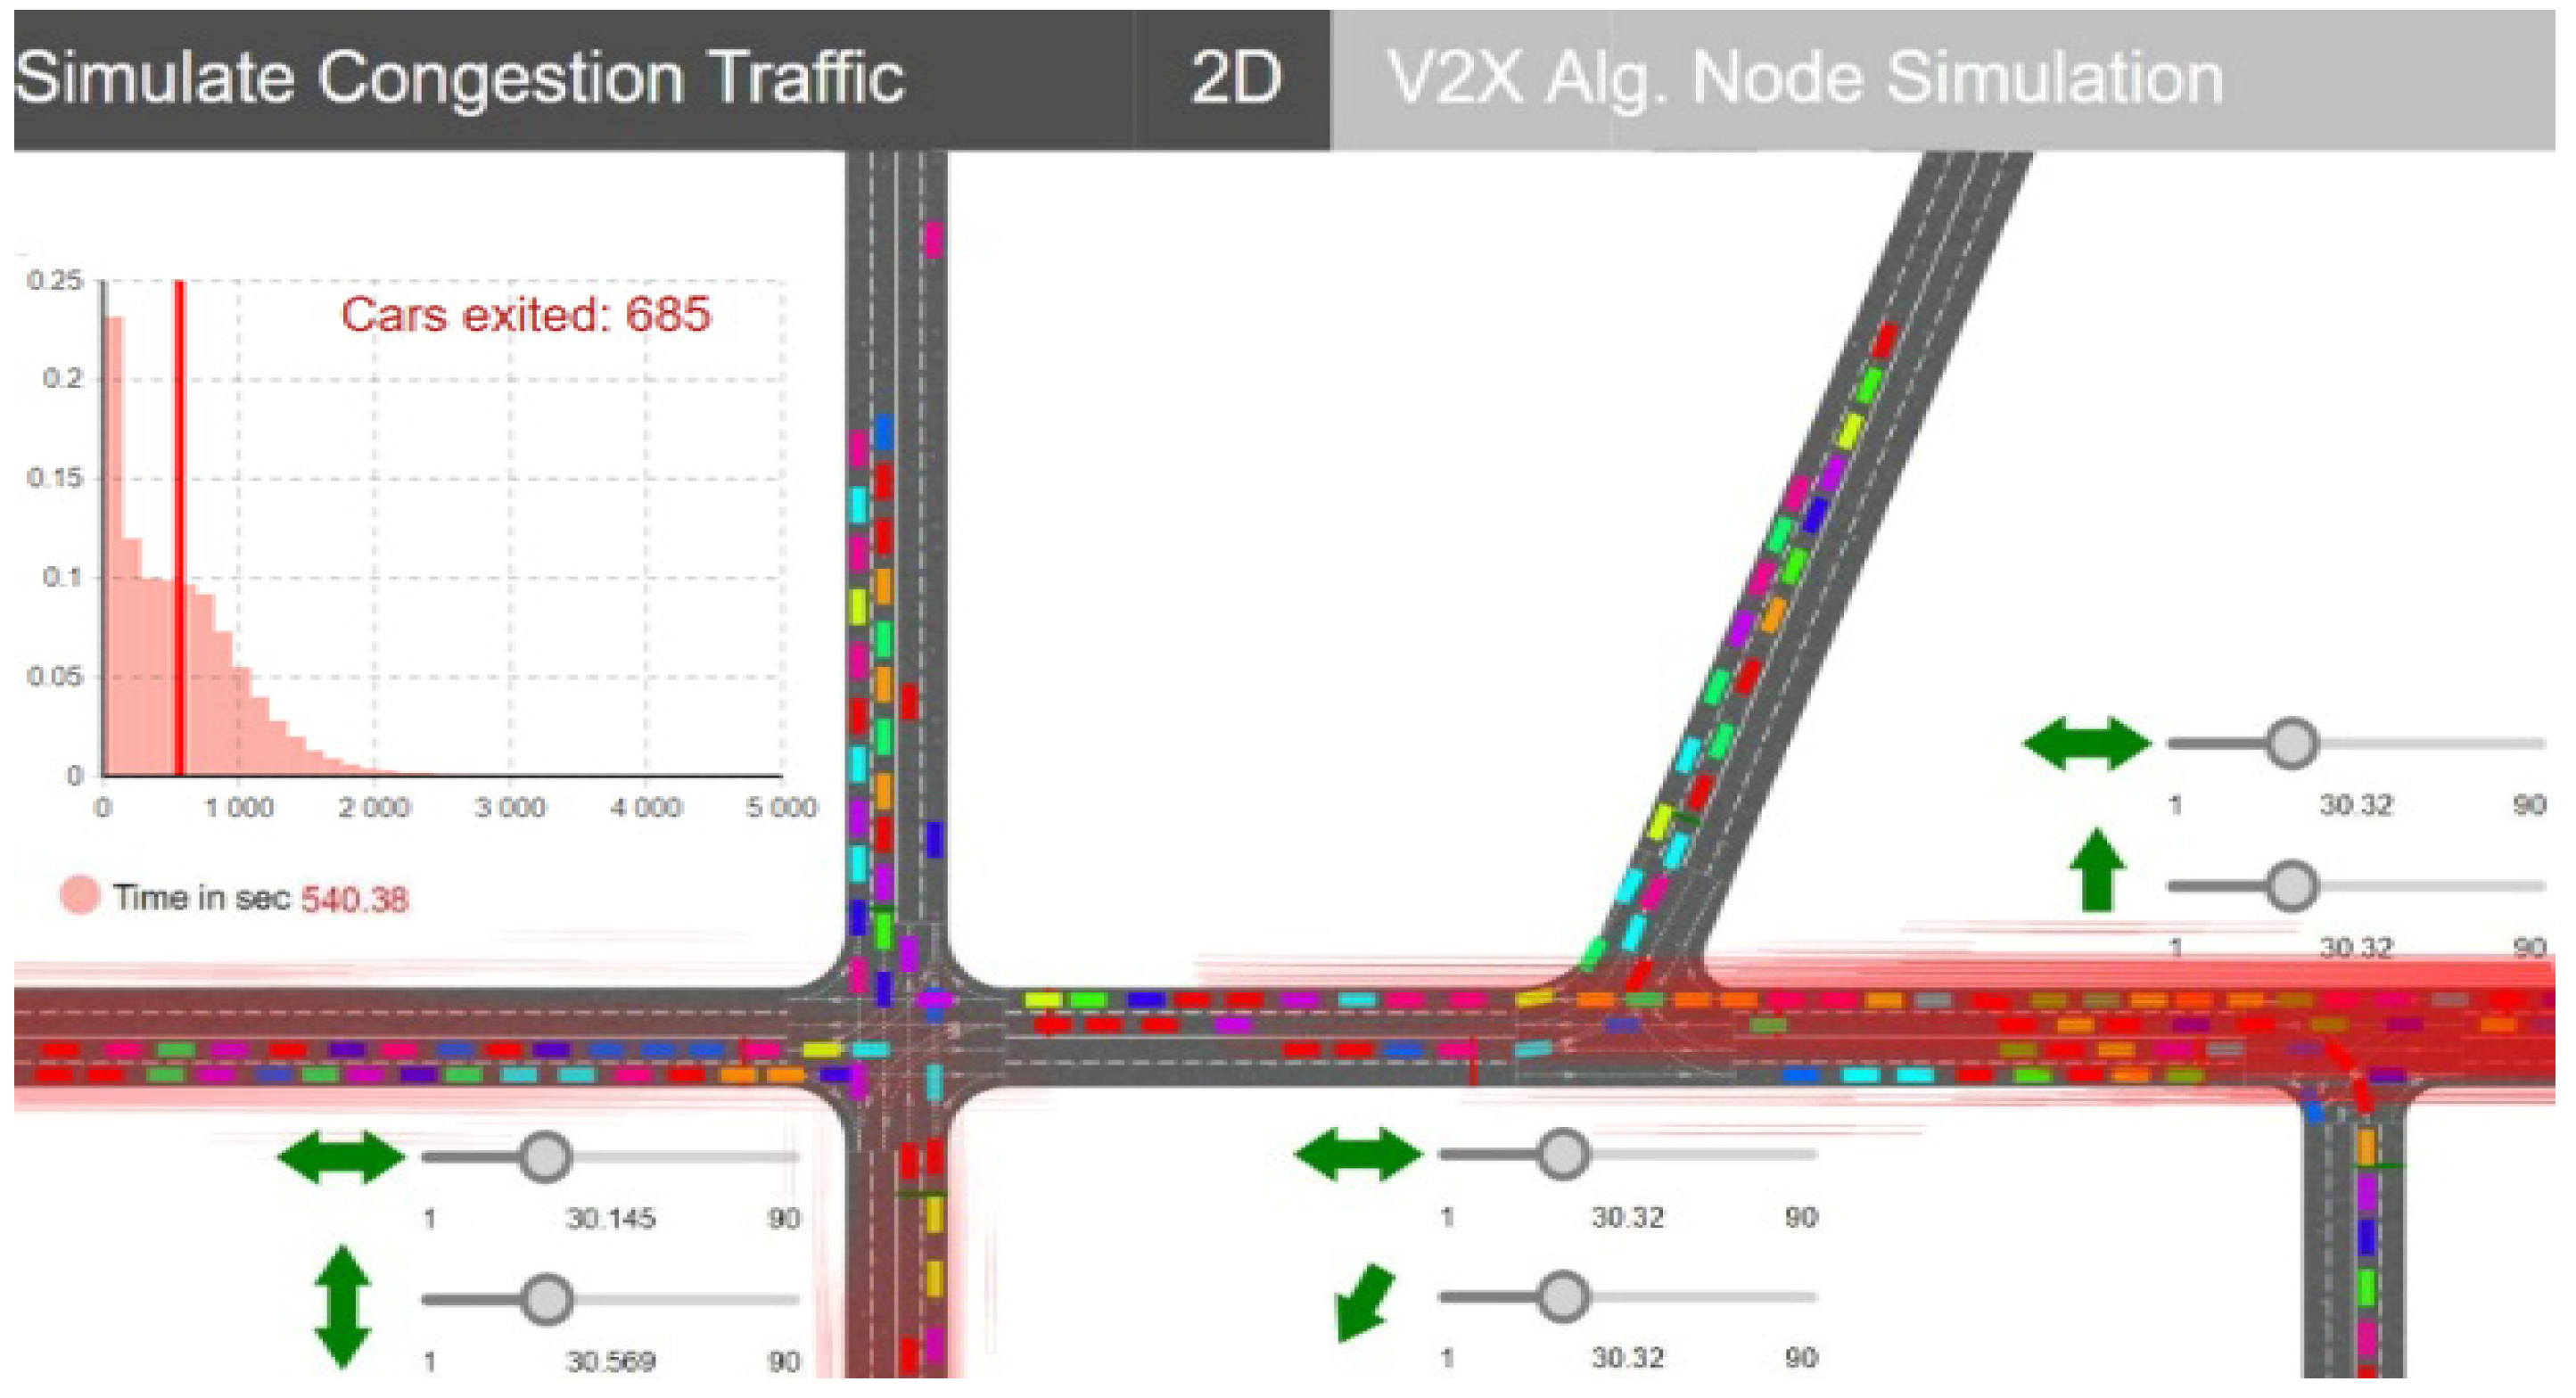
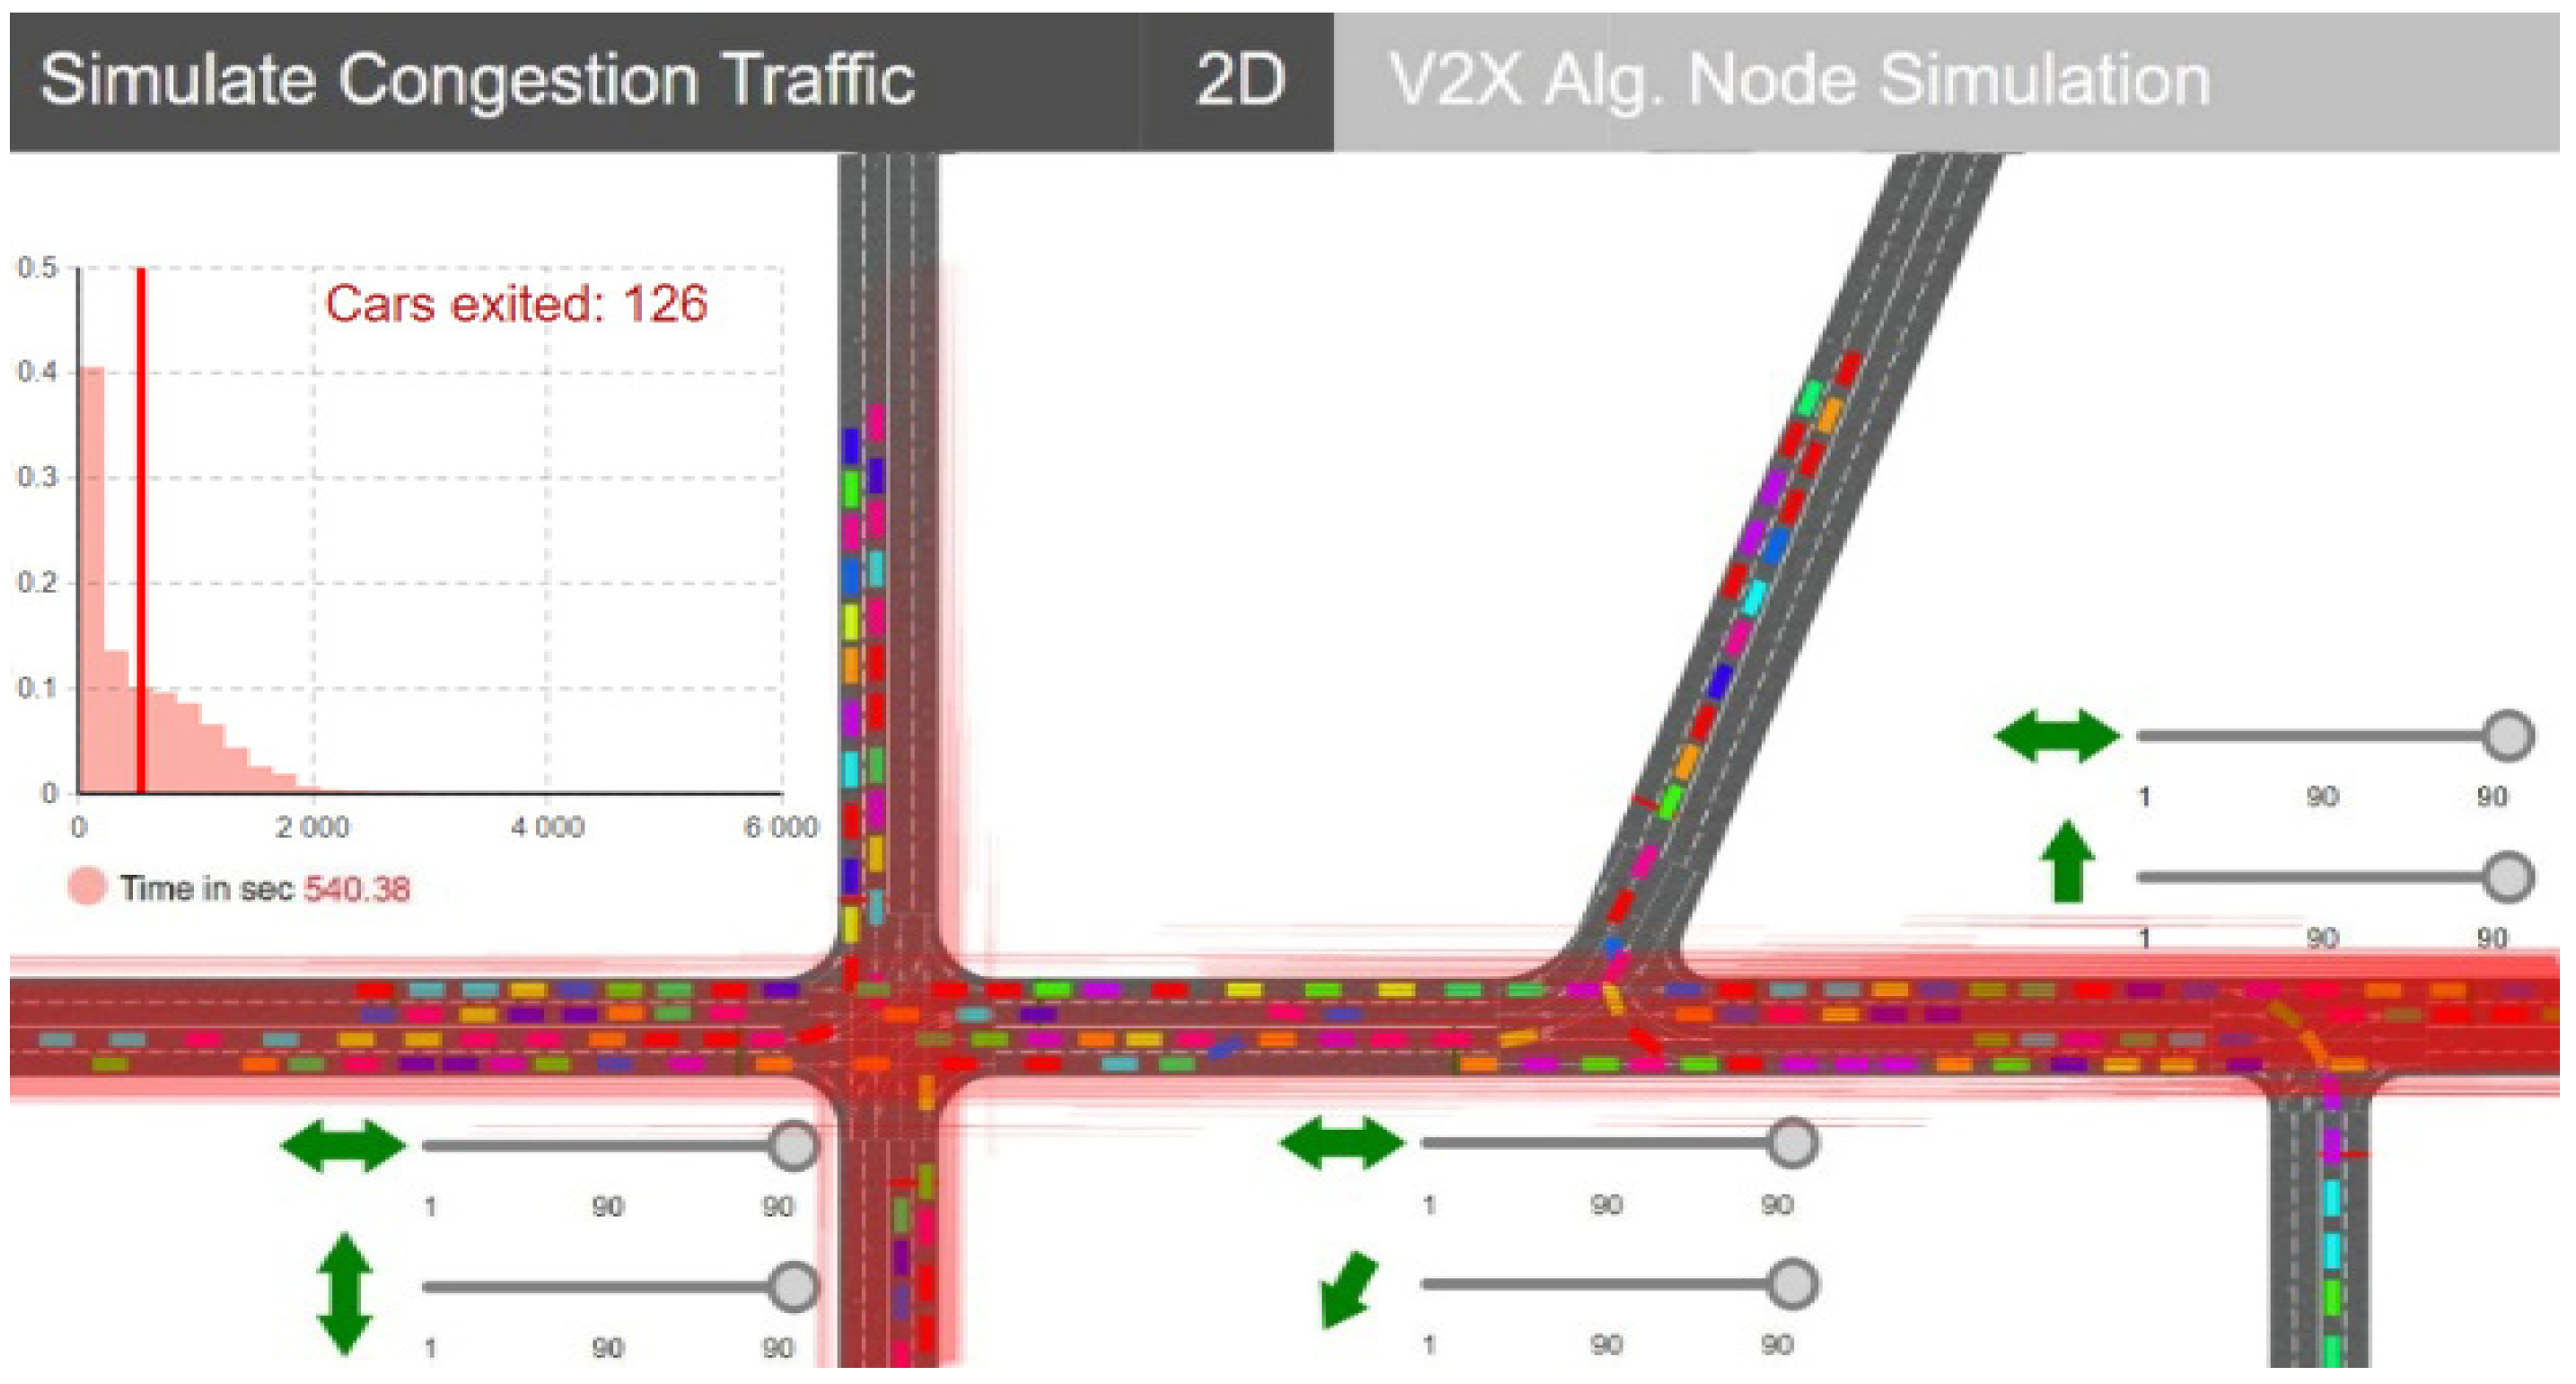
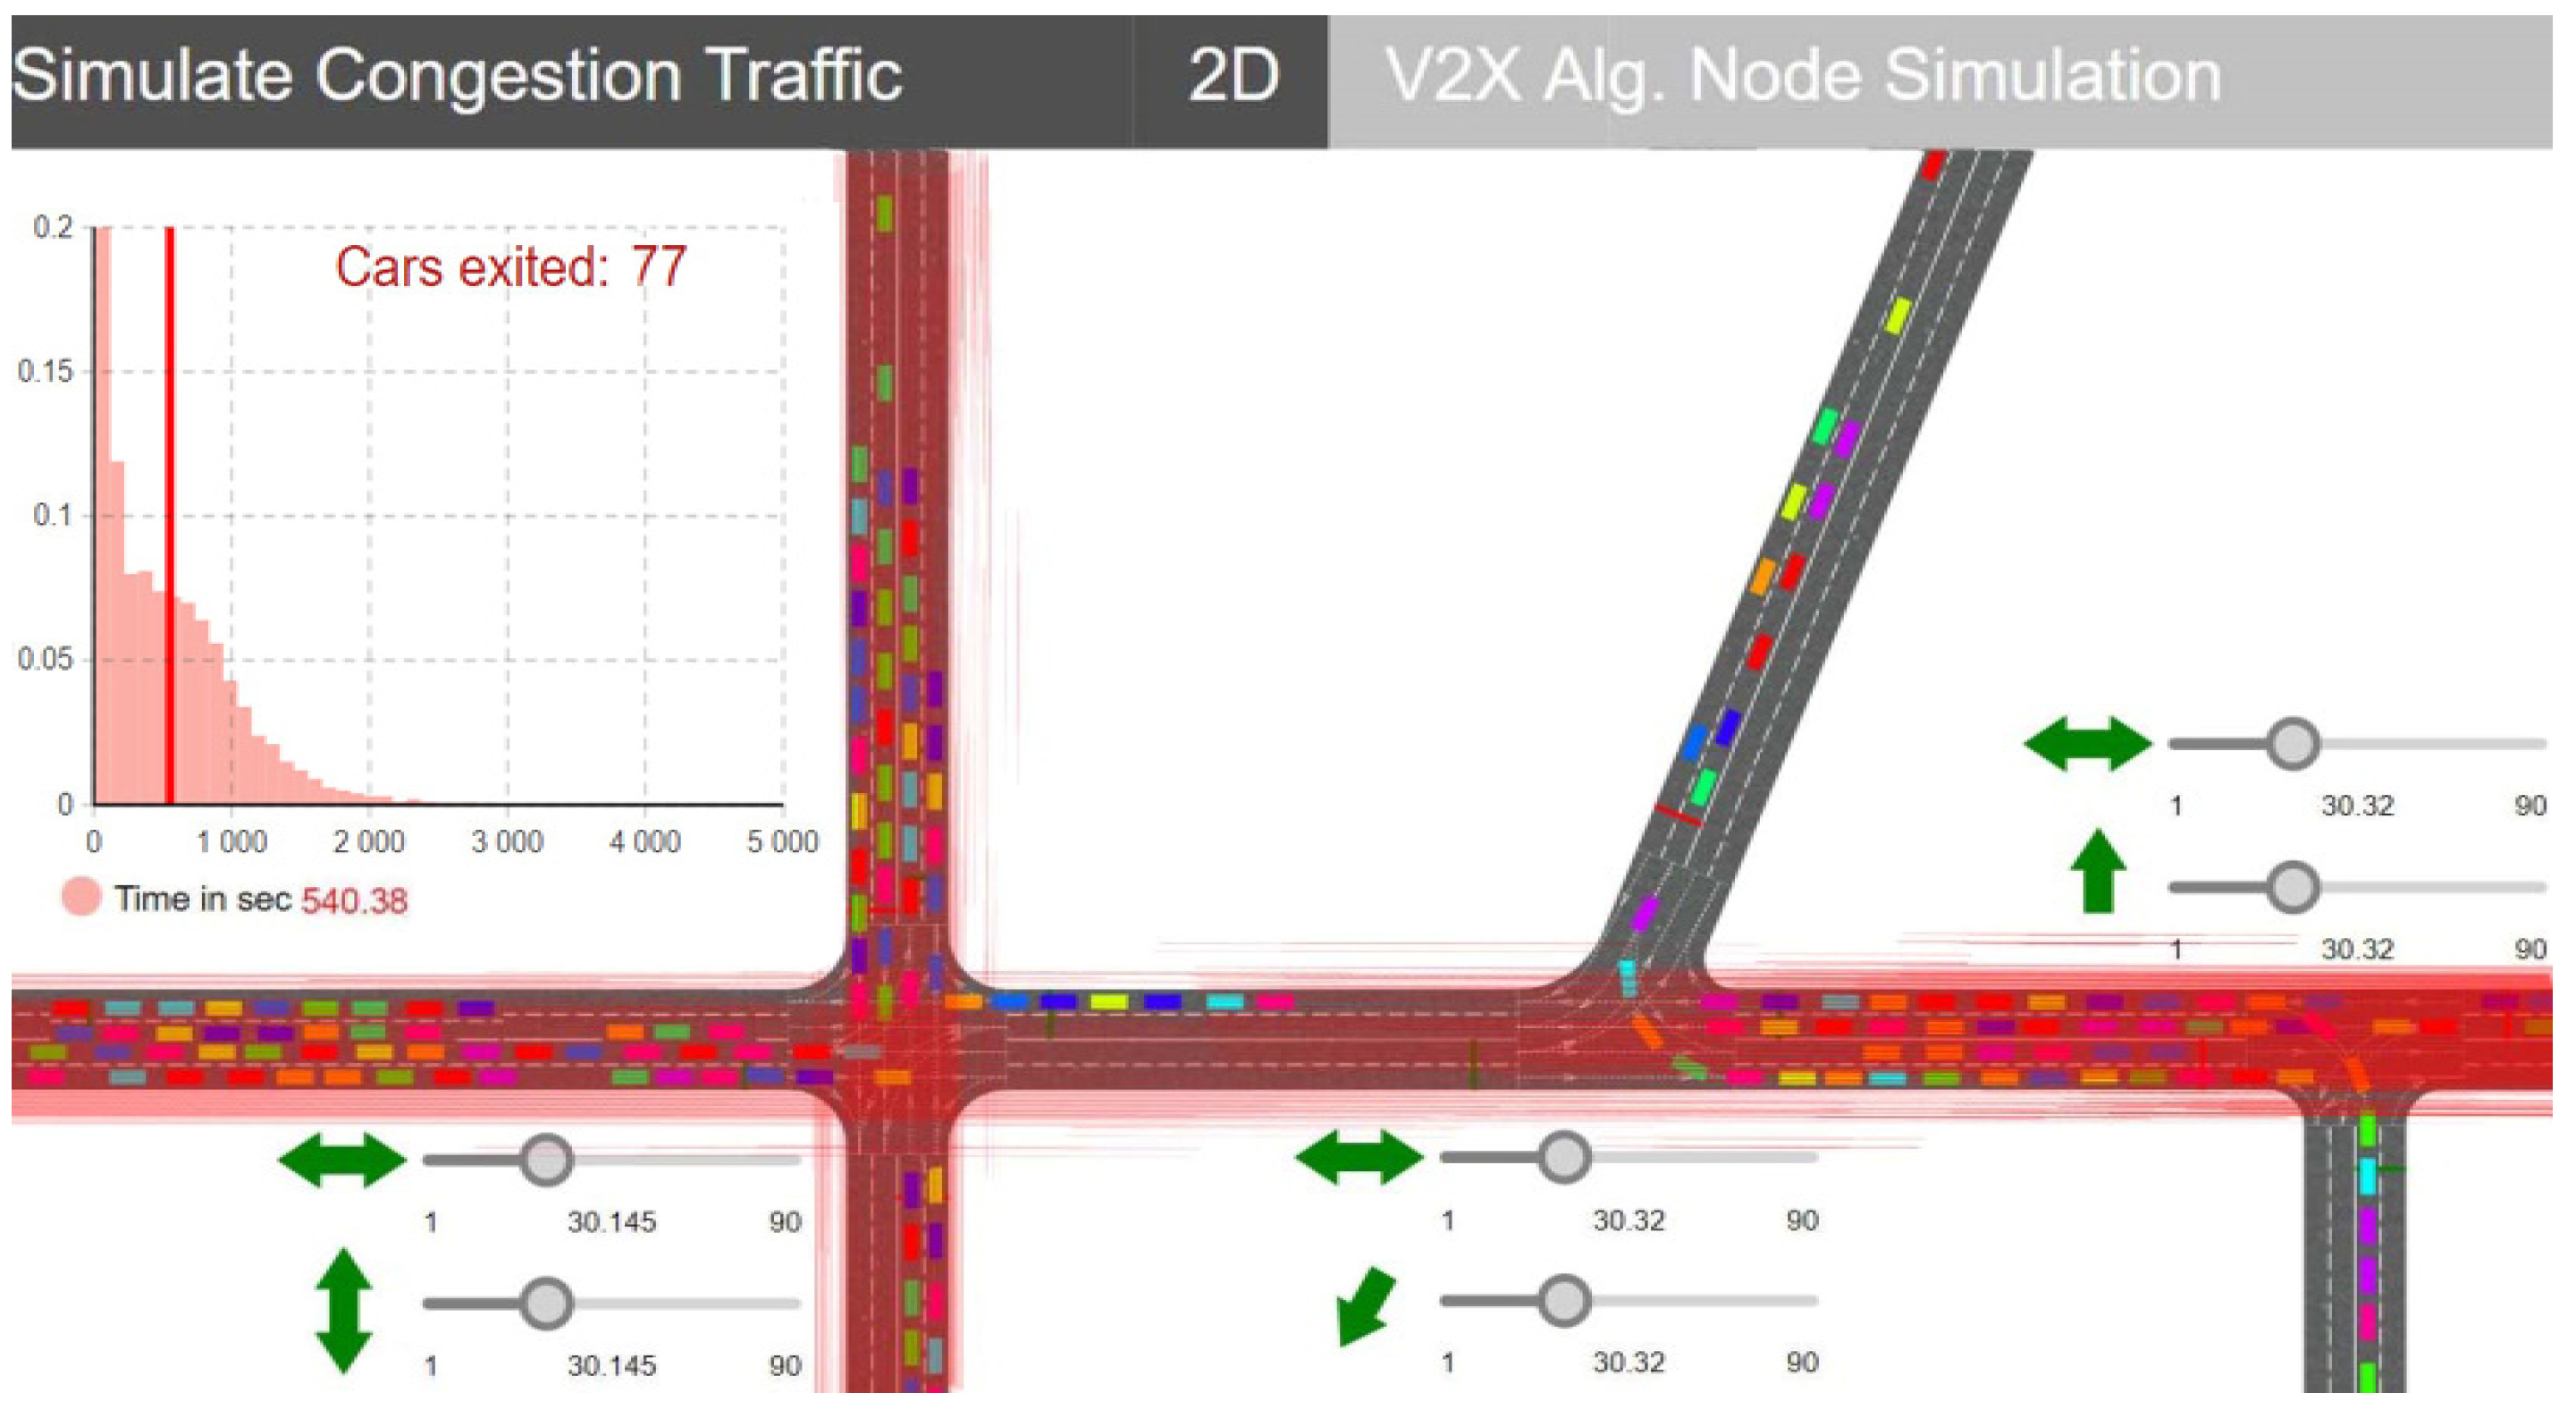
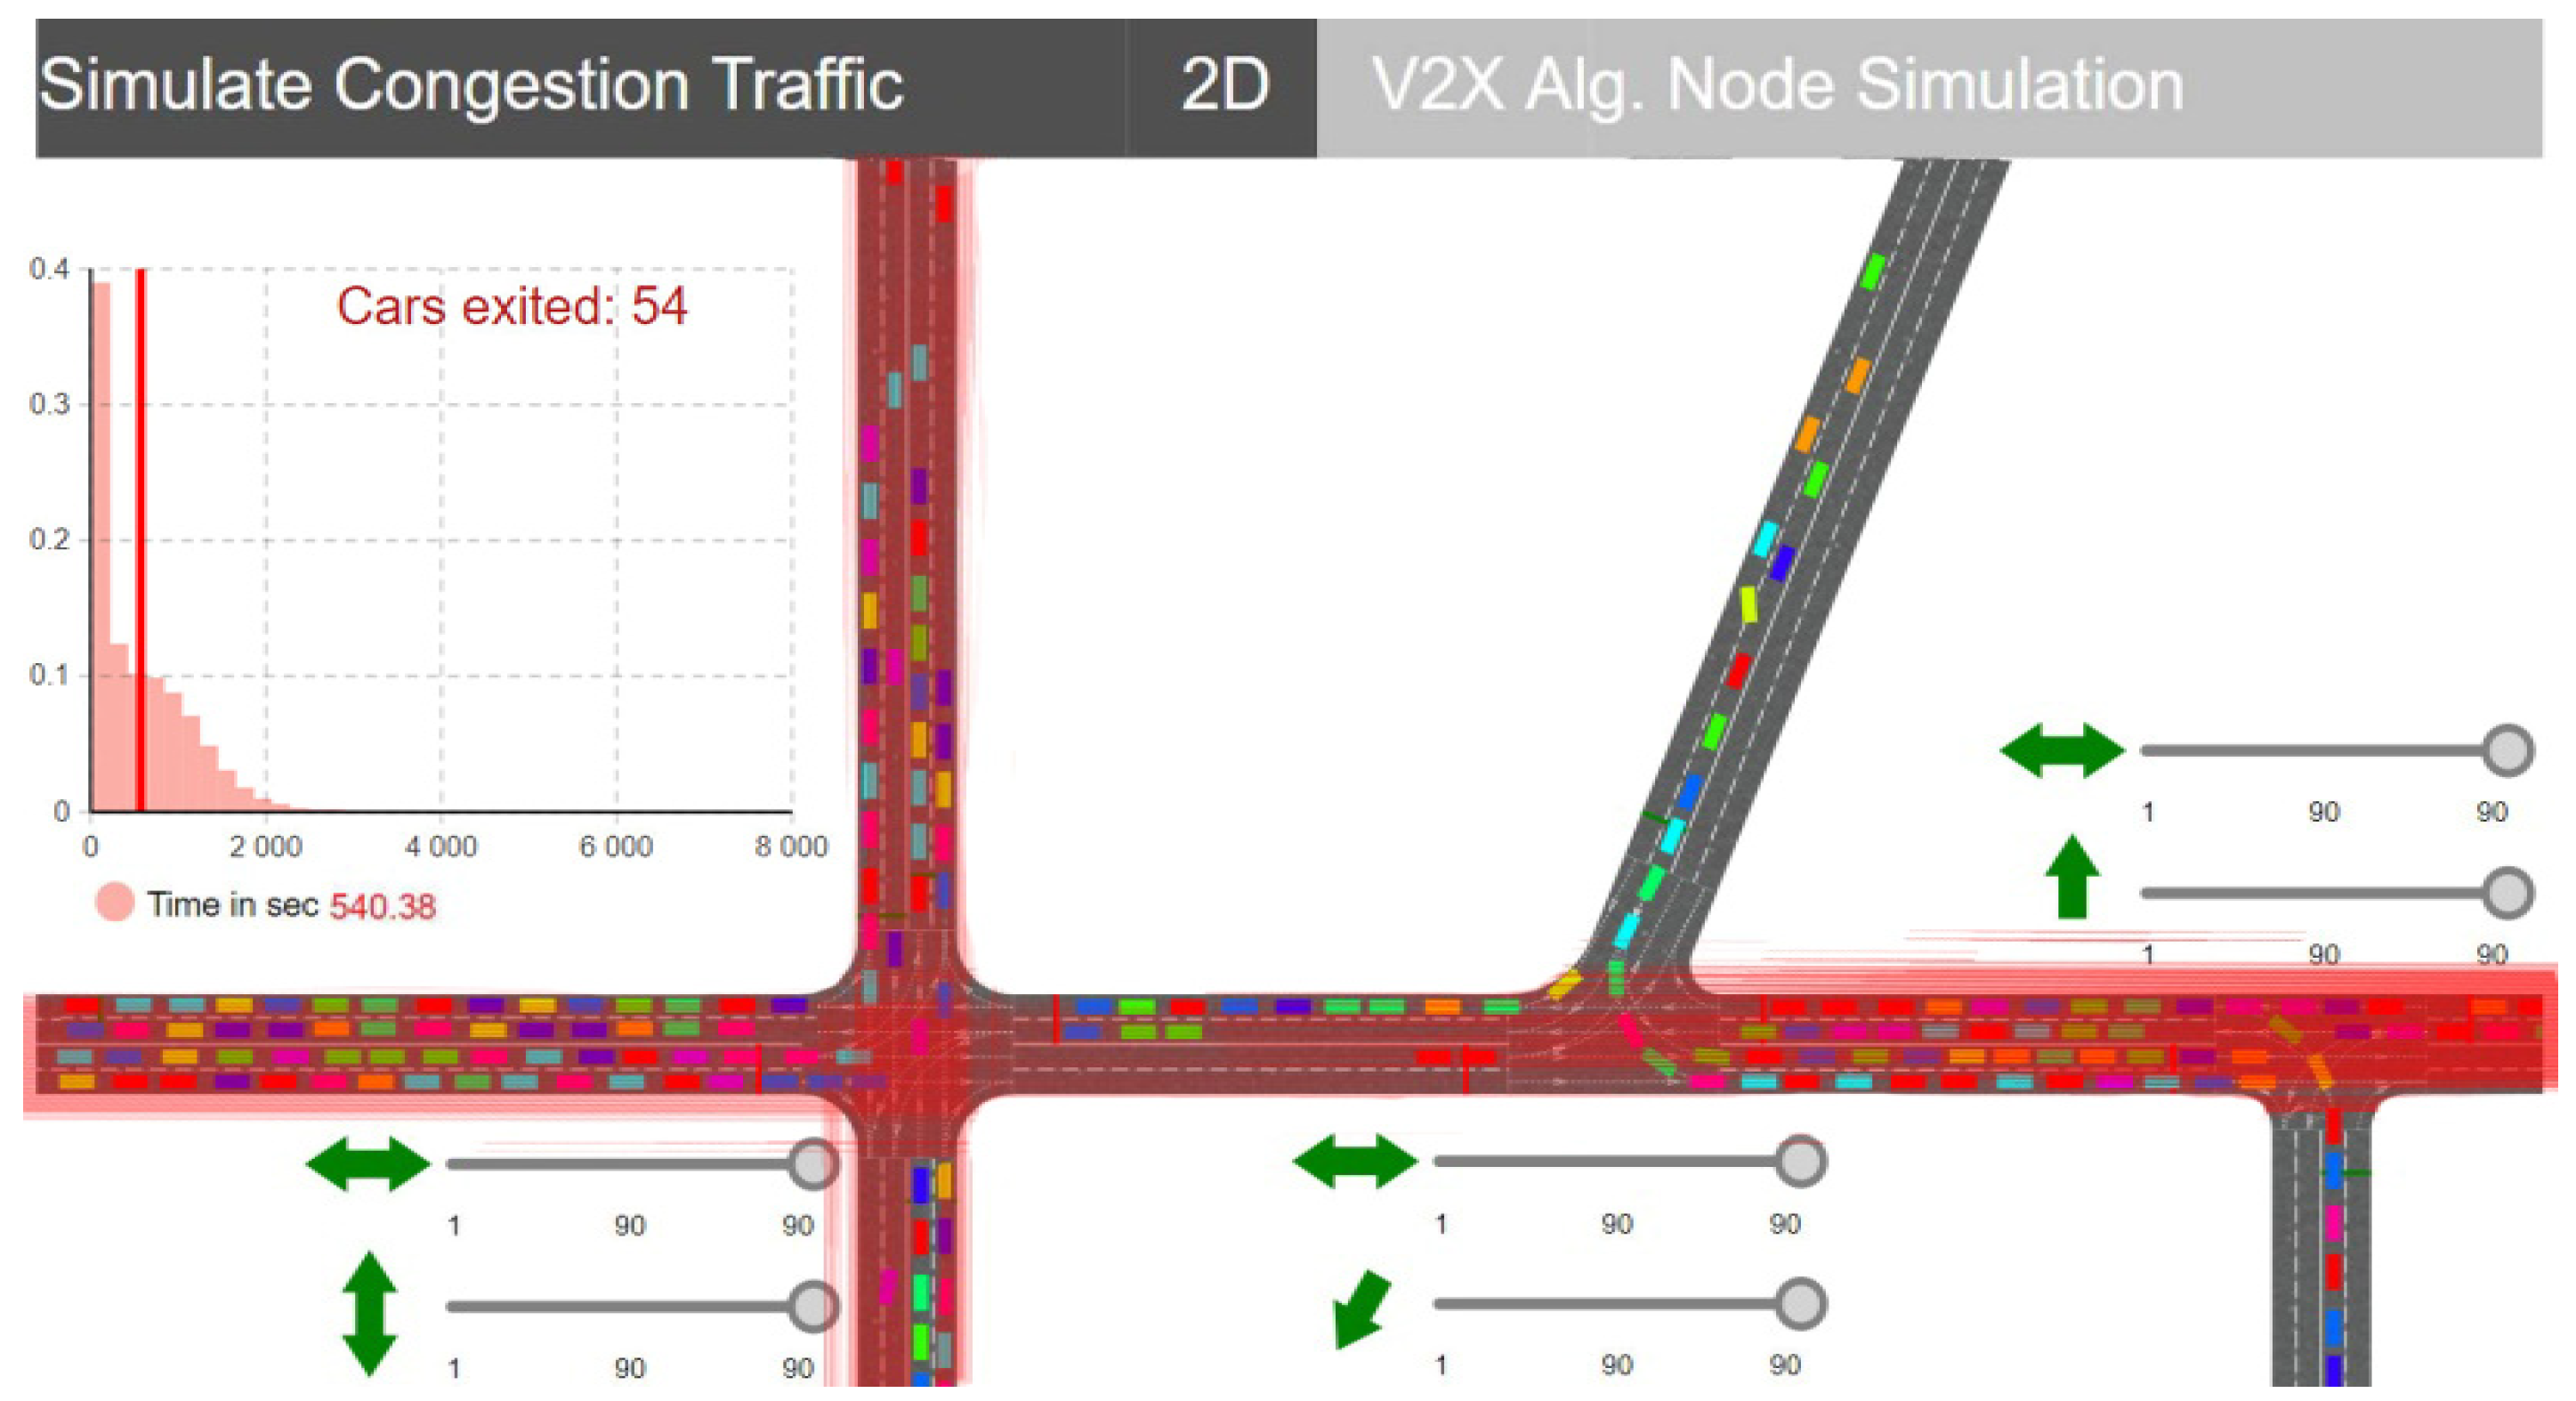
4.3. Simulated Scenario Results

According to the scenarios, we can simulate the observation of an average flow for their density, and for a high flow, there are several indicators that influence traffic conditions and lead to network congestion. For each of the four scenarios, the total transit capacity for the drum sector was made or analyzed, but also the definition of some parameters can be kept in consideration in the current conditions. Thus, we start with scenarios based on a flow of approximately 100 vehicles that pay from hubs related to each direction of travel, analyzing for each condition the total number of vehicles that cross the area without a total blockage. We can see that it is possible that the number of cars will generate an increase, and the rate of travel of the route in conditions for efficient traffic lights is satisfactory. At the same time, we need 90 s involved scenario care, which involves practical application and automatically generates their lock. Thus, the mentioned route can have an active flow of 700 cars in transit within 9 min in ideal conditions, otherwise, the area becomes congested for a calculated time between 15 and 25 min to the decongestion areas. This can cause the intersection of University Street with the two main boulevards (G. Enescu Boulevard and Ștefan Cel Mare Boulevard), with these being of priority, and it can have a much higher flow of vehicles exceeding 2000 cars in transit. For a better analysis and exemplification of similar settings, see Table 1 below.
According to the data in the table, we can see that the current situation implemented in simulated scenarios reflects a degree of congestion that exceeds 80%, especially when the transit capacity of the analyzed sector is exceeded by the number of cars. Thus, the most important hours in traffic congestion are those mentioned earlier in the article, and for better coordination and streamlining of traffic, some experimental practical solutions will be proposed both through simulated elements and by improving the traffic management system and traffic lights.
The simulated scenarios aimed to test the real information and compare them according to certain factors that can negatively or positively influence the congestion and spread of the blockage both on the main street and on the adjacent ones or main boulevards.

4.4. Traffic Flow Solution and Three-Dimensional Projection

In order to solve most of the problems, we analyzed the triggers in case of congestion and tried to limit the spread of blockages in the form of spider webs, which would outline a traffic disability that can be maintained for several hours. The traffic flows are intense on the main arteries, more precisely the boulevards, and the connection between these two areas is made through the analyzed road sector, with this being limited as at this moment, there is only the possibility to change the direction in two areas leading to the higher education institution or to an agri-food complex. The main problem is that the part of the road does not benefit from an alternative route to bypass the congested area, so in the following simulation, the diagram of the area was graphically reproduced with the remodeling of a road passage that allows turning right in two areas so that the return to the boulevard is possible, thus isolating the blockage. In the same area, at the level of simulation and at the level of local infrastructure, three info-traffic panels are located that highlight the degree of congestion in real time with the help of surveillance cameras already installed at the intersection. This information is ideal for the categories of drivers who want to leave the boulevard and make the right turn towards University Street. These are real and implementable solutions based on the current infrastructure without influencing the driving conditions and without creating problems for the inhabitants by adapting to a new technology [31].
For a better coordination of things within the application, vehicles were prioritized, transforming the car network into a series of autonomous cars, connecting each line, synchronizing everything with the road lighting system so the congestion problem is solved in large proportions in cases in which vehicles are equipped with systems dedicated to communication with DSRC, V2X, V2V, or VLC infrastructure [32,33], either from the factory or individually developed equipment.
In this sense, our research team is working on the development of prototypes of communication through visible light and radio frequency, devices capable of capturing and processing information from the external environment and then transmitting it to other vehicles for communication and formation of an autonomous network dedicated to traffic safety. Figure 12 represents the design of a model after the respective area with changes in the central part of the traffic area, the delimitation of directions, and the formation of an alveolus dedicated to returning to a main road sector, which fluidizes traffic and compresses congestion only at traffic lights, which are of a very short time. Thus, the data packet function was designed to provide approximately 500 vehicles for all directions, synchronizing with the road infrastructure and the priorities imposed depending on the traffic situation.
The simulation process was allowed to run within 1–3 h, but also for a period of 12 h to provide a broader perspective on the average parking time, the number of cars that crossed the area, the occurrence of blockages, and the presence of traffic events. The technical solutions that refer to the management of traffic management systems are effective, especially if in this intersection the changes presented in Figure 13 will be made, where the alveolus delimiting the directions of travel was highlighted, making it possible to reclassify traffic on a secondary artery without pushing cars into a queue that would turn into a branched congestion.
Thus, the proposed change increases the flow capacity for priority traffic and offers the possibility to avoid the congested area, about 70% of the current traffic flow could benefit from this solution and would automatically increase the transit capacity through that area. Between the two boulevards, the road section has about 900 m and the capacity of 700–800 cars that can transit the area within 10 min, provided that the traffic systems are set below 30 s and the secondary streets do not impose limitations and turns. The current proposal comes with a plus in order to increase the capacity of vehicles transiting the area. According to the graphs shown in Figure 14, there is no downtime in parking vehicles, and there is constant speed, a low waiting time, and a lack of congestion.
The designed logic diagram is highlighted in Figure 15 and provides an overview of the entire simulated process with a perspective on the total number of vehicles left at each point and the total number of vehicles that passed through the designed nodes.
According to the results obtained, the congestion location is a problem generated by the lack of right-of-way priorities to avoid the area, but also a poor road management that starts from the main boulevards with a higher flow of cars. In a first phase, the proposed solution is a topical one based on the current infrastructure [34]. The future model for implementation also includes a practical part of traffic based on the use of devices for traffic management and communication technologies such as V2X, V2I, V2V, and DSRC [35,36]. Installing a road-side unit (RSU) and several onboard units (OBU) on cars and monitoring traffic through modern means of control will be able to demonstrate the usefulness and need for an intelligent traffic management system, and also the need for autonomous cars [37,38]. Some information may differ in a real case because the total unpredictable and anticipated human factor intervenes, and any simulated model in this case is exposed and the rule becomes invalid, so we consider the presence of dedicated systems useful, installed in both heavily trafficked areas as well as in cars.
In ideal cases, a congestion can be remedied in a relatively short time of about 7–10 min, but these times are in accordance with simulations that do not involve other events. In total unforeseen traffic, they can negatively affect the situation and congestion, having a duration exceeding 30–50 min to be resolved. That is why an alternative route dedicated strictly to the areas with urgent problems is necessary because such a shortcut can save time, lives, and can reduce waiting times and dispel traffic jams [39].

5. Conclusions

Accidents and loss of life caused by poor traffic management and poor adaptation of speed to weather or traffic conditions cause both accidents and blockages. In this paper, the traffic congestion caused by various reasons was analyzed and presented, simulating several models, dividing the traffic according to certain criteria and prioritizing certain areas. These elements were made based on a real case and based on the information received on the density of cars in that area. Following the analysis and simulations, we observed the decision factor in creating congestion and how it develops and branches, making the area impassable. Thus, the analyzed and subsequently simulated elements present the way in which strategies can be proposed to streamline the process and become feasible in the near future. According to the results obtained and the evolution of the results from the paper, we can see that the car network and the blocked route have been improved by technical implementations or by elements of modern road infrastructure. Suceava, the city of our study, is not a choice in itself, but rather a choice given by the symmetry of our trajectories and the fact that we see the problems and want to act on them. The study can be scaled up to other cities as well to the detriment of freight transport by taking into account road infrastructure. As a consequence, we analyzed real cases and scenarios, for which we found solutions with the help of simulations for an efficient traffic management regardless of the nature of the events. The article presents enough elements that constitute a starting point for the application of simulated models and methods in practical cases, but also in the advancement of intelligent transport systems for congestion control, intersection control, signaling and display of traffic flow at busy intersections, and orientation driver information [40].
We can also advance and develop more generalized methods of traffic prediction and temporal and temporary analyses of vehicle flow through systems specially created in this direction using elements and communication methods dedicated to safe driving. The next step in the development of this direction is the simulation in a real framework of a network of vehicles based on V2X communications and a DSRC system, using a complete system consisting of two or more OBUs and an RSU for control, command, and analysis of data. We want to attach to this simulation the VLC system developed within a research project dedicated to the automotive sector and which could create a mix of technologies capable of providing a complete solution. We consider this approach necessary and we want to prove the usefulness and necessity of dedicated systems for transport and road safety by putting them into practice in real situations. Such systems and methods used in the simulations presented in this article can be applied anywhere in a problem related to traffic congestion. Whether we are talking about traffic density congestion or road accidents and events, the use of alternative routes or intelligent transport systems with information panels at each main artery would streamline traffic without major events. Communications and applications dedicated to the automotive sector have huge potential and benefit from the current state of technology and existing infrastructure, so the implementation costs of the various systems become much easier to achieve and at much lower costs. The complementarity of systems based on VLC-V2X technologies adds the advantage of non-interference with the radio communications of any kind, excluding interference with other mobile communications and DSRC, being very useful in urban areas where there is a saturation in radio frequency.
The use of intelligent transport systems is discussed a little in this article, as the development of a solution to help this problem is underway and provides an efficient combination of the methods addressed in this article by creating dynamic vehicular networks. All the authors’ efforts are channeled in the mentioned direction and support the efficiency in terms of traffic management, intelligent traffic systems, and autonomous equipment dedicated to the automotive sector.

Author Contributions

Conceptualization, E.Z. and L.-M.C.; methodology, M.D.; software, E.Z.; validation, E.Z. and L.-M.C.; formal analysis, E.Z.; investigation, E.Z.; resources, M.D.; data curation, E.Z.; writing—original draft preparation, E.Z. and L.-M.C.; writing—review and editing, E.Z. and L.-M.C.; visualization, E.Z.; supervision, M.D. and E.Z.; project administration, M.D.; funding acquisition, M.D. All authors have read and agreed to the published version of the manuscript.

Funding

This work was founded by a grant of the Romanian Ministry of Research and Innovation, CCCDI-UEFISCDI, project number PN-III-P1-1.2-PCCDI-2017-0917, contract 21 PCCDI/2018, within PNCDI III. This work was also funded by the Ministry of Research and Innovation within Program 1—Development of national research and development system, Subprogram 1.2—Institutional Performance–RDI excellence funding projects, contract no. 18PFE/16.10.2018.

Conflicts of Interest

The authors declare no conflict of interest.

References

  1. World Health Organization. Global Status Report on Road Safety 2018; World Health Organization: Geneva, Switzerland, 2018. [Google Scholar]
  2. World Health Organization. Fact Sheet on Road Traffic Injuries; World Health Organization: Geneva, Switzerland, 2018. [Google Scholar]
  3. U.S. Department of Transportation Research and Innovative Technology Administration. Frequency of Target Crashes for IntelliDrive Safety Systems; Technical Report; U.S. Department of Transportation Research and Innovative Technology Administration: Washington, DC, USA, 2010.
  4. CAMP Vehicle Safety Communication Consortium. Vehicle Safety Communications Project Task 3 Final Report; Technical Report DOTHS 809 859; CAMP Vehicle Safety Communication Consortium: Farmington Hills, MI, USA, 2005. [Google Scholar]
  5. Kenney, J.B. Dedicated short-range communications (DSRC) standards in the United States. Proc. IEEE 2011, 99, 1162–1182. [Google Scholar] [CrossRef]
  6. Wu, X.; Subramanian, S.; Guha, R.; White, R.G.; Li, J.; Lu, K.W.; Bucceri, A.; Zhang, T. Vehicular communications using DSRC: Challenges, enhancements, and evolution. IEEE J. Sel. Areas Commun. 2013, 31, 399–408. [Google Scholar] [CrossRef]
  7. Ligo, A.K.; Peha, J.M.; Ferreira, P.; Barros, J. Throughput and Economics of DSRC-based internet of vehicles. IEEE Access 2018, 6, 7276–7290. [Google Scholar] [CrossRef]
  8. Koziol, M. MWC Barcelona 2019: On the Road to Self-Driving Cars, 5G Will Make Us Better Drivers; IEEE Spectrum Press: New York, NY, USA, 2019. [Google Scholar]
  9. Căilean, A.; Dimian, M. Toward Environmental-adaptive visible light communications receivers for automotive applications: A Review. IEEE Sens. J. 2016, 16, 2803–2811. [Google Scholar] [CrossRef]
  10. Zadobrischi, E.; Cosovanu, L.; Avătămăniţei, S.; Căilean, A. Complementary Radiofrequency and Visible Light Systems for Indoor and Vehicular Communications. In Proceedings of the 2019 23rd International Conference on System Theory, Control and Computing (ICSTCC), Sinaia, Romania, 9–11 October 2019; pp. 419–423. [Google Scholar] [CrossRef]
  11. Căilean, A.-M.; Dimian, M.; Popa, V. Noise-Adaptive Visible Light Communications Receiver for Automotive Applications: A Step Toward Self-Awareness. Sensors 2020, 20, 3764. [Google Scholar] [CrossRef] [PubMed]
  12. Liang, Z.; Wakahara, Y. Real-time urban traffic amount prediction models for dynamic route guidance systems. Eurasip J. Wirel. Commun. Netw. 2014, 2014, 85. [Google Scholar] [CrossRef] [Green Version]
  13. Petrin, A. Quantifying the benefits of new products: The case of the minivan. J. Political Econ. 2002, 110, 705–729. [Google Scholar] [CrossRef] [Green Version]
  14. Huang, J.; Ye, J. Autonomous Detection for Traffic Flow Parameters of a Vehicle-Mounted Sensing Device Based on Symmetrical Difference. Symmetry 2020, 12, 72. [Google Scholar] [CrossRef] [Green Version]
  15. Song, T.-J.; Kim, S.; Williams, B.; Rouphail, N.; List, G. Crash Classification by Congestion Type for Highways. Appl. Sci. 2020, 10, 2583. [Google Scholar] [CrossRef] [Green Version]
  16. Zadobrischi, E.; Avătămănitei, S.; Căilean, A.; Dimian, M.; Negru, M. Toward a hybrid vehicle communication platform based on VLC and DSRC technologies. In Proceedings of the 2019 IEEE 15th International Conference on Intelligent Computer Communication and Processing (ICCP), Cluj-Napoca, Romania, 5–7 September 2019; pp. 103–107. [Google Scholar] [CrossRef]
  17. Narzt, W.; Wilflingseder, U.; Pomberger, G.; Kolb, D.; Hörtner, H.; Futurelab, A.E. Self-Organizing Traffic Control for Congestion Avoidance and Traffic Flow Improvement. In Proceedings of the 15th World Congress on Intelligent Transport Systems and ITS America’s 2008 Annual MeetingITS America ERTICOITS JapanTransCore, New York, NY, USA, 16–20 November 2008. [Google Scholar]
  18. Mahmassani, H. Dynamic network traffic assignment and simulation methodology for advanced system management applications. Netw. Spat. Econ. 2001, 1, 267–292. [Google Scholar] [CrossRef]
  19. Guo, J.; Huang, W.; Williams, B. Adaptive Kalman filter approach for stochastic short-term traffic flow rate prediction and uncertainty quantification. Transp. Res. Part C Emerg. Technol. 2014, 43, 50–64. [Google Scholar] [CrossRef]
  20. Wang, J.; Peeta, S.; He, X. Multiclass traffic assignment model for mixed traffic flow of human-driven vehicles and connected and autonomous vehicles. Transp. Res. Part B Methodol. 2019, 126, 139–168. [Google Scholar] [CrossRef]
  21. Howard, D.; Mark, B.; Martin, H. Neural Network Toolbox For Use with Matlab; The Math Works: Natick, MA, USA, 2007. [Google Scholar]
  22. Mahut, M.; Florian, M.; Tremblay, N. Evaluation of a simulation-based dynamic traffic assignment model in off-line use. In Proceedings of the 7th International IEEE Conference on Intelligent Transportation Systems, Washington, WA, USA, 3–6 October 2004; pp. 1028–1032. [Google Scholar] [CrossRef]
  23. Yang, X.; Luo, S.; Gao, K.; Qiao, T.; Chen, X. Application of data science technologies in intelligent prediction of traffic congestion. J. Adv. Transp. 2019, 2019, 2915369. [Google Scholar] [CrossRef] [Green Version]
  24. Harrod, S.; Cerreto, F.; Nielsen, O. OpenTrack simulation model files and output dataset for a Copenhagen suburban railway. Data in Brief 2019, 25, 103952. [Google Scholar] [CrossRef]
  25. Sliwa, B.; Liebig, T.; Vranken, T.; Schreckenberg, M.; Wietfeld, C. System-of-systems modeling, analysis and optimization of hybrid vehicular traffic. In Proceedings of the 2019 IEEE International Systems Conference (SysCon), Orlando, FL, USA, 8–11 April 2019; pp. 1–8. [Google Scholar]
  26. Lin, L.; Li, W.; Peeta, S. Efficient Data Collection and Accurate Travel Time Estimation in a Connected Vehicle Environment Via Real-Time Compressive Sensing. J. Big Data Anal. Transp. 2019, 1, 95–107. [Google Scholar] [CrossRef] [Green Version]
  27. Peeta, S.; Ziliaskopoulos, A.K. Foundations of dynamic traffic assignment: The past, the present and the future. Netw. Spat. Econ. 2001, 1, 233–265. [Google Scholar] [CrossRef]
  28. Tang, T.-Q.; Shi, W.-F.; Huang, H.-J.; Wu, W.-X.; Song, Z. A route-based traffic flow model accounting for interruption factors. Physica A 2018, 514, 767–785. [Google Scholar] [CrossRef]
  29. Papamichail, I.; Bekiaris-Liberis, N.; Delis, A.; Manolis, D.; Mountakis, K.-S.; Nikolos, I.; Roncoli, C.; Papageorgiou, M. Motorway traffic flow modelling, estimation and control with vehicle automation and communication systems. Annu. Rev. Control 2019, 48, 325–346. [Google Scholar] [CrossRef]
  30. Lobo, J.; Alberti, M.; Allen-Dumas, M.; Arcaute, E.; Barthelemy, M.; Tapia, L.; Brail, S.; Bettencourt, L.; Beukes, A.; Chen, W.; et al. Urban science: Integrated theory from the first cities to sustainable metropolises. SSRN Electron. J. 2020. [Google Scholar] [CrossRef]
  31. Barthelemy, M. Revisiting urban economics for understanding urban data. In Theories and Models of Urbanization; Springer: Cham, Switzerland, 2020; pp. 121–131. [Google Scholar] [CrossRef]
  32. Haferkamp, M.; Al-Askary, M.; Dorn, D.; Sliwa, B.; Habel, L.; Schreckenberg, M.; Wietfeld, C. Radio-based traffic flow detection and vehicle classification for future smart cities. In Proceedings of the 2017 IEEE 85th Vehicular Technology Conference (VTC Spring), Sydney, NSW, Australia, 4–7 June 2017; pp. 1–5. [Google Scholar]
  33. Guo, R.-Y.; Huang, H.-J. A discrete dynamical system of formulating traffic assignment: Revisiting Smith’s model. Transp. Res. C 2016, 71, 122–142. [Google Scholar] [CrossRef]
  34. Zheng, F.; Li, J.; van Zuylen, H.; Liu, X.; Yang, H. Urban travel time reliability at different traffic conditions. J. Intell. Transp. Syst. 2017, 22, 106–120. [Google Scholar] [CrossRef] [Green Version]
  35. Alshalalfah, B.; Kaysi, I.; Sayegh, A.; Shalaby, A. Performance measurement systems for public transport systems in mass events: Lessons learned from the Southern Masha’er rail system during the 2010 pilgrimage season. In Proceedings of the the 13th International Conference on Competition and Ownership in Land Passenger Transport (Thredbo), Oxford, UK, 15–19 September 2013. [Google Scholar]
  36. Liu, J.; Zheng, F.; van Zuylen, H.; Li, J. A dynamic OD prediction approach for urban networks based on automatic number plate recognition data. Transp. Res. Procedia 2020, 47, 601–608. [Google Scholar] [CrossRef]
  37. Zheng, F.; van Zuylen, H.; Liu, X.; Le Vine, S. Reliability-based traffic signal control for urban arterial roads. IEEE Trans. Intell. Transp. Syst. 2016, 18, 643–655. [Google Scholar] [CrossRef]
  38. Gong, S.; Zhou, A.; Peeta, S. Cooperative adaptive cruise control for a platoon of connected and autonomous vehicles considering dynamic information flow topology. Transp. Res. Rec. 2019, 2673, 185–198. [Google Scholar] [CrossRef]
  39. Mashayekhi, M.; List, G. A modular colored stochastic petri net for modeling and analysis of signalized intersections. IEEE Trans. Intell. Transp. Syst. 2015, 17, 701–713. [Google Scholar] [CrossRef]
  40. Liu, L.; Li, C.; Li, Y.; Peeta, S.; Lin, L. Car-following behavior of connected vehicles in a mixed traffic flow: Modeling and stability analysis. In Proceedings of the 2018 IEEE 8th Annual International Conference on CYBER Technology in Automation, Control, and Intelligent Systems (CYBER), Tianjin, China, 19–23 July 2018; pp. 1085–1088. [Google Scholar]
Figure 1. (a) propagation of traffic congestion after a short time with no artificial influences; (b) traffic congestion spread due to prolonged obstruction that leads to closed-loop formation.
Symmetry 12 01172 g001
Figure 2. Flow distribution of Suceava-University area roads.
Symmetry 12 01172 g002
Figure 3. Representation scheme of the intersection and flow cars and communication.
Symmetry 12 01172 g003
Figure 4. Congestion scenario 1—vehicle flow generated on 100/min, 30 s of red traffic light.
Symmetry 12 01172 g004
Figure 5. Congestion scenario 1—vehicle flow generated on 100/min, 90 s of red traffic light.
Symmetry 12 01172 g005
Figure 6. Congestion scenario 2—vehicle flow generated on 300/min, 30 s of red traffic light.
Symmetry 12 01172 g006
Figure 7. Congestion scenario 2—vehicle flow generated on 300/min, 90 s of red traffic light.
Symmetry 12 01172 g007
Figure 8. Congestion scenario—vehicle flow generated on 500/min, 30 s of red traffic light.
Symmetry 12 01172 g008
Figure 9. Congestion scenario 3—vehicle flow generated on 500/min, 90 s of red traffic light.
Symmetry 12 01172 g009
Figure 10. Congestion scenario 4—vehicle flow generated on 700/min, 30 s of red traffic light.
Symmetry 12 01172 g010
Figure 11. Congestion scenario 4—vehicle flow generated on 700/min, 90 s of red traffic light.
Symmetry 12 01172 g011
Figure 12. Traffic flow solution projection—three-dimensional representation.
Symmetry 12 01172 g012
Figure 13. Decongestion solution—traffic management systems, smart traffic light system.
Symmetry 12 01172 g013
Figure 14. Graphical results for smart traffic light systems for 12 h—without congestion.
Symmetry 12 01172 g014
Figure 15. Logic scheme for smart traffic light systems and vehicular network.
Symmetry 12 01172 g015
Table 1. Simulated scenario, total number of cars, and congestion rate.
12345Congestion Rate %
Scenario 1100591325366528
Scenario 2300605271573042
Scenario 3500685126761475
Scenario 470077548685
1—total numbers of cars; 2—traffic light 30 s; 3—traffic light 90 s; 4—traffic light 30 s, simulation 1 min; 5—traffic light 90 s, simulation 1 min.

