Abstract
In this paper, we present several numerical simulation results of dendritic pattern formation using an isotropic crystal growth model, which is based on phase-field modeling, on curved surfaces. An explicit time-stepping method is used and the direct computing method to the Laplace–Beltrami operator, which employs the point centered triangulation approximating Laplacian over the discretized surface with a triangular mesh, is adopted. Numerical simulations are performed not only on simple but also on complex surfaces with various curvatures, and the proposed method can simulate dendritic growth on complex surfaces. In particular, ice crystal growth simulation results on aircraft fuselage or metal bell-shaped curved surfaces are provided in order to demonstrate the practical relevance to our dendrite growth model. Furthermore, we perform several numerical parameter tests to obtain a best fitted set of parameters on simple surfaces. Finally, we apply this set of parameters to numerical simulation on complex surfaces.
1. Introduction
The beauty of nature’s crystals has led many researchers to investigate them over the past decades. From a physical point of view, crystal growth can be explained as a phase transition by heat transfer from a liquid phase to a solid phase. Accordingly, many researchers have experimented with forming dendritic patterns, a large amount of research results however are needed to find out the influence of the parameters of the explainable model so that, the analysis through computer simulation has been also actively conducted therefore. There are several methods that have been devised and developed to investigate dendritic pattern formation of crystals such as the front tracking method [1], Monte–Carlo simulation approach [2], the level set method [3], and the phase-field method [4,5,6]. In particular, the phase-field modeling, which captures the interface in explaining the dynamics when dendritic patterns are formed on surface, is a field that has been continuously studied. The phase-field method has been widely applied in numerical simulation of dendritic crystal growth model [7,8,9,10,11], however most literatures only consider the solidification of pure substances in undercooled melts in two- and three-dimensional spaces; not on curved surfaces. Using the phase-field method, for instance, the authors in [12] successfully simulate the crystal growth with an anisotropic diffusion scheme in two dimensional space. A highly nonlinear system combined with heat equation was proposed for numerical simulations of dendritic crystal growth model in [13] using a similar anisotropic scheme. Li et al. [14] propose the thermodynamic consistent model for the numerical approximation of energy and entropy conservation of crystal growth model, some numerical experiments of dendritic crystal growth are presented to demonstrate the accuracy of their proposed scheme. A phase-field crystallization model is proposed for the formation of dendrite morphology in the process of single component melt growth by Kobayashi [15]. In [5], a rescaling rule is presented for simulating dendritic growth in a two-dimensional domain at various undercoolings with an adaptive phase-field model and is also extended to the three-dimensional adaptive phase-field model. Lin et al. [16] compare the simulated equilibrium shapes of different anisotropic strengths with the exact solutions, and then further explore the dendrite growth of pure materials with different anisotropic strengths under different undercoolings. In the study of [17], robust and fast phase-field simulations of dendritic crystal growth are performed in both two- and three-dimensional spaces, their computational results are consistent with the numerical experiments.
Meanwhile, there are several researches that have focused on pattern formation and computation on surfaces. García et al. [18] focus on the mechanism of a crystal phase in two-dimensional curved space. Ren et al. [19] simulate the dendrite growth by introducing an orientation field which is the degree of freedom, the algorithm can generate arbitrary symmetric graphs with different degrees of asymmetric damage effects on arbitrarily curved surfaces.
In this paper, we present several numerical simulation results of an isotropic crystal growth model, which is based on phase-field approach, on curved surfaces with triangular discretizations. In order to compute numerically the surface diffusion operator, called the Laplace–Beltrami operator, we employ Xu’s approach [20], while there are several other approaches to calculate this operator [21,22]. Furthermore, a comparative study is conducted on the effect of parameters affecting dendritic pattern formation on simple surfaces. Subsequently, a fitted parameter set is employed to simulate the dendrite growth on complex surfaces. Especially, we provide the dendritic crystal growth simulations on aircraft body or metal bell-shaped surfaces. As these surfaces are used in real life, the aircraft de/anti-icing system is a very important problem in aerodynamics [23], and the process of growing ice crystals on metal surfaces is a common phenomenon.
2. Mathematical Model
The model of the crystal growth on a smooth closed surfaces in is derived from a Lyapunov function [24]. As the crystal growth phase-field model which is consisted with the anisotropic function has been studied in [17], and the model performed fast, robust, and accurate results of crystal growth for phase-field simulation whether in two or three-dimensional space. In this study, we use phase-field model to simulate the crystal growth without anisotropic function on surfaces. The solidification process is modeled by using the standard dimensionless phase-field equations [25] and is represented as follows:
In Equations (1) and (2), U is the temperature field, D is a constant which is defined by , where is the characteristic time, is the thermal diffusivity, and is the characteristic length. is the coupling parameter and is defined by [25]. The order parameter is 1 or in the solid phase or liquid phase, respectively. The interface of two phases is defined by . Note that all the parameters are dimensionless. For more details, refer to [25] and the references therein.
3. Numerical Solution
In this section, we apply the explicit Euler method to solve the crystal growth systems (1) and (2) on a smooth closed surface. At first, we present a discretization of Laplace–Beltrami operator [20,26] on the curved surfaces.
Figure 1a shows that M is a triangular surface mesh of given surfaces . The set with N points means the surface vertex set of M. Considering each surface vertex with index n, we define that is a set of surface vertex indices representing one-ring neighbors with (see Figure 1b). Here, is a triangle composed of three vertices , and as shown in Figure 1c. We write simply for convenience as and . Now, we consider the sum of triangles sharing the vertex and denote it by (see Figure 1d). is expressed as follows [20]:
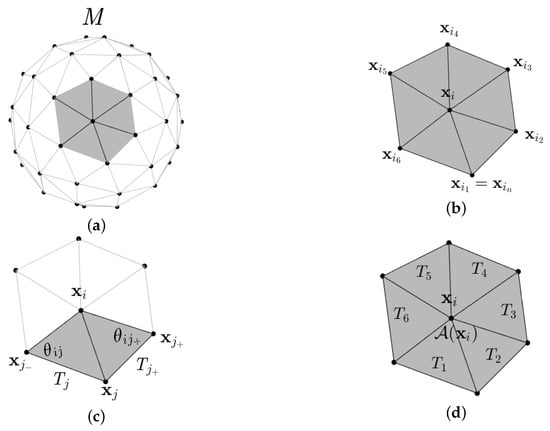
Figure 1.
Schematic illustrations of (a) triangulation of surface, (b) the surface vertices set of one-ring neighbors of with , (c) triangles and with the angles and , and (d) area at vertex .
Then, we get the following discretization systems of Laplace–Beltrami operator over given surface [26].
where and are angles in triangles and , respectively (see Figure 1c).
Let and , where is the time step size. Then the governing system is discretized as
4. Numerical Results
We perform computational experiments to show the efficiency and robustness of the proposed scheme on curved surfaces.
4.1. Crystal Growth on Sphere Surface
In this section, we test the crystal growth on a sphere. We take the condition for a sphere surface and the initial condition of sphere surface is defined in domain as follows.
and
where r is a given zero level set radius of the initial condition, represents the melting temperature of the pure material, and corresponds to the initial undercooling.
A satisfied evolution effect depends on the appropriate choice of parameters. In following simulations, it is important to set the time step size and mesh size appropriately. Then we first test to know the effect of and mesh size and decide proper two parameters in our simulations. One of the factors influencing crystal growth can be the curvature of the sphere. We study the effect of the curvature through the below test. In addition, to verify the robustness of the proposed scheme, we investigate the impact of the zero level set radius of the initial condition r, and the initial undercooling . Unless otherwise specified, we choose and . Then we perform various simulations on a set of and r.
4.1.1. Effect of Time Step Size
First, we confirm the effect of time step size and decide the appropriate for our simulations. Here, we set the initial radius , undercooling and use the same mesh size. Under these conditions, we select four time step size such as , and . As shown in Figure 2, the states of evolution look similar at same time. However, when and , the results of crystal show a bit less-growing than other two conditions, and Figure 2c,d show a satisfied performance. Therefore, we use as proper time step size for our simulations, while a smaller will take more computational cost.
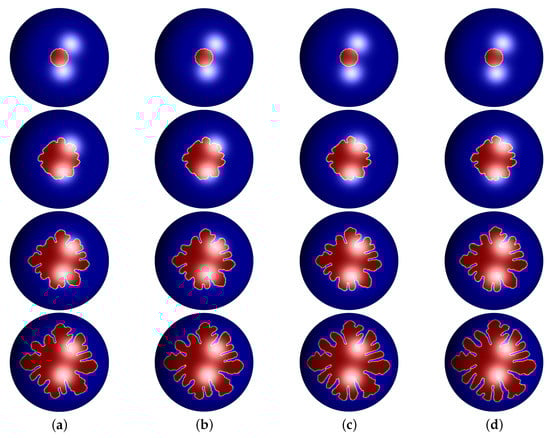
Figure 2.
Snapshots of the evolution of crystal growth on the sphere having different time step size with , and . (a) , (b) , (c) , and (d) . The evolution time from top to bottom are , , , , respectively.
4.1.2. Effect of Mesh Size
In the following test, we examine the effect of mesh size. Because our proposed scheme is to solve the Equations (1) and (2) on surface directly, the mesh size is decided by the average of edge length . We use DistMesh to represent the surface and decide the initial edge length h. Based on h, this algorithm finds optimized surface and each edge length varies widely after optimization. Then, we calculate the average of the varied edge length and denote by .
We take , , , , and and focus on the impact which the mesh size affects. We select four conditions for initial edge length such as and . Then we can get the average edge length and . Figure 3 shows snapshots of evolution states of crystal growth sources with different mesh size in surface at different time ( and ).
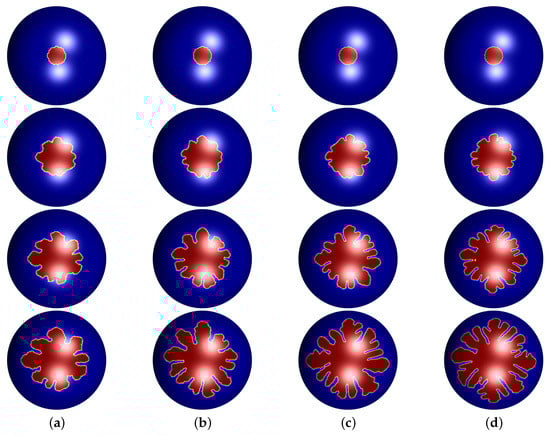
Figure 3.
Snapshots of the evolution of crystal growth on the sphere having different mesh size with and . (a) , (b) , (c) and (d) . The evolution time from top to bottom are , , , , respectively.
As depicted in Figure 3, various mesh sizes affect the growth of dendritic crystals. In other words, must be kept at a certain level in order to be relatively more suitable for dendrite pattern formation and to have similar dendrite tip velocities to actual physical phenomena. In particular, results of Figure 3c,d have a little difference in growth of crystal. This phenomenon indicates that the average edge length is sufficient for crystal growth simulation, which saves the computing resources. Based on the above simulations, we use and for following tests in this paper.
4.1.3. Effect of Curvature
Next we consider the effect of the curvature of sphere. It is known that the curvature of sphere depends on the radius. As you know, there is an inverse relation between the curvature and the radius R. That is, becomes larger when R is smaller and smaller when R is larger. The radius of sphere used on the above simulations is . In this test, we use varied radii of the sphere by and 200, and compare each result. Here, we use and without changing other parameters for the test.
As shown in Figure 4, from the perspective of visual effect, the states of dendritic crystals growth show almost no difference on the sphere surfaces. In other words, each crystal source on the sphere surface having different radius grows well under different curvatures. Therefore, we can conclude that the curvature has little effect on the growth of crystal on the object surface.
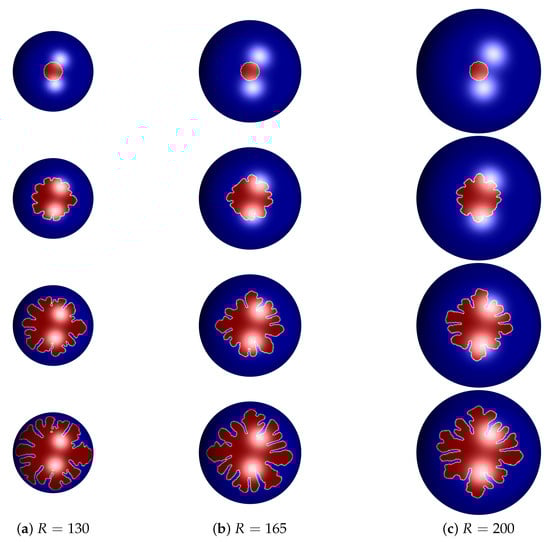
Figure 4.
Snapshots of the evolution of crystal growth on the sphere having different radius R with and . (a) , (b) , and (c) . The evolution time from top to bottom are , , , , respectively.
4.1.4. Effect of Undercooling Parameter
The initial undercooling affects on growth of crystal on surface. Therefore, we study the effect of and set three conditions of and . Setting the initial radius on the sphere, we compare results from different values of . Figure 5 shows the evolution of crystal growth on a sphere with different undercooling at different time ( and ).
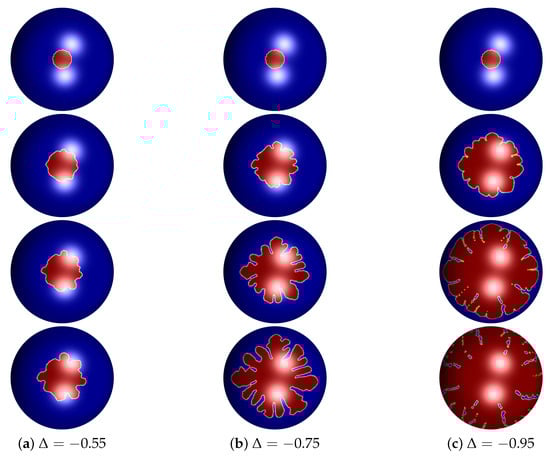
Figure 5.
Snapshots of the evolution of crystal growth on the sphere with same radius and different . (a) , (b) , and (c) . The evolution time from top to bottom are , , , , respectively.
As shown in Figure 5, we confirm the effect of easily. The bigger the value of , the slower the growth of crystal appears. Conversely, results using show more fast growth. These results with and are hard to call crystal as shown in Figure 5a,c. However, crystal which grew up using show the shape we want and we decide proper the value of .
4.1.5. Effect of Radius r
Now, we investigate the effect of radius r of the initial crystal growth source. Unchanging other parameters and conditions, we only set r differently. That is, we take three radius and 60, and simulate under .
Figure 6 shows states of crystal growth on sphere with different initial radius r over time ( and ). The difference among three results is clear. Figure 6a shows that crystal sources with are less grown and branches are less stretched. However, results using show that crystals grow and branches stretch more as shown in Figure 6c. From this test, we can see that when the initial radius r of the source is large, growth is fast and branches of crystal are extended further.
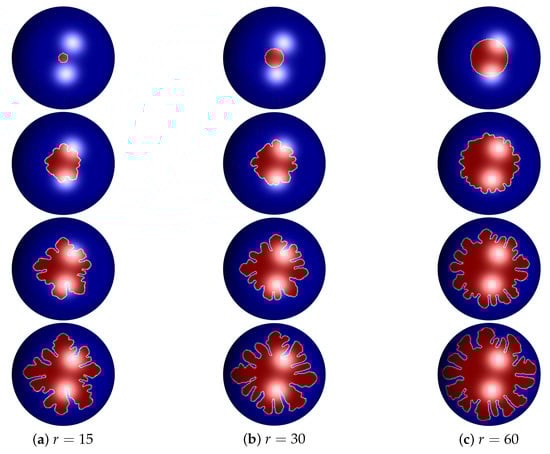
Figure 6.
Snapshots of the evolution of crystal growth on the sphere with undercooling and different r. (a) , (b) , and (c) . The evolution time from top to bottom are , , , , respectively.
Next, we observe the crystal growth states when sources are asymmetrically arranged on the sphere. As shown in Figure 7a, six crystal growth sources set asymmetrically on sphere surface. In addition, these sources are located the different positions and radius ( and 40). Parameters for this test are set as and . Figure 7b–d are snapshots of evolution of crystal growth sources which are arranged asymmetrically on sphere at and , respectively.
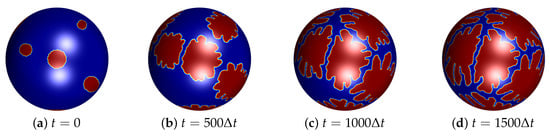
Figure 7.
Snapshots of the evolution of crystal growth on sphere: (a) , (b) , (c) , and (d) . The number of initial crystals is six and these are located asymmetrically.
4.2. Crystal Growth on Ellipsoid Surface
Asymmetrical arrangement of crystal sources is also applied on the ellipsoid surface. The initial condition of ellipsoid surface is defined in domain as follows.
where denotes the ellipsoid surface. Three sources having different radius ( and 45) are located at different positions on the ellipsoid surface. Parameters used for this test are the same with the above test and Figure 8 shows the initial condition of ellipsoid with three sources and snapshots of evolution of these crystal growth at and .
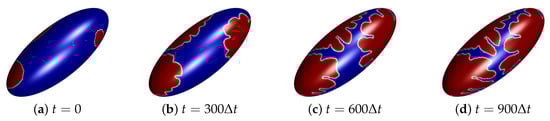
Figure 8.
Snapshots of the evolution of crystal growth on ellipsoid: (a) , (b) , (c) , and (d) . The number of initial crystals is three and these are located asymmetrically.
4.3. Crystal Growth on Torus Surface
At last, we perform the crystal growth process on the torus surface. Three sources with radius and 30 randomly distributed on the torus surface. Parameters used for this test are the same with the above test and Figure 9 shows the initial condition of torus with three sources and snapshots of evolution of these crystal growth at and . Through these simulations, our method can be applied not only to one crystal source on the surface, but many crystal sources that have different radius.
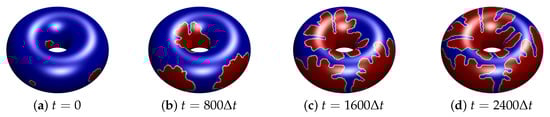
Figure 9.
Snapshots of the evolution of crystal growth on torus: (a) , (b) , (c) , and (d) . The number of initial crystals is three and these are located asymmetrically.
4.4. Crystal Growth on Complex Surface
In this section, we present the evolutions of Equations (4) and (5) on complex surface. For a concrete example, we adopt at first a point cloud data for an aircraft body to construct the discretized surface using a DistMesh function in MATLAB. Numerical simulation of the structure in which ice crystals form in the fuselage of airplane is a practically relevant experiment that can help in de/anti-icing it from aerodynamics [23]. The surface is bounded by . Similar to the above investigation cases, we manipulate the mean of spatial step size as close as possible to by multiplying the scaling factor. Figure 10 shows the evolutions of crystal growth on the surface of aircraft body and wings. Initial states of crystals on aircraft surface are set to be the most frequent parts in reality. Here, we use all the specific parameters are the same as above except for .
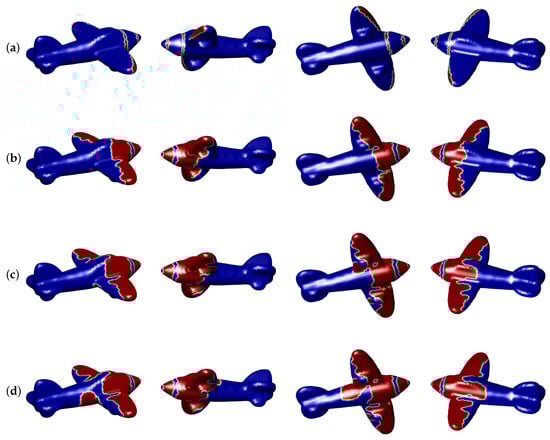
Figure 10.
Snapshots of the evolutions of crystal growth on the surface of aircraft body and wings. We use and . The evolution time at each row is (a) , (b) , (c) , and (d) , respectively. Note that each column in each row shows the isosurface from different angle at the same time.
For the next example, we perform the similar test to the metal bell-shaped surface. We fit the isosurface of the metal bell-shaped surface to . The cubic interpolation is used to make the signed distance function of the metal bell-shaped surface in MATLAB. Figure 11 shows snapshots of the evolutions of crystal growth on the metal bell-shaped surface. Here, we use , , and .
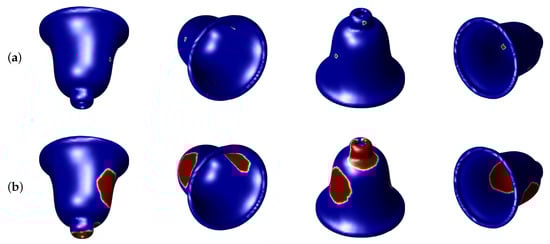
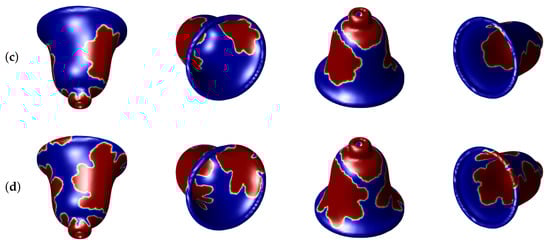
Figure 11.
Snapshots of the evolutions of crystal growth on the metal bell-shaped surface. We use , , and . The evolution time at each row is (a) , (b) , (c) , and (d) , respectively. Note that each column in each row shows the isosurface from different angle at the same time.
5. Conclusions
The dendritic pattern formation in crystal growth is an important topic and has a bunch of interesting applications in phase-field modelings. There are many studies related crystal growth simulation on two- and three-dimensional domains using phase-field modeling so far, we present the isotropic crystal growth simulation on curved surfaces in this paper. The Lyapunov function on smooth closed surfaces is the base of our mathematical model and the Laplace–Beltrami operator is evaluated directly on triangularly discretized surfaces M by using Xu’s approach [20]. The first-order time-stepping method is employed due to ease of implements. There are many parameters that affect the dendritic pattern formation in crystal growth, such as time step size , average mesh size , and undercooling parameter . We perform several numerical investigations to obtain a suitable set of parameters and choose , , as a default setting when a computational domain is contained in boxed region which is bigger than but smaller than approximately, because this set has shown that dendrite crystals are growing physically correctly over time and, further, it does not use excessive resources for computation. By using these parameters, we describe the snapshots of isotropic crystal growth on various curved surfaces. In particular, we provide dendrite growth simulations on physically and practically relevant shapes such as aircraft body and metal bell-shaped surfaces. In addition, simulation results that can be applied to the actual de/anti-icing problem are derived not only in the initial condition of the circular shape but also in the initial state of the curvilinear or rim shape. Because this model does not contain anisotropic cross derivatives, extending a mathematical model with anisotropic terms and computing the model directly on surfaces is left to one of our future works.
Author Contributions
Conceptualization: J.K.; Data curation: S.Y., J.P., J.W., and C.L.; Investigation: S.Y., J.P., J.W., C.L., and J.K.; Methodology: S.Y.; Project administration: J.K.; Software: S.Y., J.P., and J.W.; Validation: C.L.; Visualization: S.Y., J.P., J.W., and C.L.; Writing—original draft: S.Y., J.P., J.W., C.L., and J.K.; Writing—review & editing: J.K. All authors have read and agreed to the published version of the manuscript.
Funding
The author (J.W.) was supported by the China Scholarship Council (201808260026). The author (C.L.) was supported by Basic Science Research Program through the National Research Foundation of Korea(NRF) funded by the Ministry of Education(NRF-2019R1A6A3A13094308). The corresponding author (J.K.) expresses thanks for the support from the BK21 PLUS program.
Acknowledgments
All the authors appreciate the efforts of the editor and the reviewers of their helpful comments to this manuscript.
Conflicts of Interest
The authors declare no conflict of interest.
References
- Tryggvason, G.; Bunner, B.; Esmaeeli, A.; Juric, D.; Al-Rawahi, N.; Tauber, W.; Han, J.; Nas, S.; Jan, Y.J. A front-tracking method for the computations of multiphase flow. J. Comput. Phys. 2001, 169, 708–759. [Google Scholar] [CrossRef]
- Bihr, T.; Sadafi, F.Z.; Seifert, U.; Taylor, R.K.; Smith, A.S. Radial growth in 2d revisited: The effect of finite density, binding affinity, reaction rates, and diffusion. Adv. Mater. Interfaces 2017, 4, 1600310. [Google Scholar] [CrossRef]
- Gibou, F.; Fedkiw, R.; Caflisch, R.; Osher, S. A level set approach for the numerical simulation of dendritic growth. J. Sci. Comput. 2002, 19, 183–199. [Google Scholar] [CrossRef]
- Li, Y.; Luo, C.; Xia, B.; Kim, J. An efficient linear second order unconditionally stable direct discretization method for the phase-field crystal equation on surfaces. Appl. Math. Model. 2019, 67, 477–490. [Google Scholar] [CrossRef]
- Chen, C.C.; Lan, C.W. Efficient adaptive three-dimensional phase-field simulation of dendritic crystal growth from various supercoolings using rescaling. J. Cryst. Growth 2009, 311, 702–706. [Google Scholar] [CrossRef]
- Ghoneim, A.Y. A smoothed particle hydrodynamics-phase field method with radial basis functions and moving least squares for meshfree simulation of dendritic solidification. Appl. Math. Model. 2020, 77, 1704–1741. [Google Scholar] [CrossRef]
- Cartalade, A.; Younsi, A.; Plapp, M. Lattice Boltzmann simulations of 3D crystal growth: Numerical schemes for a phase-field model with anti-trapping current. Comput. Math. Appl. 2016, 71, 1784–1798. [Google Scholar] [CrossRef]
- Yang, X.; Han, D. Linearly first-and second-order, unconditionally energy stable schemes for the phase field crystal model. J. Comput. Phys. 2017, 330, 1116–1134. [Google Scholar] [CrossRef]
- Li, J.; Zhao, J.; Wang, Q. Energy and entropy preserving numerical approximations of thermodynamically consistent crystal growth models. J. Comput. Phys. 2019, 382, 202–220. [Google Scholar] [CrossRef]
- Zhao, Y.; Li, J.; Zhao, J.; Wang, Q. A linear energy and entropy-production-rate preserving scheme for thermodynamically consistent crystal growth models. Appl. Math. Lett. 2019, 98, 142–148. [Google Scholar] [CrossRef]
- Zhao, J.; Wang, Q.; Yang, X. Numerical approximations for a phase field dendritic crystal growth model based on the invariant energy quadratization approach. Int. J. Numer. Meth. Eng. 2017, 110, 279–300. [Google Scholar] [CrossRef]
- Meca, E.; Shenoy, V.B.; Lowengrub, J. Phase-field modeling of two-dimensional crystal growth with anisotropic diffusion. Phys. Rev. E 2013, 88, 052409. [Google Scholar] [CrossRef] [PubMed]
- Yang, X. Efficient linear, stabilized, second-order time marching schemes for an anisotropic phase field dendritic crystal growth model. Comput. Methods Appl. Mech. Eng. 2019, 347, 316–339. [Google Scholar] [CrossRef]
- Zhang, J.; Chen, C.; Yang, X. A novel decoupled and stable scheme for an anisotropic phase-field dendritic crystal growth model. Appl. Math. Lett. 2019, 95, 122–129. [Google Scholar] [CrossRef]
- Kobayashi, R. Modeling and numerical simulations of dendritic crystal growth. Physica D 1993, 63, 410–423. [Google Scholar] [CrossRef]
- Lin, H.K.; Chen, C.C.; Lan, C.W. Adaptive three-dimensional phase-field modeling of dendritic crystal growth with high anisotropy. J. Cryst. Growth 2011, 318, 51–54. [Google Scholar] [CrossRef]
- Li, Y.; Lee, H.G.; Kim, J. A fast, robust, and accurate operator splitting method for phase-field simulations of crystal growth. J. Cryst. Growth 2011, 321, 176–182. [Google Scholar] [CrossRef]
- García, N.A.; Register, R.A.; Vega, D.A.; Gómez, L.R. Crystallization dynamics on curved surfaces. Phys. Rev. E 2013, 88, 012306. [Google Scholar] [CrossRef]
- Ren, B.; Huang, J.; Lin, M.C.; Hu, S.M. Controllable dendritic crystal simulation using orientation field. Comput. Graph. Forum 2018, 37, 485–495. [Google Scholar] [CrossRef]
- Xu, G. Discrete Laplace–Beltrami operators and their convergence. Comput. Aided Geom. Des. 2004, 21, 767–784. [Google Scholar] [CrossRef]
- Güler, E.; Hacısalihoğlu, H.H.; Kim, Y.H. The Gauss map and the third Laplace–Beltrami operator of the rotational hypersurface in 4-space. Symmetry 2018, 10, 398. [Google Scholar] [CrossRef]
- Lee, H.G. Numerical simulation of pattern formation on surfaces using an efficient linear second-order method. Symmetry 2019, 11, 1010. [Google Scholar] [CrossRef]
- Thomas, S.K.; Cassoni, R.P.; MacArthur, C.D. Aircraft anti-icing and de-icing techniques and modeling. J. Aircr. 1996, 33, 841–854. [Google Scholar] [CrossRef]
- Langer, J.S. Directions in Condensed Matter Physics; World Scientific: Singapore, 1986; pp. 164–186. [Google Scholar]
- Karma, A.; Rappel, W.J. Phase-field method for computationally efficient modeling of solidification with arbitrary interface kinetics. Phys. Rev. E 1996, 53, 3017–3020. [Google Scholar] [CrossRef]
- Meyer, M.; Desbrun, M.; Schröder, P.; Barr, A.H. Discrete Differential-Geometry Operators for Triangulated 2-Manifolds. In Visualization and Mathematics III; Springer: Berlin, Germany, 2003; pp. 35–57. [Google Scholar]
© 2020 by the authors. Licensee MDPI, Basel, Switzerland. This article is an open access article distributed under the terms and conditions of the Creative Commons Attribution (CC BY) license (http://creativecommons.org/licenses/by/4.0/).