Article

Symmetric Potentiometric Cells for the Measurement of Unified pH Values

by
Agnes Heering
1,2,*,
Daniela Stoica
3,
Filomena Camões
4,
Bárbara Anes
4,
Dániel Nagy
5,
Zsófia Nagyné Szilágyi
5,
Raquel Quendera
6,
Luís Ribeiro
6,
Frank Bastkowski
1,
Rasmus Born
2,
Jaak Nerut
2,
Jaan Saame
2,
Silvie Lainela
2,3,
Lokman Liv
7,
Emrah Uysal
7,
Matilda Roziková
8,
Martina Vičarová
8,9,
Alan Snedden
10,
Lisa Deleebeeck
10,
Valentin Radtke
11,
Ingo Krossing
11 and
Ivo Leito
2,*
add Show full author list remove Hide full author list
1
Physikalisch-Technische Bundesanstalt (PTB), Bundesallee 100, 38116 Braunschweig, Germany
2
Institute of Chemistry, University of Tartu (UT), 14a Ravila Street, 50411 Tartu, Estonia
3
Laboratoire National de Métrologie et d’Essais (LNE), 1 Rue Gaston Boissier, 75015 Paris, France
4
FCiências. ID (FC.ID), Centro de Química Estrutural, Faculdade de Ciências da Universidade de Lisboa, Campo Grande, 1749-016 Lisboa, Portugal
5
Government Office of the Capital City Budapest (BFKH), Németvölgyi út 37-39, 1124 Budapest, Hungary
6
Instituto Português da Qualidade (IPQ), R. António Gião, 2, 2829-513 Caparica, Portugal
7
The Scientific and Technological Research Council of Turkey–National Metrology Institute (TUBITAK UME), Gebze Campus, Gebze 41470, Turkey
8
Czech Metrology Institute (CMI), Okružní 31, 63800 Brno, Czech Republic
9
Slovak University of Technology, Faculty of Mechanical Engineering, Namestie Slobody 17, SK-81231 Bratislava 1, Slovakia
10
DFM A/S, Kogle Allé 5, 2970 Hørsholm, Denmark
11
Institut für Anorganische und Analytische Chemie, University of Freiburg, Albertstr. 21, 79104 Freiburg, Germany
*
Authors to whom correspondence should be addressed.
Symmetry 2020, 12(7), 1150; https://doi.org/10.3390/sym12071150
Submission received: 29 May 2020 / Revised: 30 June 2020 / Accepted: 2 July 2020 / Published: 9 July 2020
(This article belongs to the Special Issue Symmetry in Acid-Base Chemistry)

Abstract

:
A unified pH scale of absolute values (pHabs scale) enables the comparison of acidities in different solvents. To date, very few different experimental setups have been used for the measurement of values on this scale. The article describes the design and performance of the different symmetric cells used for unified pH measurement by several institutions. Well-established and reliable standard aqueous buffer solutions are the first step of method validation necessary to achieve a robust metrological level for more complex media. The pH of aqueous standard buffers was measured by differential potentiometry, where the potential between two glass electrodes is measured directly. All the tested electrochemical cells prove to be suitable for unified pH measurements. This validation highlights that the method is, to a large extent, independent of the used equipment, including the cell geometry. The inherent symmetry of the cell design helps to reduce the experimental workload and improve the accuracy of obtained results.

Graphical Abstract

1. Introduction

pH is a measure of acidity. pH in a given solvent, termed pHS, is defined [1] through the activity of the solvated H+ as follows:
pH S = lg   a H + , S = lg (   m H +   γ H + , S m )
  a H + , S is the relative activity [2] of the solvated proton in the solvent S in the molality scale,   m H + is the proton molality,   γ H + , S is the activity coefficient of the proton in the molality scale and m = 1 mol kg−1 is the standard molality. An individual pHS scale is defined solely for a given solvent due to the dependence of the standard state on the solvent properties.
Potentiometry is a method used in electroanalytical chemistry [3] that links the measured potential, E, of a chosen cell to the activity of a chemical species of interest via the Nernst equation. Thus, potentiometry is ideal for the measurement of pH and is the de facto standard technique for this task. The primary pH measurement method [1] uses the hydrogen gas electrode as the H+-sensitive indicator electrode for the assignment of pH values to reference solutions. In contrast, the glass electrode, with an aqueous gel layer on the glass surface, highly selective to H+, is the most widespread sensor for secondary and routine pH measurements. Either of these electrodes are typically used in asymmetric cells where the potential of the indicator electrode (H+-sensitive) is measured against a reference electrode (cell I).
(I)   Indicator electrode|Solution 1|Salt bridge|Solution 2|Reference electrode.
The indicator electrode is sensitive to the analyte ion (H+ in this case), while the reference electrode is not sensitive to the composition of the tested solution and has constant potential. The reference electrode is usually a silver–silver chloride electrode in a potassium chloride (KCl) solution with constant concentration (typically ≥ 3.5 mol dm−3), responding to chloride ion, Cl. A double liquid junction established by a salt bridge between both sample and reference solutions, completes the cell [4]. Such electrochemical cells are acknowledged to work well in aqueous solutions.
Potentiometry in non-aqueous solvents has several limitations [4], compared to water, e.g., the scarcity of suitable electrodes, both indicator and reference, with steady and reproducible potentials and the unknown size of the potential drop at the liquid junction(s). In the case of pH measurements, there is also a shortage of calibration standards [5,6,7,8,9,10,11,12,13].
Nevertheless, pH measurements in nonaqueous solutions have been attempted, and there are reported values. However, since the definition links pH in a given solvent to a standard state defined for that specific solvent [1], values obtained in different solvents cannot be compared. The shifts in the standard states of the different solvents are not well-established and, consequently, pH values measured in different solvents are not comparable when using the established methodologies [5,6,7,8,9,10,11,12,13]. There exist several acidity functions [14], but these still suffer from the same incomparability problem.
In contrast, acidities in different solvents, measured according to the recently introduced methodology that leads to a unified acidity scale of absolute pH values (pHabs scale) [15], can be compared. For this scale, the standard state is universal and is not linked to any individual solvent: it is defined as the theoretically well-described ideal proton gas at 1 bar and 298.15 K. This proton gas is taken as the standard state (zero point) of the scale and every solvent or their mixtures are linked to this standard state via the Gibbs energy of solvation of the proton. The pHabs values are subsequently shifted by a constant value to align the actual pHabs values with the conventional pH values of the aqueous pH scale, obtaining the so-called pH abs H 2 O values [16]:
pH abs H 2 O = Δ s o l v G ( H + , S ) R T ln 10 + pH S + Δ s o l v G ( H + , H 2 O ) R T ln 10  
where R is the molar gas constant, T is the absolute temperature and Δ solv G ( H + , S ) is the Gibbs energy of solvation of the proton in the solvent. This equation can be simplified with the help of Gibbs energy of transfer ( Δ tr G ) from water to solvent S to
pH abs H 2 O = Δ tr G ( H + , H 2 O S ) R T ln 10 + pH S
The unified acidities are measured via comparisons of pH abs H 2 O values of two solutions, thus obtaining Δ pH abs H 2 O values between the two solutions. When one of the solutions is a standard solution (e.g., an IUPAC (International Union of Pure and Applied Chemistry) standard pH buffer) with a known pH abs H 2 O value, then the pH abs H 2 O   value of the second one can be easily obtained from the measured Δ pH abs H 2 O .
The technique used for such measurements is differential potentiometry, measuring directly the potential between two glass electrodes immersed in the two solutions that are under comparison [16]. This approach eliminates the need for reference electrodes, but the two liquid-junction potentials (LJPs) [17] remain, although the double junction tends to minimize their contribution, through a residual value (RLJP), to the cell potential. The following symmetric cells are used:
(II)   Glass electrode 1|Solution 1|Salt bridge|Solution 2|Glass electrode 2.
       LJP1     LJP2
The salt bridge (SB) is intended to balance the charge between the half-cells. If the electroactive species, the proton in case of pH measurements, and its counterion were to balance the charge, their activities in the half-cells would change significantly, thus falsifying the measurement result. However, at each SB–solution interface, a LJP occurs (LJP1 and LJP2 in cell II). With the ideal salt bridge, the two LJPs cancel each other, i.e., the potential drop caused by LJPs between the half cells is zero [18]. The ideal salt bridge is symmetrical by nature. This is true for its geometry, i.e., the structures of the liquid–liquid junctions to each half-cell must be the same. This, however, is especially true for its chemical composition. The charge balance must be equally shared by both types of ions, positively and negatively charged, and the change in their chemical potentials must be equal during the process of charge balancing [19].
Conventional SBs contain dissolved electrolytes, i.e., in addition to the ions of the electrolyte, they contain a solvent. Measuring cells with different solvents in each half-cells has the disadvantage that solvent–solvent interactions at either (or even both) LJP1 or LJP2 interfaces occur between the different solvents. This affects the magnitude of the LJP contribution to the cell potential and thus inevitably breaks the symmetry. The consequence is that conventional SBs are unsuitable for potentiometric measurements between different solvents.
Ionic liquids (IL) are salts that are liquid at room temperature. They do not contain any solvents and are therefore, in principle, suitable for building an ideal SB (see below) and, by extension, an ideal ionic liquid salt bridge (ideal ILSB). Since the charge balance must be symmetrical, it follows for 1:1 IL that the transfer numbers (t) of cations and anions of IL must be t+ = t = 0.5 in the whole cell, i.e., in the neat IL as well as in both half-cells. Any deviation from 0.5 leads to not completely canceling LJPs. If the deviation is small in comparison to other effects, then the SB can be recognized as “ideal”.
The first measurement cell on the way to experimental realization of the pH abs H 2 O scale was made from long Pasteur pipettes, a glass T-piece and silicone tubes (Figure 1A) [16]. The same cell was tested in a flow-through setting without a salt bridge electrolyte.
(III)   Glass electrode 1|Solution 1|Solution 2|Glass electrode 2
     LJP
In the flow-through setting (cell III), there was a direct junction between the test solutions that were constantly renewed. This design meant that there was a single liquid junction with no LJP minimization or cancellation. The LJP estimation was complicated even for the standard aqueous buffers with the (simplified) Henderson equation [4] due to the lack of literature data. Its estimation is even more complicated when solutions 1 and 2 are made in different solvents. Adding a conventional SB cancels the LJPs in the case of symmetrical cells (II), i.e., when there are very similar solutions (essentially made in the same solvent) on both sides. In other cases, a salt bridge helps to reduce the RLJP. If a SB has a sufficiently concentrated electrolyte solution (0.05 mol dm−3 tetraethylammonium perchlorate solution in acetonitrile was used), only the SB electrolyte can be considered in the estimation, which simplifies the calculations [4].
Reproducibility of the results was improved by making the salt bridge using a single piece of glass (Figure 1B) [20]. A salt bridge support made of polytetrafluoroethylene (PTFE) was tested, but it was found unsuitable. It was difficult to remove bubbles that formed during the filling of the bridge, and electrical contact was lost.
The salt bridge electrolyte was eventually switched from a salt solution to an ionic liquid [21]. Since the densities of ionic liquids are higher than most of the solutions intended to be measured, the salt bridge was redesigned from “above the measurement compartments” to “below the measurement compartments”, i.e., the bottom capillary connection (See Figure 1). An ionic liquid salt bridge can also be above the solutions [22,23].
Figure 1. Cells used at University of Tartu (UT) with the salt bridge above (A and B) and below (C,D,E) the measurements compartments. (A) Cell used in [16], (B) cell used in [20], (C) cell used in [21], (D) cell used in 2018 and in [24] and (E) cell used in 2020. Arrows show the positions of the used auxiliary electrode in (AC,E). Differences in cells are given in Table A1.
Symmetry 12 01150 g001
Recently [22,23,25], it was shown that for measurements of ΔtrG (Ag+, S1→ S2) between solutions made in different solvents, by using an “ideal” ILSB, the LJP is eliminated within the consistency standard deviation (see Appendix A) corresponding to ~ 0.1 pH units. This standard deviation accounts for other variabilities besides the LJP, thus, LJP’s contribution is less than 0.1 pH units. Using the same system and methodology, but in the case of two solutions made in the same solvent, the LJP can be considered eliminated within the smaller consistency standard deviation. The IL used in these experiments show that the indicated degree of ideality is triethylpentylammonium bis (trifluoromethanesulfonyl) imide [N2225][NTf2].
Such symmetric setups have already found use for pH abs H 2 O measurements in nonaqueous solutions [21] and aqueous-organic mixtures [16,20,24]. However, comprehensive validation of their performance and investigation of influencing factors has not been carried out.
This work aims to fill the above-mentioned gap by describing the design and performance of a number of different symmetric cells used for unified acidity measurement in different research groups. The influence of cell geometry, measuring instruments, deviation from ideal symmetry, etc. were investigated. In order to obtain quantitative information about the performance of the setups at different laboratories, an interlaboratory comparison was completed in standard aqueous buffers, for which there are pH reference values.
The traceability and method validation are central issues for ensuring that the method is robust enough for wider adoption of the concept in the field and routine applications. For this, we firstly identify the influencing parameters with well-known and characterized solutions. Secondly, we validate the method through an interlaboratory comparison before applying the method to more complex systems. This working plan will enable discrimination between the influences coming from the sample and those from the pH abs H 2 O setup.

2. Materials and Methods

The used ionic liquid [N2225][NTf2] was synthesized at the Krossing group of the University of Freiburg and at Iolitec GmbH (Heilbronn, Germany). The IL was used in all measurements, except in case of one set of UT measurements and measurements presented in [16,20], where saturated aqueous KCl was used. Metal solid contact glass electrodes ECT-0601 (Izmeritelnaya tekhnika, Moscow, Russia) were used. Standard aqueous pH buffers were used for validation (Table 1).
Information on the glass cells is given in Table 2, and photos of the used equipment are shown in the Supplementary Materials. All cells used now have a bottom capillary connection for the salt bridge between the two compartments containing the solutions to be compared. Published procedures [16,21] were used as a starting point for procedure development and were adapted for every setup. Glass electrodes were calibrated in aqueous standard buffers and a pair with similar characteristics was chosen. If similar electrodes could not be paired, then the difference between electrodes was taken into account. The used pH meters need an auxiliary Pt electrode to work in differential potentiometry mode; otherwise, they cannot measure the potential between two glass electrodes. The position of the auxiliary electrode is not important as it can be placed anywhere in the cell. In Figure 1A the auxiliary electrode is a separate Pt electrode placed in the middle of the salt bridge. In Figure 1B,C, it is an Pt wire in the middle, and in (E), it inserted from the right inlet.
Glass electrodes have high resistance, typically of the order of hundreds to thousands of MΩ, and, therefore, the minimum input impedance of the instrument must be orders of a higher magnitude, preferably ≥ 1013 Ω. Below this value, reliable measurements cannot be made. Several instruments (Table 3) were used for unified acidity measurements. If the input impedance is too low, actions can be taken to increase it, for example, the use of an impedance converter.
The “ladder” approach, so-called because of the ladder-like schemes formed by the pH values and their differences [16], is used to assign unified pH values ( pH abs H 2 O ) to the measured solutions based on measured Δ pH abs H 2 O values between different combinations of the solutions in the cell. The pH abs H 2 O values are calculated by applying a least-squares minimization technique to the measured Δ pH abs H 2 O values. The consistency standard deviation of the pH ladder is used to evaluate the mismatch between the measured Δ pH abs H 2 O and the assigned pH abs H 2 O values. Standard aqueous pH buffers (in an aqueous solution of pH = pH abs H 2 O by definition) were used for validation, and buffer with a pH ≈ 7 was used as an anchor point (fixed reference pH value) of the pH ladder. A longer explanation of the ladder approach is given in the Appendix A.

3. Results

3.1. Ideal Symmetrical Conditions

The symmetry of the system can be tested by measuring the same buffer in both compartments as in Figure 2, with a stable signal obtained rapidly after around 10 min. The data shown in all the figures are from a specific setup, but similar results were obtained with other setups. The measured signals deviate from zero, and while the deviation depends partly on the chosen buffer, it is mostly a consequence of the difference between the electrodes. The reason is most probably the difference of slopes of glass electrodes used—this is why the potential difference depends on pH, i.e., on the used buffer solution.

3.2. Influence of the Bubbles

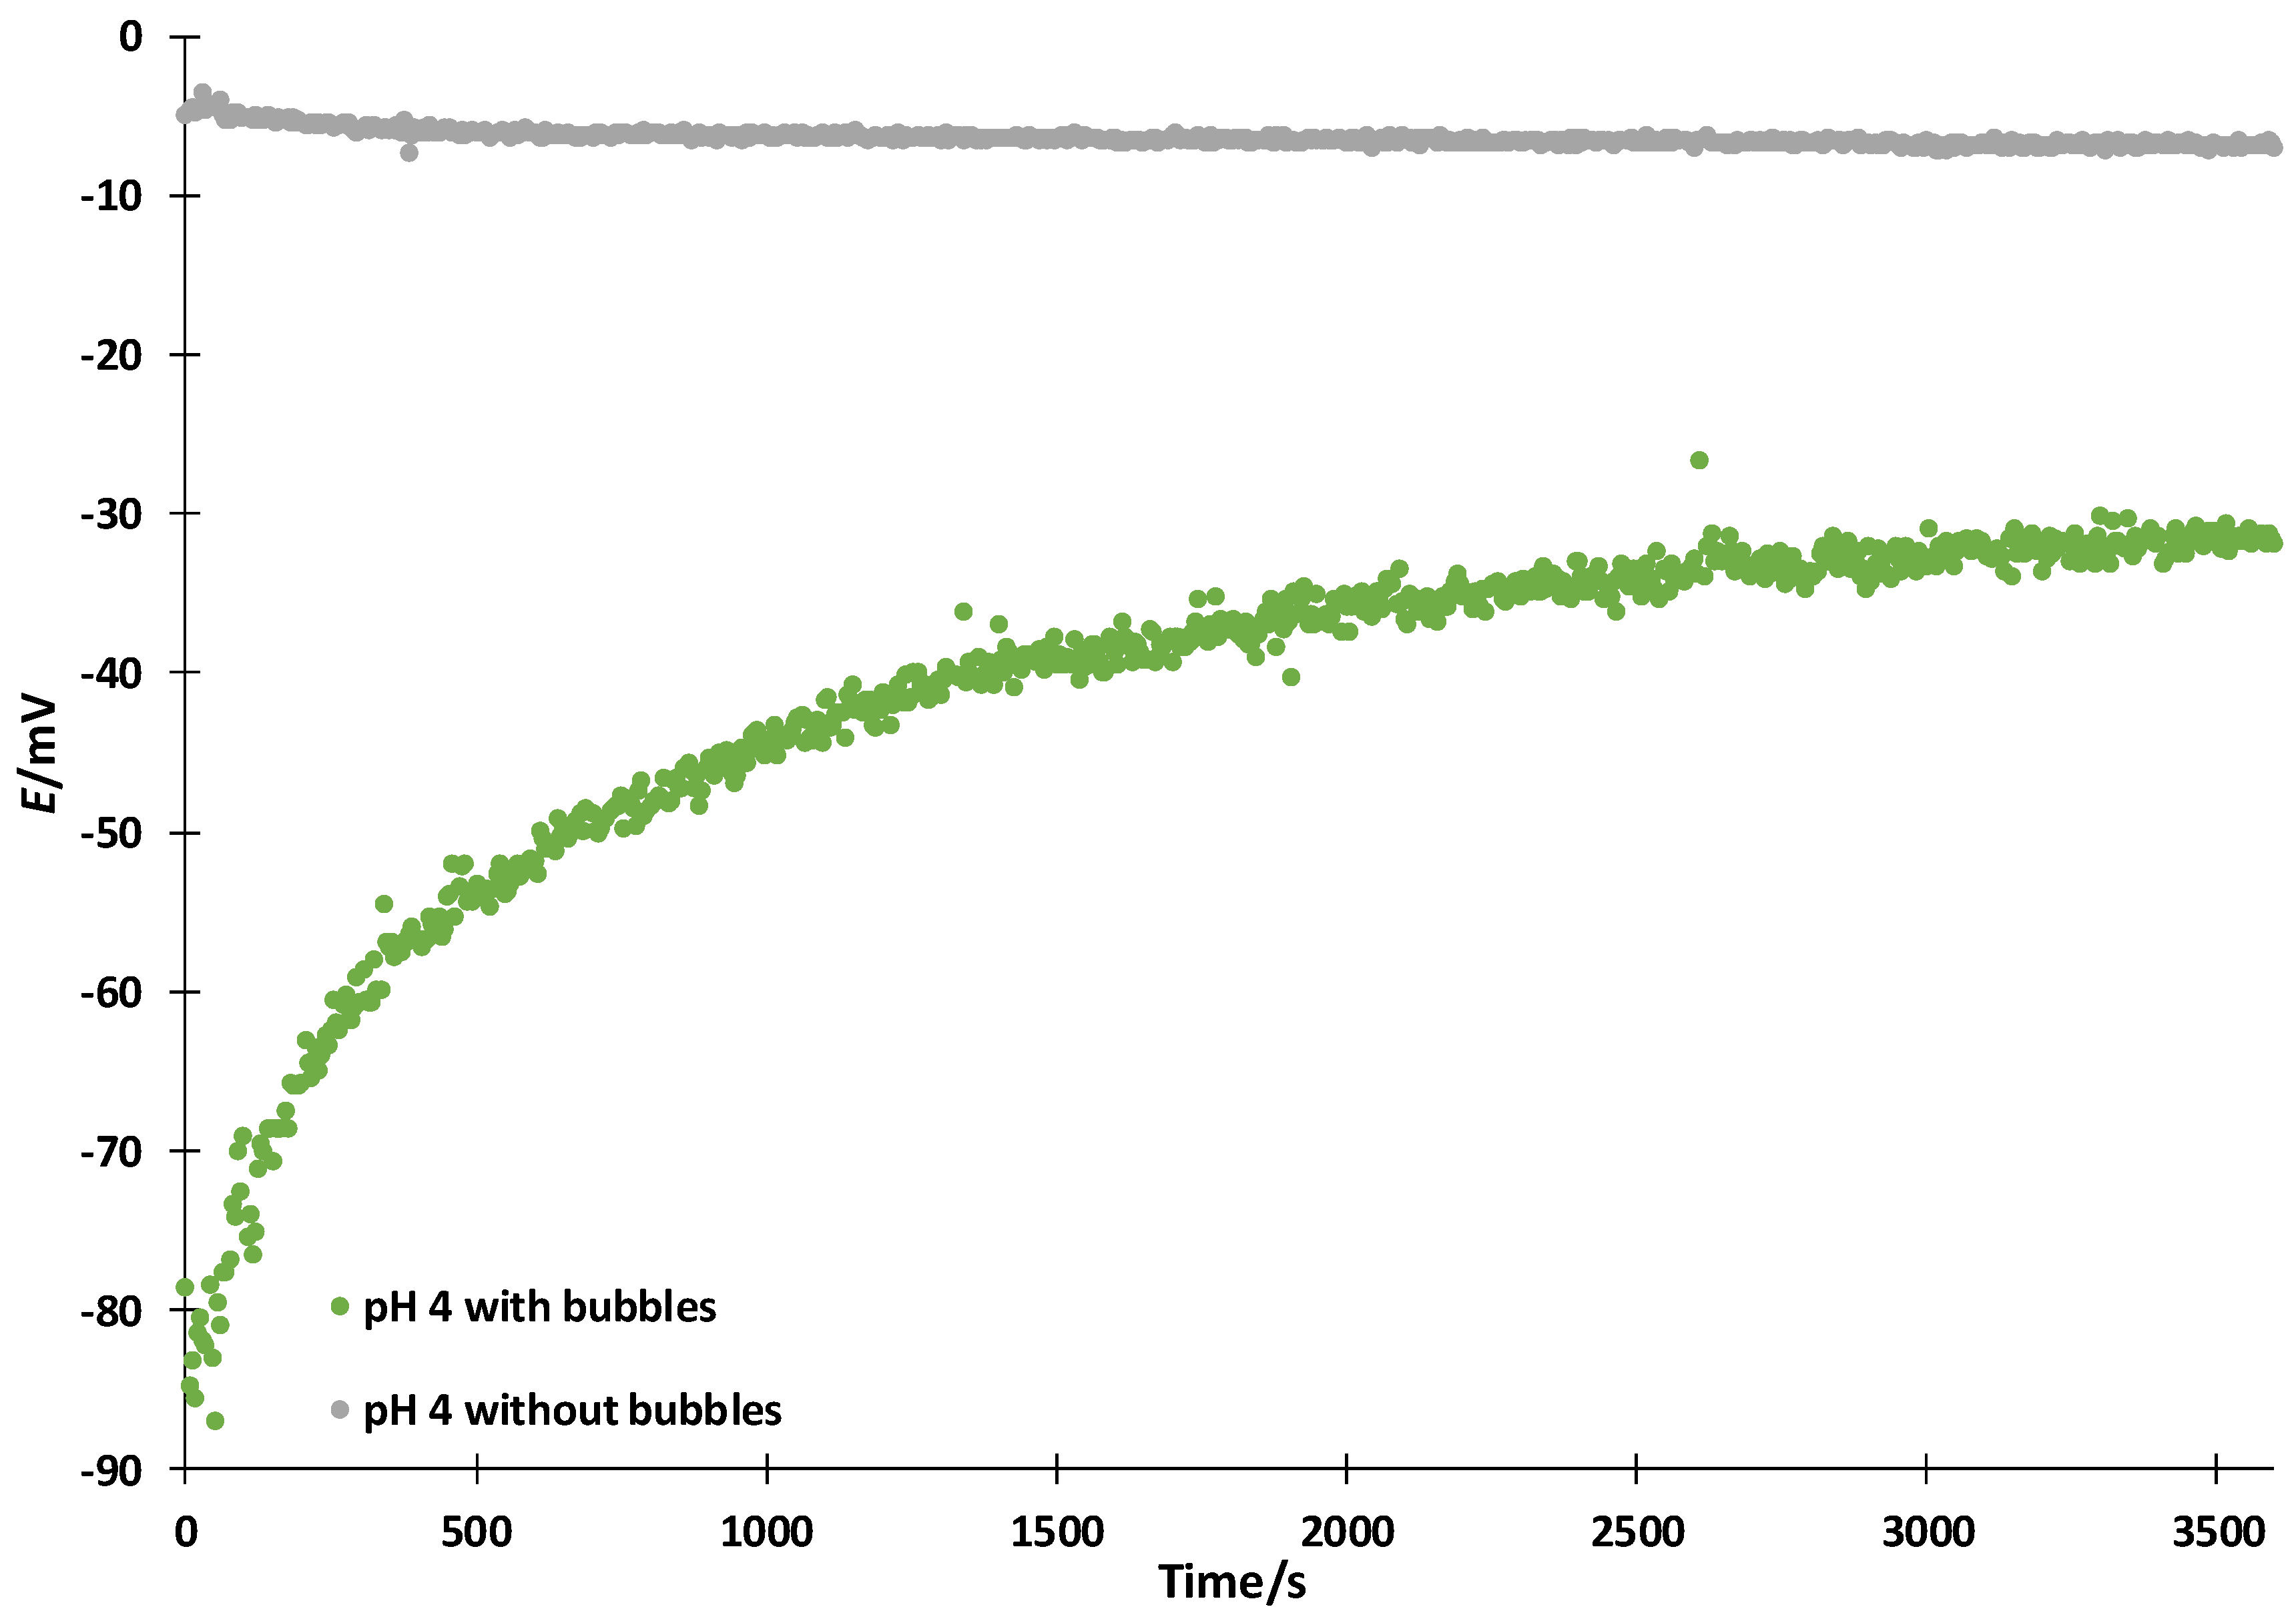
In practice, when the half cells are being filled with aqueous solutions, bubbles may appear at one or both junctions. They are caused by trapped air when filling the capillary or by some amount of air dissolved in liquids in the filling system. Due to the narrowness of the capillaries, even a very small-volume bubble can produce a relatively large impact on the measured potential. If these bubbles are not removed, the measured potential difference could be seriously affected Figure 3. Here again, the potential between the electrodes immersed in the same buffer on both sides is measured. In the presence of the bubbles at the interface between IL and the solution(s), the system needs a longer time to reach a stable potential, and sometimes the potential corresponding to situation without bubbles is never achieved. This problem can be avoided by carefully checking the junctions before measurements and removing the small bubbles if there are any.
The measured potential difference is 23 mV larger (corresponding to 0.4 pH units) after 1 h of measurement when bubbles were detected at the interface between IL and the solution(s), than when no bubbles were present.

3.3. Influence of the Instrument Used to Measure the Potential Difference: Potentiostat vs. pH Meter

The influence of the instrument used to measure the potential difference is not easy to investigate since the institutes have often only one system within their facilities. For the present study, all the partners have pooled their data to see if there is any advantage in using a potentiostat or electrometer instead of a pH meter with differential input. Potentiostats are more expensive but have increased functionality.
Potentiostats and electrometers have one notable advantage compared to the model 713 pH meter (two partners have this type of instrument) for unified pH measurements—it is much easier to detect potential measurement artifacts. The model 713 pH meters are slow devices, thus, in the case of electrodes with very high impedance, they pick up noise from the environment. As a result, even with the differential amplifier, it is possible to obtain biased reading (up to 80 mV from expected). Though the reading obtained can be very stable, they show a variation of less than 3 mV a during 15° min period. With a potentiostat, it is possible to obtain data at high frequency (e.g., every 10° ms) and, in some cases, it is possible to see large potential oscillations of up to several hundred mV. The oscillations represent the mains electricity noise (~50 Hz). High frequency measurements can be used to measure the noise levels. This helps to find the noise source and reduce the noise level. For example, another instrument used in the lab can increase the noise level. The oscillations cannot be seen at low-frequency data collection. The oscillations are cancelled out during averaging, but the noise is not constant. This leads to the above-mentioned large differences in measured values. For comparison, the current PTB setup without a Faraday cage has a noise of around 30 mV.
The measurements with aqueous standard buffers made at UT in 2020 are presented as an exemplary pH ladder in Figure 4. Every ladder has as minimum of three buffers and the number of single measurements made varies.
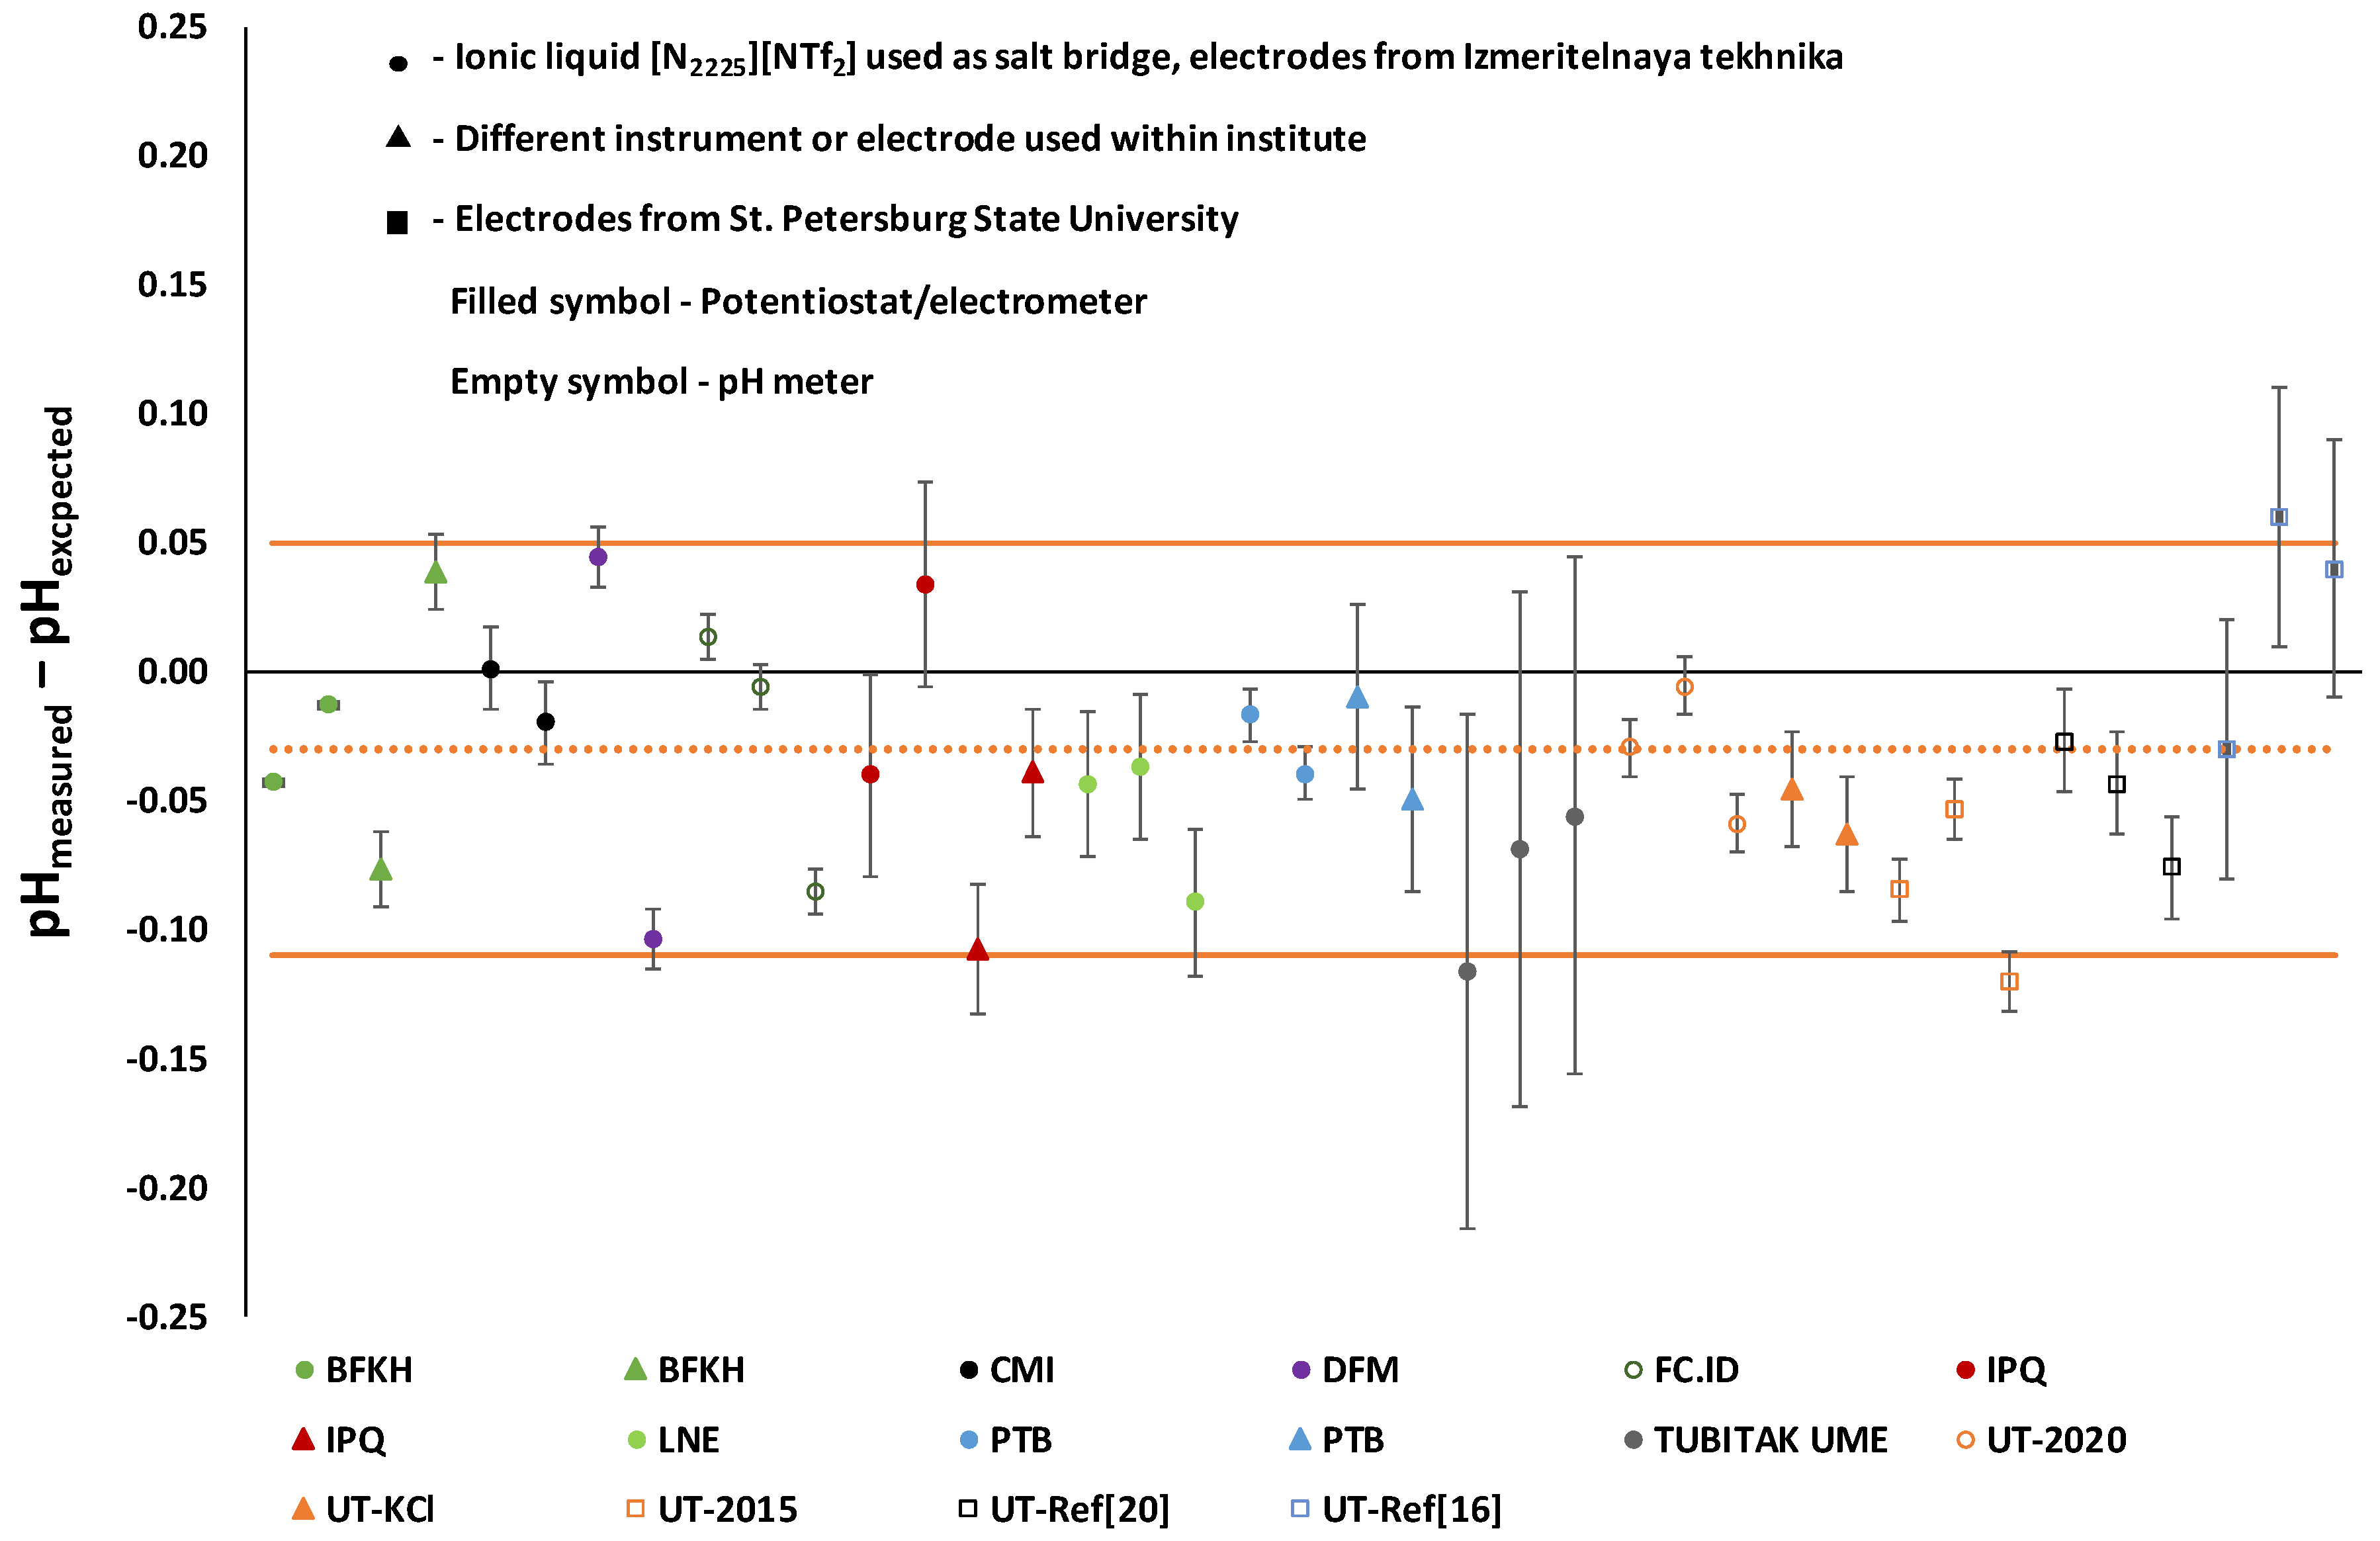
Data from all obtained pH ladders were combined into Figure 5. The results from the first experimental realization [16] and unpublished validation results of the setup used in [20] are added for comparison. Both were performed using a saturated aqueous KCl salt bridge. In addition, some unpublished results from 2015 were added and measured with the same instrument as in FC.ID and UT in 2020, but with different cells. All measurements were made with Metrohm 713 pH meters and a [N2225][NTf2] salt bridge.
The consistency standard deviations of the obtained pH ladders are given in Table 4. Here, the standard deviation is smaller than the LJP cancellation assumption (approximately 0.1 pH units) between different solvents.
An evaluation-type analysis of variance (ANOVA, one-factor analysis of variance) was made to test the effect of the instrument type used to measure the difference in potential between the electrodes. It was assumed that the difference between measured and expected ΔpH values (pH) has a normal distribution. The two types of instruments (potentiostat/electrometer vs. pH meter) have a different electronic architecture and lead to an initial hypothesis (H0) that the nature of the instrument (the only factor of variability of interest) has an influence on the pH values. The validity of this hypothesis is tested using the statistic F test, which calls for the calculation of variances between groups (dispersion of means around the general average) and within groups (dispersion of data within each sample around its mean), denoted by SCF and SCR, respectively. The results from [16] were not included, because that was the first experimental realization of the concept and the cell has improved a lot since then. The results of the ANOVA test are shown in Table 5.
Table 5 shows that the calculated F value is lower than the critical value for a risk level of 5% and therefore the initial hypothesis is rejected. Thus, this analysis indicates that there is no significant difference in variances between results obtained using a pH meter and the ones obtained with a potentiostat. Therefore, both systems could be used reliably for pH abs H 2 O measurement.
It is, nevertheless, important to mention that measurements in standard aqueous buffers cannot be used to demonstrate the advantage of using IL compared to classical salt bridge electrolytes if different solvents are involved.

3.4. Influence of the Pressure and IL Movement within the Cell

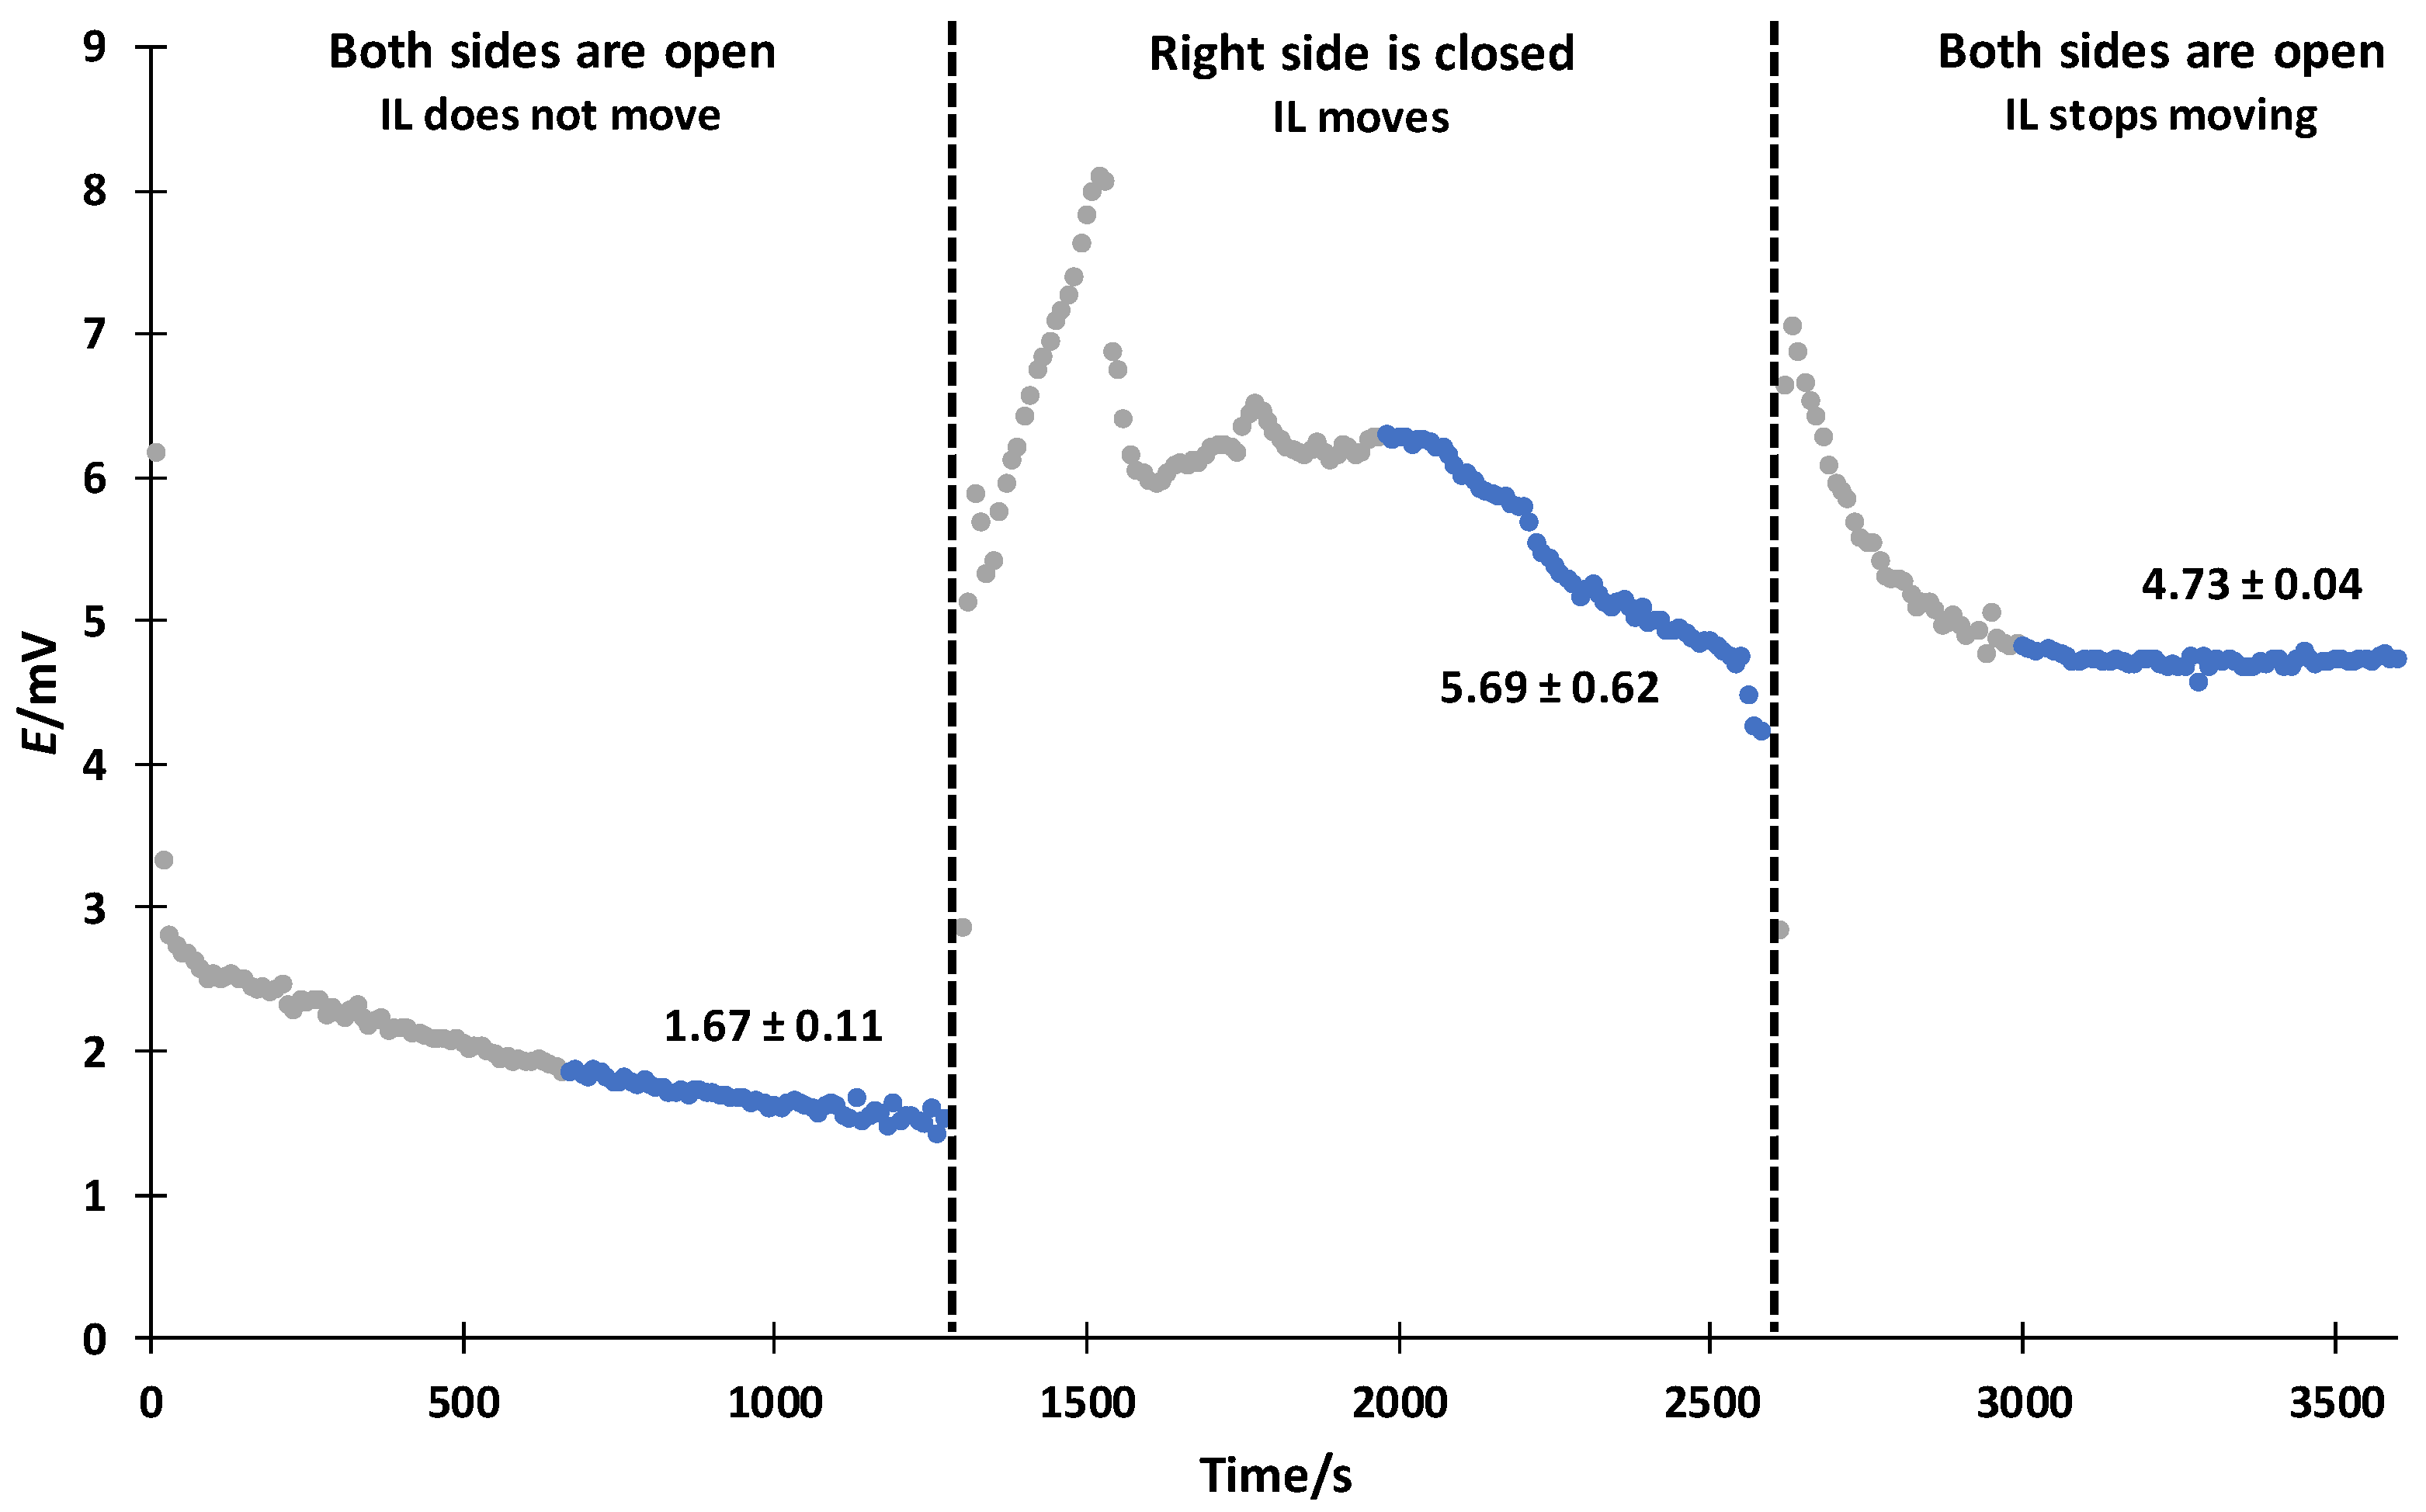
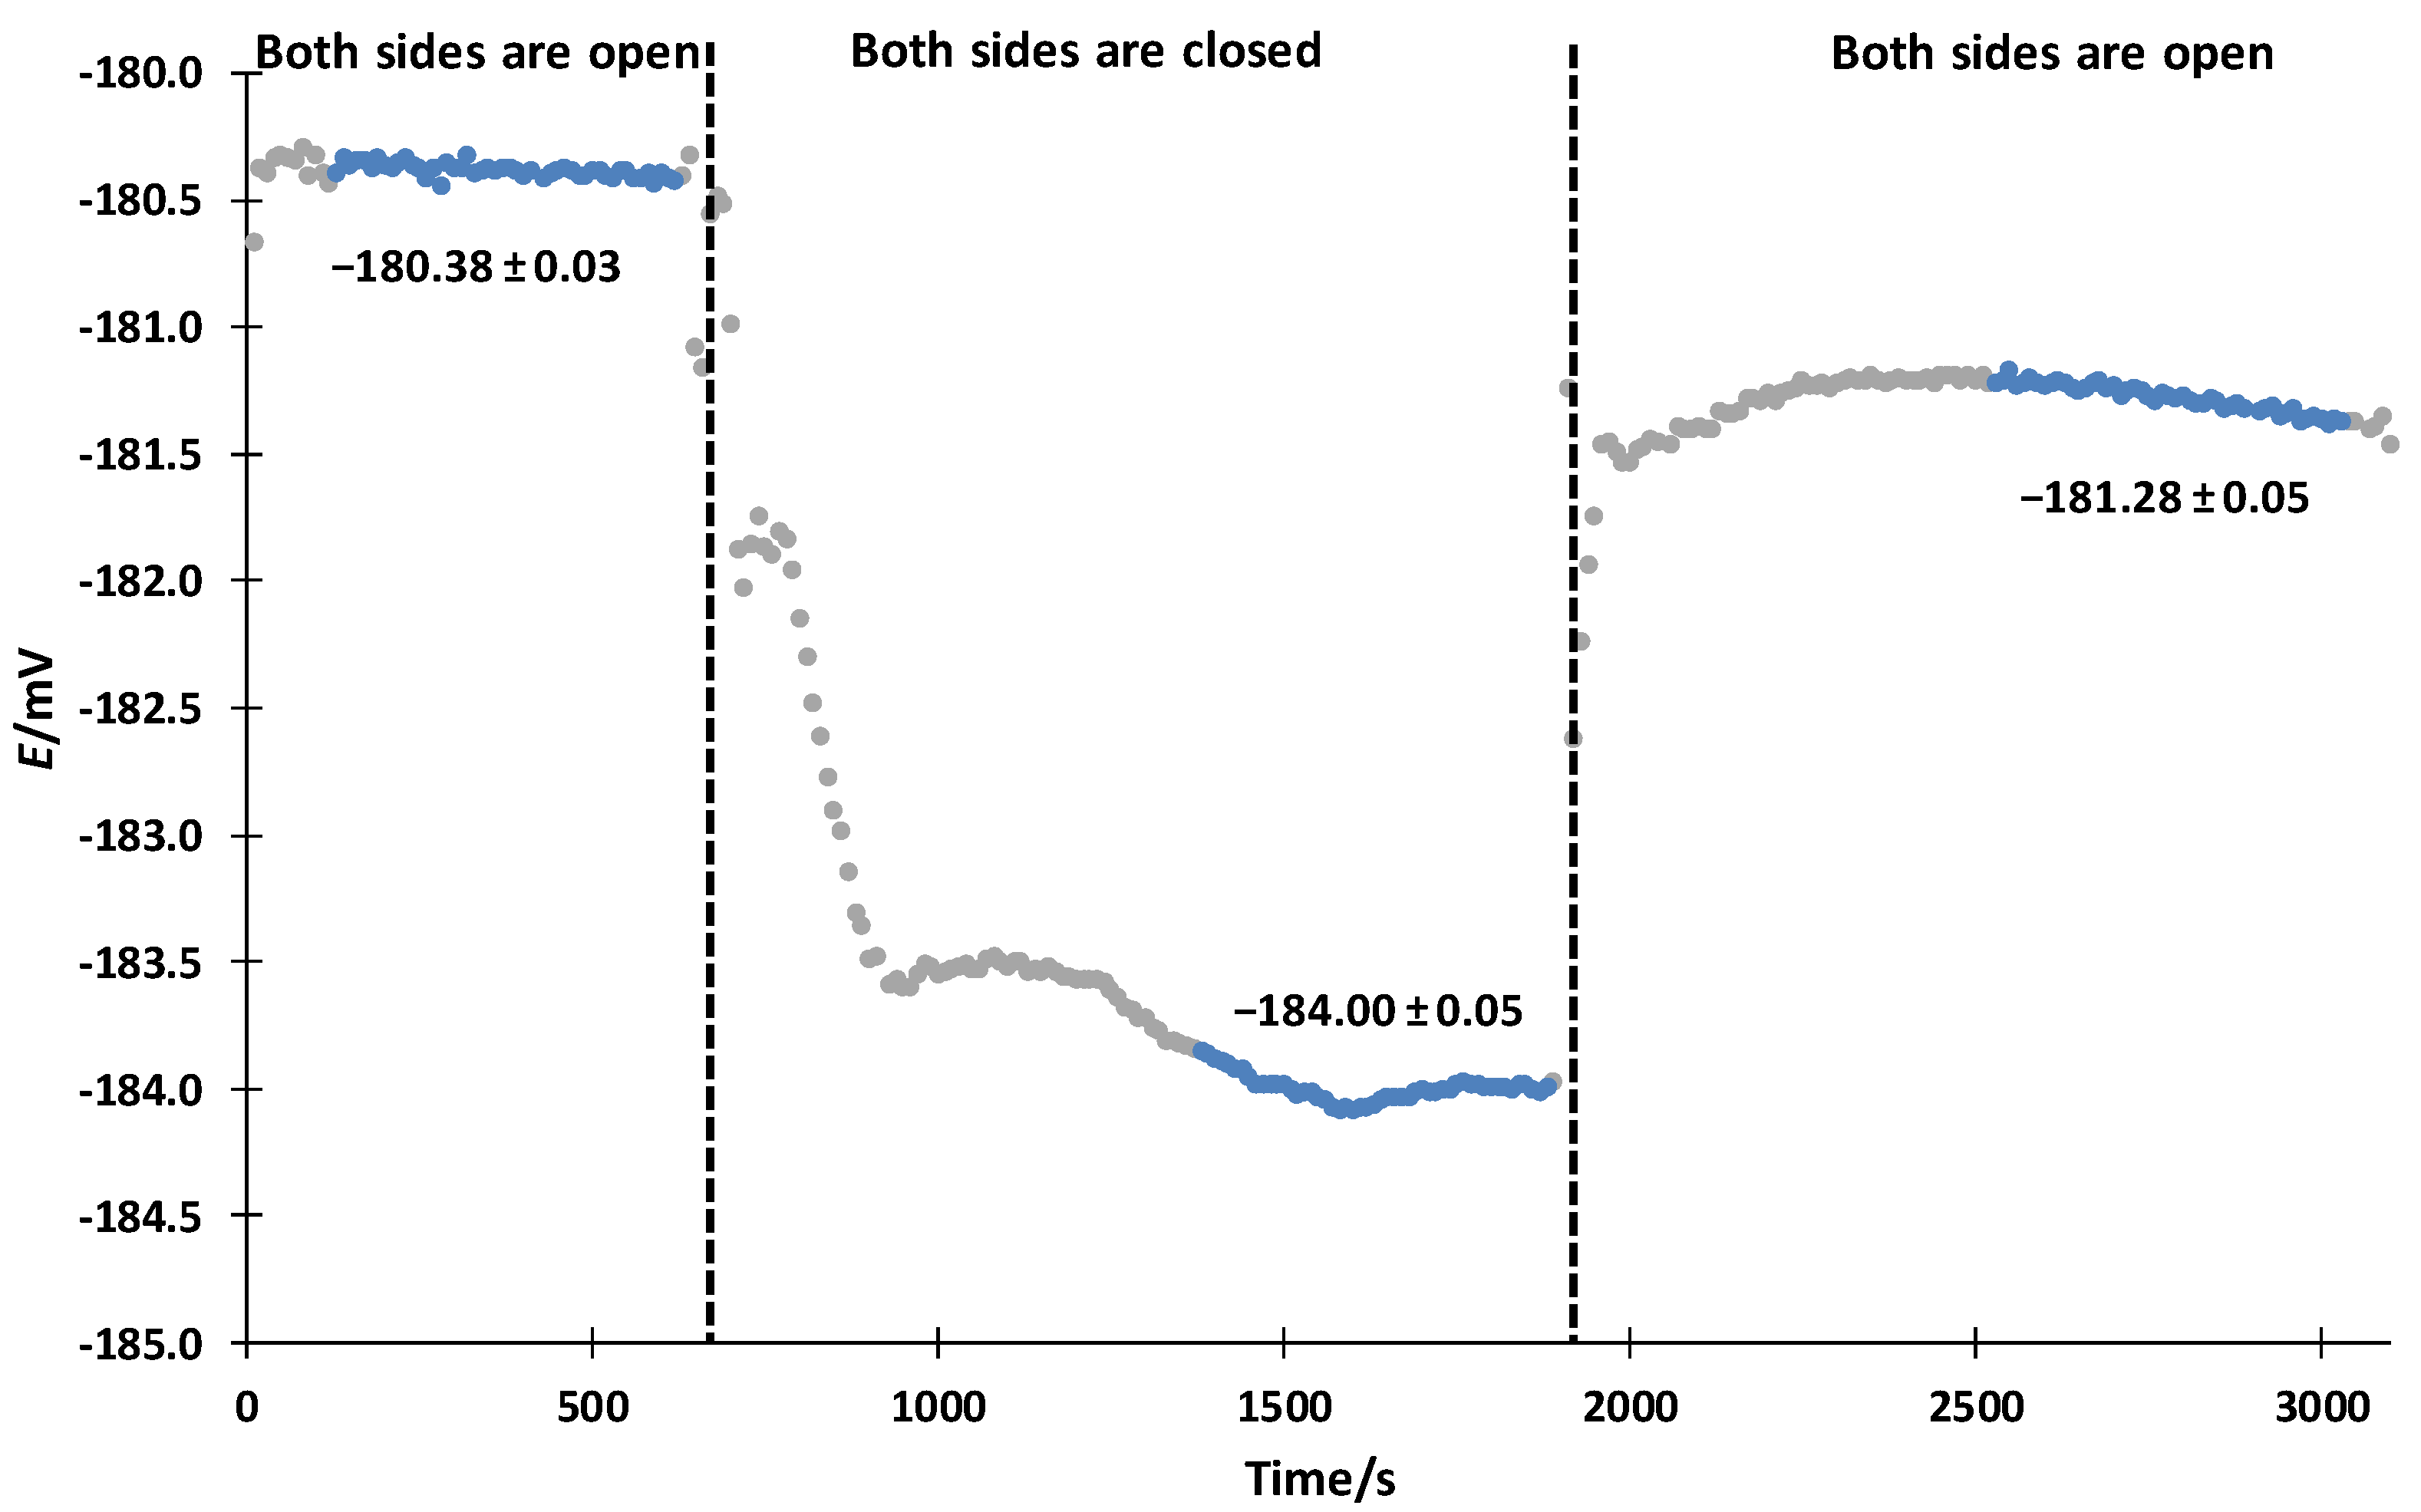
The experimental system is also sensitive to any source of mechanical destabilisation of original conditions, such as opening or closing one or both sides of the cell. To test the influence of measurement conditions in an open cell versus a closed cell, experiments were completed with one (Figure 6) or both (Figure 7) sides closed to atmosphere.
System pH 9 vs. pH 9 behaved similarly to system pH 7 vs. pH 7. In both cases, the difference between the fully open system and a system with one side closed is around 2 mV to 3 mV, which could be due to the movement of the IL in the salt bridge. However, when the disturbance is removed and the system returns to its initial (open) state, the original readings of the measured potential are not recovered, suggesting an irremediable destabilization in junction symmetry.
In the case of pH 11, the difference is around 3 mV to 4 mV. The well-known sensitivity of high-basicity solutions to atmospheric CO2 might explain the results obtained for stronger alkaline buffers.

4. Discussion

The quality of pH abs H 2 O measurement is largely determined by the pH abs H 2 O system design. The influence of different cell designs on the reliability of the measurements was estimated in steps.
All the cells tested are suitable for unified acidity measurements, as is evident from Figure 5, where the majority of results lie within the target uncertainty or show significant overlapping uncertainty. The standard deviation of all the measured ΔΔpH values is 0.04. This validation highlights that the method is, to a large extent, independent of the user and the used equipment, including the cell geometry. The method is robust enough for a wider adoption of the concept. Most important is that all the cells are symmetrical, even if not perfectly.
In addition to cell symmetry, the quality (consistency standard deviation) of the fitted ladder data depends also on the electrodes and instrument. The instrument has a very important role in the quality of the data. The input impedance of the instrument must be high for a successful measurement. For example, the Agilent 3458A reference multimeter can only be used together with an impedance converter. Otherwise the obtained pH values can be even half a unit off. The type of the instrument is not important (Table 5). The UT results from 2015 with the [N2225][NTf2] salt bridge (UT-2015 in Figure 5) have a similar consistency standard deviation as the 2020 results from UT and FC.ID (UT-2020 and FC.ID in Figure) with the same instrument and salt bridge, but different cells. This comparison shows that the method gives reproducible results over a long time period and at different laboratories.
The measurement system is not perfectly symmetrical. The symmetry can be tested by measuring the same buffer on both sides of the cell (Figure 2). The closer the measured potential is to 0 mV, the more symmetric the system. This comparison includes all the effects, such as the cell, electrodes and IL. The more symmetric the cell, the less there is a need for measurement corrections and the more reliable the results.
The cell and its handling influence the quality of the data. The design of the cell is similar in all cases, but the cells are not identical. The differences in design influence the accuracy of the results and user friendliness. Glass blowing is done by hand and often the cell is not completely symmetrical, particularly the shape, i.e., diameter (around 1 mm), length and uniformity of the salt bridge capillary. These minor differences are revealed while working with the cell, and the peculiarities of the specific cell must be considered. This might mean some changes in filling or cleaning procedures.
As for filling the cell, the capillary is filled first and then the test solutions are added to the cell compartments. Both compartments are filled simultaneously, otherwise the unbalanced pressure forces the IL out of the capillary. For the same reason, solutions added to the compartments must have an equal weight and not volume. Depending on the difference in amounts, the IL moves within or leaves the capillary. The IL movement causes unstable readings. Moreover, for a stable potential reading, it is necessary to keep both compartments connected to the atmosphere, allowing the atmospheric pressure to affect both compartments the same way. If one side of the cell is closed and the other side is open to atmosphere, the IL will move (Figure 6). If both compartments are closed, the potential changes, but is stable (Figure 7).
The two electrodes of the differential cell should be as similar as possible to their intercepts (and slopes). If this is not the case, then the cell is not completely symmetrical and a correction for the difference in intercepts must be applied. This introduces an uncertainty to the value of cell potential used for calculations of pH. The correction does not work if also the slopes are different. A better approach is to measure the same pair of solutions again and exchange the electrodes in the buffers, while keeping the connections of electrodes the same and using the average of the obtained values. As a downside, this doubles the workload.
Most of the pH differences plotted in Figure 5 are less than 0, indicating that either the pH values of the anchor buffers are systematically higher, or the pH values of the remaining buffers are systematically lower. TUBITAK UME uses the lowest reported input impedance equipment. This might be one of the reasons for the experimental values having a large consistency standard deviation. Another reason is that they made measurements with only one polarity. BFKH, CMI, IPQ and UT used the average of opposite polarities to improve the quality of their data several times. In the cases of the two combined electrodes tested, only the signal from glass electrode part was used. Both combined electrodes can be used for unified acidity measurements, but they are not as good as metal solid contact glass electrode half-cells.
The liquid junctions of the salt bridge must be symmetrical for the LJP to be cancelled out. In an asymmetrical case, the LJP must be estimated or measured. If we have the same solvent with similar ionic strength on both sides, like with aqueous standard buffers, all salt bridge electrolytes should work well. However, as soon as the solvents on both sides are different, a salt bridge electrolyte with carefully selected properties is needed, such as [N2225][NTf2] [22,23,25]. During the cell filling process, air bubbles can form at the junction. If these are not removed carefully, they will cause problems. Large bubbles disconnect the circuit. This problem is easy to diagnose because the reading will be out of range of the instrument or extremely unstable. Small bubbles are harder to see, but they do not prevent completion of the measurement. Tiny bubbles at the junction lead to an unstable reading (Figure 3). Moreover, the immersion depth of the electrodes—albeit not significant for the present example—can have a small influence on the measurement results (less than 0.5 mV) if not symmetrical.
Finally, the storage of the electrodes plays a role. The more similar the storage solution to the solutions that are measured, the faster the electrode stabilization. If the electrodes are not kept in the same solutions as those to be measured, then the two electrodes will have different stabilization times. This effect can be overcome by a longer measurement time.
Step by step evaluation of the cell design and a measurement procedure regarding the reliability of the results help to find the uncertainty sources and establish traceability. With the use of standard aqueous buffers, we now can distinguish the influences coming from the sample to the ones from the setup. This knowledge is needed to move on to more complex matrices. The developed procedures can be used with nonaqueous solvents and aqueous–organic mixtures, where the advantage of using IL can be seen.

5. Conclusions

Unified acidity values ( pH abs H 2 O values) can be measured with various instruments and cell designs. All used experimental setups were found suitable for pH abs H 2 O measurements. The method is robust enough for a wider adoption of the concept, and the results from different setups are comparable. Symmetry of the measurement cell is important and helps to improve the accuracy of the measurement results, hence the pH abs H 2 O values. The workload halves if the electrodes used are similar.

Supplementary Materials

The following are available online at https://www.mdpi.com/2073-8994/12/7/1150/s1, Figure S1: The setup of BFKH; Figure S2: The setup of CMI; Figure S3: The setup of DFM; Figure S4: The setup of FC.ID; Figure S5: The setup of IPQ. (A) Symmetric cell for differential potentiometric measurements, (B) symmetric cell and glass electrodes inside Faraday cage (made in IPQ), (C) Keithley 6514 electrometer for differential potentiometric measurements and (D) whole setup; Figure S6: The setup of LNE; Figure S7: The setup of PTB; Figure S8: The setup of TUBITAK UME. (A) symmetrical measurement cell, (B) potentiometric titration system, (C) plug F differential amplifier, (D) circulated thermostatic water bath and (E) measurement cell-setup.

Author Contributions

Conceptualization, A.H., D.S., I.K. and I.L.; data curation, A.H.; formal analysis, A.H., B.A., D.N., R.Q., R.B., J.S., S.L., L.L., M.R. and A.S.; funding acquisition, D.S. and I.L.; investigation, A.H., D.S., B.A., D.N., R.Q., R.B., J.S., S.L., L.L., E.U., M.R. and A.S.; methodology, A.H., R.B., J.N. and I.L.; project administration, D.S. and F.B.; resources, F.C. Z.N.S., R.Q., L.R., F.B., L.L., M.V., L.D., I.K. and I.L.; supervision, Z.N.S., J.N. and I.L.; validation, R.Q., L.R., J.N., L.L., E.U., M.R., M.V. and V.R.; visualization, A.H.; writing—original draft, A.H.; Writing—review and editing, A.H., D.S., F.C., D.N., R.Q., F.B., J.N., S.L., L.L., M.R., A.S., L.D., V.R. and I.L. All authors have read and agreed to the published version of the manuscript.

Funding

This research was funded from the EMPIR programme (project 17FUN09 “UnipHied”, www.uniphied.eu) co-financed by the Participating States and from the European Union’s Horizon 2020 research and innovation programme. The work at UT was supported by the Estonian Research Council grant (PRG690) and by EU through the European Regional Development Fund under project TK141 “Advanced materials and high-technology devices for energy recuperation systems” (2014-2020.4.01.15-0011). FC.ID, whose work was developed in Centro de Química Estrutural, thanks Fundação para a Ciência e Tecnologia for funding under project UID/QUI/00100/2020. The APC was funded by MDPI.

Acknowledgments

The authors are thankful to Rouvim Kadis (VNIIM) and Teemu Näykki (SYKE) for inspiring discussions and help with obtaining suitable electrodes.

Conflicts of Interest

The authors declare no conflict of interest. The funders had no role in the design of the study; in the collection, analyses, or interpretation of data; in the writing of the manuscript, or in the decision to publish the results.

Appendix A

Appendix A.1. Measurement Procedures Used

BFKH: A Keithley 6430 Sub-Femtoamp remote sourcemeter/multimeter was used to measure the potential difference between the two glass electrodes and “Terminal” version 1.93b data logging software was used for data collection. The data were collected for at least 2 h, the sampling interval was 3 s and the average of points from 1800 s to 7200 s was used. The electrode positions were switched, and the obtained two readings were averaged as the final potential that was used for minimization. The samples were thermostated at 25.00 ± 0.02 °C using a water bath (Haake D8). BFKH used a Metrohm 6.0750.100 Ag/AgCl 3 M KCl reference electrode for the calibrations. The suitability of Metrohm Solvotrode electrodes for unified acidity measurements were tested. No Faraday cage was used.
CMI: A Bio-Logic SP200 potentiostat with a low current module was used to measure the potential difference between two glass electrodes. The data were collected using EC Lab V11.25 software. The cell with electrodes was placed in a Faraday cage to eliminate the electromagnetic noise in order to obtain stable signal. The solutions were thermostated at (25.00 ± 0.05) °C using a thermostat LAUDA ALPHA RA 12. The sampling interval was 1 s and the data were collected for 15 min. The values of ΔE extrapolated to the time of 0 s were used for the data analysis. The electrode positions were switched, and the obtained two readings were averaged to obtain the final potential.
DFM: A Zahner IM6ex potentiostat with the HiZ (high impedance) probe was used for the measurement of potentials, and dating logging was performed using the Thales V4.15 software. Data were collected over 1 h with a sampling interval of 10 s, and only the data collected between 1800 s and 3600 s were used in data analysis. The cell, electrodes and high-Z probe were all placed inside a Faraday cage. Temperature stabilization to 25 °C was provided by a VWR AP15R-40 circulating refrigerator. A Radiometer REF421 Ag/AgCl reference electrode was used for calibration of the glass electrodes.
FC.ID: A Metrohm 713 pH meter was used for the differential measurement of potentials. No software was used for data collection. Data were collected for 90 s after 15 min stabilization at sampling interval of 10 s. Non-thermostated cell measurements were performed at room temperature (lab average air temperature of 21.8 °C). A Mettler Toledo Inlab®301 Ag/AgCl 3 mol dm−3 KCl reference electrode was used for the calibration experiments. No Faraday cage was used.
IPQ: An Agilent 3458A reference multimeter (resolution 8 ½ digits) with an impedance converter based on AD8627 (PTB development) and a Keitlhey 6514 electrometer were used for the potentiometric measurements. On both devices, the data were collected for 1 h (sampling interval was 20 s) and the average of points collected between 1800 s to 3600 s was used as potential for the single run. The measurements were made at room temperature. The electrode positions were switched, and the obtained two readings were averaged to obtain the final potential. The glass cell and electrodes were in a Faraday cage. The glass electrodes were calibrated in aqueous standard buffers using a Metrohm 6.0733.100 Ag/AgCl 3 M KCl reference electrode.
LNE: A Bio-Logic SP200 potentiostat equipped with a low current module was used to measure the potential difference between the two glass electrodes. The differential potentiometric setup was placed in a Faraday cage and an analog filtering at 5 Hz was carried out to limit the electromagnetic noise and obtain a smooth signal. The samples were thermostated at (25 ± 0.05) °C using a cryothermostat LAUDA ECO RE 2025 GN. The data were collected every 5 s. The most stable data over a 15 min (around 200 points) period were used for subsequent data treatment.
PTB: A Keysight B2987A Electrometer/High Resistance Meter with Quick IV Measurement Software was used for measurements. The sampling interval was 10 s. The data were collected for 1 h and the average of points 1800 s to 3600 s was used. A LAUDA Proline RP845 was used to maintain temperature at 25.0 °C. A Metrohm 6.0750.100 Ag/AgCl 3 M KCl reference electrode was used for the glass electrode calibration experiments. A Faraday cage was not used. Metrohm EtOH-trodes, combined glass electrodes, were used for unified pH measurements. Only the signal from glass electrode part was used.
TUBITAK UME: A Metrohm 916 Ti-touch potentiometric titration system with a differential amplifier (Metrohm 6.5104.030) was used for the potentiometric measurements. The data were collected at intervals of 15 min for 2 or 3 h and the last two datasets were used. A Labo C200-H13 circulated thermostatic water bath was used to provide a stable temperature at 25.0 °C (±0.03 °C). A BASi MF-2052 Ag/AgCl (3 M NaCl) was used for the calibration experiments. A Faraday cage was not used.
UT: The experiments at UT were performed during three separate time periods: 2015, 2018, and 2020. Two measurement devices were used. Some measurements were performed with a Metrohm 713 pH meter. The 2018 measurements were carried out with a Gamry Instruments Reference 3000™ Potentiostat/Galvanostat/ZRA (zero resistance ammeter). Even more variation is to be found elsewhere in the measurement setup, as is evident from Table A1. A common feature for all three periods, however, is the saturated calomel reference electrode (Radiometer K401) which was used to calibrate ion-selective metal solid contact glass electrodes. Measurements were made at 25.0 °C (± 1.0 °C). The Rettberg cell that UT uses is based on the PTB cell. The only difference is the water jacket inlet and outlet positions, otherwise the cells are the same.
Table A1. Unified acidity procedures used at UT.
[16][20]201520182020
DeviceMetrohmMetrohmMetrohmGamryMetrohm
calibration of deviceNononoyesno
electrodes fromSt. Petersburg State UniversitySt. Petersburg State UniversitySt. Petersburg State UniversityIzmeritelnaya tekhnikaIzmeritelnaya tekhnika
glass cellFigure 1A, in-houseFigure 1B, in-houseFigure 1C, same as in [21], in-houseFigure 1D, in-houseFigure 1E, Rettberg
salt bridge positionAboveabovebelowbelowbelow
Faraday cagefrom Al foilfrom Al foilfrom Al foilGamry VistaShield™Gamry VistaShield™
auxiliary electrodeseparate Pt electrodePt wire soldered into capillaryPt wire soldered into capillarynoneseparate Pt wire inserted from side port
thermostatedRoomroomroomsolution compartmentswhole cell
salt bridge electrolytesaturated KClsaturated KCl[N2225][NTf2]saturated KCl[N2225][NTf2]
pre-soaking (30 min)Nononoyesyes
duration of meas.15 min15 min15 min35 min35 min
data collection intervalNonenonenone1 s3 s
definition of potentialfinal data pointfinal data pointfinal data pointaverage of last 5 min (301 data points)average of last 5 min (101 data points)
used for minimizationaverage of four or two potentials with opposite polarities average of two potentials with opposite polaritiesaverage of two potentials with opposite polaritiessingle potentialaverage of two potentials with opposite polarities

Appendix A.2. Explanation of the “Ladder” Approach

The “ladder” approach, used for assigning a pH abs H 2 O value to the measured buffers, relies on the measurements with cell II, where each half cell is filled in with a different pH buffer. An example of how to build such a ladder is shown with data from DFM.
First, the electrodes must be calibrated. This means that the potential of the glass electrode is measured against a reference electrode in standard aqueous buffers with known pH values. The results of measurements made at 25 °C are shown in Table A2.
Table A2. The electrode characteristics.
ElectrodeIntercept/mVSlope/mVR
M1−1896.34 −57.610.99996
M6−1898.39 −57.080.99993
The next step is to measure potential between two glass electrodes in cell II. The measured potential, ΔEmeasured, is converted into pH difference with
Δ pH abs H 2 O = Δ E measured slope average
where slopeaverage is the average slope of the two glass electrodes, −57.34 mV in this case. The measured potentials together with the pH differences are shown in Table A3.
Table A3. Measured potentials ΔE and their corresponding pH differences ( Δ pH abs H 2 O , exp ) for different pH buffer solution pairs.
SystemΔEmeasured/mV Δ p H a b s H 2 O , e x p
pH 7 vs. pH 4−177.003.09
pH 7 vs. pH 4−178.763.12
pH 7 vs. pH 4−179.093.12
pH 7 vs. pH 4−177.113.09
pH 7 vs. pH 4−177.693.10
pH 9 vs. pH 4−304.645.31
pH 9 vs. pH 4−304.305.31
pH 9 vs. pH 4−305.065.32
pH 9 vs. pH 4−305.645.33
pH 9 vs. pH 4−305.675.33
pH 9 vs. pH 7−128.392.24
pH 9 vs. pH 7−127.712.23
pH 9 vs. pH 7−127.782.23
The experimental Δ pH abs H 2 O values are used to build the ladder. The sum of squares of differences between the assigned pH abs H 2 O values ( Δ pH abs H 2 O , assigned) and the experimental Δ pH abs H 2 O values ( Δ pH abs H 2 O , exp) are minimized with the least-squares approach by varying the assigned values:
min i i ( Δ pH abs H 2 O , exp , i Δ pH abs H 2 O , assigned , i ) 2
The consistency of the scale (expressing the mutual consistency of the different relative acidity measurements) is evaluated with the consistency standard deviation of the scale s defined as follows:
s = i ( Δ pH abs H 2 O , exp , i Δ pH abs H 2 O , assigned , i ) 2 n m
where n is the number of measurement results on the scale and m is the number of assigned values. An example of the minimization is given in Table A4 based on the results of Table A3. The resulting ladder is presented in Figure A1.
Figure A1. Example of a pH ladder with aqueous standard buffers. Buffer with pH 7.00 was fixed.
Symmetry 12 01150 g0a1
If we take the first line in Table A3, then the Δ pH abs H 2 O , exp is 3.09 and the Δ pH abs H 2 O , assigned is pH= 7 – pH= 4. The buffer with pH= 7.00 is an anchor value and is kept constant, while the other assigned values are changed during minimization to obtain the minimum sum of squares. MS Excel Solver add-in is used for the minimization.
Table A4. Minimization table.
pH abs H 2 O , assigned Δ pH abs H 2 O , exp , i Δ pH abs H 2 O , assigned , i   used   for   minimization
9.225−0.011−0.017−0.0040.0060.0070.0140.0020.003
7.000−0.0120.0180.024−0.0100.000
3.901
Sum of squares = 0.002
n = 13 number of measurements
m = 2 number of assigned values
s = 0.013 consistency standard deviation
There are several ways to fill in the table rows. In this example, the single difference between experimental and assigned differences is calculated on the so-called working electrode (electrode connected to working electrode or ISE1 inlet, depending on the instrument) buffer row. For example, in the case of pH= 7 vs. pH= 4, the buffer pH= 7 is the so-called working electrode buffer. The assigned pH abs H 2 O values shown in Table A4 are the ones obtained after minimization. It is important to note that the consistency standard deviation accounts for random effects influencing the measurement, but it does not account for such systematic effects that bias the pH abs H 2 O of a specific solution upwards or downwards.

References

  1. Buck, R.P.; Rondinini, S.; Covington, A.K.; Baucke, F.G.K.; Brett, C.M.A.; Camoes, M.F.; Milton, M.J.T.; Mussini, T.; Naumann, R.; Pratt, K.W.; et al. Measurement of pH. Definition, standards, and procedures. Pure Appl. Chem. 2002, 74, 2169–2200. [Google Scholar] [CrossRef] [Green Version]
  2. Activity (Relative Activity). Available online: https://doi.org/10.1351/goldbook.A00115 (accessed on 17 April 2020).
  3. Pingarrón, J.M.; Labuda, J.; Barek, J.; Brett, C.M.A.; Camões, M.F.; Fojta, M.; Hibbert, D.B. Terminology of electrochemical methods of analysis (IUPAC Recommendations 2019). Pure Appl. Chem. 2020, 92, 641–694. [Google Scholar] [CrossRef]
  4. Izutsu, K. Electrochemistry in Nonaqueous Solutions; Wiley-VCH Verlag GmbH & Co. KGaA: Weinheim, Germany, 2002. [Google Scholar]
  5. Mussini, T.; Covington, A. Criteria for standardization of pH measurements in organic solvents and water + organic solvent mixtures of moderate to high permittivities. Pure Appl. Chem. 1985, 57, 865–876. [Google Scholar] [CrossRef]
  6. Rondinini, S.; Mussini, P.; Mussini, T. Reference value standards pH measurements in organic solvents and water + organic solvent mixtures of moderate to high permittivities. Pure Appl. Chem. 1987, 59, 1549–1560. [Google Scholar] [CrossRef]
  7. Barbosa, J.; Sanz-Nebot, V. Assignment of reference pH-values to primary standard buffer solutions for standardization of potentiometric sensors in acetonitrile-water mixtures. Fresenius J. Anal. Chem. 1995, 353, 148–155. [Google Scholar] [CrossRef]
  8. Mussini, P.; Mussini, T.; Rondinini, S. Reference value standards and primary standards for pH measurements in D2O and aqueous-organic solvent mixtures: New accessions and assessments. Pure Appl. Chem. 1997, 69, 1007–1014. [Google Scholar] [CrossRef] [Green Version]
  9. Barbosa, J.; Barron, D.; Marques, I. Assignment of pHS values of reference buffer solutions for standardization of potentiometric sensors in THF-water. Polyhedron 1999, 18, 3361–3367. [Google Scholar] [CrossRef]
  10. Antonini, D.; Falciola, L.; Mussini, P.; Mussini, T. Medium effects, comparability and predictability of pH-standards in aqueous+organic solvent mixtures: Behavior of the (ethylene carbonate+water) and (propylene carbonate+water) systems. J. Electroanal. Chem. 2001, 503, 153–158. [Google Scholar] [CrossRef]
  11. Falciola, L.; Mussini, P.R.; Mussini, T.; Pelle, P. Determination of primary and secondary standards and characterization of appropriate salt bridges for pH measurements in formamide. Anal. Chem. 2004, 76, 528–535. [Google Scholar] [CrossRef] [PubMed]
  12. Dumitrel, D.; Falciola, L.; Liotto, M.; Mussini, P.R.; Mussini, T.; Rossi, M. Determination of primary and secondary standards for pH measurements in N-Methylacetamide and its 0.50 mass fraction in admixture with water, with characterization of appropriate salt bridges. J. Chem. Eng. Data 2007, 52, 1595–1602. [Google Scholar] [CrossRef]
  13. Falciola, L.; Fierro, A.; Mussini, P.R.; Mussini, T.; Rossi, M.; Dumitrel, D. Medium effects and determination of primary and secondary standards for pH measurements in (Glycerol + Water) solvent media at normal and subzero temperatures, with characterization of appropriate salt bridges †. J. Chem. Eng. Data 2009, 54, 286–293. [Google Scholar] [CrossRef]
  14. Cox, R.A.; Yates, K. Acidity functions: An update. Can. J. Chem. 1983, 61, 2225–2243. [Google Scholar] [CrossRef]
  15. Himmel, D.; Goll, S.K.; Leito, I.; Krossing, I. A unified pH scale for all phases. Angew. Chemie Int. Ed. 2010, 49, 6885–6888. [Google Scholar] [CrossRef] [PubMed]
  16. Suu, A.; Jalukse, L.; Liigand, J.; Kruve, A.; Himmel, D.; Krossing, I.; Rosés, M.; Leito, I. Unified pH values of liquid chromatography mobile phases. Anal. Chem. 2015, 87, 2623–2630. [Google Scholar] [CrossRef] [PubMed]
  17. Liquid Junction. Available online: http://goldbook.iupac.org/terms/view/L03584 (accessed on 17 April 2020).
  18. Bates, R.G. Determination of pH: Theory and Practice, 2nd ed.; John Wiley & Sons: New York, NY, USA; London, UK; Sydney, Australia; Toronto, Japan, 1973; ISBN 0-471-05647-2. [Google Scholar]
  19. Popovych, O.; Bates, R.G. Estimation of medium effects for single ions in non-aqueous solvents. CRC Crit. Rev. Anal. Chem. 1970, 1, 73–117. [Google Scholar] [CrossRef]
  20. Liigand, P.; Heering, A.; Kaupmees, K.; Leito, I.; Girod, M.; Antoine, R.; Kruve, A. The evolution of electrospray generated droplets is not affected by ionization mode. J. Am. Soc. Mass Spectrom. 2017, 28, 2124–2131. [Google Scholar] [CrossRef] [PubMed]
  21. Lõkov, M.; Tshepelevitsh, S.; Heering, A.; Plieger, P.G.; Vianello, R.; Leito, I. On the basicity of conjugated nitrogen heterocycles in different media. European J. Org. Chem. 2017, 2017, 4475–4489. [Google Scholar] [CrossRef]
  22. Radtke, V.; Ermantraut, A.; Himmel, D.; Koslowski, T.; Leito, I. The Ideal ionic liquid salt bridge for the direct determination of gibbs energies of transfer of single ions, Part I: The concept. Angew. Chemie Int. Ed. 2018, 57, 2344–2347. [Google Scholar] [CrossRef] [PubMed]
  23. Ermantraut, A.; Radtke, V.; Gebel, N.; Himmel, D.; Koslowski, T.; Leito, I. The ideal ionic liquid salt bridge for direct determination of Gibbs Energies of transfer os single ions, part II: Evaluation of the role of ion solvation and ion mobilities. Angew. Chemie Int. Ed. 2018, 57, 2348–2352. [Google Scholar] [CrossRef] [PubMed]
  24. Veigure, R.; Lossmann, K.; Hecht, M.; Parman, E.; Born, R.; Leito, I.; Herodes, K.; Kipper, K. Retention of acidic and basic analytes in reversed phase column using fluorinated and novel eluent additives for liquid chromatography-tandem mass spectrometry. J. Chromatogr. A 2020, 1613, 460667. [Google Scholar] [CrossRef] [PubMed]
  25. Radtke, V.; Gebel, N.; Priester, D.; Ermantraut, A.; Bäuerle, M.; Himmel, D.; Koslowski, T.; Leito, I. Krossing the ideal ionic liquid salt bridge for the direct determination of Gibbs Energies of transfer of single ions, part III: Evidence and Implications of the absence of solvent-solvent interactions. Angew. Chemie Int. Ed. Submitted.
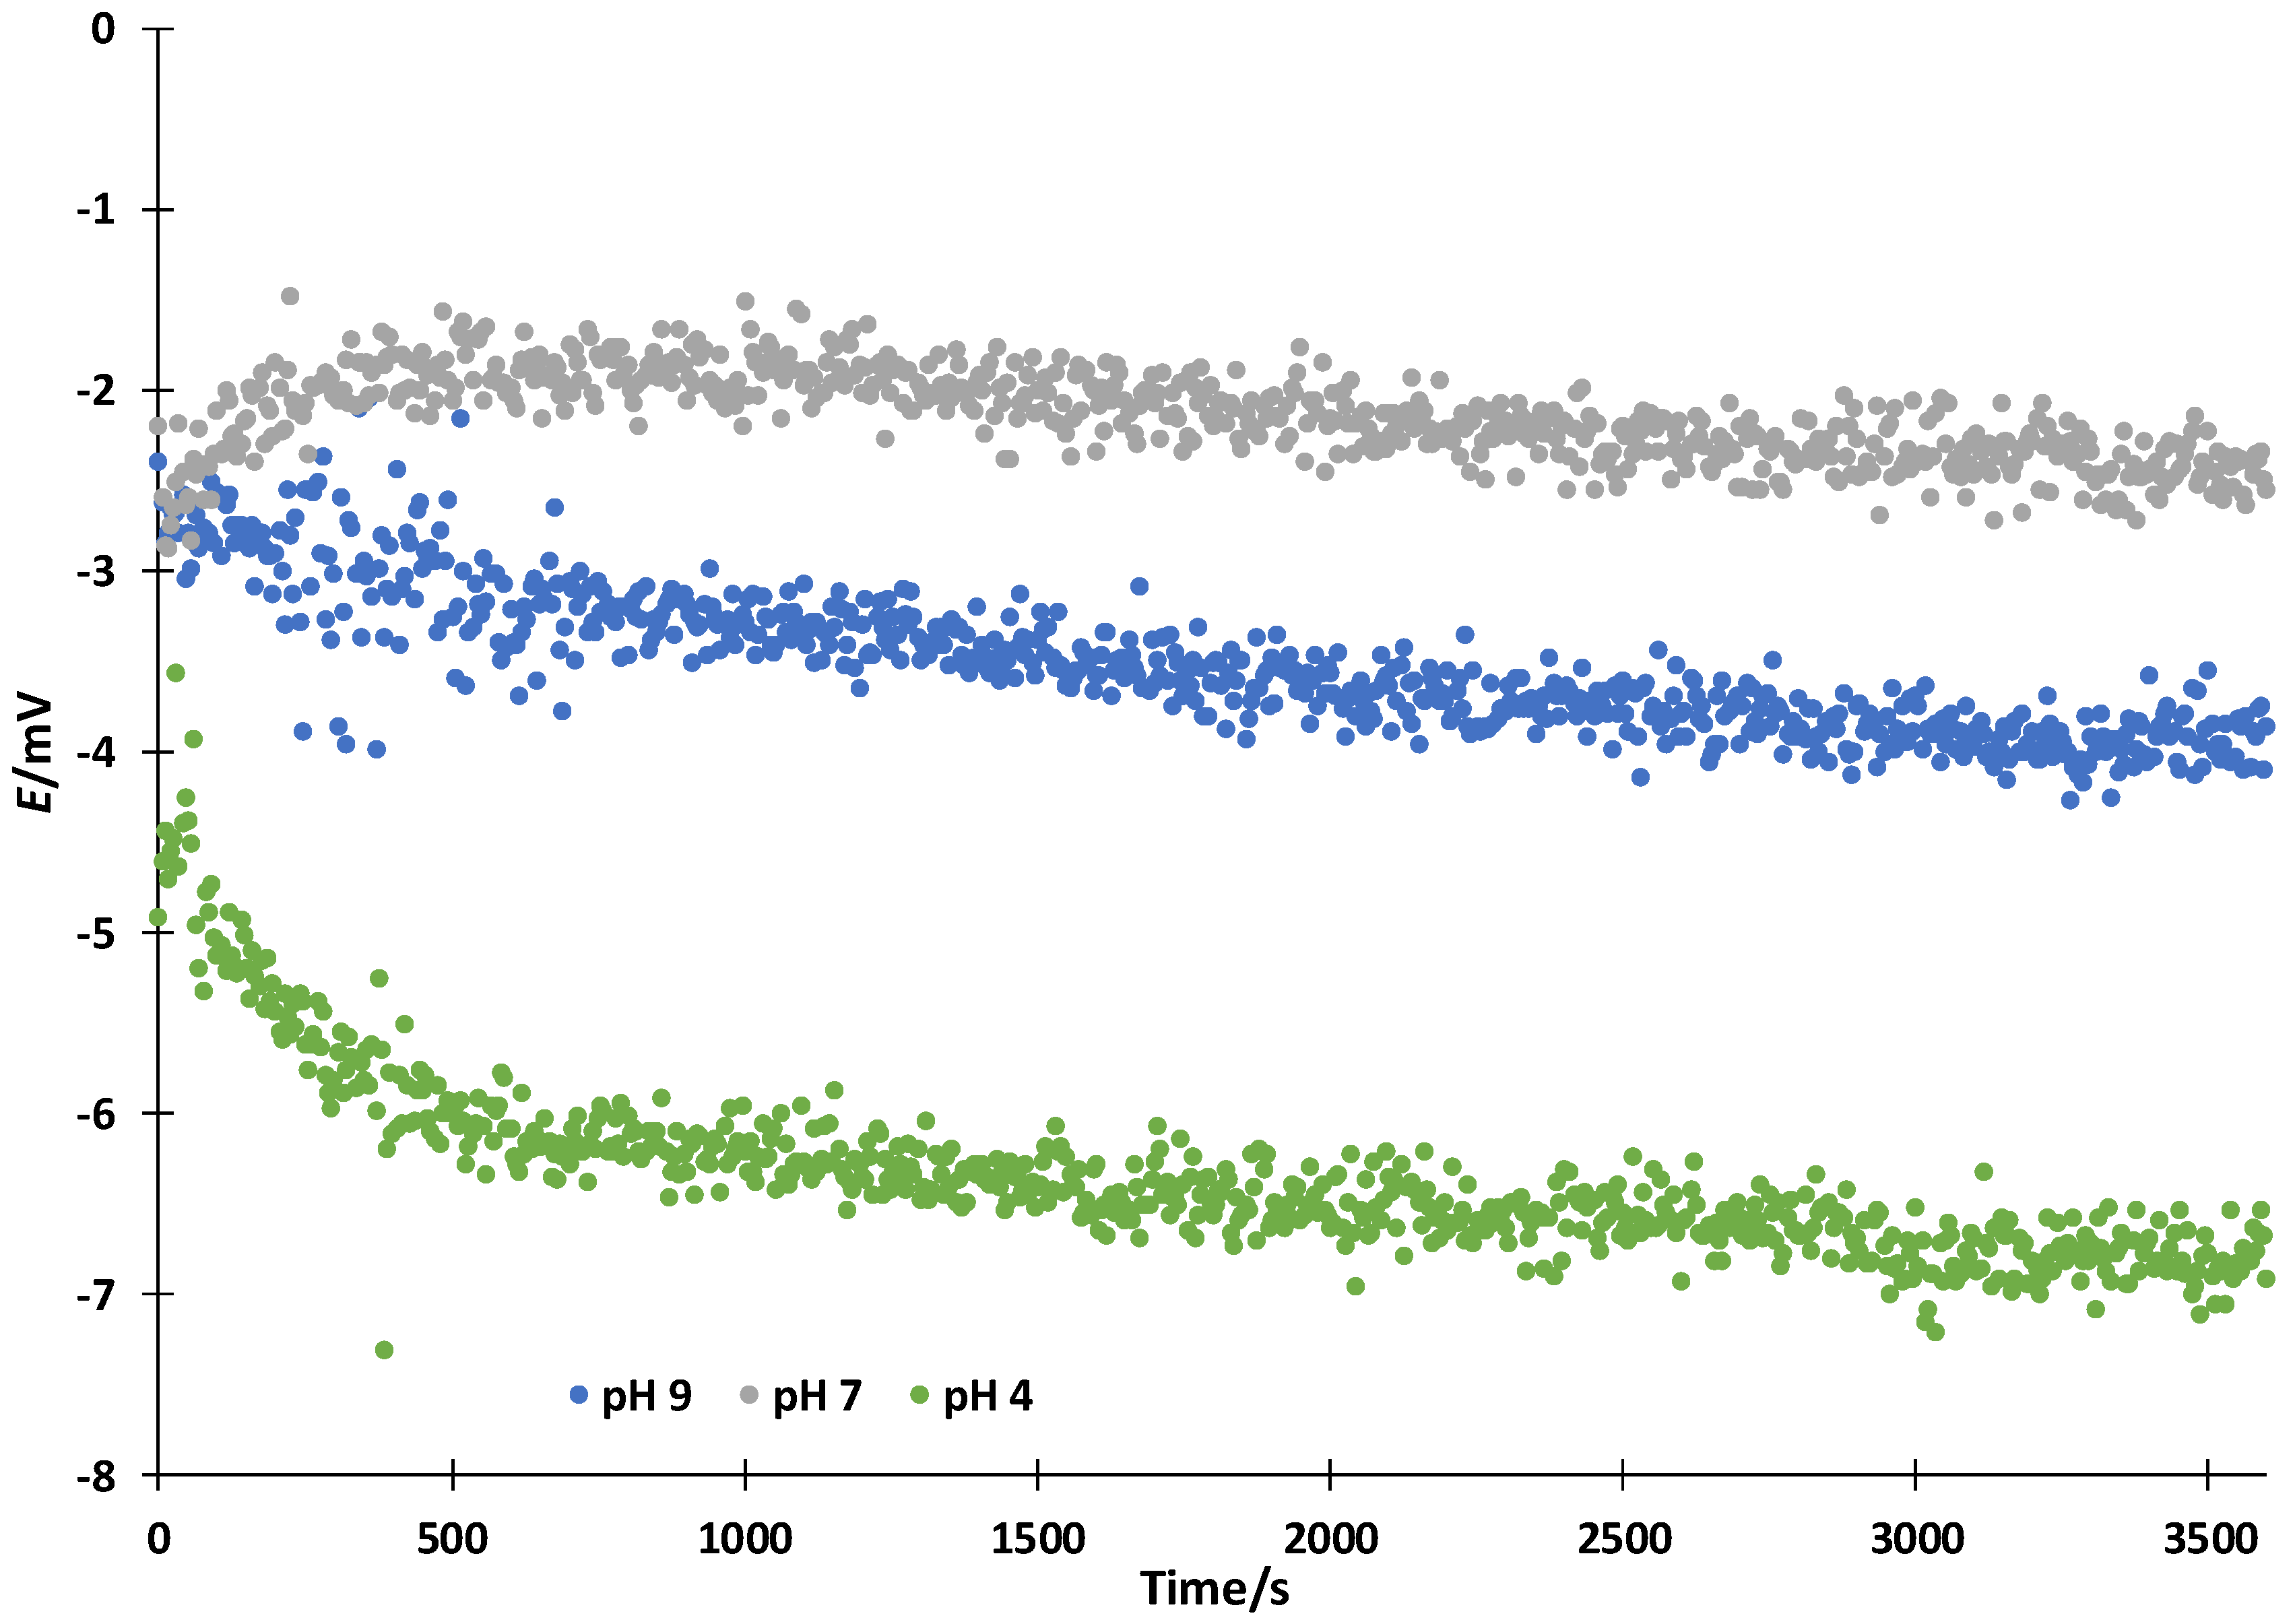
Figure 2. Time dependence of measured difference of potential without any initial stabilization time for 3 Buffer solutions with a nominal pH value of 4.005, 7.000 and 9.180. Measured at LNE.
Symmetry 12 01150 g002
Figure 3. Time dependence of measured difference of potential with bubbles at the interface between IL and solution(s). Measured at LNE.
Symmetry 12 01150 g003
Figure 4. Example of a pH ladder with aqueous standard buffers. Buffer with pH 7.00 was fixed. The pH abs H 2 O are the assigned pH abs H 2 O values.
Symmetry 12 01150 g004
Figure 5. Validation results with standard aqueous buffers (See Table 1 for solutions that were used by different groups). The differences between the experimentally obtained pH and the expected buffer pH value (according to the label) are plotted. The uncertainty bars are the consistency standard deviations of the ladders. Within the series, the results are ordered from high to low pH of the buffer, and anchor points (pH 7.00 in all cases) are omitted from the graph. Orange lines represent the target uncertainty (k = 1).
Symmetry 12 01150 g005
Figure 6. System pH 7 vs. pH 7. Effect of closing one side to atmosphere. Measured at PTB.
Symmetry 12 01150 g006
Figure 7. System pH 7 vs. pH 4. Signal stability if both sides are open or closed to atmosphere. Measured at PTB.
Symmetry 12 01150 g007
Table 1. The standard aqueous buffers used for validation.
Institution aBuffer pHUncertainty bManufacturer
BFKH9.180; 6.865; 4.0080.005–0.01National CRMs c
CMI9.180; 7.000; 4.0000.02National CRMs
DFM9.180; 7.000; 4.0050.01Radiometer/Hach
FC.ID9.21; 9.00; 7.00; 4.00 0.02Metrohm
IPQ9.00; 7.00; 4.000.02Metrohm
LNE10.012; 9.180; 7.000; 4.0050.01Radiometer/Hach
PTB9.00; 7.00; 4.010.02Merck
TUBITAK UME12.00; 10.00; 7.00; 4.01; 1.680.02Merck
UT10.00; 7.00; 4.00; 2.000.02Fluka
a Abbreviations of institutions are explained in affiliations. b Expanded uncertainties of the buffer pH values at k = 2 level. c CRMs are certified reference materials.
Table 2. The different cells used for unified acidity measurements.
Institution aWater JacketAuxiliary ElectrodeManufacturer
BFKHnoneYesBudapest University of Technology and Economics (BME, Budapest, Hungary)
CMIsolution compartmentsNoHubert Košťál, Brno, Czech
DFMwhole cellNoScholers Glasblæseri (Regstrup. Denmark)
FC.IDnoneYesIST-UL (Lisbon, Portugal)
IPQnoneNoResearch Unit VICARTE, Glass and Ceramics for the Arts
(FCT-UNL, Monte de Caparica, Portugal)
LNEsolution compartmentsNoSklotech (Sázava, Czech)
PTBwhole cellNoGebr. Rettberg GmbH (Göttingen, Germany)
TUBITAK UMEnoneYesLAB-CAM (İstanbul, Turkey)
UTnone/solution compartments/whole cellYes/ Noseveral in-house (Tartu, Estonia) and commercial (Gebr. Rettberg GmbH, Göttingen, Germany) cells
a Abbreviations of institutions are explained in affiliations.
Table 3. The different instruments used for unified acidity measurements.
Institution aInstrumentInput Impedance/Ω
BFKHKeithley 6430 Sub-Femtoamp remote sourcemeter/multimeter>1016
CMIBio-Logic SP200 potentiostat with a low current module1014
DFMZahner IM6ex potentiostat with the HiZ (high impedance) probe1015
FC.IDMetrohm 713 pH meter>1013
IPQAgilent 3458A reference multimeter, with an impedance converter based on AD8627 (PTB);
Keithley 6514 electrometer
>1013; >2 × 10¹⁴
LNEBio-Logic SP200 potentiostat with a low current module1014
PTBKeysight B2987A Electrometer/High Resistance Meter>2 × 10¹⁴
TUBITAK UMEMetrohm 916 Ti-touch potentiometric titration system with differential amplifier (Metrohm 6.5104.030)>1012
UTGamry Reference 3000™ potentiostat/galvanostat/ZRA (zero resistance ammeter); Metrohm 713 pH meter>1014; >1013
a Abbreviations of institutions are explained in affiliations.
Table 4. The consistency standard deviation of the obtained pH ladders.
Institution as
BFKH0.0001
BFKH0.01
CMI0.02
DFM0.01
FC.ID0.01
IPQ0.04
IPQ0.02
LNE0.03
PTB0.01
PTB0.04
TUBITAK UME0.10
UT-20200.01
UT-KCl0.02
UT-20150.01
UT [20]0.02
UT [16]0.05
a Abbreviations of institutions are explained in affiliations.
Table 5. The results of the ANOVA test a.
Inter-Group Variance (SCF)0.006
Degree of freedom inter-group (dofinter)1
Intra-group variance (SCR)0.060
Degree of freedom intra-group (dofintra)38
F calculated3.398
P0.073
F critical 5%4.105
a With F = (SCF/dofinter)/(SCR/dofintra).