1. Introduction
Non-aqueous phase liquids (NAPLs) come in two types: light non-aqueous phase liquids (LNAPL) that are less dense than water and tend to float on the water table; and dense non-aqueous phase liquids (DNAPL) that are denser than water and tend to sink through the saturated zone until they encounter a low permeability layer. All NAPLs are low permittivity because they are nonpolar fluids and have low conductivity. A high-conductivity LNAPL plume may occur when biodegradation of the NAPL produces organic acid that then dissolves mineral grains into the formation—leading to increased dissolved solid content. A free-phase NAPL remains low-conductivity and low-permittivity. The analysis of [
1] is applicable to a NAPL. The GPR wave field is polarized and may be polarized in plane if acquired in end-on mode (analogous to shear SV waves in seismology) or polarized perpendicular to the plane if acquired in broad-side mode (analogous to SH wave). There may also be circularly polarized waves. Depending on the design and polarization of an antenna, there is significant angle-dependent radiation, perhaps one of the more challenging aspects of GPR AVO because it also depends on near field electrical properties. Radar amplitude is affected by other factors as well [
2]. GPR AVO analysis is a convenient—and in fact, stronger—method for NAPL detection in the subsurface than conventional GPR methods existing in previous studies, as confirmed by subsequent findings of [
3]. These models indicated that the presence of NAPL produces both amplitude and phase anomalies. The inclusion of phase anomaly analysis requires modification of the existing AVO. Building on previous models, the research presented here considers variable NAPL saturation values and polarization. Other factors such as hydrogeological processes may affect amplitude and phase responses at large angles of incidence. The detection of NAPL has been a challenging task for both controlled and releasing options [
4,
5]. Environmental innovation and productivity are very important for sustainable society as work done by [
6] and [
7]. Hence, water contamination is a major environmental problem which need to be discussed.
The objective of our study is to propose a method that is applicable for theoretical modeling as well as physical applications. The migration of petroleum NAPLs requires that the NAPL relocate air and water from the soil pores [
1]. NAPLs take less energy to move in air as compared to water; therefore, NAPLs enter very easily into the air-filled pores. In addition, more pressure is required to force NAPLs into the filled pores. However, as NPALs are also a wet system, they are in the pores in the lower quantities. Our study is divided into two parts. In first part, we present how intrusion of low conductive NAPL to the water changes the reflection pattern on a theoretical basis. Then, we apply this model to GPR AVO data for practical testing. Something to consider is that—due to their low density—LNAPLs always tend to float over the water table until then they reach to the low permittivity layer. However, LNAPLs always try to remain near the water table in the presence of all other residual products. Considerable work has been done for the detection of NAPLs because they pose major threats to human life. Almost all studied present the correlation between the properties of NAPL and either relative permittivity or porosity; conceptual models have been proposed based on the obtained results. In the second part of our studies, we use different techniques related to GPR AVO analysis. We not only generate a conceptual model, but also provide clear evidence of how the reflection pattern of the acquired data changes abruptly with intrusion of the NAPLs. In this study, data acquisition was another important aspect.
Every step shows that when compared with the conceptual model, the reflection pattern shows similar changes with the intrusion of different materials. Furthermore, physical modeling also reveals that low conductive NAPLs are directly detectable using GPR AVO technique for the contaminated sites. We also determine the relation of trend between relative permittivity, and depth and velocity that validates the obtained results. We limited our study to the low conductive NAPLs; however, in the future, it may be used for dense NAPLs as well.
2. Materials and Methods
According to principle of electromagnetic wave Propagation, electromagnetic field vector is divided into transverse magnetic (TM) wave and transverse electric (TE) wave, the electric field component is perpendicular to incident plane, while the magnetic field component is perpendicular to the plane of incidence [
8]. Contrasts in the optical constants (relative permittivity, εr and index of refraction, n) and electrical impedance (Z) rather than Poisson’s ratio affect GPR signal propagation and separating at stratigraphic boundaries [
3]. The optical constants are related to the material constants: permittivity (ε), magnetic permeability (µ) and conductivity (σ). These relationships are defined in Equation (1) [
4].
where
is the permittivity of free space (8.854 × 10 − 12), εr is the relative permittivity and µ0 is the magnetic permeability of free space (4π × 10 − 7) which is also known as electrical impedance. In addition, GPR offset-dependent reflectivity analysis has been used earlier for the representation of NAPL [
2]. However, this method has not been applied to low conductive NAPLs as yet. NAPLs such as gasoline (εr = 21.6) and trichloroethylene (TCE); (εr = 22.4), have relative permittivities that are often an order of magnitude less than that of groundwater (εr = 81). Therefore, if a NAPL displaces a portion of the groundwater in soil-pore spaces, then the effective relative permittivity of the soil–NAPL–groundwater mixture should decrease [
9]. The presence of NAPLs in the pore spaces of soils and rock will generally increase the signal propagation velocities when groundwater (air) is displaced. NAPLs generally have low conductivity and low relative permittivity values. When a low relative permittivity layer overlays a high permittivity layer, it results in a negative phase reflection coefficient. If a low-permittivity NAPL displaces water in soil pore spaces of layer 2, then reflection coefficient of second layer will increase. Therefore, when a NAPL displaces groundwater, it may produce an anomalous (positive) reflection coefficient. The presence of a low-permittivity NAPL displacing water will additionally increase signal propagation velocity across the impacted zone [
10].
When there are two media interfaces, the total amount of energy is conserved. Meanwhile, both tangential of electric and magnetic fields continue to the either side of reflector. Once the modeling is done with all its components the next step is to resolve and investigate the problems that how the microwave are reflect from the reflectors. The reflection coefficient (R) is defined as the ratio of reflected amplitude to the incident amplitude, between a material 1 and material 2 is given in Equation 2. Partitioning of energy is one of most critical events in any subsurface-imaging with any acoustic of electromagnetic wave (EM) phenomena at an interface. This energy partitioning is a ratio, and that the absolute magnitude of the source energy need not be known. Thus, we can define the physical or EM properties of medium 2—if we know the differences in the reflected energy (Ertl), the angle of incidence,
and the physical or EM properties of medium 1—by researching the characteristic curve of reflected energy variations with the changing angle of incidence (offset) [
10]. In exploration geophysics, we often observe simple reflection as energy is divided in to different component when it fall at interface [
11]. The angles for incident, reflected, and transmitted rays synchronous at the boundary are accessible as described by [
12] where the complex EM impedance (Z) is used in modeling as well as in the physical experiments.
2.1. Theoretical Modeling
All simulation programs of GPR data use a simple ASCII (text) file to define the model parameters [
13]. In this file, special commands like Excitation and Output are used to place source and output points in the model, respectively, because source and receiver positions are most important in the AVO modeling. Moreover, these commands are also used to instruct the software to perform specific functions that are required by the type of the model. The key parameters for the simulation are given in
Table 1; an overview of the geometry of the model is also presented. The simulation contains: anti-personnel landmine models (A-PMN) and anti-personal models 1 (PMA-1); a heterogeneous soil with a rough surface; a GPR antenna model; a false metal target; and several rocks. The simulation required a total of models (A-scans) to image the entire space. Simplifications in such forward models can compromise accuracy with which real GPR responses can be simulated. This degrades the overall presentation of interpretation of the GPR data. A forward model is required to be able to precisely simulate every part of the GPR problem that disturbs the subsequent scattered field. A main element, especially for near-field applications, is the antenna system. Therefore, the model must contain a complete description of the antenna.
In our study, the case was slightly complex because we needed to intrude three materials in the same model. The model comprised of a 2-m-wide tank, where sand, water and the LNAPL was present was about 150 mm. An approximate design of that model is given in
Figure 1. We supposed the electrical properties of that system were: Ԑr= 6 and σ = 0.01 S/m. The resolution of the modeled data always improved due to the fact of low permittivity decreasing velocity and low propagating wave length. Moreover, it could be observed that though the positions of target area were not changed in the model, their responses appeared to be registered at a later time in the simulated GPR scans. All the GPR including conventional method or AVO the basics of the numerical modeling remains always same and that was the Maxwell equation was always remains the key factor for the GPR analysis. One of the most important features used in our study was the finite difference time domain (FTDT). We obeyed all those rules which governs the FTDT. The reasons for such extensive use of the FTDT method were linked to comfort of operation in a computer program at least at a simple preliminary level and its good scalability when compared with other popular electromagnetic modeling methods such the finite-element and integral techniques.
2.2. Physical Modeling
Physical modeling always plays an important role in bridging studies between laboratory investigation and field experiments. In any geophysical method, the second important step is to confirm a proposed result in a theoretical study for which physical modeling is the way to confirm the result [
14]. The first step was to propose a theory regarding the reflection pattern of GPR data; the findings were presented in [
15]. Experimental studies were performed in the laboratory in collaboration with the Jilin University in Changchun City, China. The details regarding to experiments are given in the following sections.
2.2.1. Data Acquisition
To demonstrate the accuracy of our theory and the dependability of the forward model, a test was done in applied geophysical modeling lab at Jilin University, Changchun, where we used the testing tank, which was already filled by sand with different water content ratios, which was made on the source of proposed model. The total length of the tank was approximately 10 m, of which we used only 3–4 m for our experiment. The width of the tank was about 1 m; the full width of the tank was utilized. Similarly, the total depth of the tank was nearly 1.2 m, but the depth of approximately 1 m was used. The first layer was composed of 7 cm fine sand, the second layer’s thickness was 16 cm and it had own water content of approximately 30% when only water was present. In the same layer, the dig hole of about 20 cm × 20 cm was dug and the water-containing layer was contaminated with commercially available NAPL in form of different chemicals. The bottom was 14 cm of dry sand. Then we did the exploration with vector network analyzer connected to 500 MHz and 1000-MHz antennas CSP (common–source point). Data acquisition parameters are given in
Table 2.
In the common midpoint (CMP) mode, for the each offset the antennas were moved proportionally and interface was assumed as the horizontal [
16]. All the target areas were marked in the middle of the tank, was based on calculation. The area was further used to focus on the reflection pattern for all the materials used during our experiment: dry sand, water and a LNAPL.
Figure 2 shows the experimental setup details that were used in the laboratory. This research had some novelties and developments in data acquisition. Instead of using a single frequency of antennas, we focused on interfacing different antennas during the probe. In our detection of CMP mode, the signal generator was a 1000-MHz antenna and a lower 500-MHz antenna was used in signal reception. By doing so, the images were of good quality and high-resolution.
2.2.2. Data Processing
Prior to the actual processing of the data, we generated a radargram of raw data using MATLAB coding for every line to verify whether the proposed theory was valid for raw data as well. Surprisingly, we observed obvious differences in the reflection pattern even before the processing of our data. We could clearly distinguish between the materials we used in our experiment, and this was valid for both frequencies of 500 MHz and 1000 MHz. As it is well-established fact that a vector analyzer records data in the frequency domain—which means it works only on the large frequency domain—and inverse fast Fourier transform (FFT) methodology was adopted to bring it into the time domain to retrieve the data.
MATLAB programs were used for the visualization of AVO response. Two-layer mathematical model with the permittivity of sand 4.6 of upper layer were generated from the real data, with alteration of permittivity from lower to high. Whenever there was more water and LNAPL cut the AVO response was more obvious. In
Figure 3, we are better able to see the different results. When it comes to 41, the curve reaches a much steep slope. In conclusion, AvO response was more obvious for the intrusion of water and LNAPL in the synthetic modeling. This whole processing was known as the basic processing of the GPR data.
Although the obtained results were not conclusive and needed further processing of the GPR data, preprocessing revealed that GPR AVO data analysis for water contamination could be a powerful and practical tool in the field of environmental and applied geophysics. Further, we could attribute the difference in the results to the difference in the frequencies used. We could further propose the best frequency to be used for the field experiments. Preprocessing results are given in
Figure 3. Conclusive comments are discussed later in our study.
We used two kinds of software to process our data set, namely, the GprMax2D, GprMax3D and Gpr slice. AVO data are not easy to display using the given software. Thus, we had to convert the data into the format the software required; we used 32-bit floating point and step size as zero with time increment of 1 ns and collection duration of 500 ns, which was actual time required for data acquisition. GPR data are generally considered a scalar quantity, but the basis of GPR data—that was EM field—was a vector quantity. The vector nature of EM waves has been increasingly used in GPR data processing. The GPR data were highly similar to that of seismic waves and thus, was more analogous to the shear waves than the compressional waves.
Figure 4 shows the complete flow chart of the GPR AVO data processing.
3. Results
The present study documented the model of a control signal processing of the theoretical and physical detection of water contamination. This kind of case can also be treated as the optimal approach in environmental engineering. That is because the relative permittivity of the ordinary material like sand is very low as compared to the water 81. Amplitude jump or variation is directly related with the different dielectric constants of the subsurface materials. Moreover, if we know the variation in relative permittivity and the amplitude jump with variation of the offsets it are easy to determine the cuts of the data acquired the intrusion of the different materials. Apart from the modeling of the given material, we also calculated the relative permittivity of LNAPL and plotted those values against depth and; the trend of permittivity along with the depth was analyzed.
3.1. Results Based on Numerical Modeling
We calculated the relative reflection strength for each dataset by first summing all traces from the center of the model corresponding to the location of the simulated model, then calculating the envelope function of the summed trace. Thereafter, we chose the maximum amplitude of the envelope function within a gated time window centered on the reflection at the simulated reflection event [
14].
Finally, we determined the percentage increase in reflection strength from the three models by comparing the synthetic control without any simulated LNAPL with the simulated LNAPL. Via AVO analysis, we studied the changes in amplitude with respect to the offset.
Figure 5a shows the B-scan (of the (E_z) field component). The initial part of the signal (~0.9–1.2 ns) represents the direct wave from transmitter to receiver. Then comes the reflected wave (~1.4–1.6 ns) from the sand bed which creates reflector and that is only event in the model. If we examine
Figure 5b—which shows a slightly dim response when two changes, namely, but clearly two events can be observed one is same (~0.9–1.2 ns) same sand bet (~1.5–1.7 ns), which is due to the wet sand bed—the offset and the intrusion of LNAPL were made.
Figure 5c shows a parabolic pattern and dim reflection when water, sand and LNAPL were used in the model and the event can be seen (~1.9–2.7 ns) that is due to intrusion of NAPL layer to the model.
3.2. Results Based on Experimental Analysis
To prove effectiveness of numerical modeling procedure, we introduce the relative permittivity contrast which is changing along the depth as depicts in
Figure 6. This variation proves the presence of the different materials within experimental system. The relative permittivity of LNAPL is calculated by using the following symmetrical expression.
where
is the porosity, which is calculated using following relation
is the representation of the pore space voloume of the material and
is total voloume of the matrix. Fluid-productive sandstones display porosities ranging between 0.05 and 0.4, or 5–40% as given by [
17].
is the fractional LNAPL saturation,
is the relative permittivity of NAPL,
is the relative permittivity of sand matrix and
is the relative permittivity of water or air. Intrusion of any other substance would affect the relative permittivity of a material, like sand in our study. The dielectric constants of dry sand varies from 3–7. Portion (1) in
Figure 6 is referred as the portion where dry sand is present. While relative permittivity of wet or saturated sand with water varies from 20–30. The portion (2) in
Figure 6 shows the area having this material—except for the organic material which are not part of our study. Any chemical when intruded to the material the relative permittivity varied from 21–26; portion (3) of
Figure 6 is marked as the area with presence of chemical called NAPL.
3.2.1. Reflection Pattern
The most important part of our study was the practical determination of the reflection pattern of GPR AVO data. As proposed in our theoretical portion, the reflection pattern of GPR data changed with the intrusion of LNAPL. This has also been proven via data preprocessing. Herein, we discuss the reflection pattern with different aspects to verify the accuracy of our results are accurate and determine their similarity with the theoretical results obtained in our study.
When near-surface targets are investigated, the most important disturbance is the clutter. It is very difficult to deal with this disorder. GPR performance is heavily dependent on these kinds of the discontinuities. Such clutter is always related to the same frequencies, but the properties are always different. Hence it is hard to identify between them and real targets. In general, regardless of the existence of the target signal, the disorder is inevitable; we can surely use independent components analysis (ICA) to process GPR signals. All the uncertainties regarding to the actual target can been compensated using a three-component analysis of the reflection pattern of GPR AVO data. Using this method, it is very easy for ICA to extract the signal of each component. We get good results for ICA as applied to the simulated GPR data.
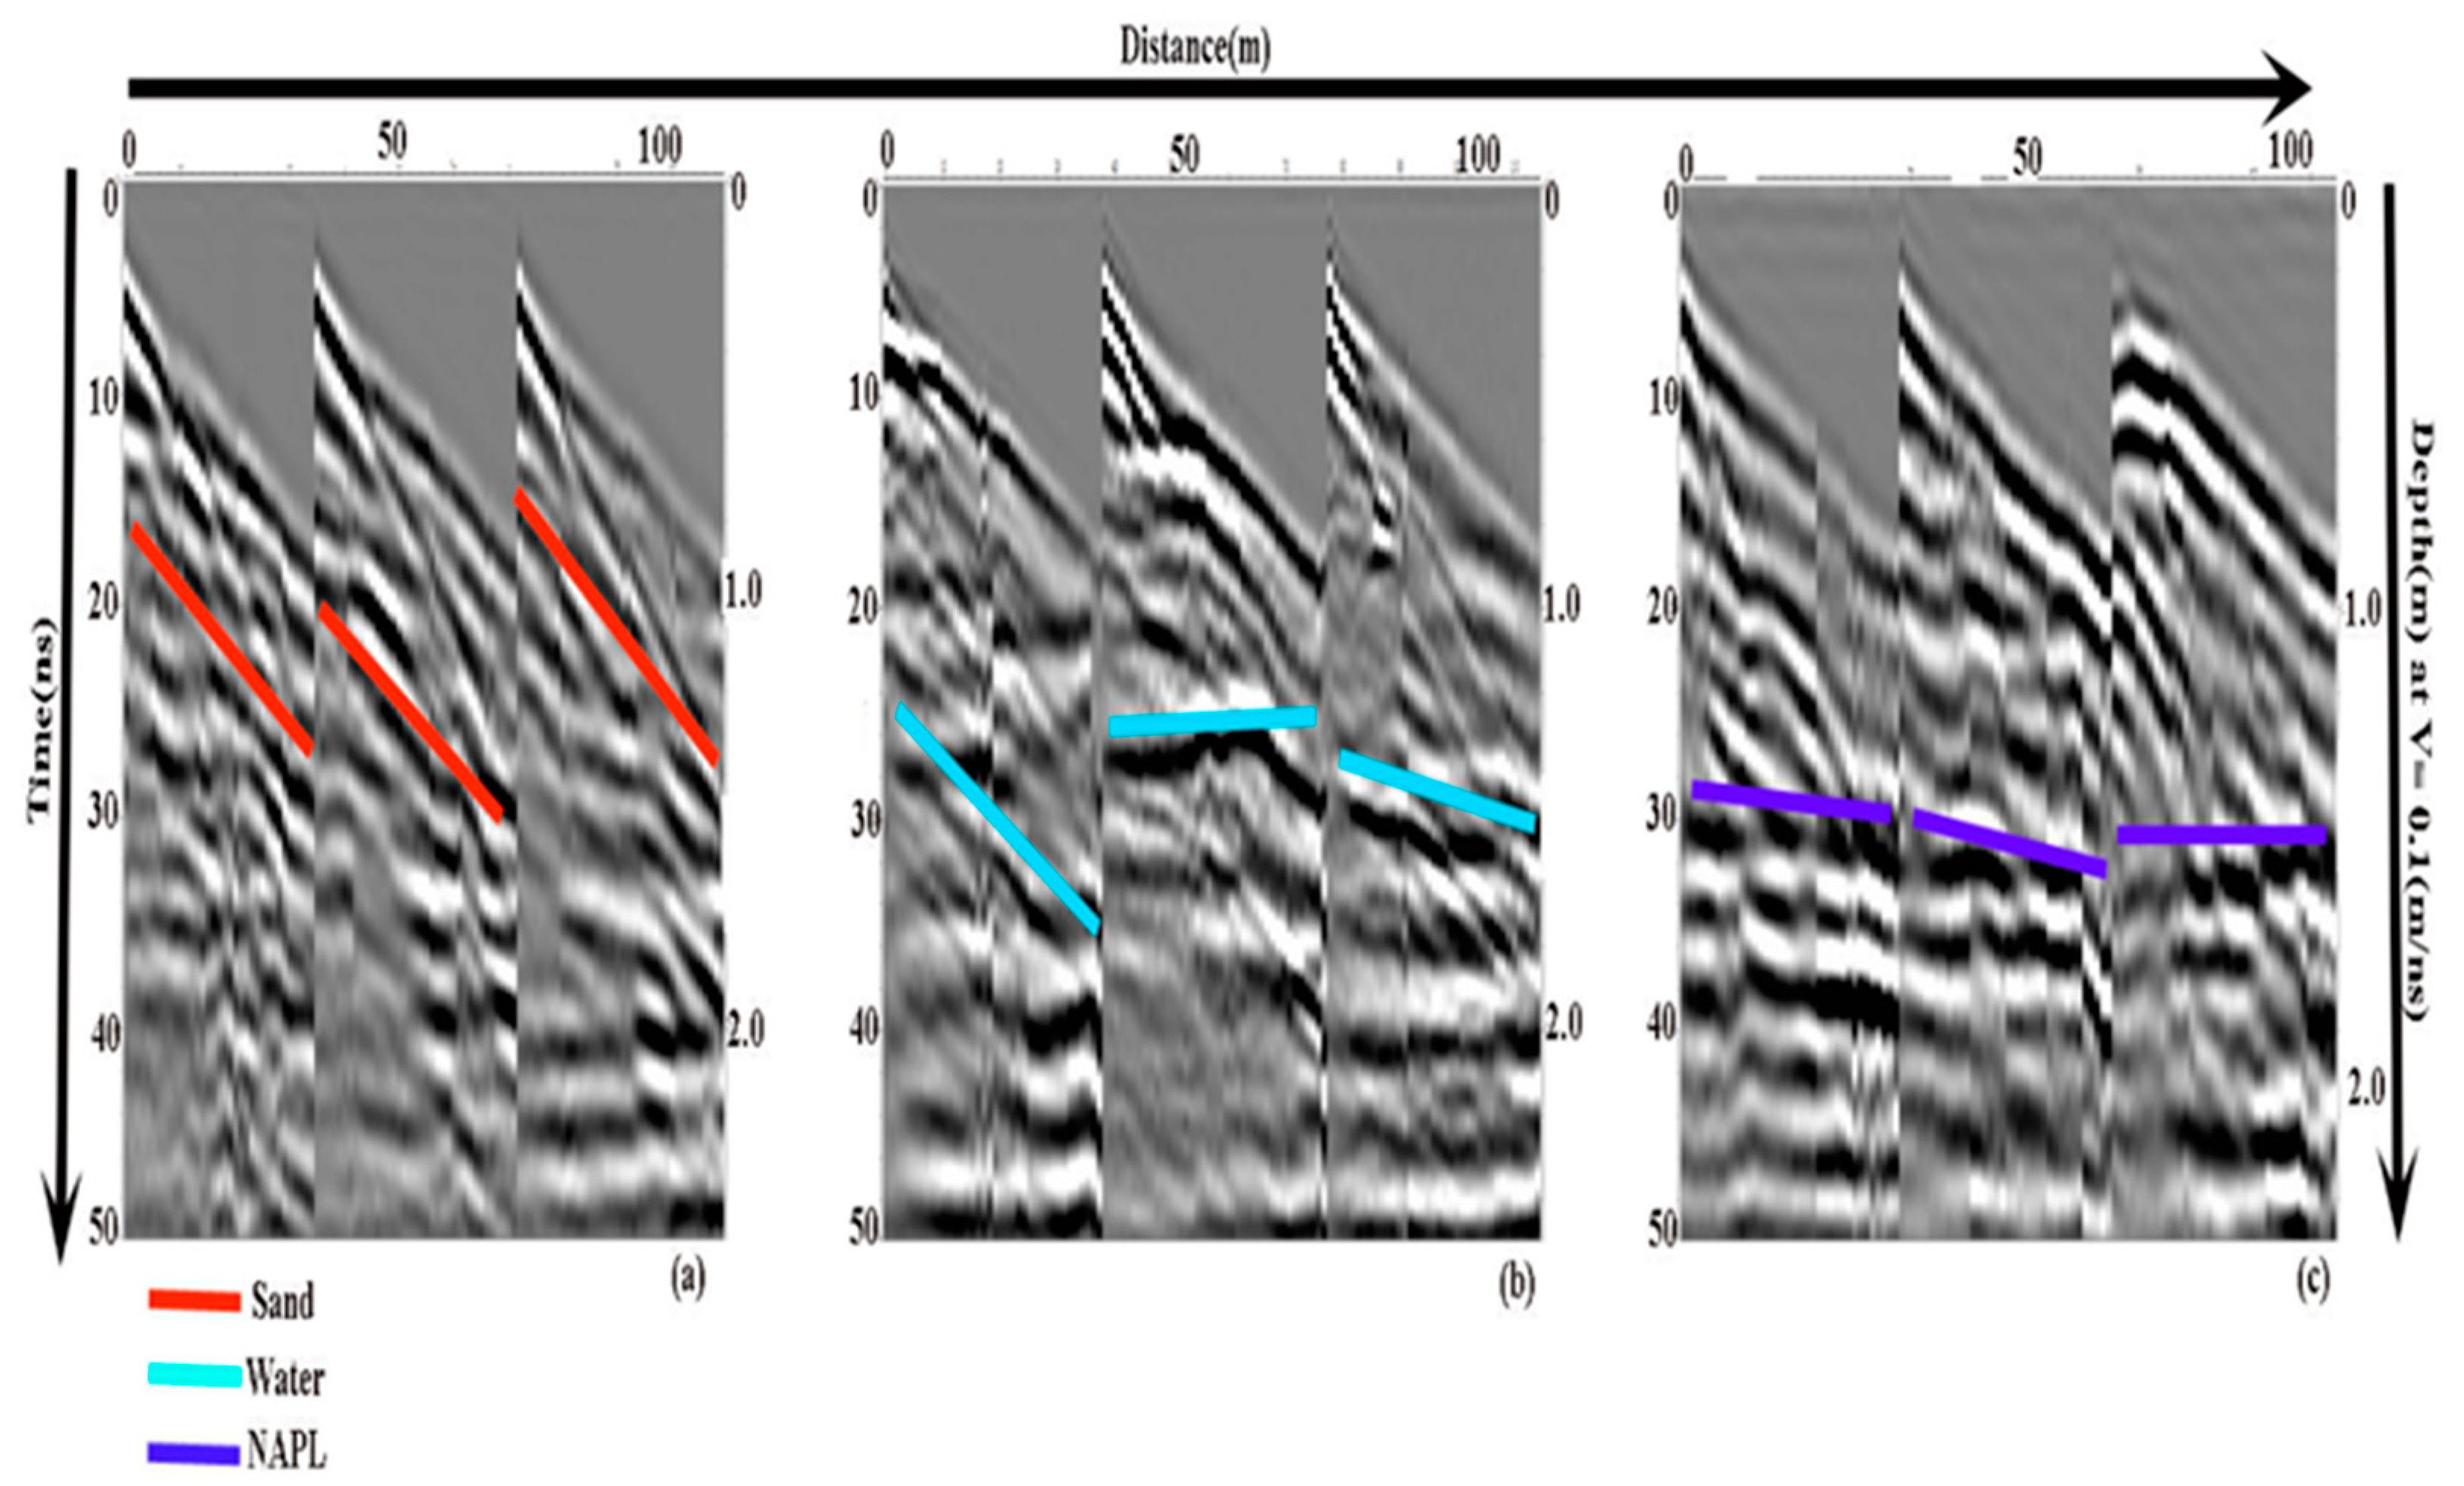
The three-component reflection pattern via FDTD modeling and experimental observation is shown in
Figure 7. We processed a two-stratum structure with a rough interface below the horizontal ground.
Individual reflection is the reflection of each material in one line. To determine the individual reflection of each material, we used frequency to identify the differences in the reflection patterns. First, we collected data from dry sand, and then of the sand with the intrusion of water and LNAPL. Clear differences in the reflection pattern of each data set were observed; the details of the reflection pattern are shown in
Figure 8. There are three parts (a, b, c): a is the reflection pattern of dry sand, while b is the reflection pattern when water was introduced and c is of water with intrusion of LNAPL. It was obvious from figure that there were significant differences in the reflection pattern with intrusion of LNAPL, which was another evidence of our theoretical proposal. AVO acquisition and processing enable us to determine the significant changes in reflection pattern of both seismic and GPR data. AVO analysis gives dim spots in the Seismic data processing in the presence of hydrocarbons, especially gas reservoirs; our technique proves that GPR AVO was a direct indication of LNAPL presence near the surface with change in reflection pattern.
3.2.2. Amplitude Response
Under controlled conditions, the acoustic seismic method and electromagnetic waves used in GPR, share equal properties [
18]. The primary properties of these sites that contain LNAPL contaminations [
19], but these studies did not include direct indication of NAPLs. Thus far, we have discussed the different cases of reflection pattern according to the proceedings of our work. Last, we discuss the complete validation of our theory and its validity and practicality, which may contribute significantly to the field of applied geophysics and environmental geophysics. This part is further divided into further two parts based on the different frequencies used, in order to avoid the ambiguities regarding the results.
Here we used the 500-MHz frequency plate for transmitting antenna and recorded the data in three phases. First, we collected the data of dry sand and acquired three-line data to cover the entire experimental tank.
Figure 9a is the illustration of the dry sand reflections. The AVO response is dim but easily observable as it is marked in figure. Then, we intruded the water over the area under consideration.
Figure 9b shows the clear reflections as marked in Figure, as we know that water will align itself along the interface so the AVO response is obvious. We adapted the same process with intrusion of LNAPL in the tank. Herein, we had a total of nine lines of data with two extra test lines. During processing through software, we combined the all lines, processed the data and marked the target area, which gave complete reflection pattern when compared to the area of sand and water in
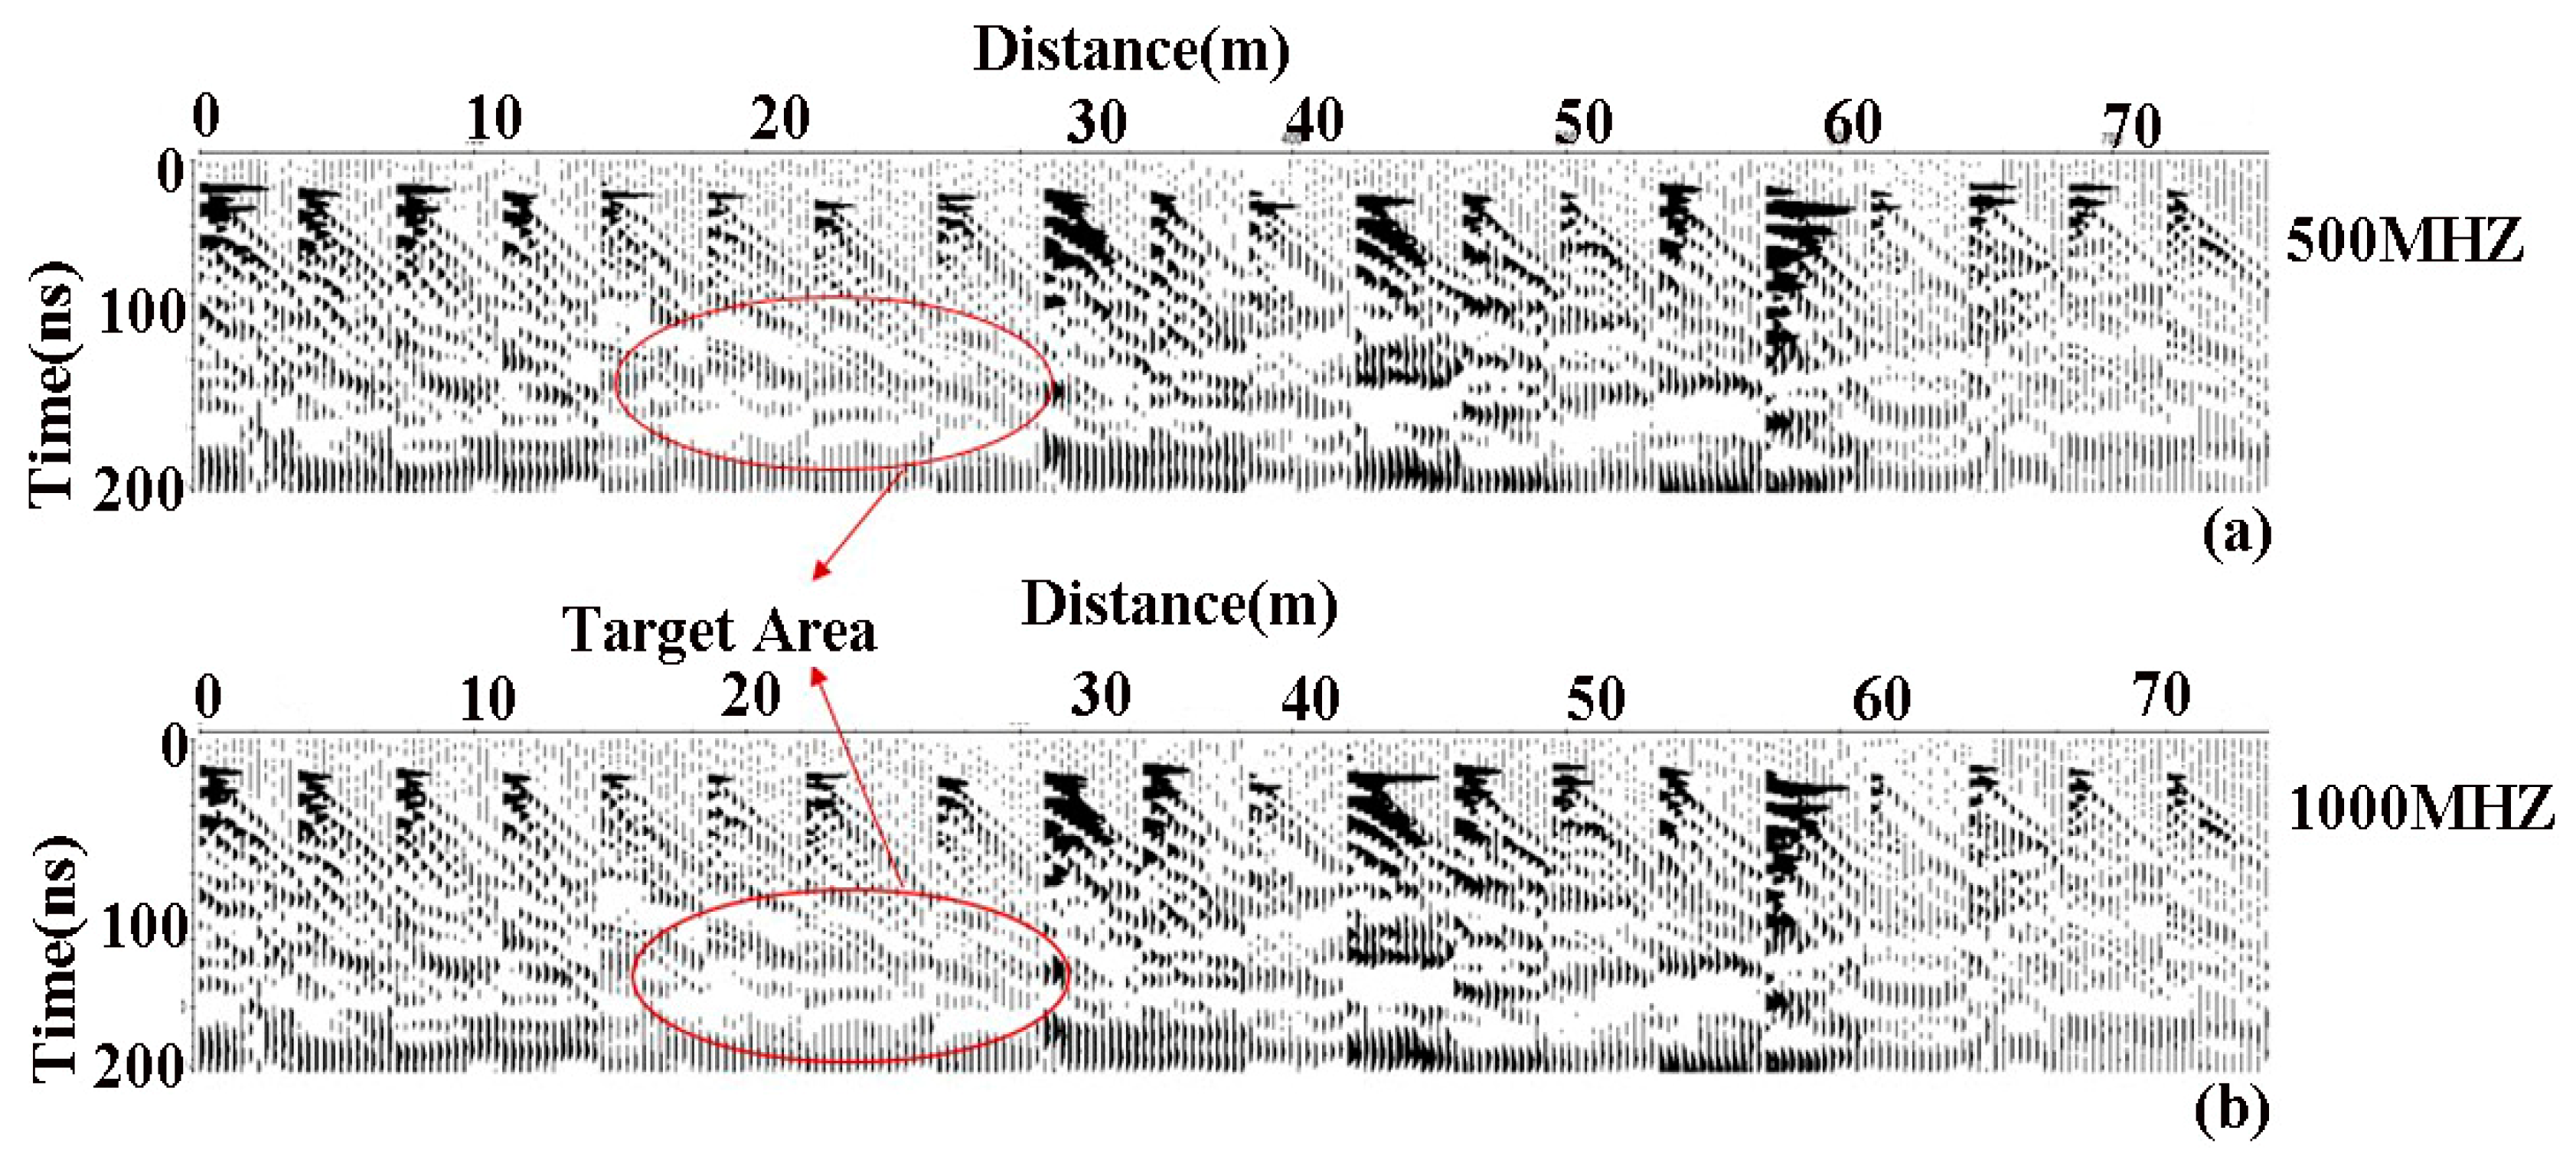
Figure 9c. The first image shows combining without migration, but still it has some effects in different reflection patterns. In contrast, the second image has clear evidence in dramatic change in reflection pattern of the target area. Here we can see that under the same constraints, the relative water content and NAPL can be conditional on the initial AVO responses in the radar detection profiles.
When migration is applied to the data, the reflection pattern becomes further obvious; it is easy to identify the contaminated site. Theoretically, migration is not possible because we deal with the coding along with introduction of frequency, different materials and other essential parameters. However, by physically processing the possible steps, we can make results more accurate and more reliable.
As it is established that with change in frequency the depth are effected means target area in total. Comparing these results with theoretical portion of our study, it is obvious that target area with presence of contamination (LNAPL) is entirely different from the two other portions. Moreover, as in the theoretical study, a change in reflection pattern (observed via the physical experiment) with frequency of 500 MHz was observed, which is in conformance with our theoretical studies.
To draw the conclusion, it was necessary to use variable frequencies, so the transmitting plate was changed to 1000-MHz frequency. It was necessary to do that because for the final comments we have proven that with intrusion of LNAPL, the reflection pattern changes with frequency. Procedure remained the same as that used for the 500-MHz frequency. It was taken into consideration that with the increase in frequency, the penetrating ability of EM waves decreases; consequently, the reflection amplitude must decrease as well. In case of low frequency, strong reflections are observed and vice versa. This was also the case in our study
Figure 10a–c. Despite the fact dim reflection patterns were obtained with increasing frequency, there is clear-cut evidence of changing reflection patterns, which is the main concern in our theoretical and physical studies in this research.
4. Discussion
The proposed symmetry method was compared to a few other methods, obtained by the well-known literature, particularly in [
5,
13]. Different frequencies like 500 MHZ and 1000 MHZ were attempted. Though the originally proposed numerical modeling does not consider any constraints on particular conditions or any penalization, it may be reinforced by a physical modeling optimization procedure as documented within the text.
The set of numerical and physical modeling and their symmetry enables the maximization of amplitude gain function. The second tool applied for comparison purposes was FFT simulation method using GPR_Max. Those two different approaches at the same field conditions provided almost similar results, which allowed the assumption that their results were reliable. Thus, using them for comparison purpose was rational. The very interesting fact about water contamination is that it tends to float on the surface—below or on the water table. With this period, the simulated models could be considered as a worst-case scenario yet the time-varying state controller enables to deal with such situation in an appropriate way. The comparison of theoretical and physical modeling was done in a qualitative technical sense. A thorough literature study performed by the authors of this work showed that no similar solutions had been applied so far—and that the obtained result were satisfactory and improved the area of study.
5. Conclusions
AVO analysis was a technique for direct indication of hydrocarbons in water aquifers and groundwater. Therefore, it was first theoretically proposed and proved that GPR AVO could be a direct indicator of water-contaminated sites, especially the areas having LNAPL contamination. Moreover, in theoretical portion, the primary concern was the determination of changes in the reflection patterns with intrusion of different materials in the water. Amplitude variation with offset method is very effective for detecting low-density NAPLs. However, it has some limitations when used for wet soils and greater depths. The values of relative permittivity decrease with increased depth due to a decreased penetration of the LNAPL; at depths of more than 10 m, larger antenna separation is required. The bright spots that are anticipated when there is presence of contaminants in the water which affect the reflection coefficients of deeper layers such as the water table, were examined. This research indicated that the partial collapse of the capillary fringe due to LNAPL wetting the soil grains would increase the difference in reflection coefficients between non-impacted and impacted scenarios. Therefore, the collapse of the capillary fringe could increase the ability to detect LNAPL.
Finally, the physical and theoretical models indicate that bright spots and phase changes are anticipated when LNAPL is pooled on a clay capillary barrier. However, the use of AVO analysis methods for the detection of residual NAPL in the saturated zone is dependent upon LNAPL saturation values and dielectric properties of lower interfaces. In this study, we found strong evidence that while detecting low conductive NAPL, reflection patterns differed for different materials like sand and water. This was proved herein—first theoretically, and then practically via laboratory experiments. Experimental analyses showed that the result were true for variable frequencies. If the frequency were to decrease below 500 MHz, we may get results that are more accurate. As we obtained better resulted with 500 MHz when compared to the 1000-MHz frequency. Relative permittivity was a conclusive evidence of the presence of LNAPL in the subsurface, whereas reflection pattern confirms its presence. Hence, if LNAPL is detected easily using GPR AVO analysis, several diseases could be avoided that are caused due to water contamination by LNAPLs. Reflection pattern behavior was of primary concern in our study, and it was shown that changes in reflection pattern were a direct indication of contaminated sites.
Author Contributions
Conceptualization, I.I. and G.T.; software, I.I. and Y.L. (Yu Liu); validation, G.T. and W.Z.; formal analysis, Z.M.; investigation, Z.W.; resources, G.T. and Z.W.; data curation, I.I.; writing—original draft preparation, I.I.; writing—review and editing, G.T.; visualization, W.Z.; supervision, G.T.; project administration, G.T.; funding acquisition, W.Z. and Y.L. (Yong Li). All authors have read and agreed to the published version of the manuscript
Funding
This research was supported by the Funds from the Key Laboratory of Geophysical Electromagnetic Probing Technologies of Ministry of Natural Resources (KLGEPT201901) and the Research Funding of School of Earth Sciences at Zhejiang University.
Conflicts of Interest
The authors declare no conflict of interest.
References
- Bradford, J.H. Frequency-dependent attenuation analysis of ground-penetrating radar data. Geophysics 2007, 72, J7–J16. [Google Scholar] [CrossRef]
- Bradford, J.H.; Deeds, J.C. Ground-penetrating radar theory and application of thin-bed offset-dependent reflectivity. Geophysics 2006, 71, K47–K57. [Google Scholar] [CrossRef]
- Hammon, W.S., III; McMechan, G.A.; Zeng, X. Forensic GPR: Finite-difference simulations of responses from buried human remains. J. Appl. Geophys. 2000, 45, 171–186. [Google Scholar] [CrossRef]
- Sander, K.A.; Olhoeft, G.R.; Lucius, J.E. Surface and borehole radar monitoring of a DNAPL spill in 3D versus frequency, look angle and time. In Proceedings of the 5th EEGS Symposium on the Application of Geophysics to Engineering and Environmental Problems, Oakbrook, IL, USA, 26–29 April 1992; p. cp-210. [Google Scholar]
- Brewster, M.L.; Annan, A.P. Ground-penetrating radar monitoring of a controlled DNAPL release; 200 MHz radar. Geophysics 1994, 59, 1211–1221. [Google Scholar] [CrossRef]
- Aldieri, L.; Kotsemir, M.; Vinci, C.P. Environmental innovations and productivity: Empirical evidence from Russian regions. Resour. Policy 2019, 101444. [Google Scholar] [CrossRef]
- Aldieri, L.; Kotsemir, M.; Vinci, C.P. The role of environmental innovation through the technological proximity in the implementation of the sustainable development. Bus. Strategy Environ. 2020, 29, 493–502. [Google Scholar] [CrossRef]
- Bano, M. Constant dielectric losses of ground-penetrating radar waves. Geophys. J. Int. 1996, 124, 279–288. [Google Scholar] [CrossRef]
- Jordan, T.E.; Baker, G.S. A conceptual model for the detection of NAPL using amplitude and phase variation with offset (APVO) analysis of ground penetrating radar data. In Proceedings of the 15th EEGS Symposium on the Application of Geophysics to Engineering and Environmental Problems, Las Vegas, NV, USA, 10–14 February 2002; p. cp-191. [Google Scholar]
- Baker, G.S. Applying AVO analysis to GPR data. Geophys. Res. Lett. 1998, 25, 397–400. [Google Scholar] [CrossRef]
- Castagna, J.P.; Backus, M.M. Offset-Dependent Reflectivity—Theory and Practice of AVO Analysis; Society of Exploration Geophysicists: Tulsa, OK, USA, 1993. [Google Scholar]
- Annan, A.P. Electromagnetic Principles of Ground Penetrating Radar; Elsevier: Amsterdam, The Netherlands, 2009; Volume 1. [Google Scholar]
- Giannopoulos, A. Modelling ground penetrating radar by GprMax. Constr. Build. Mater. 2005, 19, 755–762. [Google Scholar] [CrossRef]
- Sandring, F.; Allroggen, N.; Tronicke, J. A physical modeling study to analyze the horizontal resolution limits of GPR reflection imaging. In Proceedings of the 2017 9th International Workshop on Advanced Ground Penetrating Radar (IWAGPR), Edinburgh, UK, 28–30 June 2017; pp. 1–5. [Google Scholar]
- Iqbal, I.; Tian, G.; Liu, Y.; UsmanKhan, M. Theoretical Investigation of Low Conductive NAPL Using (AVO) Analysis of GPR Data. In Signal Processing in Geophysics; Zhejiang Signal Processing Society: Zhejiang, China, 2018. [Google Scholar]
- Kana, A.A.; West, L.J.; Clark, R.A. Fracture aperture and fill characterization in a limestone quarry using GPR thin-layer AVA analysis. Near Surf. Geophys. 2013, 11, 293–306. [Google Scholar] [CrossRef]
- White, W.B. Hydrogeology of karst aquifers. In Encyclopedia of Caves; Culver, S.E., Ed.; Academic Press: Amsterdam, The Netherlands, 2012; pp. 383–391. [Google Scholar]
- Fisher, E.; McMechan, G.A.; Annan, A.P. Acquisition and processing of wide-aperture ground-penetrating radar data. Geophysics 1992, 57, 495–504. [Google Scholar] [CrossRef]
- Ajo-Franklin, J.B.; Geller, J.T.; Majer, E.L.; Peterson, J.E.; Williams, K.H.; Harris, J.M. Preliminary characterization of a napl-contaminated site using borehole geophysical techniques. In Proceedings of the 16th EEGS Symposium on the Application of Geophysics to Engineering and Environmental Problems, San Antonio, TX, USA, 6–10 April 2003; p. cp-190. [Google Scholar]
Figure 1.
Complete theoretical model display of sand, sand with water and sand with water and light non-aqueous phase liquids (LNAPL) using GPR Max2D. Black dotted lines are present due to the non-aqueous ability of contamination.
Figure 1.
Complete theoretical model display of sand, sand with water and sand with water and light non-aqueous phase liquids (LNAPL) using GPR Max2D. Black dotted lines are present due to the non-aqueous ability of contamination.
Figure 2.
Experimental setup for the GPR amplitude variations with offset analysis (AVO) data acquisition which contains transmitting and receiving antennas containing frequency plates with frequencies of 500 MHZ and 1000 MHZ. A vector network analyzer used to detect the pulses and display used to show the wiggle form of the data.
Figure 3.
Processing data display using 500-MHz and 1000-MHz frequencies containing (a,d) dry sand, (b,e) sand with water and (c,f) sand with water and intrusion of LNAPL, respectively, of the target area in the experimental tank.
Figure 3.
Processing data display using 500-MHz and 1000-MHz frequencies containing (a,d) dry sand, (b,e) sand with water and (c,f) sand with water and intrusion of LNAPL, respectively, of the target area in the experimental tank.
Figure 4.
Flow chart of the GPR AVO data processing that contains basic, advance processing, and interpretation of the final visualization of GPR data.
Figure 4.
Flow chart of the GPR AVO data processing that contains basic, advance processing, and interpretation of the final visualization of GPR data.
Figure 5.
(a) Response of numerical model when only sand was introduced during simulation using GPR Max2D; (b) response of numerical model when water is introduced in the model in the presence of sand during simulation using GPR Max2D; (c) response of numerical model when LNAPL is introduced in the model in the presence of sand and water during simulation using GPR Max2D.
Figure 6.
Trend of relative permittivity with the depth. (1) Portion where only sand is present; (2) portion with intrusion of water along with the sand; (3) portion with sand within water and NAPL.
Figure 6.
Trend of relative permittivity with the depth. (1) Portion where only sand is present; (2) portion with intrusion of water along with the sand; (3) portion with sand within water and NAPL.
Figure 7.
Three- reflection pattern of target area using 500-MHZ and 1000-MHz frequencies of GPR AVO data, whole figure is combination of all three components that are sand, sand with water and sand with NAPL intrusion only the area which contains the contamination is marked as target area.
Figure 7.
Three- reflection pattern of target area using 500-MHZ and 1000-MHz frequencies of GPR AVO data, whole figure is combination of all three components that are sand, sand with water and sand with NAPL intrusion only the area which contains the contamination is marked as target area.
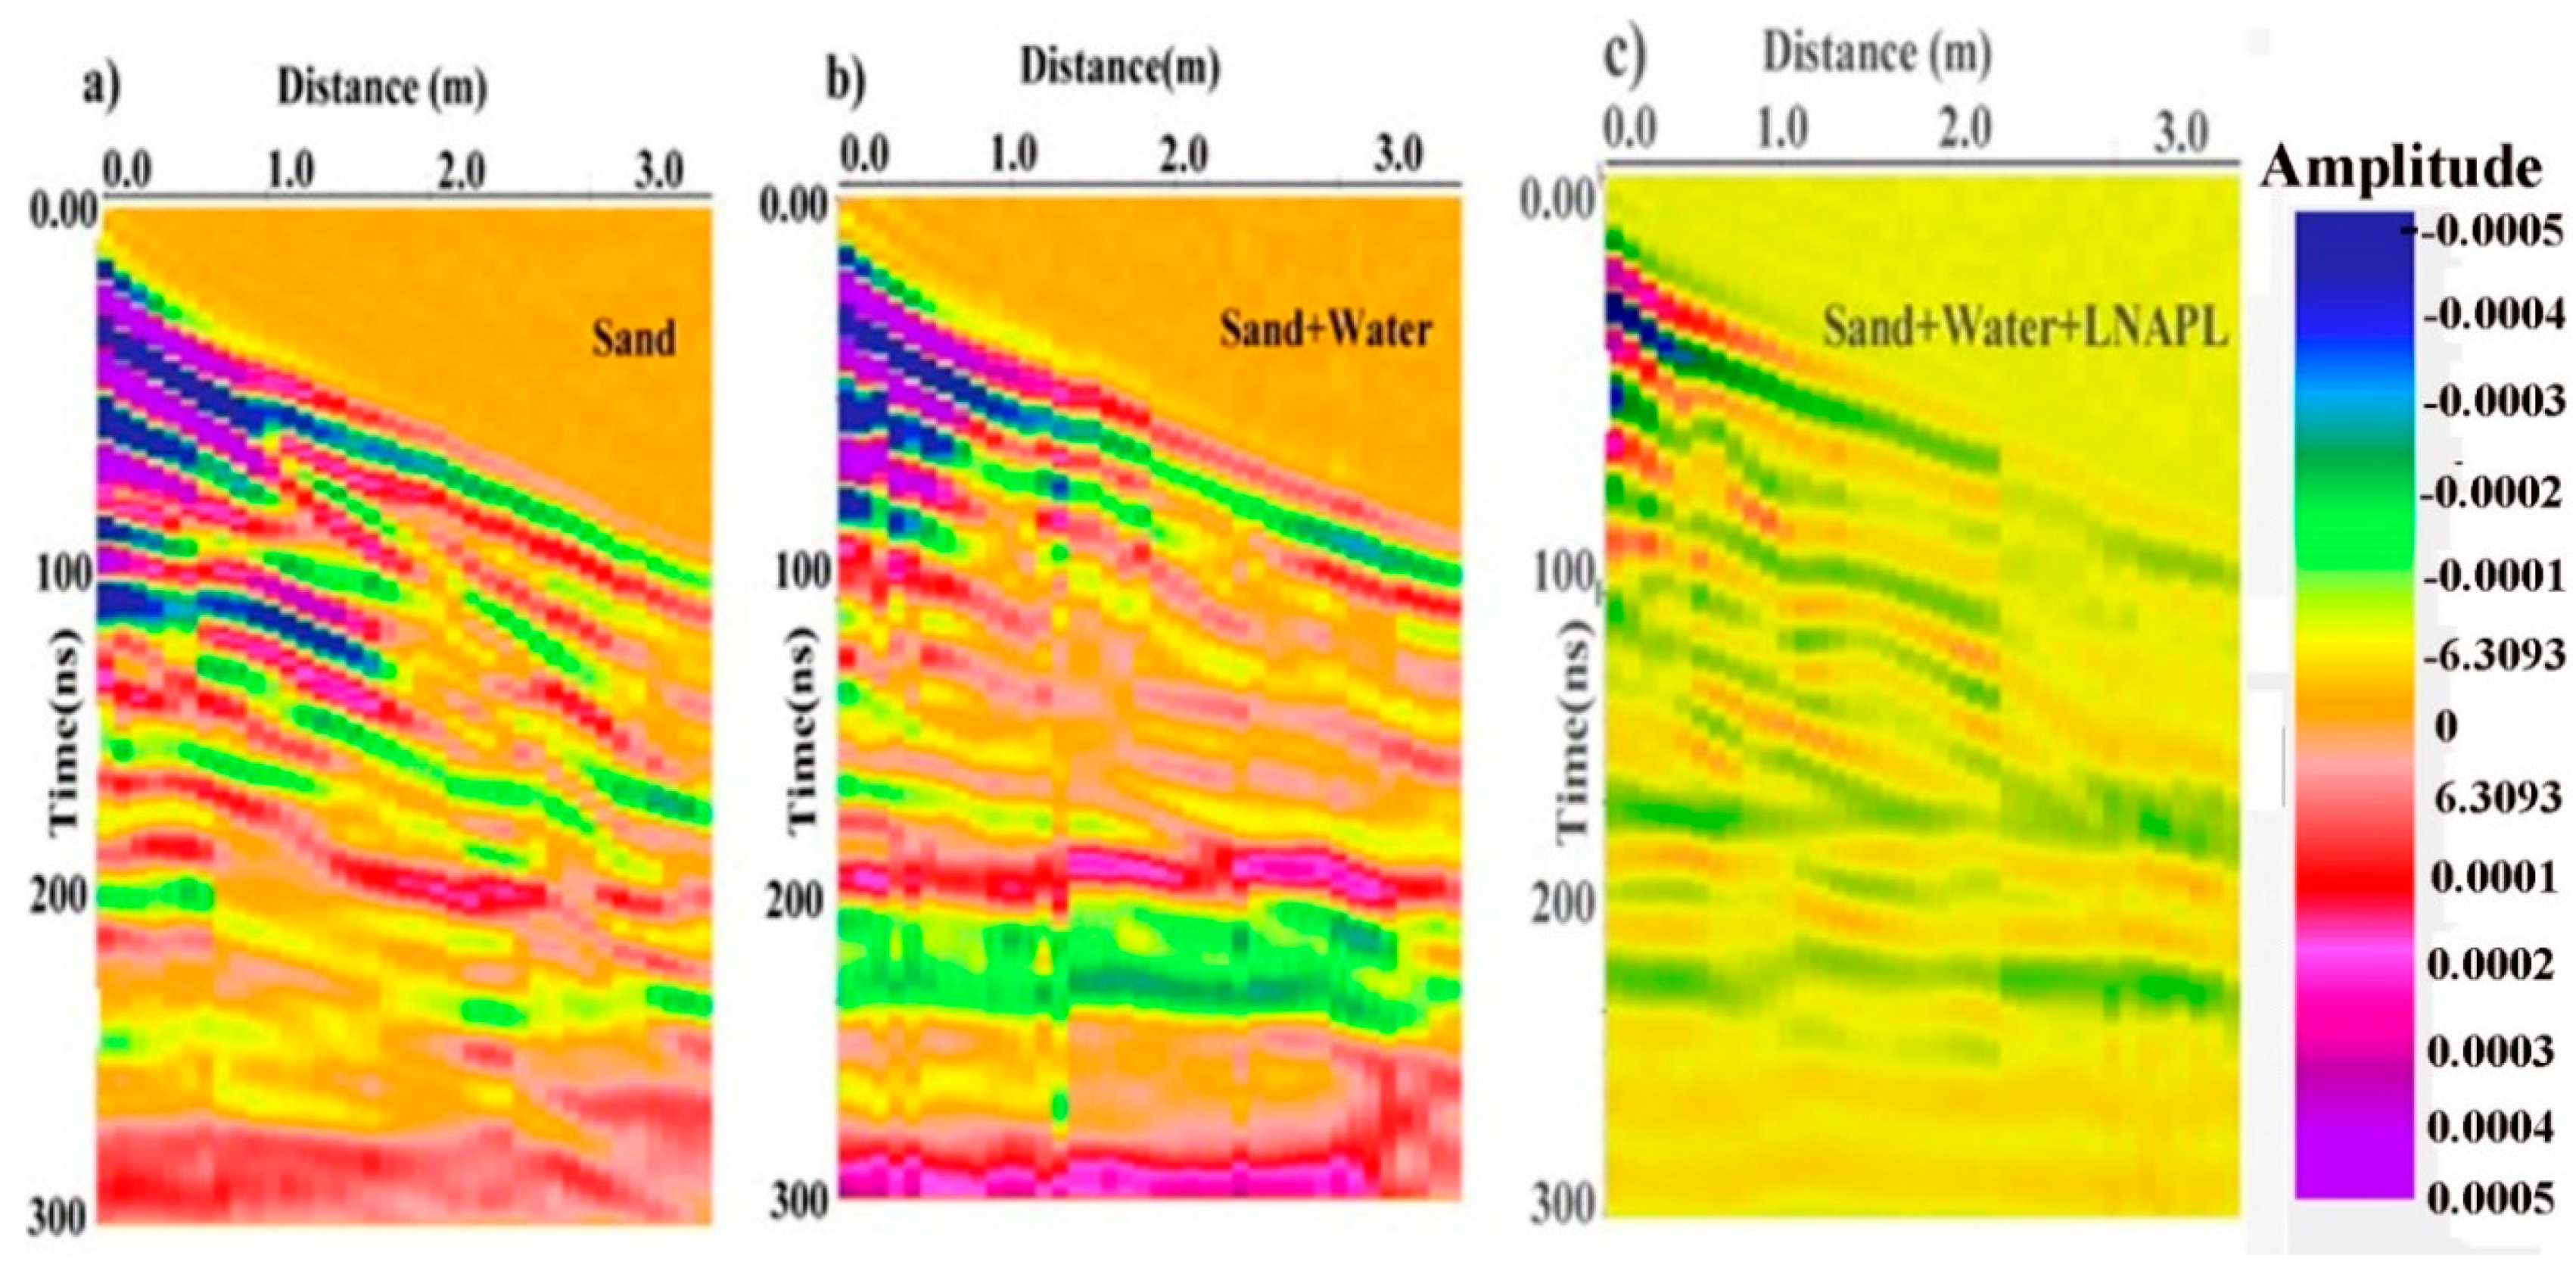
Figure 8.
Individual reflection pattern of target area using 500-MHz frequency of GPR AVO data with complete color scale which shows the amplitude jump in the reflection pattern with intrusion of different materials.
Figure 8.
Individual reflection pattern of target area using 500-MHz frequency of GPR AVO data with complete color scale which shows the amplitude jump in the reflection pattern with intrusion of different materials.
Figure 9.
(a) Pre-migration combined reflection pattern of 9-line data using 500 MHz of GPR AVO data for the dry sand and AVO response; (b) post-migration combined reflection pattern of 9-line data using 500 MHz of GPR AVO data with intrusion of water for AVO response; (c) post-migration combined reflection pattern of 9-line data using 500 MHz of GPR AVO data with intrusion of water and LNAPL for AVO response.
Figure 10.
(a) Pre-migration combined reflection pattern of 9-line data using 1000-MHz GPR for sand to show the AVO response; (b) post-migration combined reflection pattern of 9-line data using 1000 MHz for water intrusion in sand for AVO response; (c) post-migration combined reflection pattern of 9-line data using 1000 MHz for water and NAPL intrusion in sand for AVO response.
Table 1.
Modeling parameters used to calculate model by ground-penetrating radar (GPR) Max-2D.
Table 1.
Modeling parameters used to calculate model by ground-penetrating radar (GPR) Max-2D.
| Modeling Parameters | Values |
|---|
| Domain (x, y, z) | 0.250 × 0.187 × 0.183 (m) |
| Spatial resolution (x, y, z) | 0.003 × 0.003 × 0.003 (m) |
| Temporal resolution | 3.852 × 10 × 10−9 |
| Time window | 8 × 10⁻⁹ |
| Theoretical offset | 1 m |
| Step size | 0.00 |
| sampling interval | 0.01 m |
| Surface roughness (about mean height) | 0.01 m |
Table 2.
GPR data acquisition parameters.
Table 2.
GPR data acquisition parameters.
| Parameters | Values |
|---|
| System frequencies | 500 MHZ 1000 MHZ |
| Total length of tank | 10 m |
| Total width of tank | 04 m |
| Time increment | 01 ns |
| Offset | 0.2 m |
| Line spacing | 1.5 m |
| Number of lines | 20 |
| Recording time | 500 ns |
| Sampling interval | 0.2 m |
© 2020 by the authors. Licensee MDPI, Basel, Switzerland. This article is an open access article distributed under the terms and conditions of the Creative Commons Attribution (CC BY) license (http://creativecommons.org/licenses/by/4.0/).

 ,
, 


