1. Introduction
Information published on social media is often meant to gain the attention of other users. On Twitter, one of the most widely used social media platforms at the time of writing this paper [
1], whether published information successfully gains attention can be assessed by several measures, such as replies, likes or retweets. Petrovic et al. [
2] have demonstrated that humans can predict, with a certain probability, whether a given tweet will receive a substantial response. Indeed, some researchers [
3] still use human coding for tweet classification. However, much effort is committed to automating Twitter-related predictions.
Table 1 provides a brief review of selected work on the automated prediction of responses to tweets. Similar to Cotelo et al. [
4], many authors have explored the integration of the textual and structural information available in each tweet. Suh et al. [
5] have conducted a large-scale investigation of tweet features responsible for tweet popularity, and have explored the relationships among these variables by using a generalized linear model. Some studies have focused on modeling “cascades of retweets,” i.e., the number of retweets over time. Gao et al. [
6] has used a general reinforced Poisson process model that is fed data on the number of retweets over time. Kupavskii et al. [
7] has used a gradient boosting decision tree model, fed with various structured features, including social and content features, as well as time-sensitive features of the initial tweet publisher, along with the “infected nodes,” i.e., users who “retweeted” the initial news. A study by Cheng et al. [
8] has investigated many linear and non-linear classifiers and features regarding news content, including image analysis, “root” features of the publisher of the original tweet, features of users who re-shared a given tweet, and structural and time-dependent features. In Zhao et al. [
9], no features were used; instead, only information regarding the number of retweets overtime was fed into a self-exciting point processes model.
Researchers have also pursued the more challenging goal of predicting the total replies that a tweet will receive before publication. Petrovic et al. [
2] has investigated a passive-aggressive algorithm, including social features, such as those reflecting the publishing user, along with tweet features that “encompass various statistics of the tweet itself, along with the actual text of the tweet.” A generalized linear model fed only structural features, such as “contains hashtags” or “contains URL,” is used in Suh et al. [
5]. In Jenders et al. [
10], a generalized linear model and naive Bayes models are fed a structured tweet and user features, such as the sentiment of the tweet, tweet length, number of mentions, number of hashtags, number of followers, emotional divergence and number of URLs. A random forest (RF) classifier model was adopted in Oliveira et al. [
11], which also benefited from the inclusion of structured user and tweet features, such as the number of hashtags, URLs, mentions, tweet length, number of words, whether the tweet is a reply, the hour of the tweet’s timestamp, the number of images and videos, and the sentiment of the tweet. Hong et al. [
12] have used a logistic regression model fed user features, such as the number of retweets of a given account and content features extracted through slightly more sophisticated methods, including Term Frequency–Inverse Document Frequency (TF-IDF) analysis of the terms used in the tweet text, and Latent Dirichlet Allocation topic distribution analysis. The paper also briefly mentions many other features. Zhang et al. [
15] used a support vector machine model and fed it various structured user and tweet features, such as the number of followers, friends, past tweets, favorites, number of times the user was listed, age of account, user activity, user screen name length, the verification status of the user, average number of followers gained from a tweet, average number of times a user was listed through a tweet, number of URLs, hashtags, mentions, words, characters, whether the tweet was a reply, whether the tweet had been retweeted previously, and the time at which the tweet was published.
For some specific applications, such as detecting spamming accounts [
16], even more structured user features, such as the URL rate and the interaction rate, are believed to be highly informative. Interestingly, a recent study [
14] has reversed the prediction logic and based the analysis on replies, but this approach struggled to predict the popularity of the original source tweet. Importantly, this study used complex Deep Learning Language Modeling to automatically extract content feature vectors from tweets, rather than using hand-selected features.
Also, a different trend in the research community focusing its effort on Twitter data is worth mentioning, specifically, that which addresses the detection of events in Twitter using wavelet-based analysis. For example, one of the works representing this approach introduced EDCoW (Event Detection with Clustering of Wavelet-based Signals) [
17], and demonstrated that detecting events through news spreading in Twitter is feasible with the proposed method.
Given the abundance of structural tweet features used by various authors, it is understandable that many works, like Keib et al. [
3], Cotelo et al. [
4] and Jenders et al. [
10], struggled to identify which of these features influence the predictive capabilities of trained models, and to what extent. In this context, owing to the revived interest in explainable artificial intelligence (XAI) after “explainability winter” [
18], it is possible that exploiting new interpretability techniques could be beneficial.
Our research aimed to compare selected machine learning classifiers fed with structured tweet features, and features extracted with the recently developed Deep Learning Language Models (LMs), for predicting the total number of replies to tweets published by @USNavy, the official US Navy account. For each tweet, we accounted for only the information available before publishing. We also wished to demonstrate how a recently introduced XAI tool can be leveraged to improve the understanding of the importance of structural features, and not features provided by Deep Learning LMs. Finally, in order to provide information valuable from an ML practitioners’ perspective, we also give insight into the computation times of deployed methods.
We believe that our choice of data source, namely a single Twitter account, is beneficial for Natural Language Processing (NLP) practitioners who, while working for an entity owning a Twitter account, are obliged to predict responses to a future tweet by this entity. In our study, the selection of the particular @USNavy account was dictated by the funding source of our research specified in the funding section. We also hope that the small size of the here-analyzed training data sample can be perceived as informative if a question is posed: is a small number of available historical tweets from my organization an issue in the application of the here-described methods? Because unstructured tweet text is written in a highly specific manner, numerous studies [
19,
20,
21,
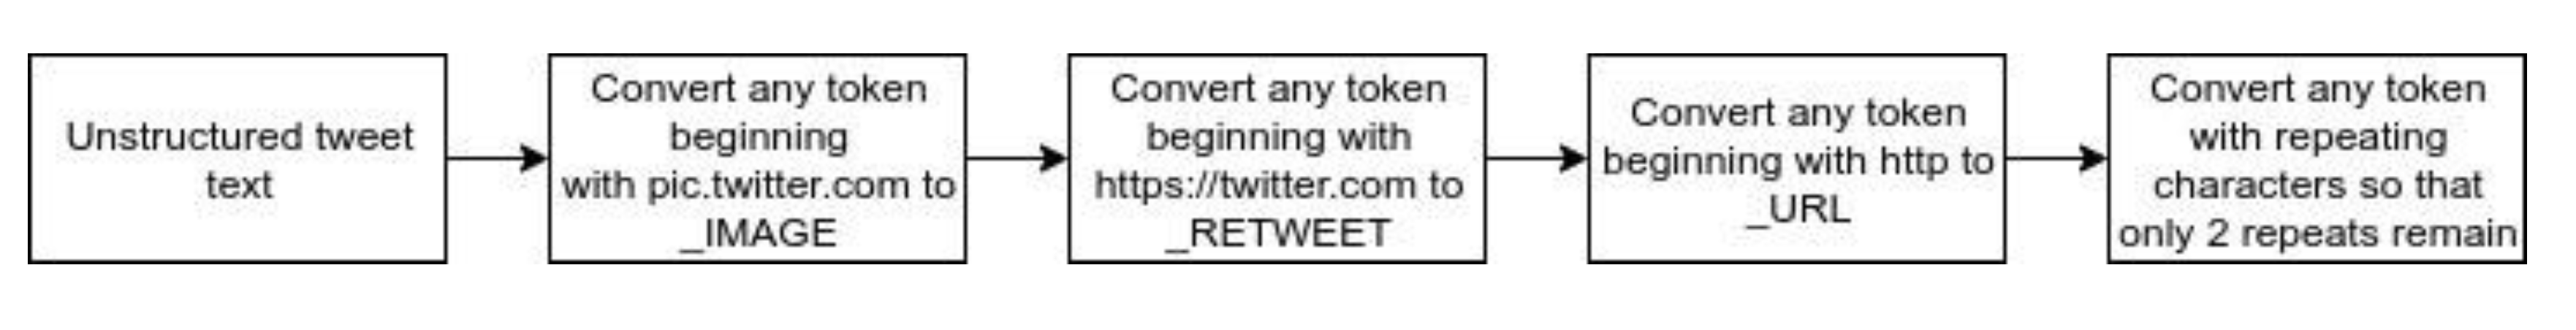
22] have used tools from the NLP field and proposed tweet-filtering techniques before addressing the machine learning task. Our work benefitted from such tweet pre-processing concepts; however, given the high quality of the language used by the official US Navy account, we defined our own simplified approach.
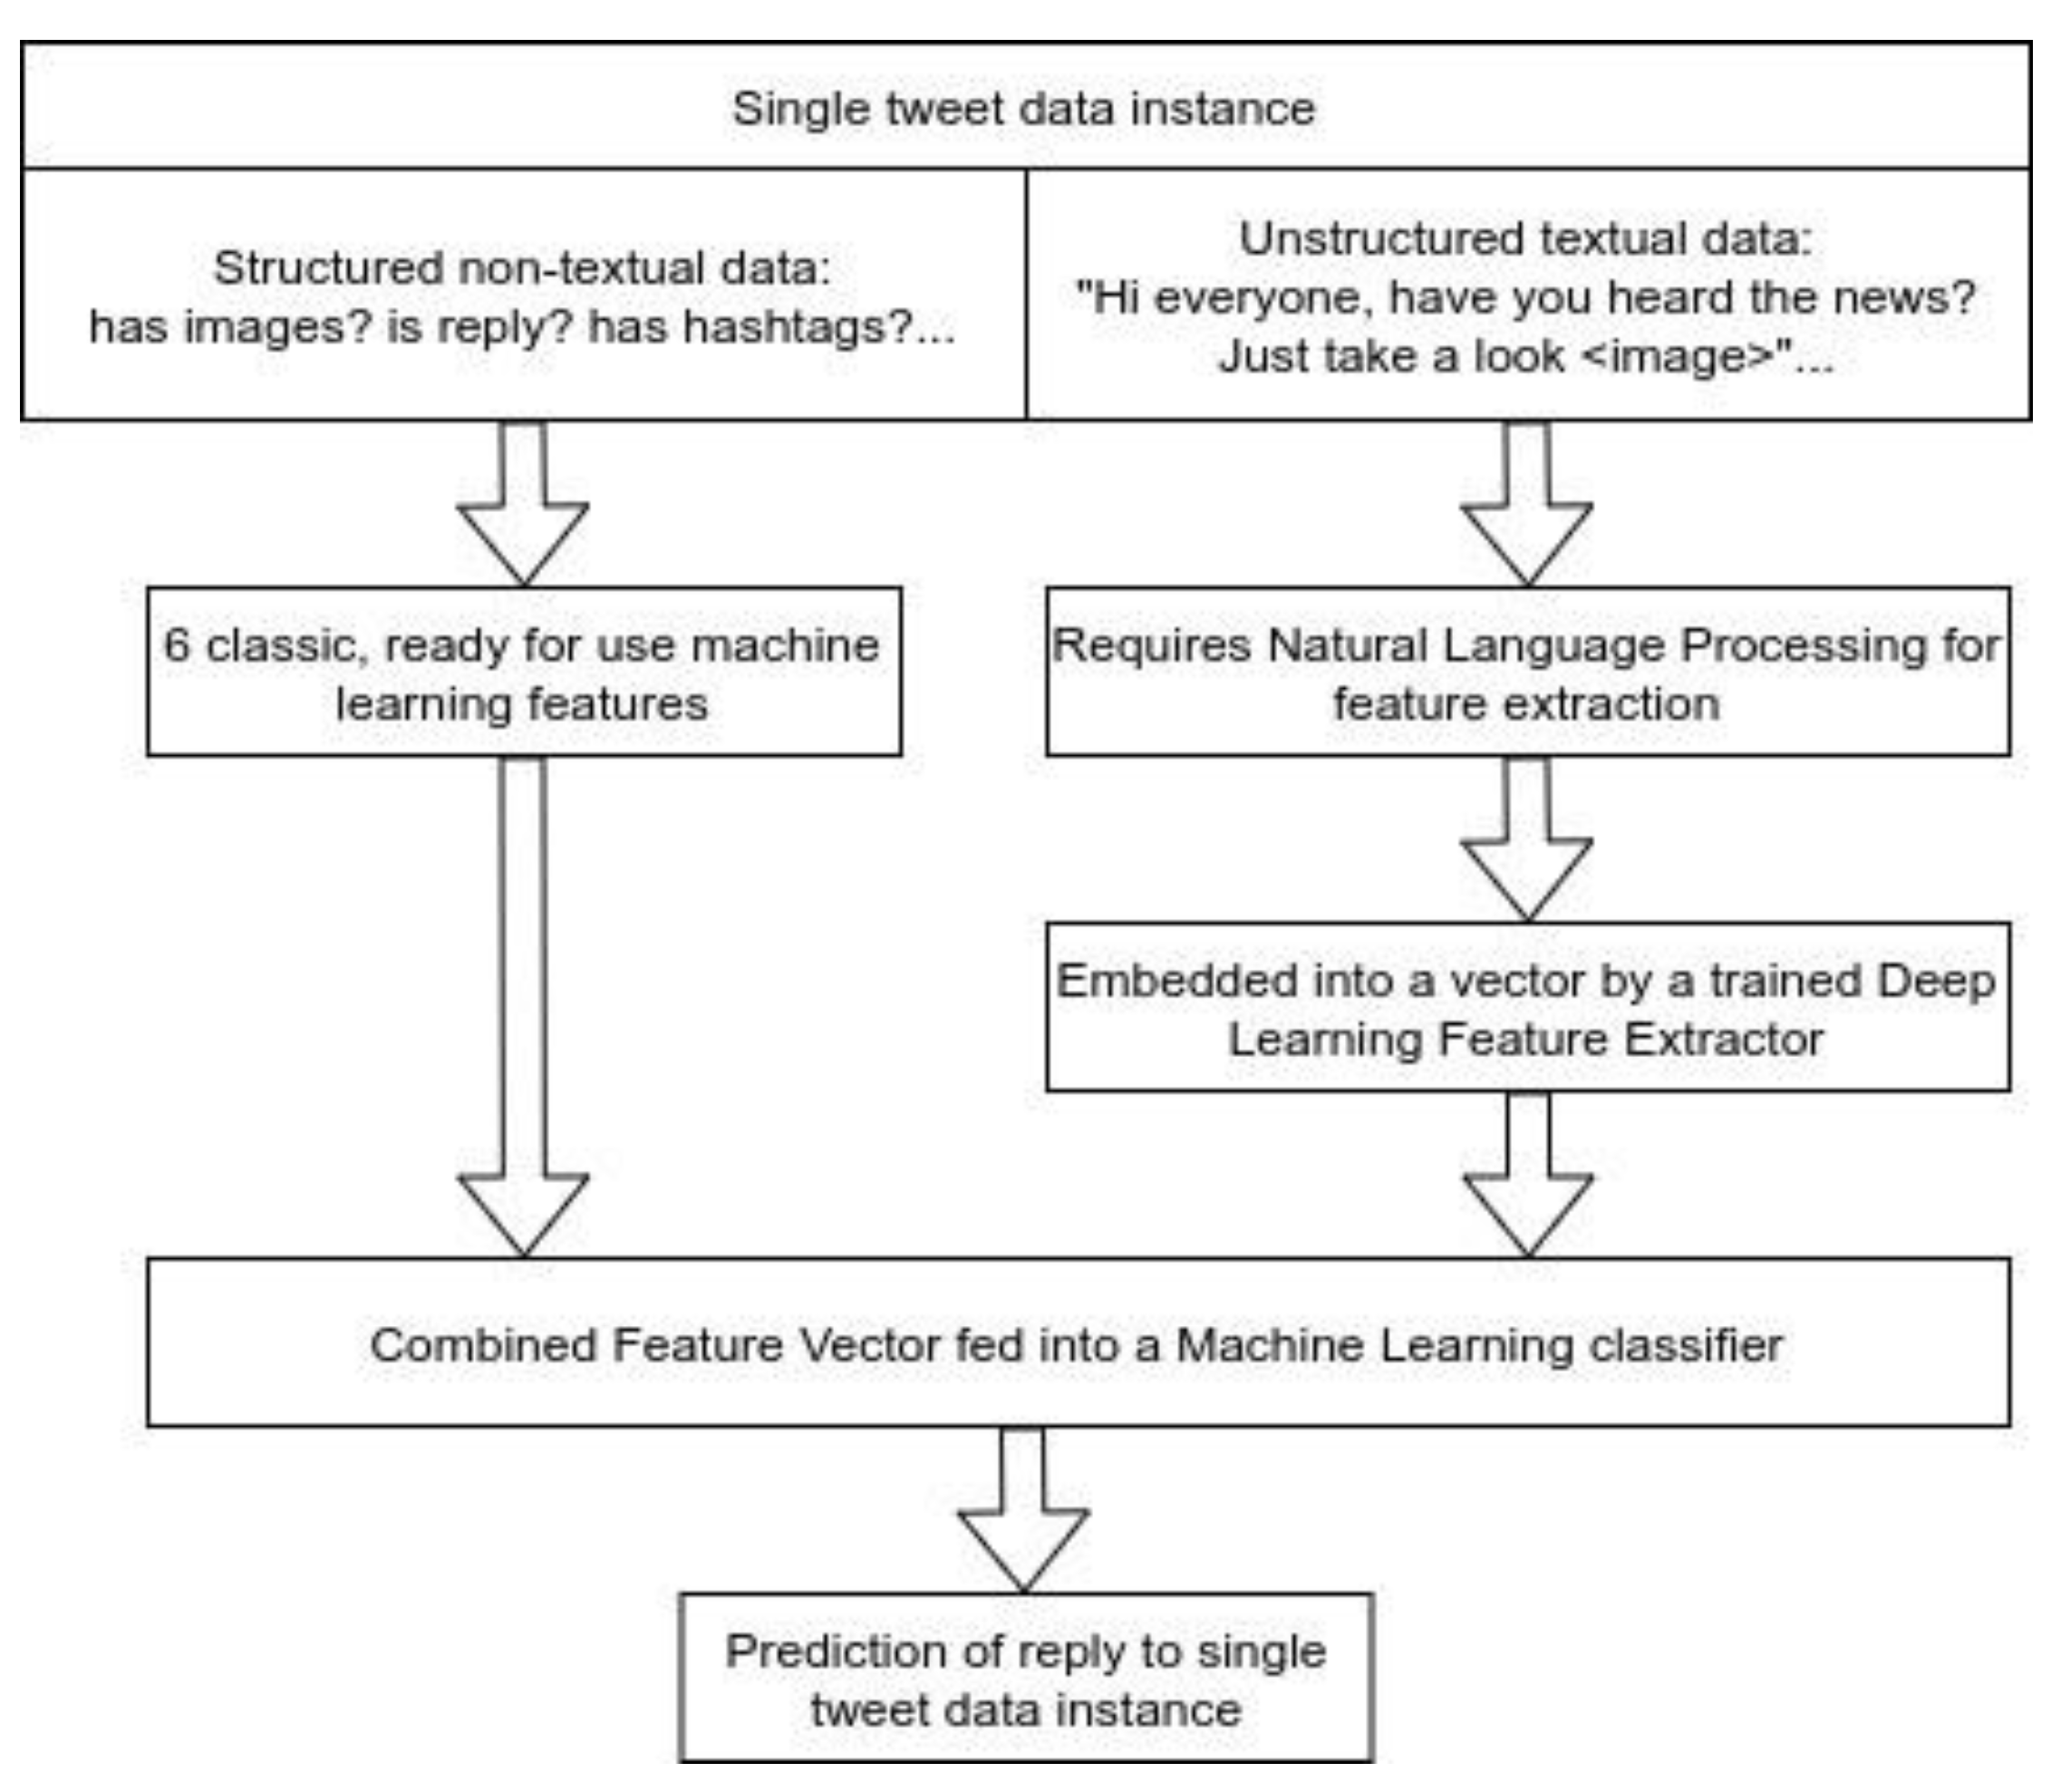
Our feature extraction efforts began with exploiting structured tweet information, such as whether the tweet included an image or contained any hashtags. Petrovic et al. [
2], demonstrated that social features, such as the number of followers and friends, and whether the user’s language is English, are very informative regarding reply prediction. In addition, Mbarek et al. [
23] and others, as previously mentioned, have suggested various user profile-related features that can improve the quality of classification. Our research could not benefit from these approaches because we sought to analyze tweets published by a single user. Instead, we included the date of publication as an indirect feature correlated, for example, with changes in the number of followers over time. However, we did not seek to define precise hour-by-hour models, as proposed in Petrovic et al. [
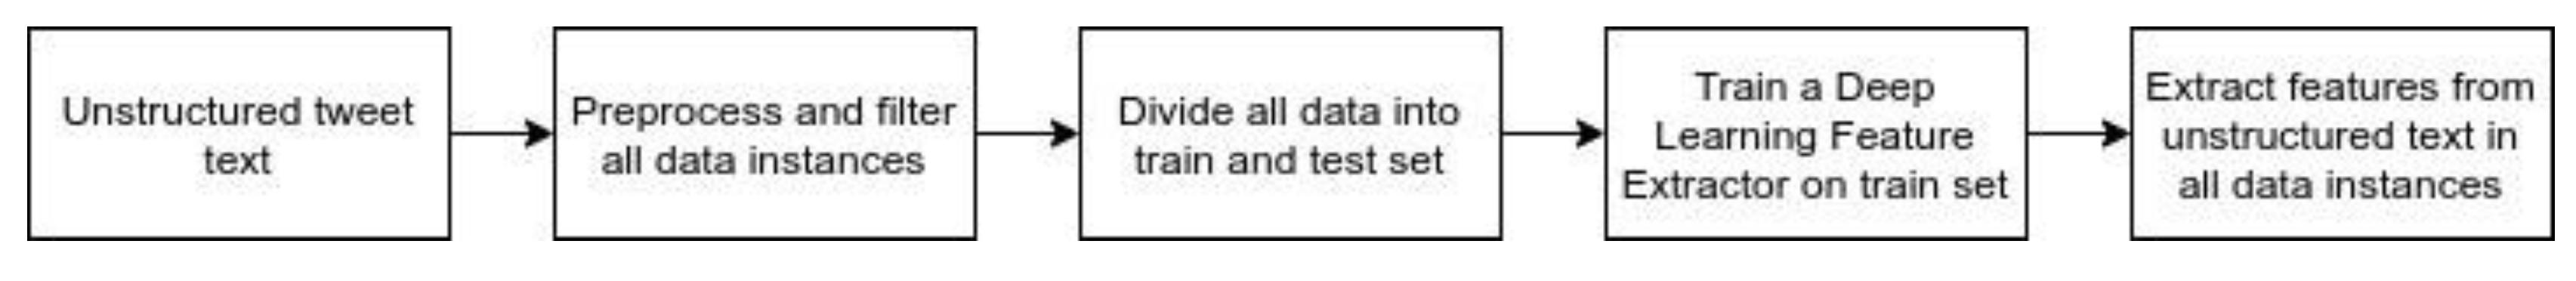
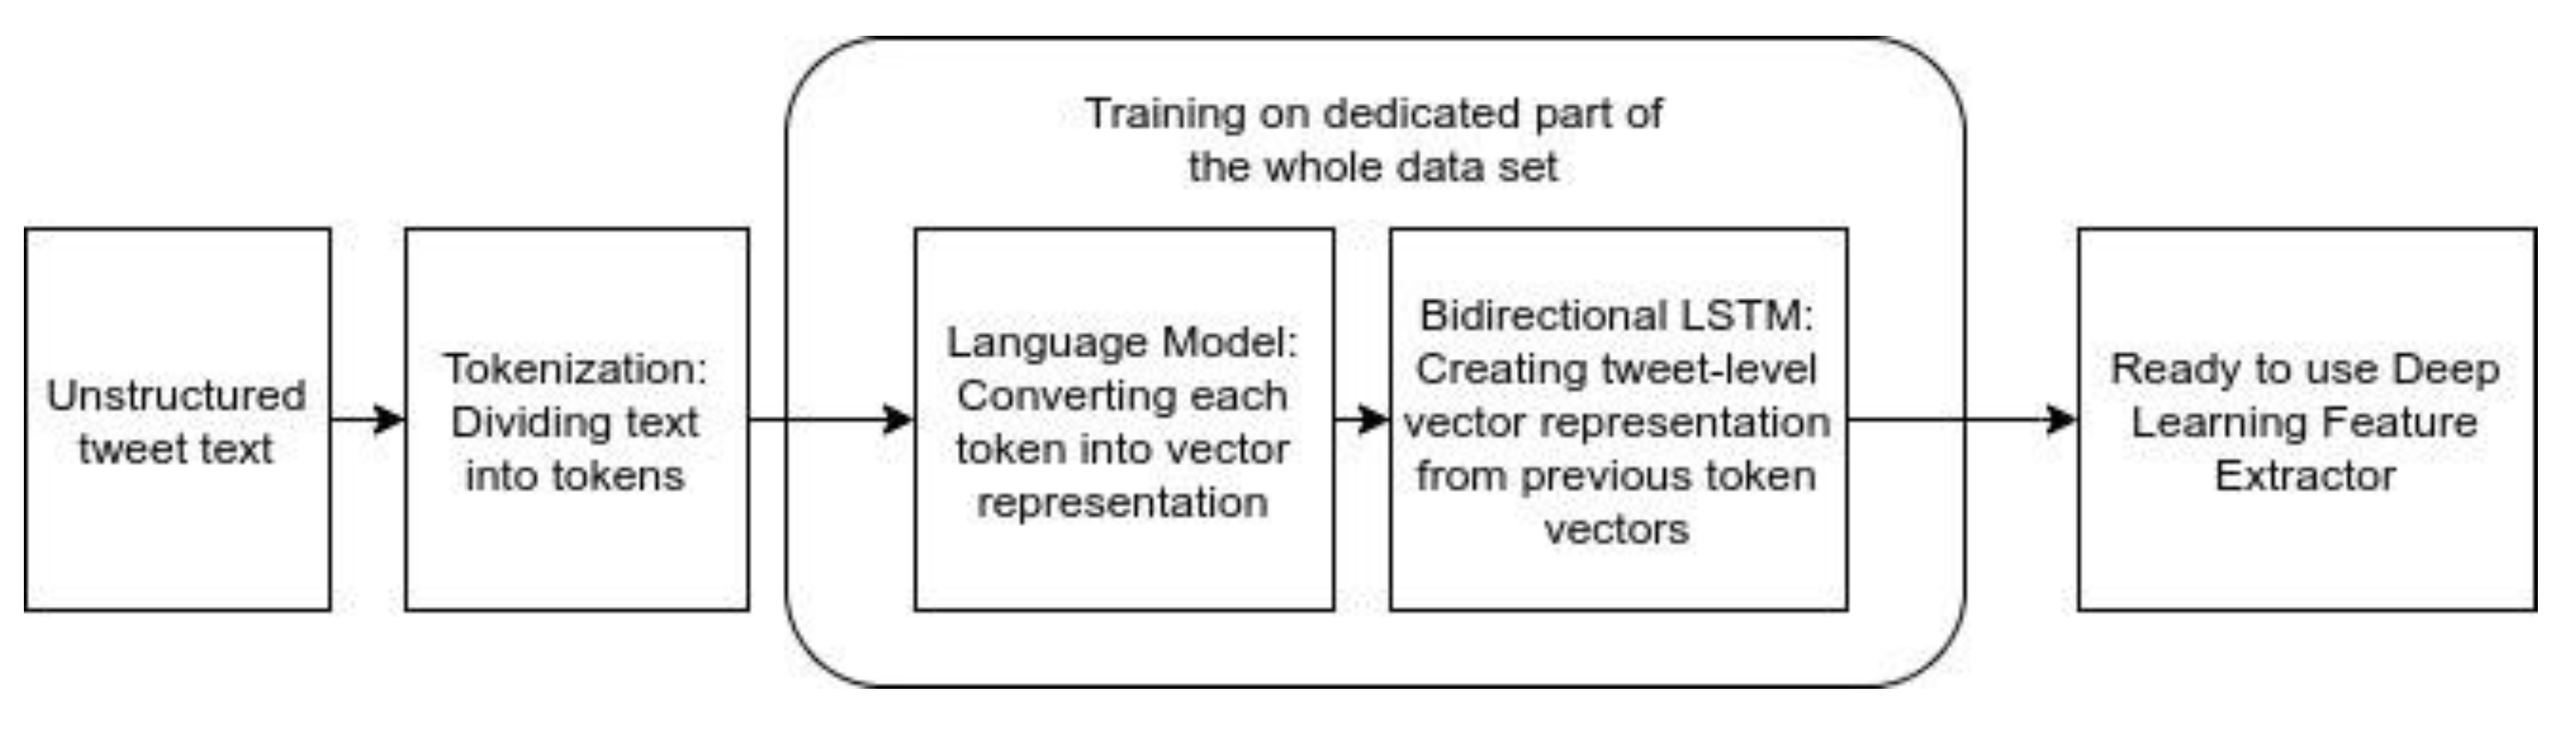
2]. Rather than concentrating on features engineered by hand, we decided to focus on gathering information from unstructured text data by using a Deep Learning architecture based on recently developed LMs.
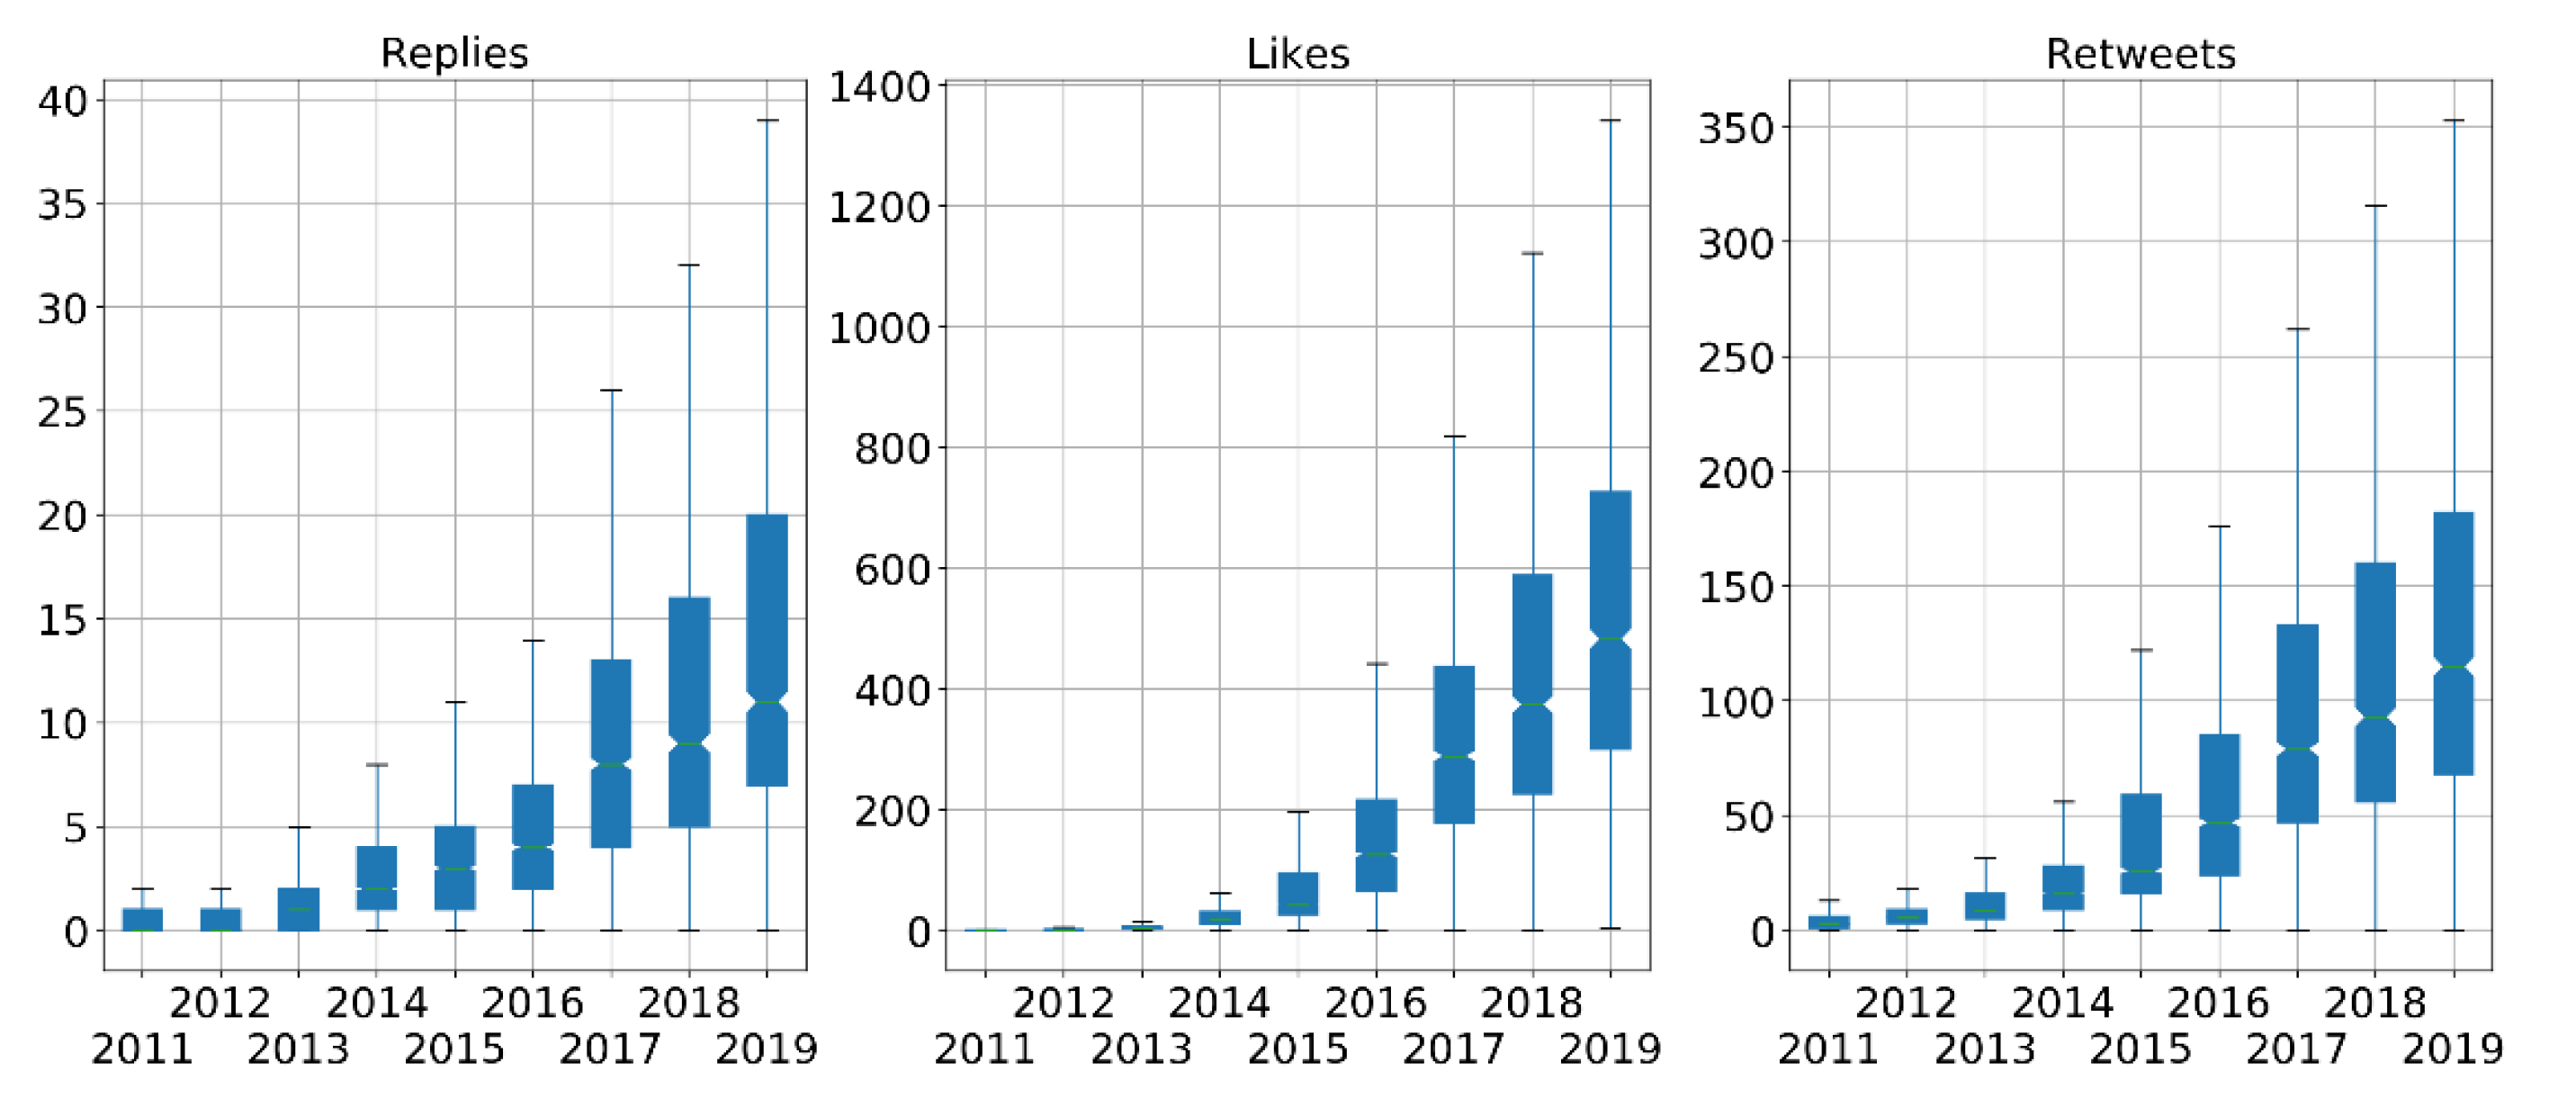
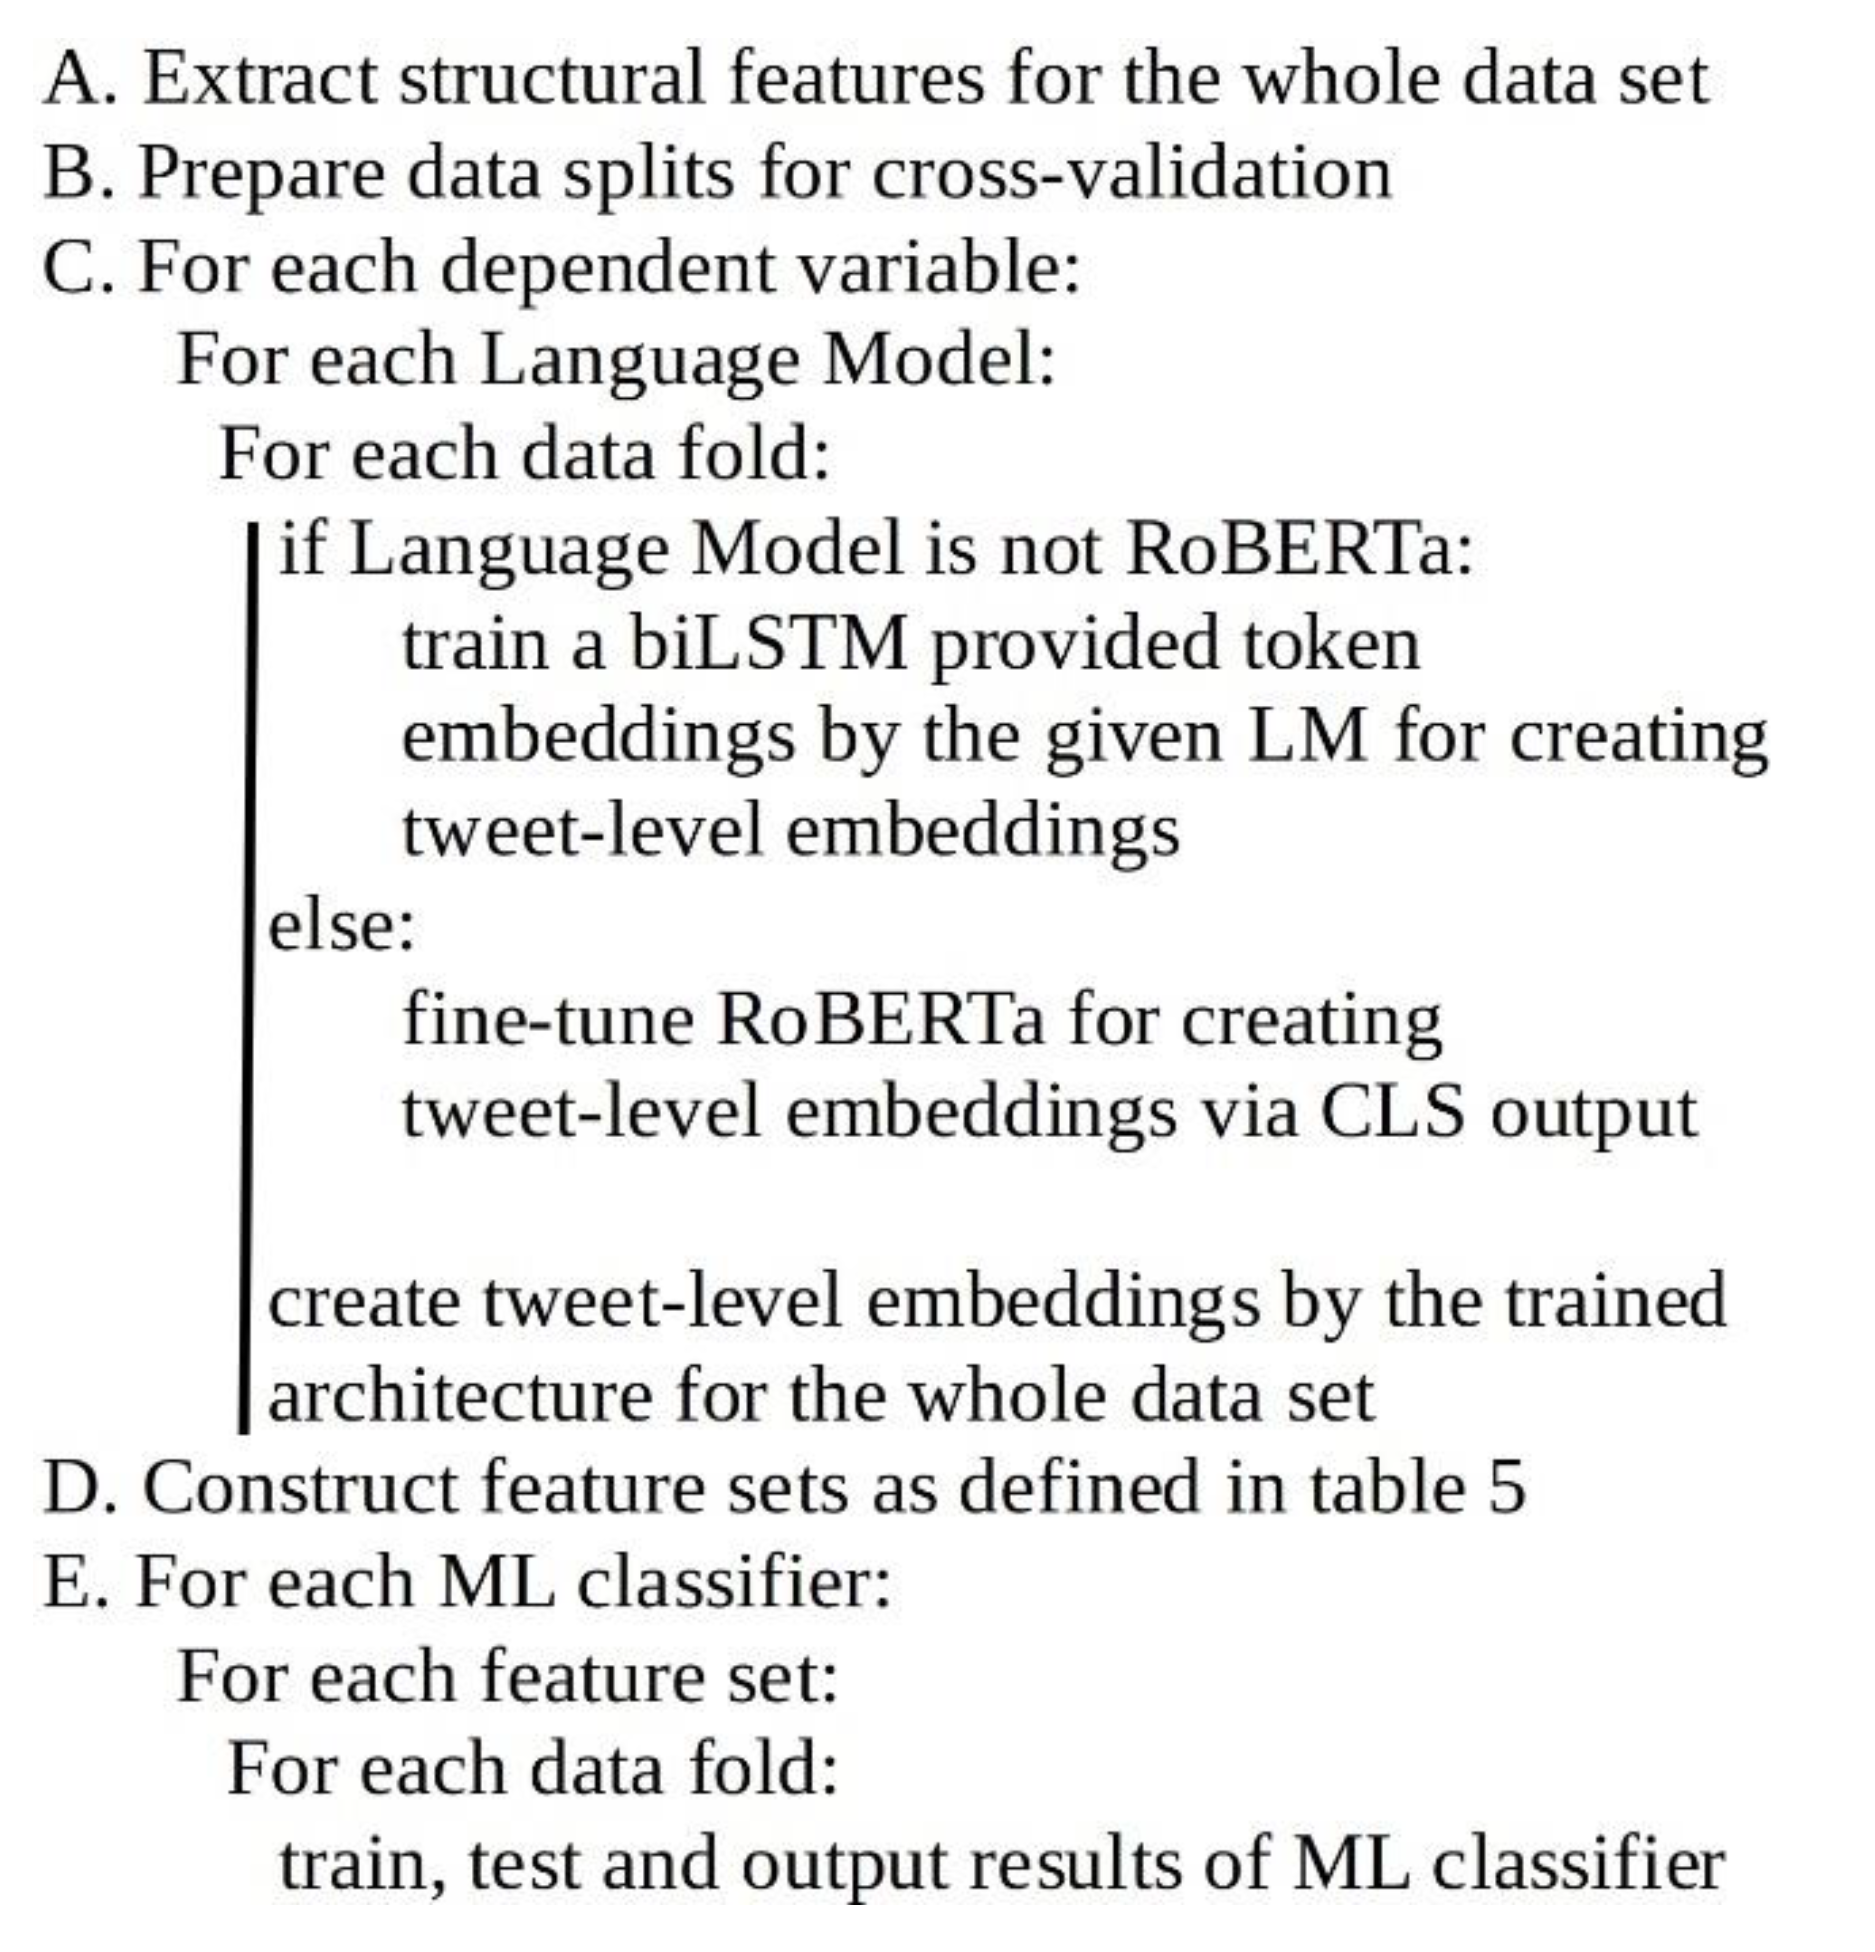
Our work contributes to the field primarily by comparing the performances of three machine learning models in the same classification tasks, on the basis of features extracted primarily with a recently developed Deep Learning Language Modeling approach and four different LMs. The comparison was performed independently for three different target variables: the total numbers of replies, likes, and retweets. We also used SHapley Additive exPlanations (SHAP) [
24] a state of the art eXAI technique, to demonstrate that the high performance of Deep Learning Language Modeling comes at the price of model explainability. To provide full experimental reproducibility, we have released our code and data set in an open repository [
25].
3. Results and Discussion
In our opinion, there are several notable observations regarding our experimental results.
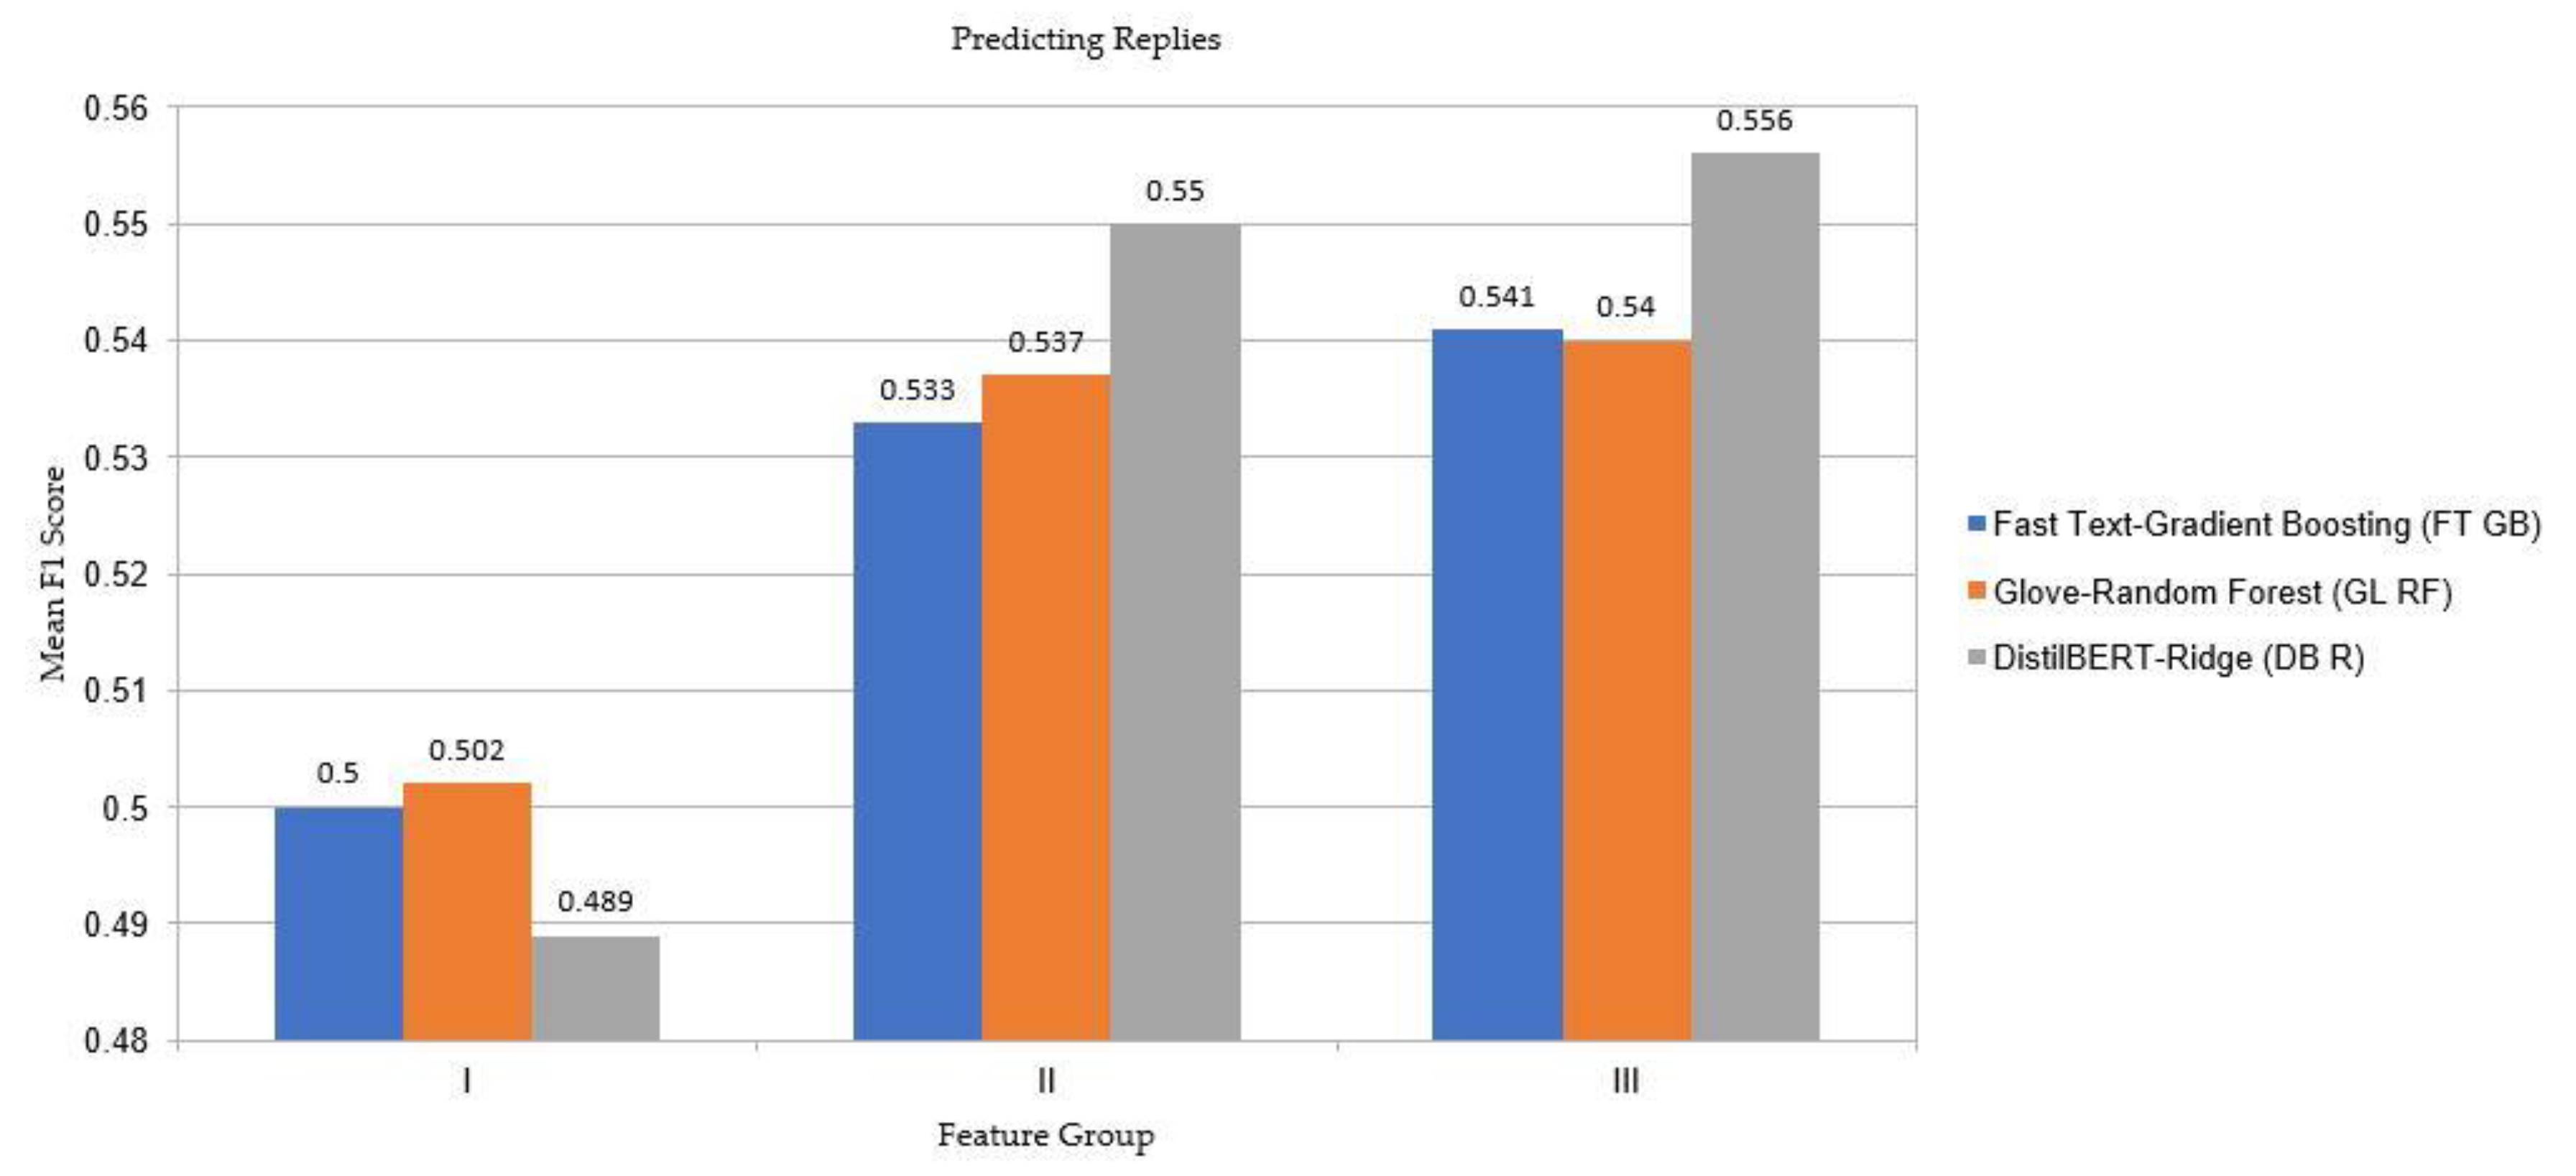
Figure 7 depicts partial results of the prediction of the number of “replies,” which can be treated as an example for comparing the prediction quality of the trained models. Here, using features from group I, i.e., derived only from structured tweet data, resulted in an inferior prediction quality to that derived using group II features, extracted from unstructured tweet text by the DLFE, independently of the selection of the machine learning classifier. Therefore, our results support the intuitive hypothesis that the written content in tweet text matters more than hand-crafted features, such as having an image or the date of publication. A comparison of the results for groups II and III also supports another intuitive assumption that the six features derived from structured tweet data provide meaningful information and improve prediction quality, mostly based on features extracted from unstructured tweet text. Examination of the full results presented in
Table 6 strengthens this conclusion because, in most cases, using group III features provided a quality the same as, or slightly higher than, that derived using group II features. However, an exception to this rule should be mentioned, for instance, in the prediction of replies, for which the results without structured data were marginally higher, specifically, a 0.558 F1 score for DB features and a RF classifier versus 0.557 for SDB features and the same classifier.
Assessing the full results presented in
Table 6 allowed us to draw additional conclusions:
The MLP and R classifiers were usually, but not always, outperformed by the GB and RF classifiers. No clear pattern indicated which classifier performed best;
Predicting the number of replies was more difficult than predicting the other two target variables for all tested feature sets;
For likes and retweets, for all compared LMs, RoBERTa provided the highest prediction performance for group II features as well as group II features in combination with structured features (group III features). However, this result was not the case for the prediction of replies. We hypothesize that this finding was caused by the unoptimized training regime for this target variable, and we discuss this aspect further in “Limitations of the study”;
DistilBERT LM most often had the second-best performance after RoBERTa LM; however, in this case, the improvement in the prediction quality over that of Glove and FastText LMs was marginal;
The best quality of results for replies, likes and retweets was associated with F1 scores of 0.558, 0.655 and 0.65, respectively.
As already mentioned in the Methods section, we have carried out statistical analyses for all presented experiments. Full results of these analyses are available, along with data and code [
31], and their possible interpretation is that most results had a normal distribution. One-way ANOVA indicated significant differences between trials, and Tukey HSD tests indicated significant differences in around 50% of the compared pairs.
Information regarding the computation times of deployed methods, presented in
Table 7, shows that improved prediction quality comes at the cost of speed, both when mode training and inference is concerned. If a system operating in real-time is developed, then probably using DistilBERT and RoBERTa may, importantly, prolong the whole data processing procedure. However, we believe it is essential to underline that the demonstrated times are only generally illustrative, and will strongly differ between computing machines and code implementations.
Similar F1 score values were obtained by Hong et al. [
12]; however, Hong used different features, and the analyzed data were published by various user accounts, which allowed them to leverage account-specific features that are known to provide valuable information and improvements in classification scores, as demonstrated for instance by Zhang et al. [
15]. Our findings can also be compared to those of Kupavskii et al. [
7]. In addition to solving a regression task, Kupavskii et al. [
7] conducted a two-class classification by using a gradient-boosting decision tree model to achieve F1 scores as high as 0.775 and 0.67, for the two analyzed classes. In our work, we assumed that no post-publishing information was available. These higher F1 scores might possibly be attributable to the utilization of information available after a tweet’s publication, because the authors themselves demonstrated that even incorporating information regarding the number of retweets from the first 15 s after a tweet is published can substantially increase predictive performance. In addition, solving a classification task with two classes is usually simpler than solving a similar task with three classes.
The consistent quality of our deep learning methods is probably reducible to the fact that they are capable of creating context-aware, tweet-level representations, i.e., capturing the context of the whole tweet and extracting more precious information from the unstructured text. LMs such as Glove and FastText provide only context-independent features, which causes the performance to drop.
Further increasing the performance of our machine learning models is likely to be possible with the proper engineering of additional structured features. Many possible features could be adopted, including those as simple as the length of a tweet, as proposed in Duan et al. [
35].
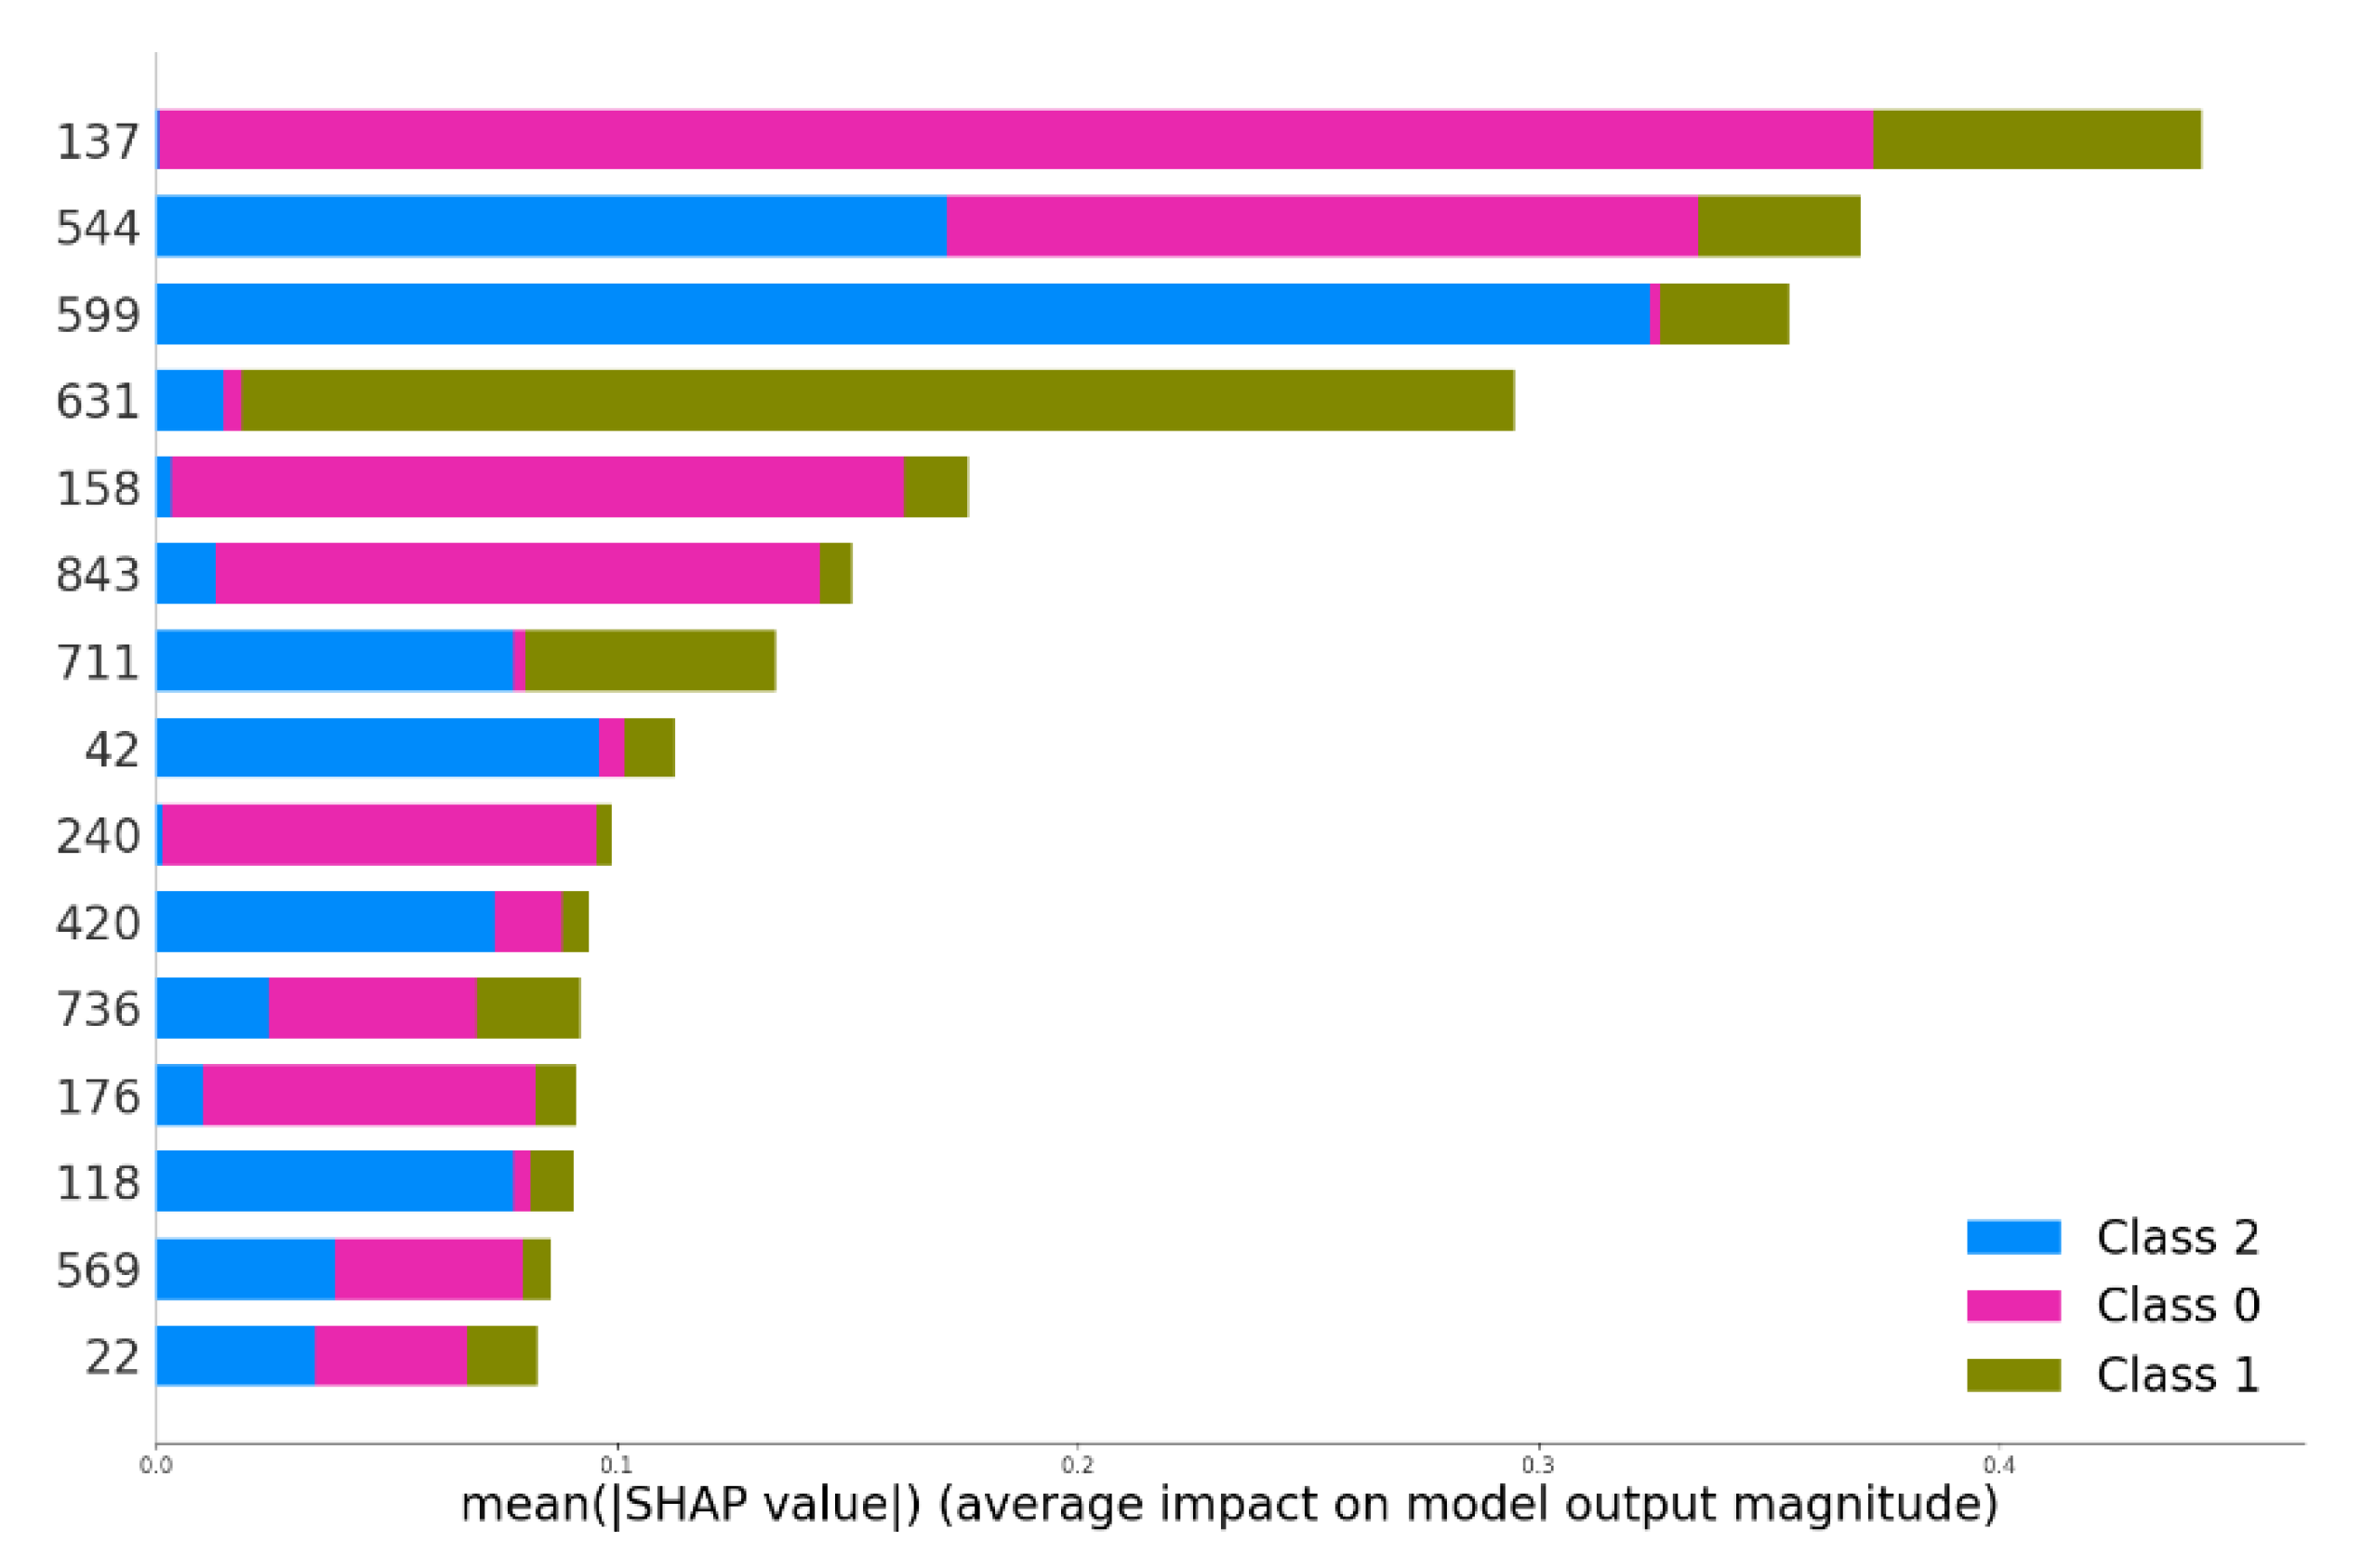
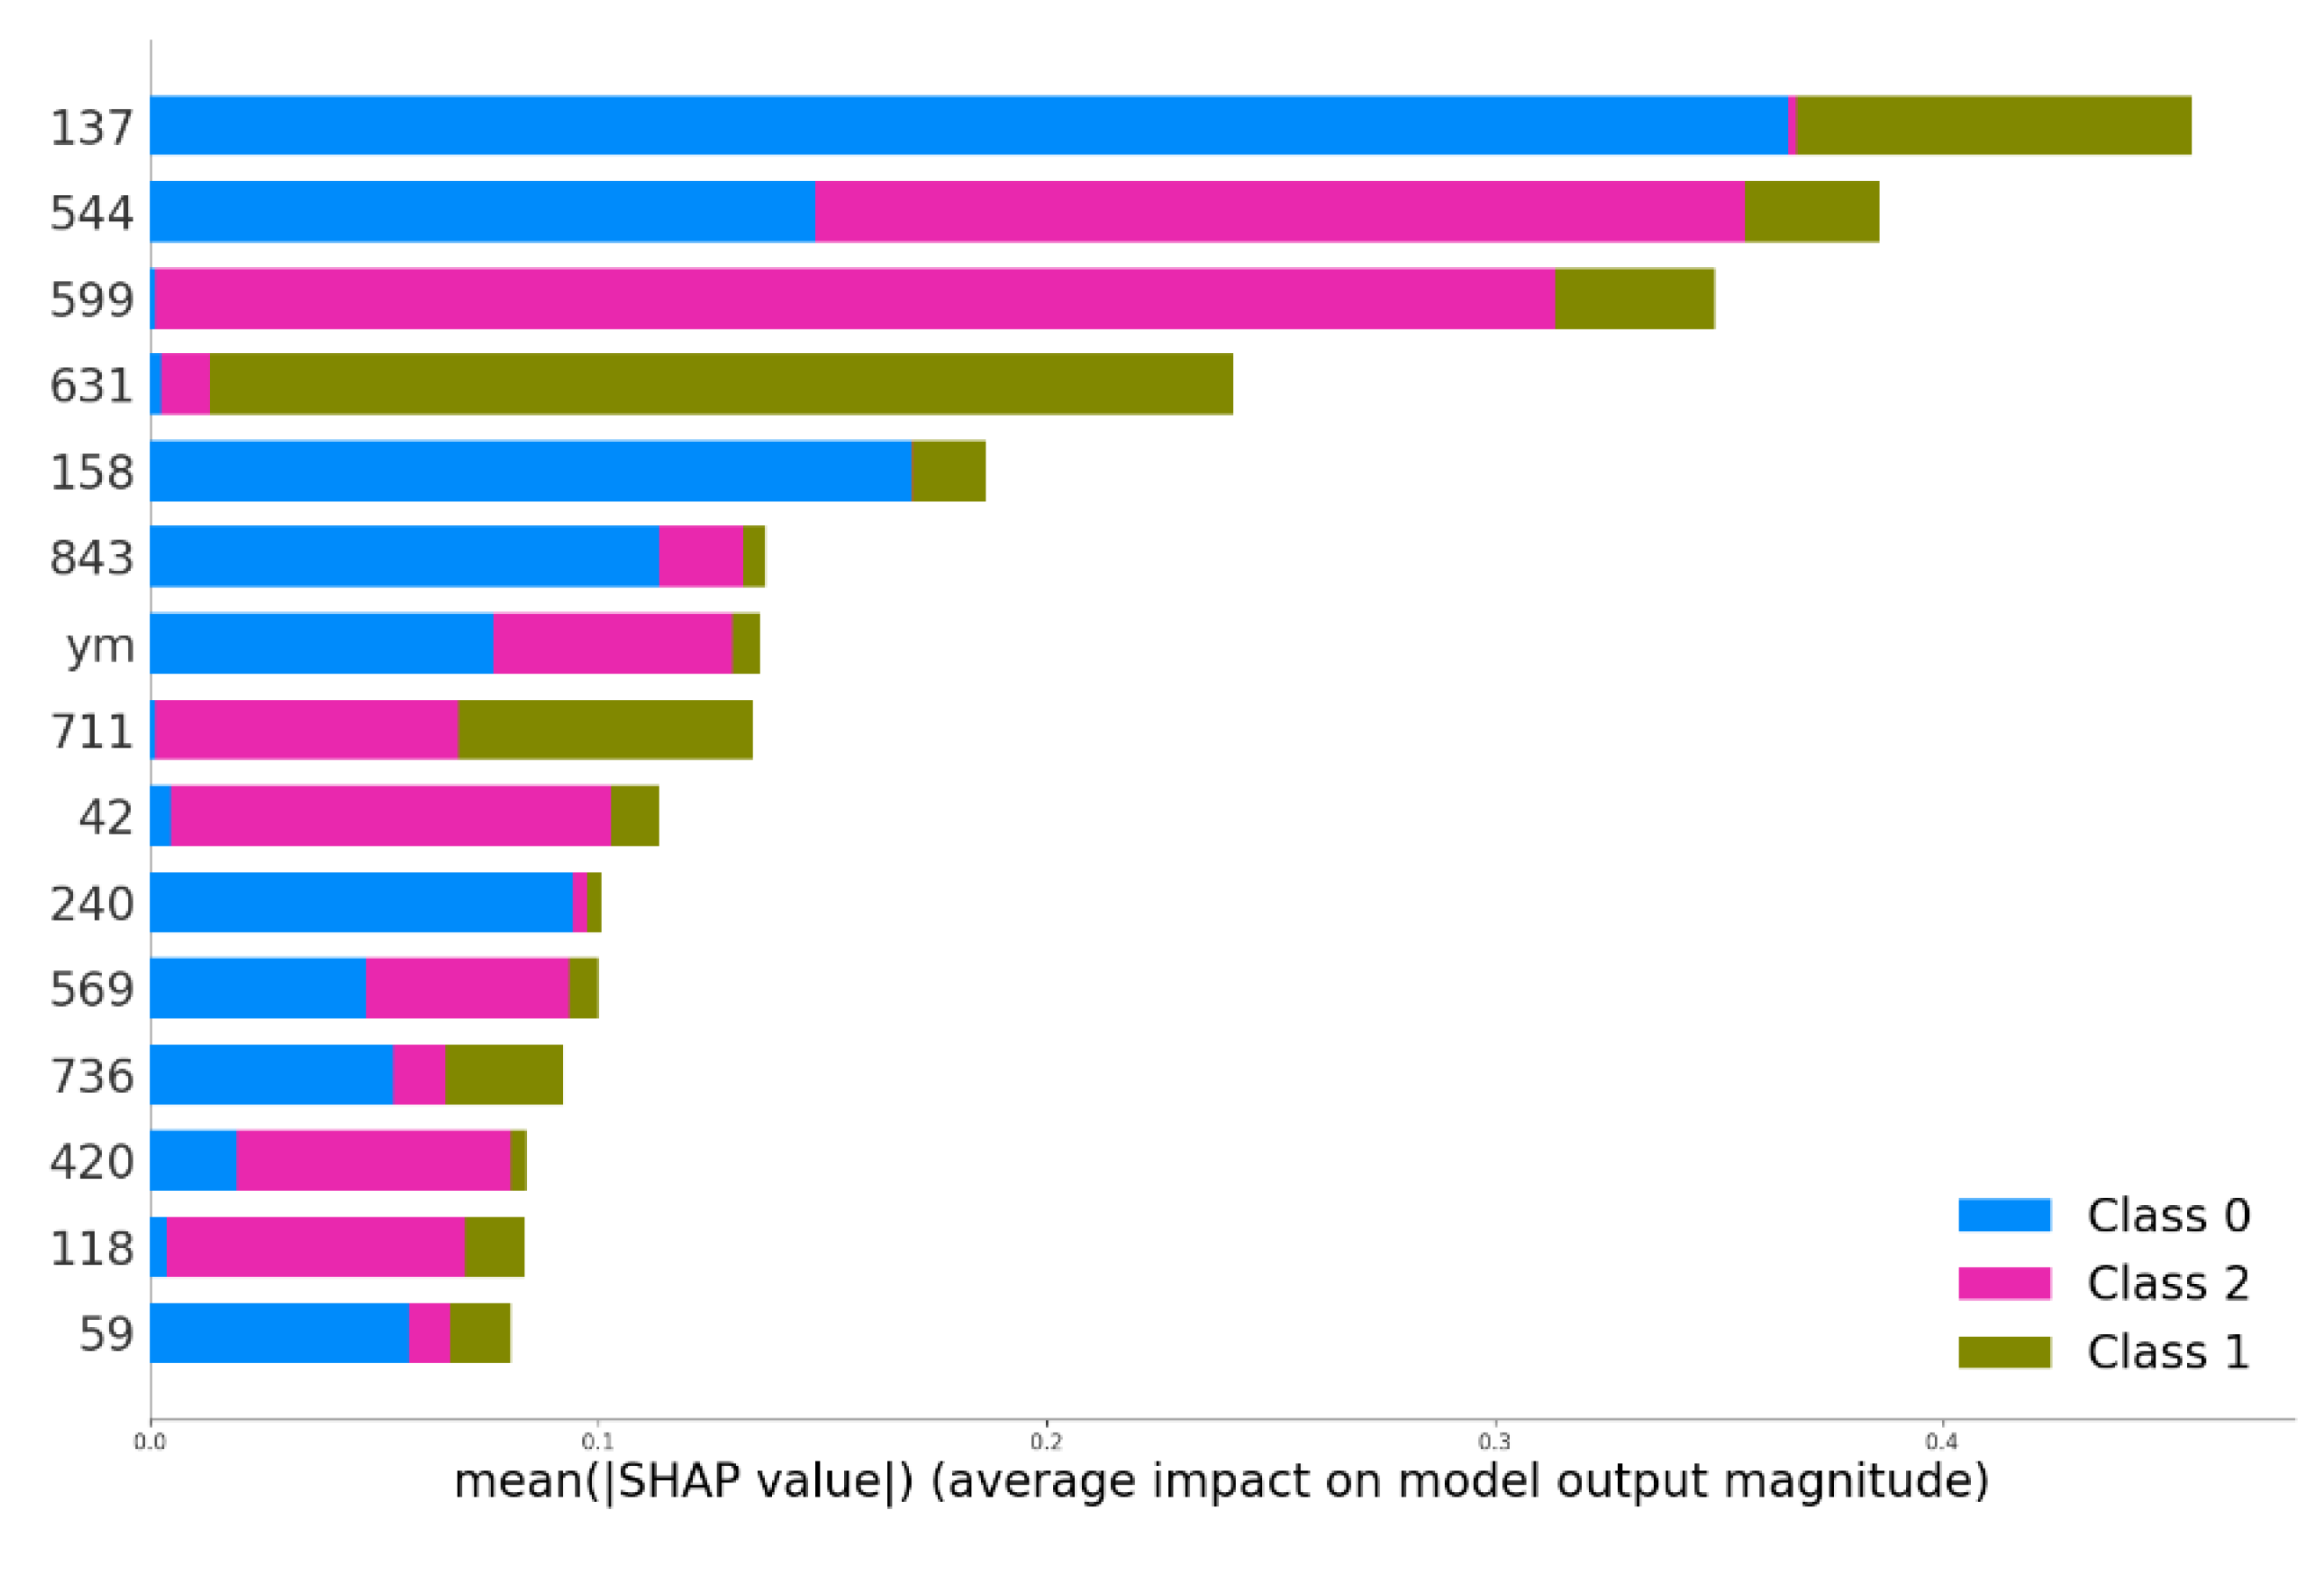
Figure 8,
Figure 9 and
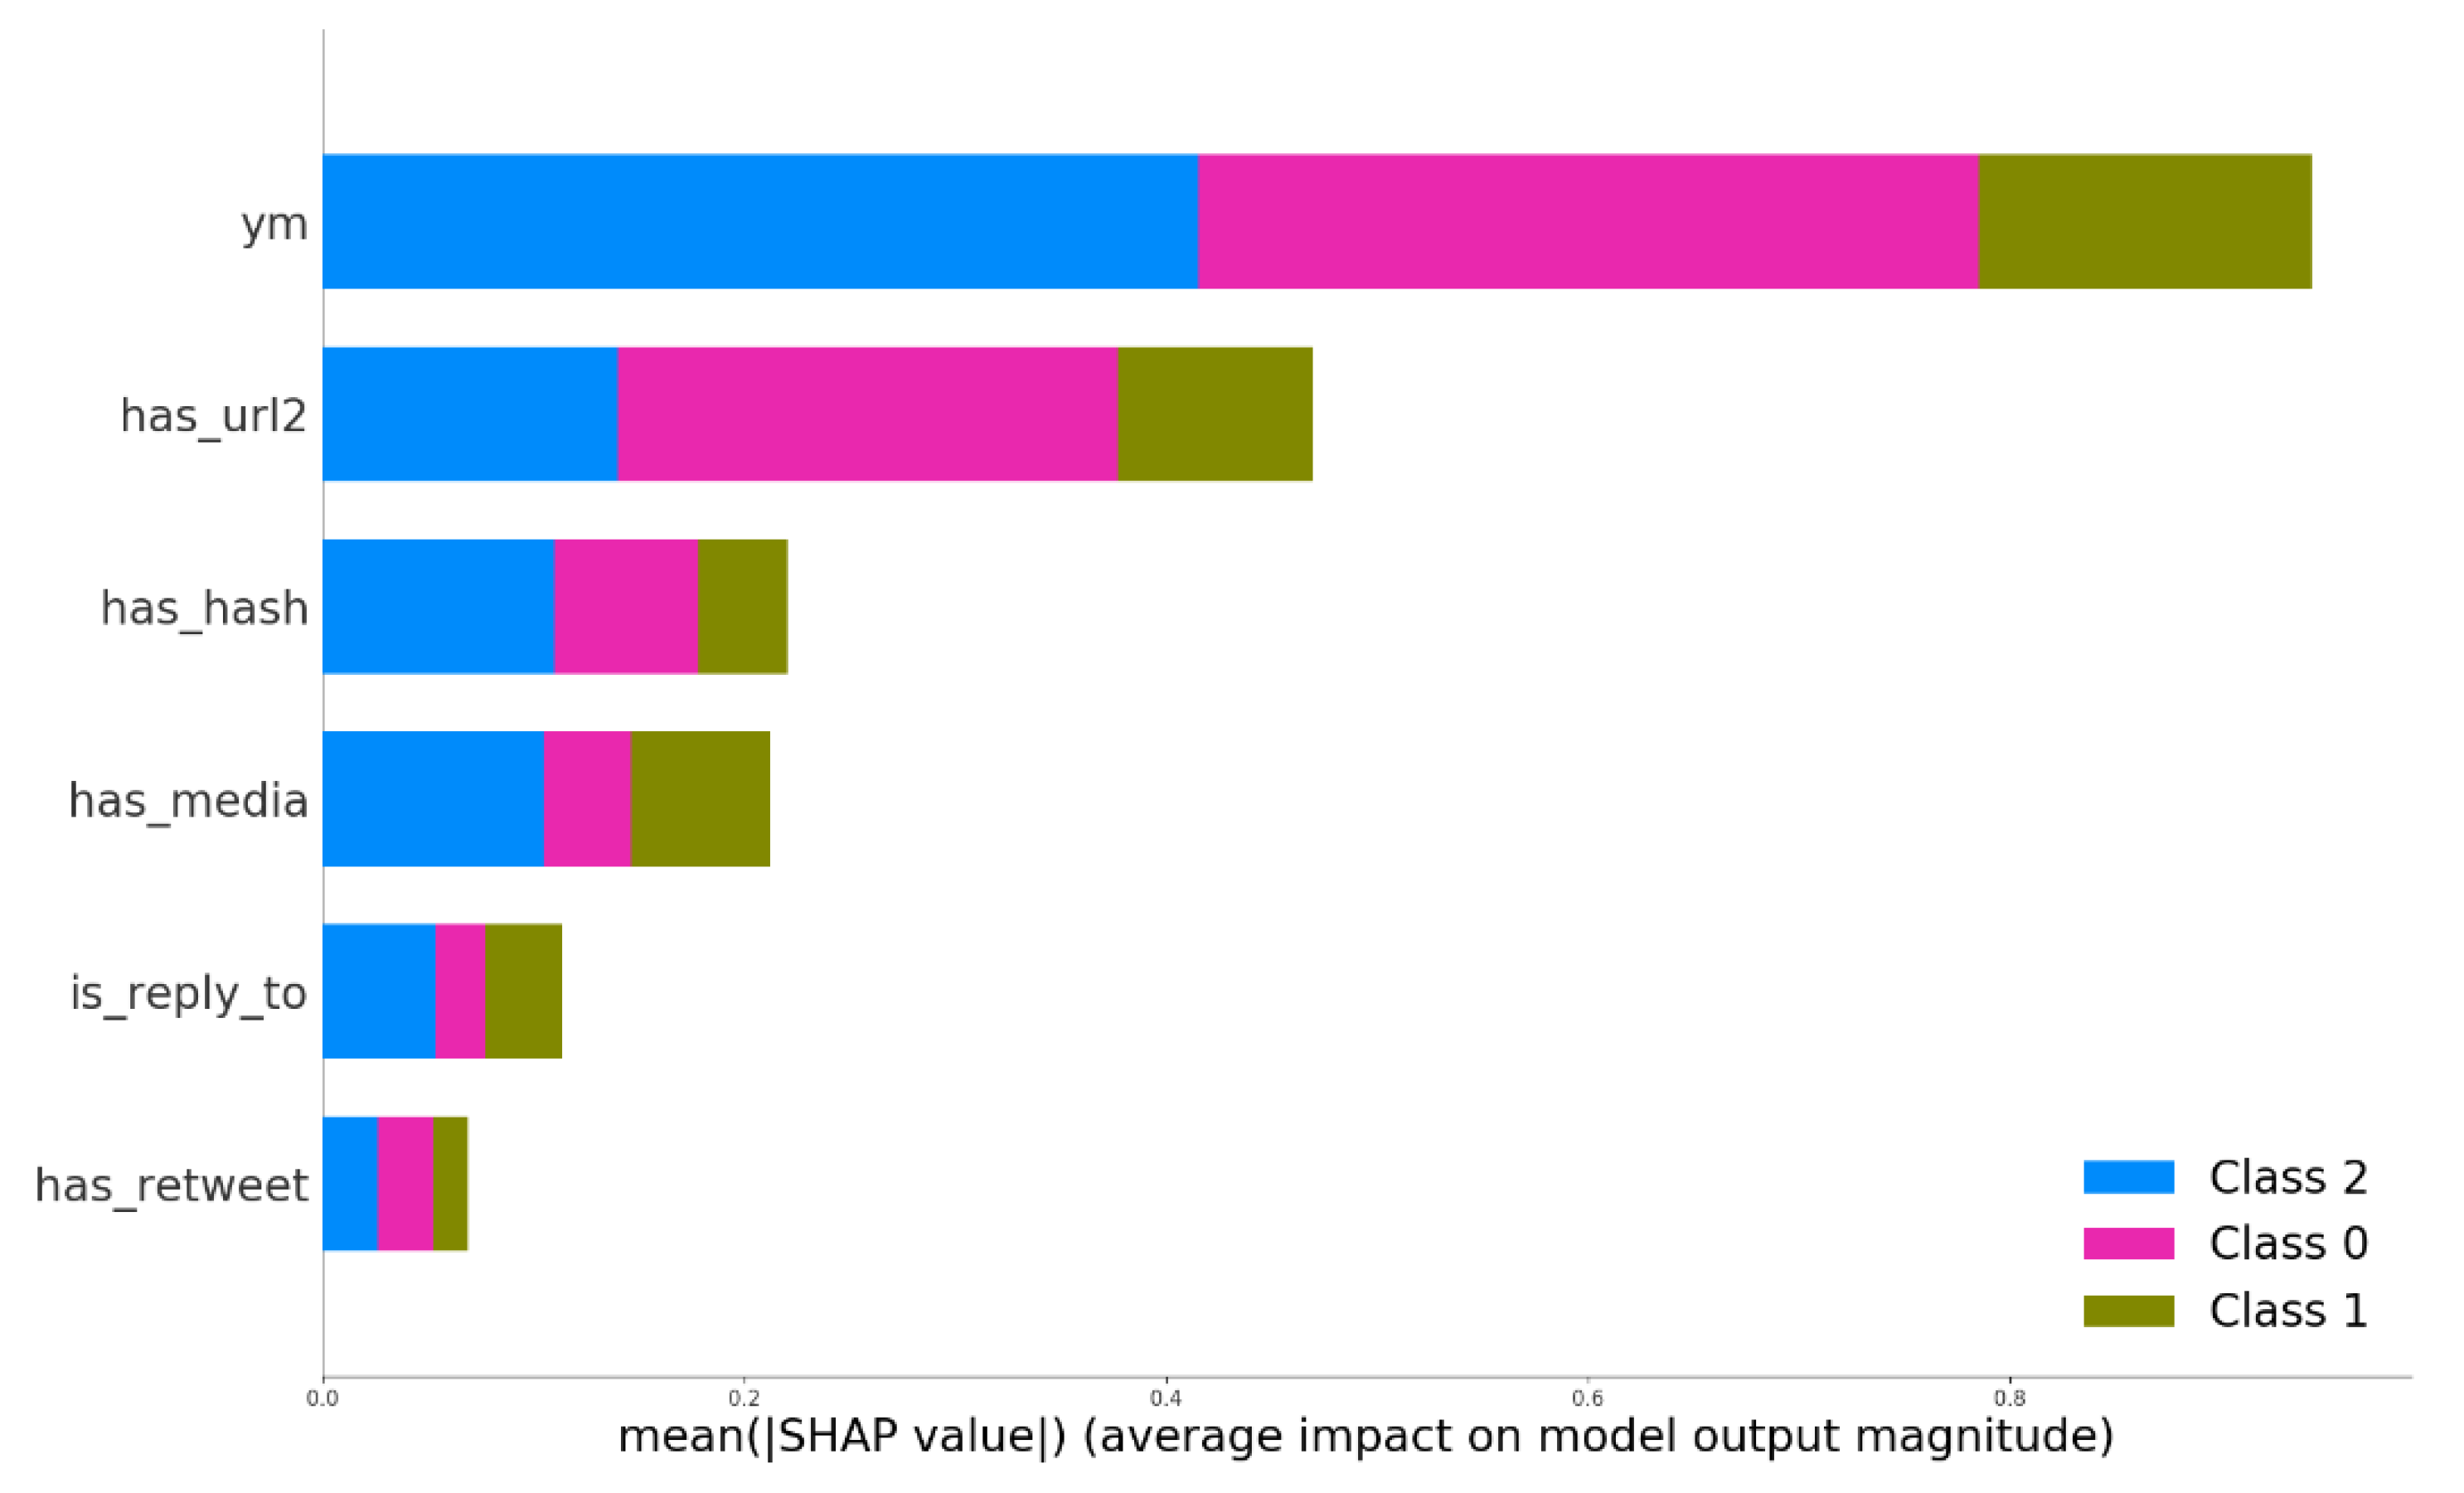
Figure 10 demonstrate the importance of well-engineered structural features. The mentioned figures depict SHAP explanations for the same machine learning classifier, GB, and features from groups I, II and III. Analysis of
Figure 8 indicates that time-dependent information regarding when the tweet was published was most informative for the model trained solely on structured features. In
Figure 9, features created by DLFE can also be demonstrated, but unfortunately, there is no information on what these features represent. This unfortunate observation shows that while deep learning modeling in NLP provides a significant performance boost, it makes the state of the art XAI techniques useless in some cases.
Figure 10 shows the importance of the structured features, compared with DLFE features, for a model trained on these combined features. The single most crucial structured feature was found in the 15 most important features. Thus, properly engineered structured features appear to be truly valuable, even in conjunction with DLFE features.
In fact, we believe that the key to significant improvements in prediction quality lies in crucial information that is available in tweets but is currently neglected. A representative detail that illustrates the underlying problem can be seen in the pre-processing of tweets. Our tweet pre-processing procedure resulted in the removal of 351 duplicated tweets. Of course, the @USNavy account did not publish the same tweets several times; however, the procedure converting all links and images to the same tokens resulted in the creation of identical tweets such as “LIVE NOW: Watch #USNavy’s newest Sailors graduate boot camp–_URL _IMAGE” or “Around the fleet in today’s #USNavy photos of the day. info and download: _URL … _IMAGE.”
Consequently, among the 351 deleted tweets, many differed only in image or link content. As shown in
Table 4, the analyzed set of tweets included 83.5% of data instances with images. Intuitively, the content of an image should influence the likelihood of “liking” or “retweeting” a tweet, but our features are not capable of reflecting image content in any manner. We believe that extracting information from the images attached to tweets coulda clearly improve the quality of predictions regarding user responses. Future efforts to address this issue could begin with a similar approach, as in Mbarek et al. [
23], in which the authors experimented with leveraging publicly available Convolutional Neural Network-based tools and the simple color analysis of images for feature extraction. In addition, for 60.38% of data instances with links, the used classifiers include no information regarding the web resources to which the links direct. In this context, prediction quality could be improved by analyzing the URL type, as proposed in the study by Suh et al. [
5], which indicated that some tweets are more likely to be retweeted than others, depending on the URL target. Structured features extracted by the proposed approaches could also contribute to improving understanding of the rationale for model predictions if XAI tools similar to those used in our study were implemented.


