Power Generation, Efficiency and Thermal Stress of Thermoelectric Module with Leg Geometry, Material, Segmentation and Two-Stage Arrangement


Abstract
1. Introduction
2. Methodology
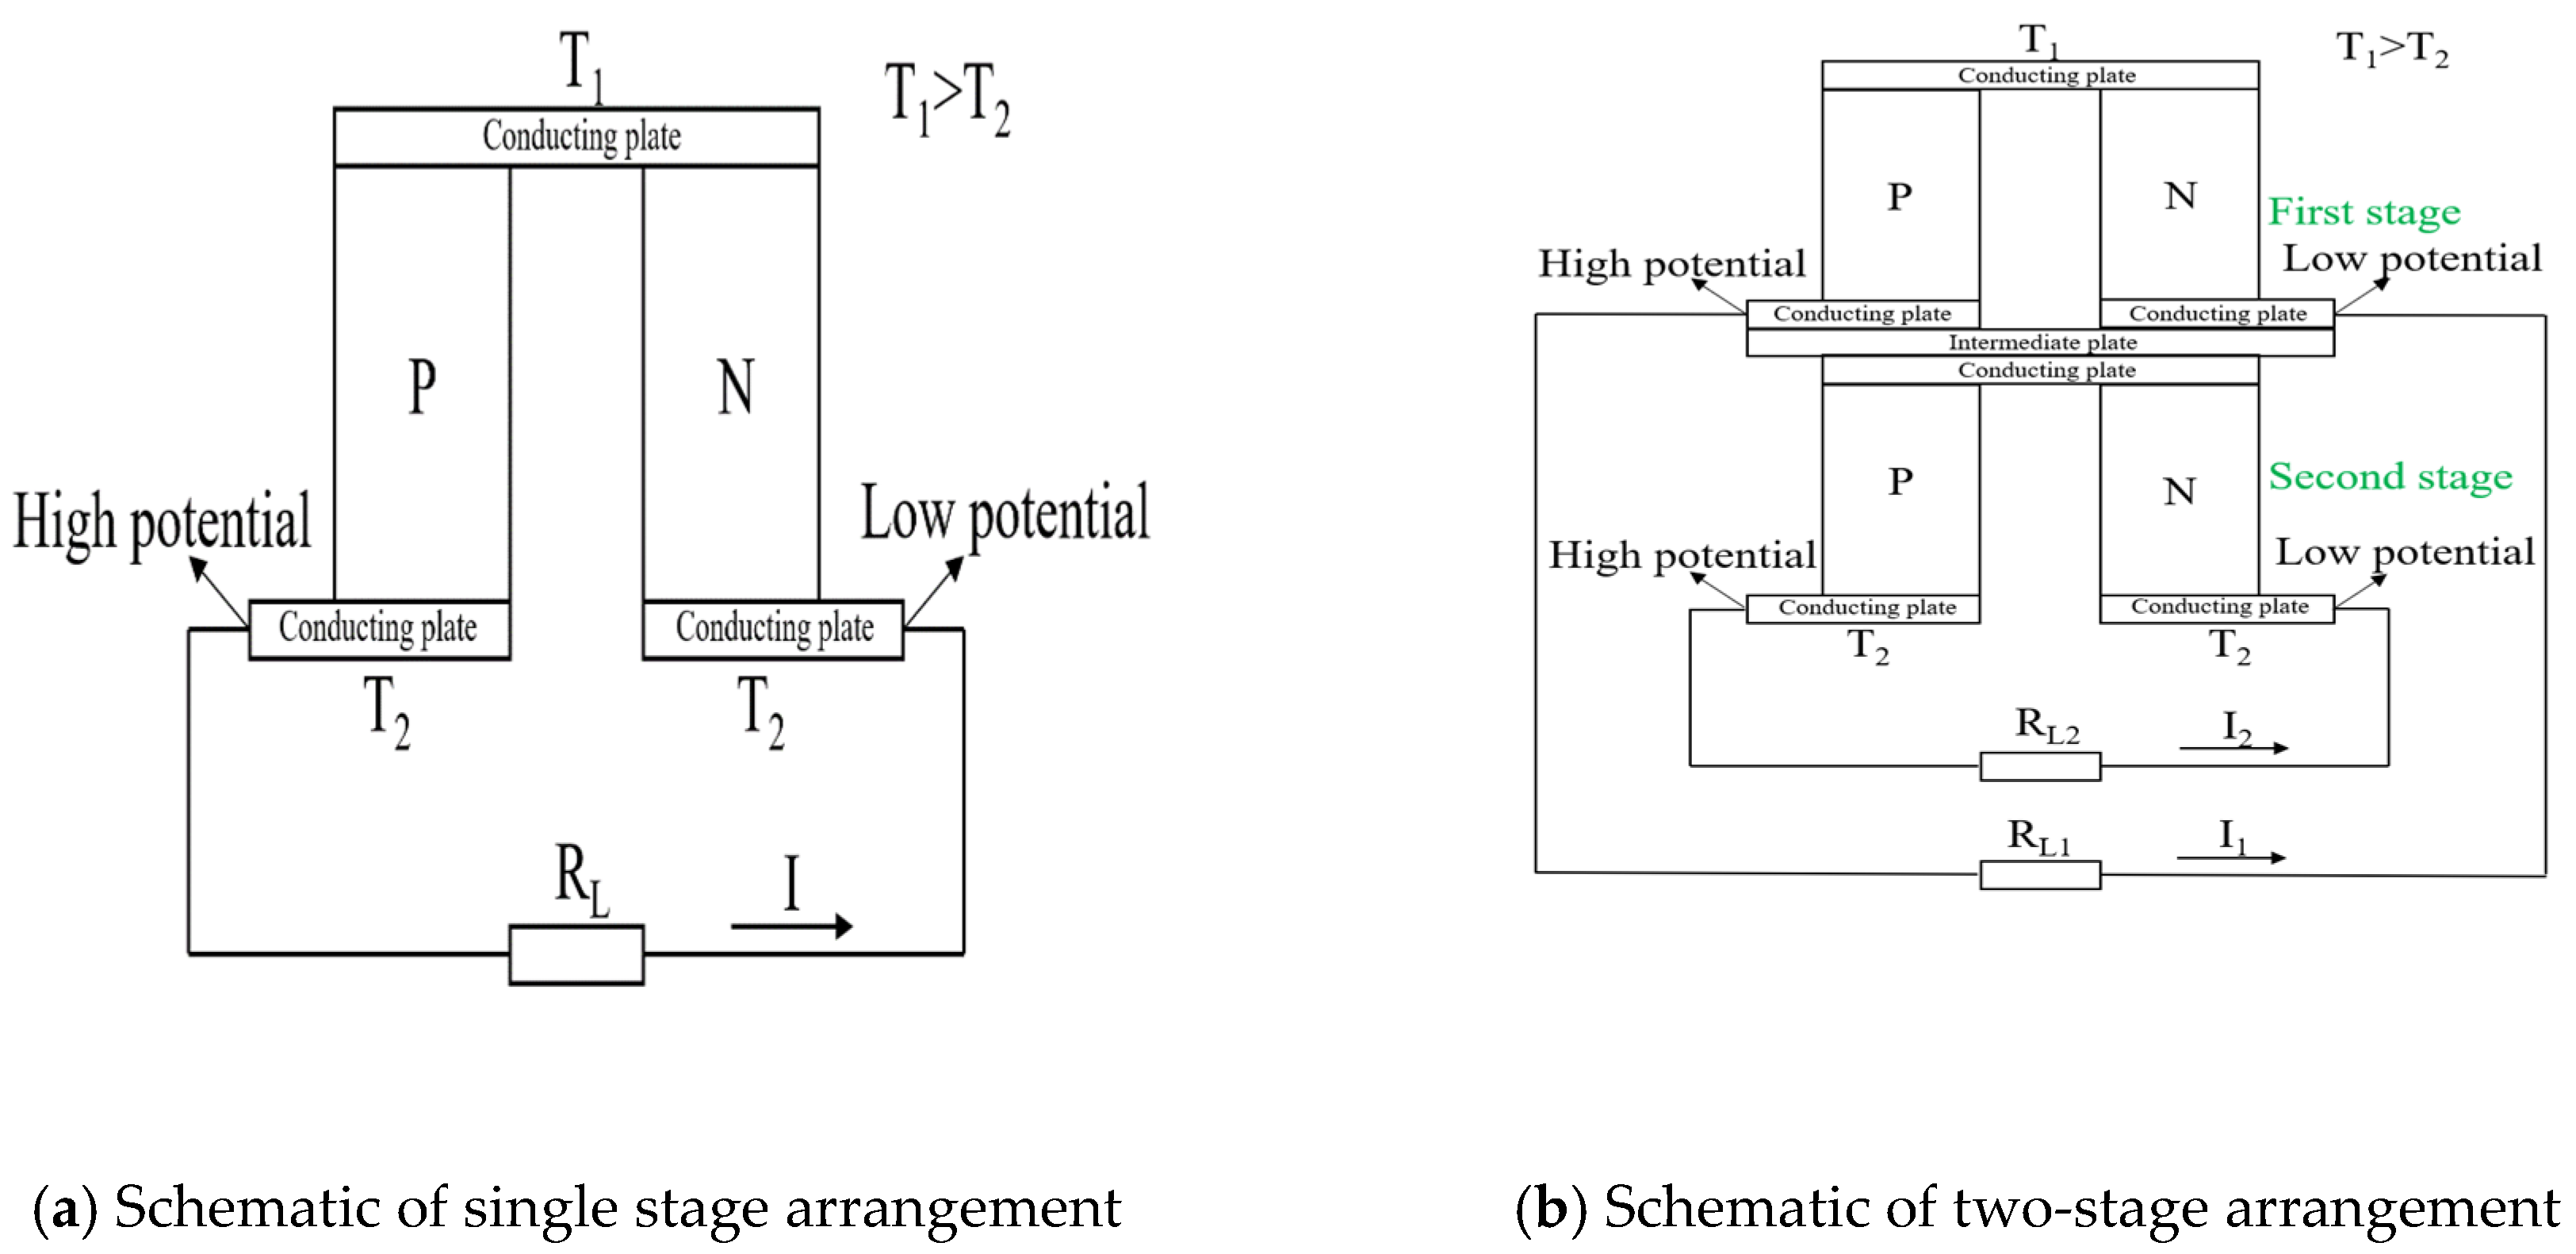
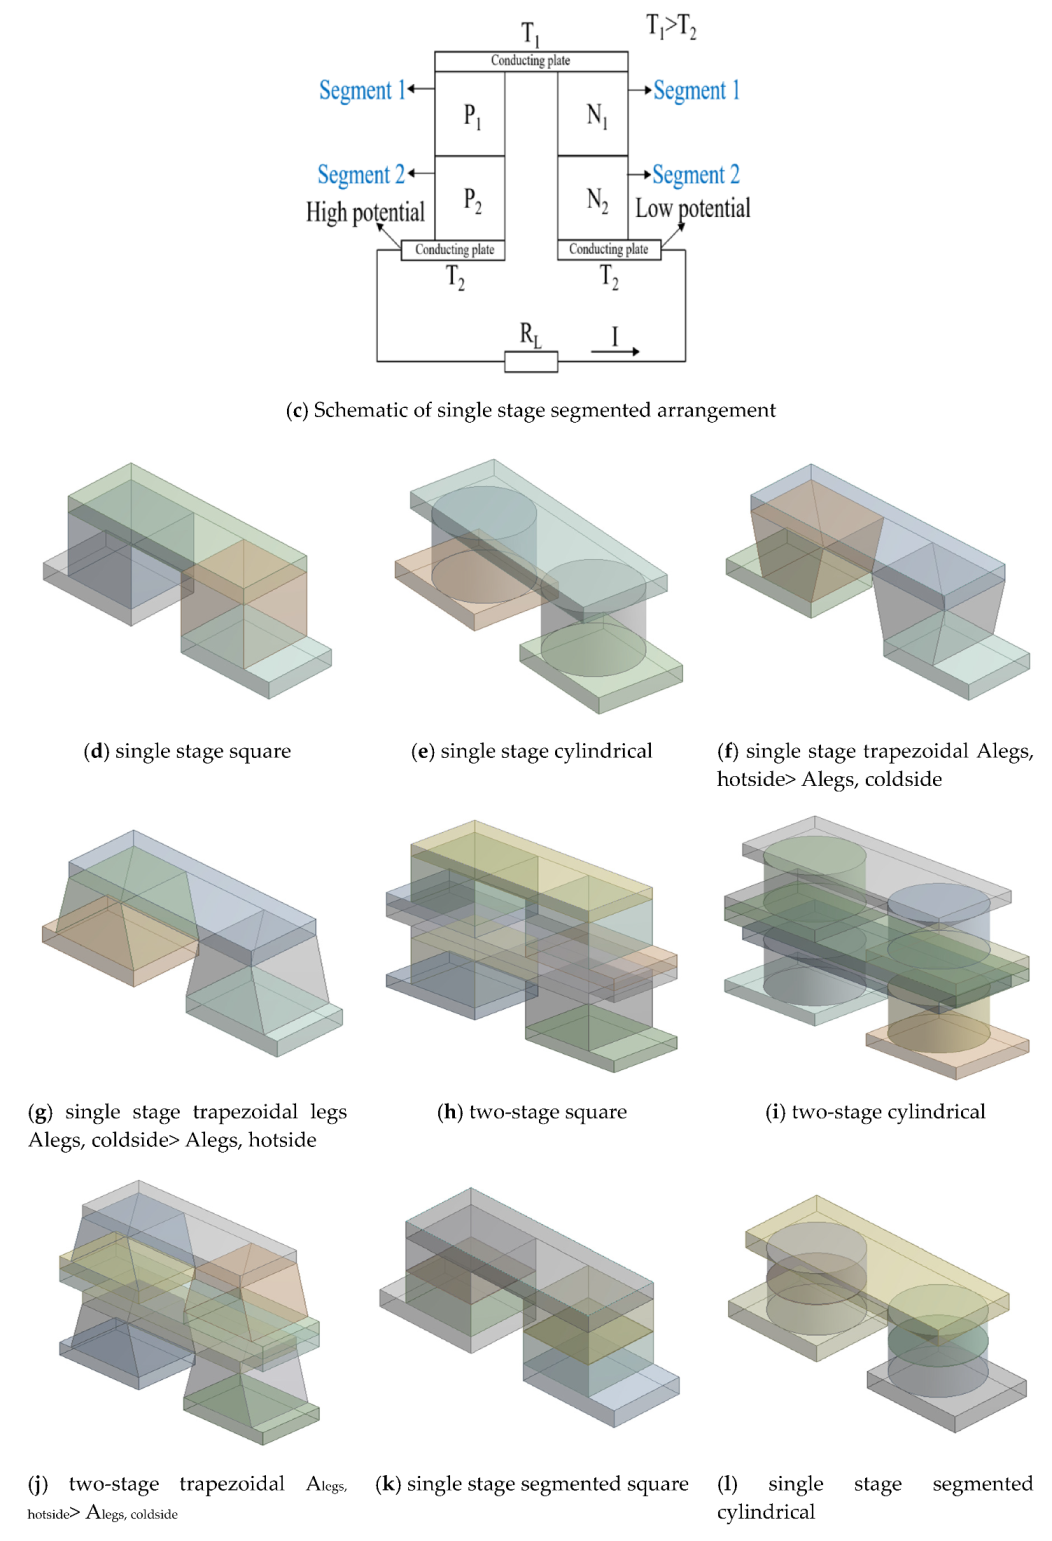
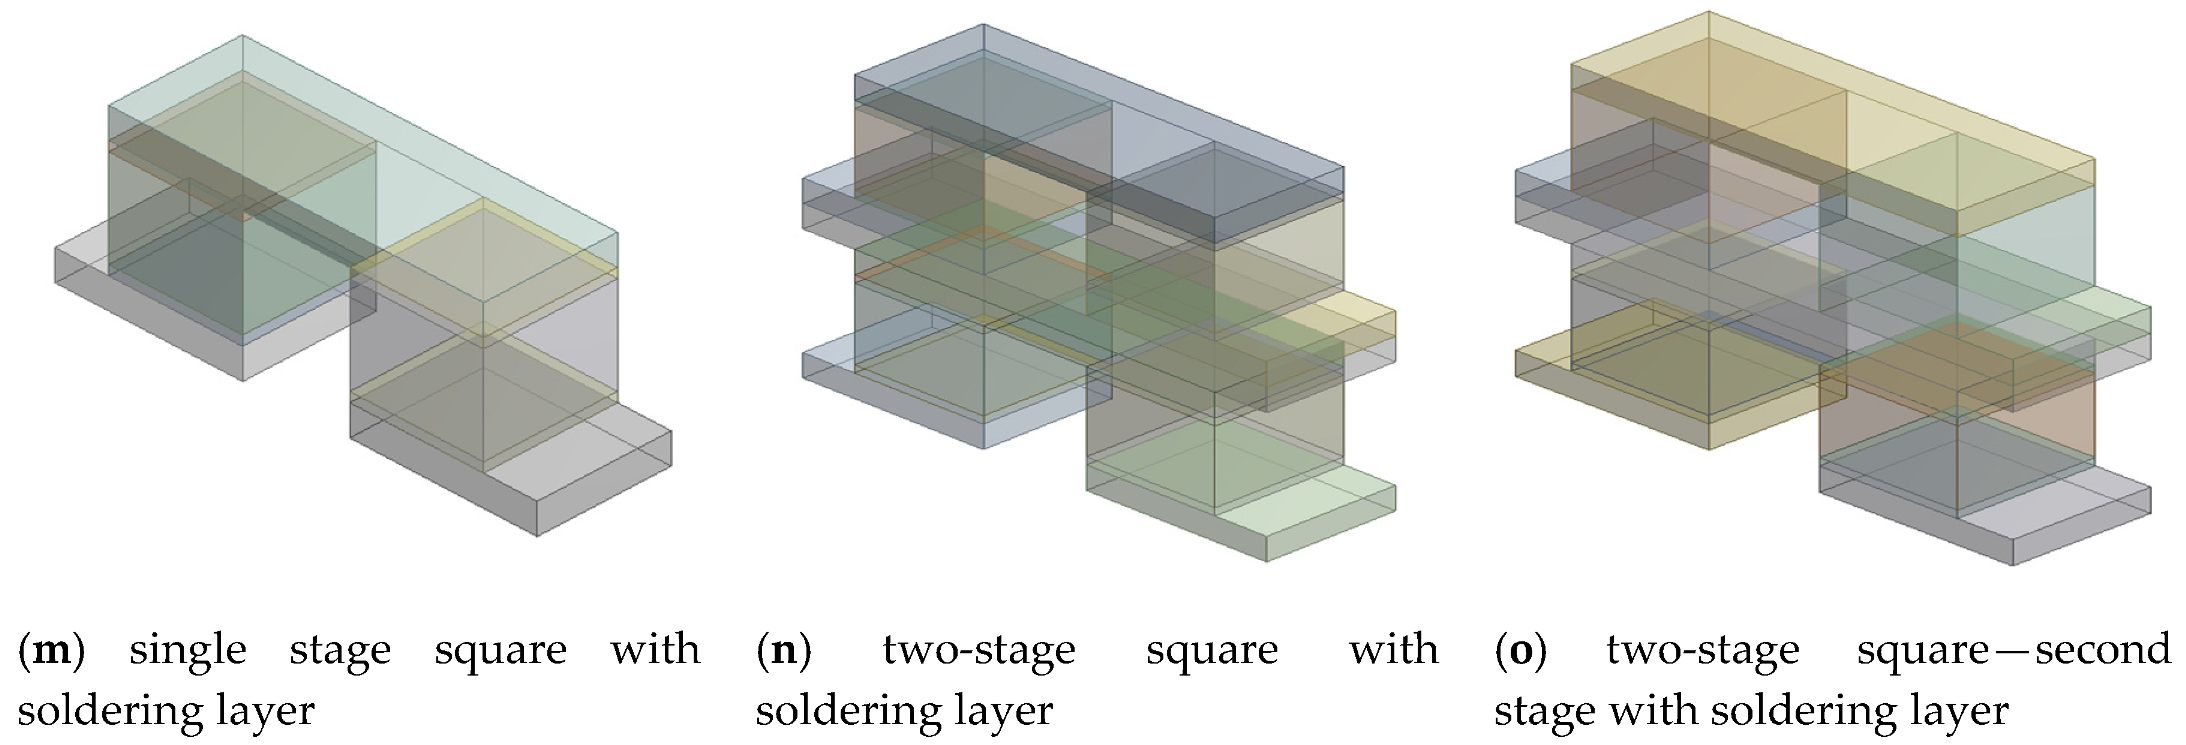
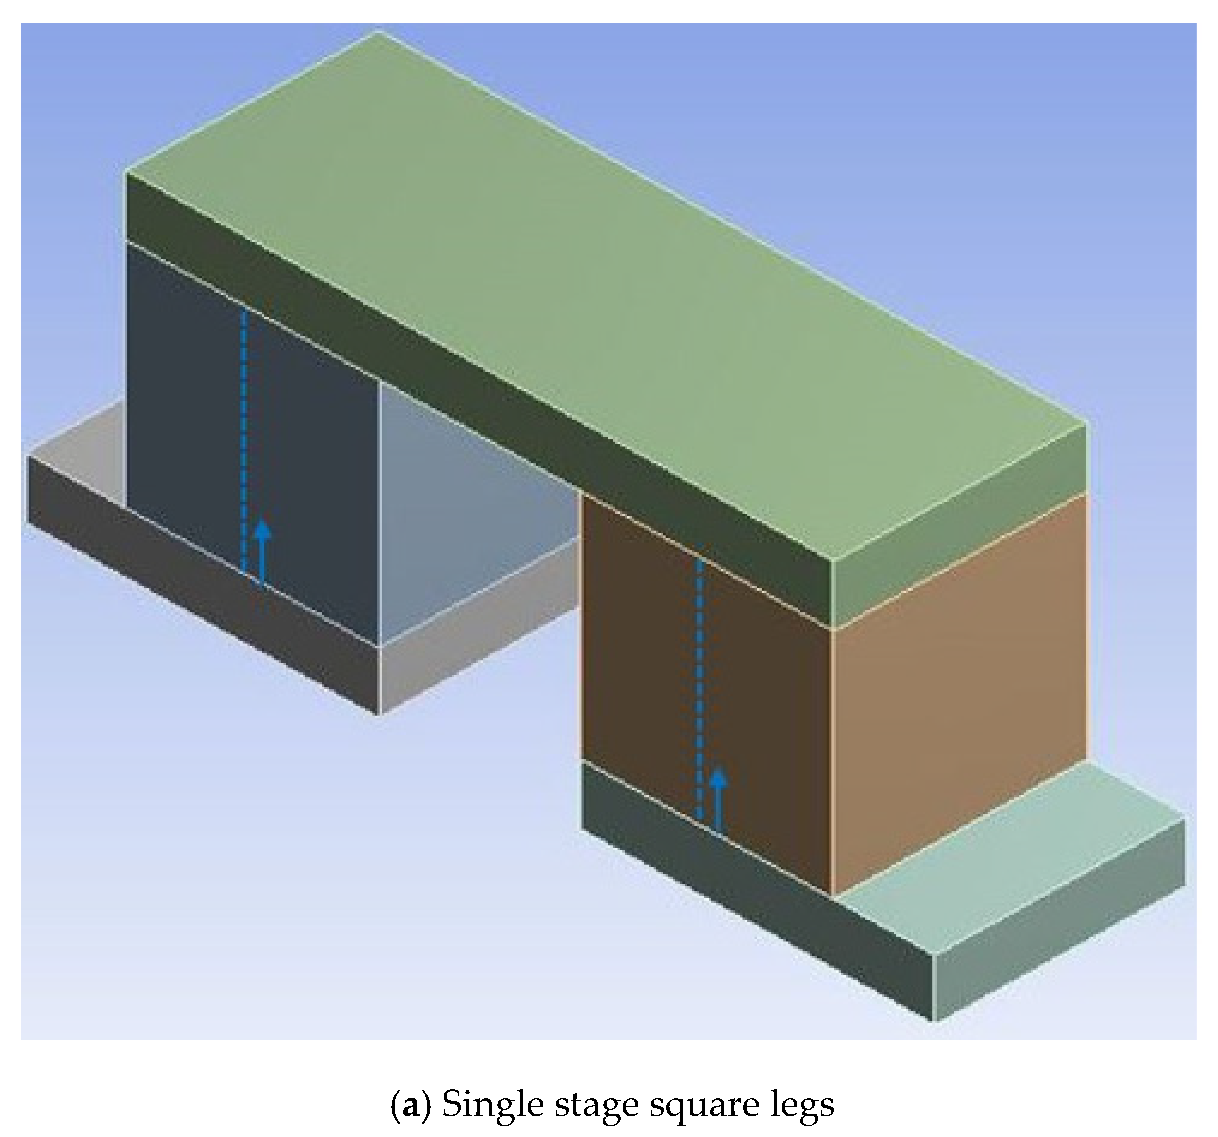
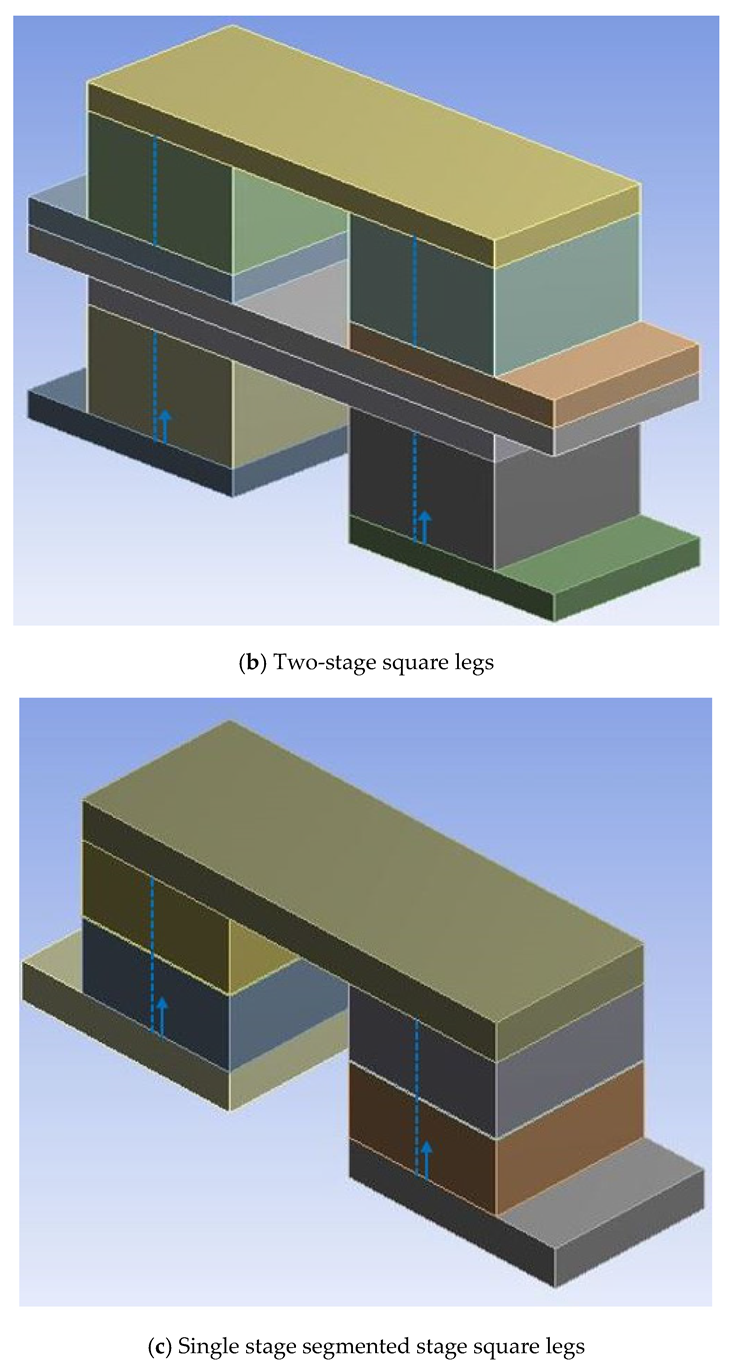
2.1. Geometry and Material Specifications
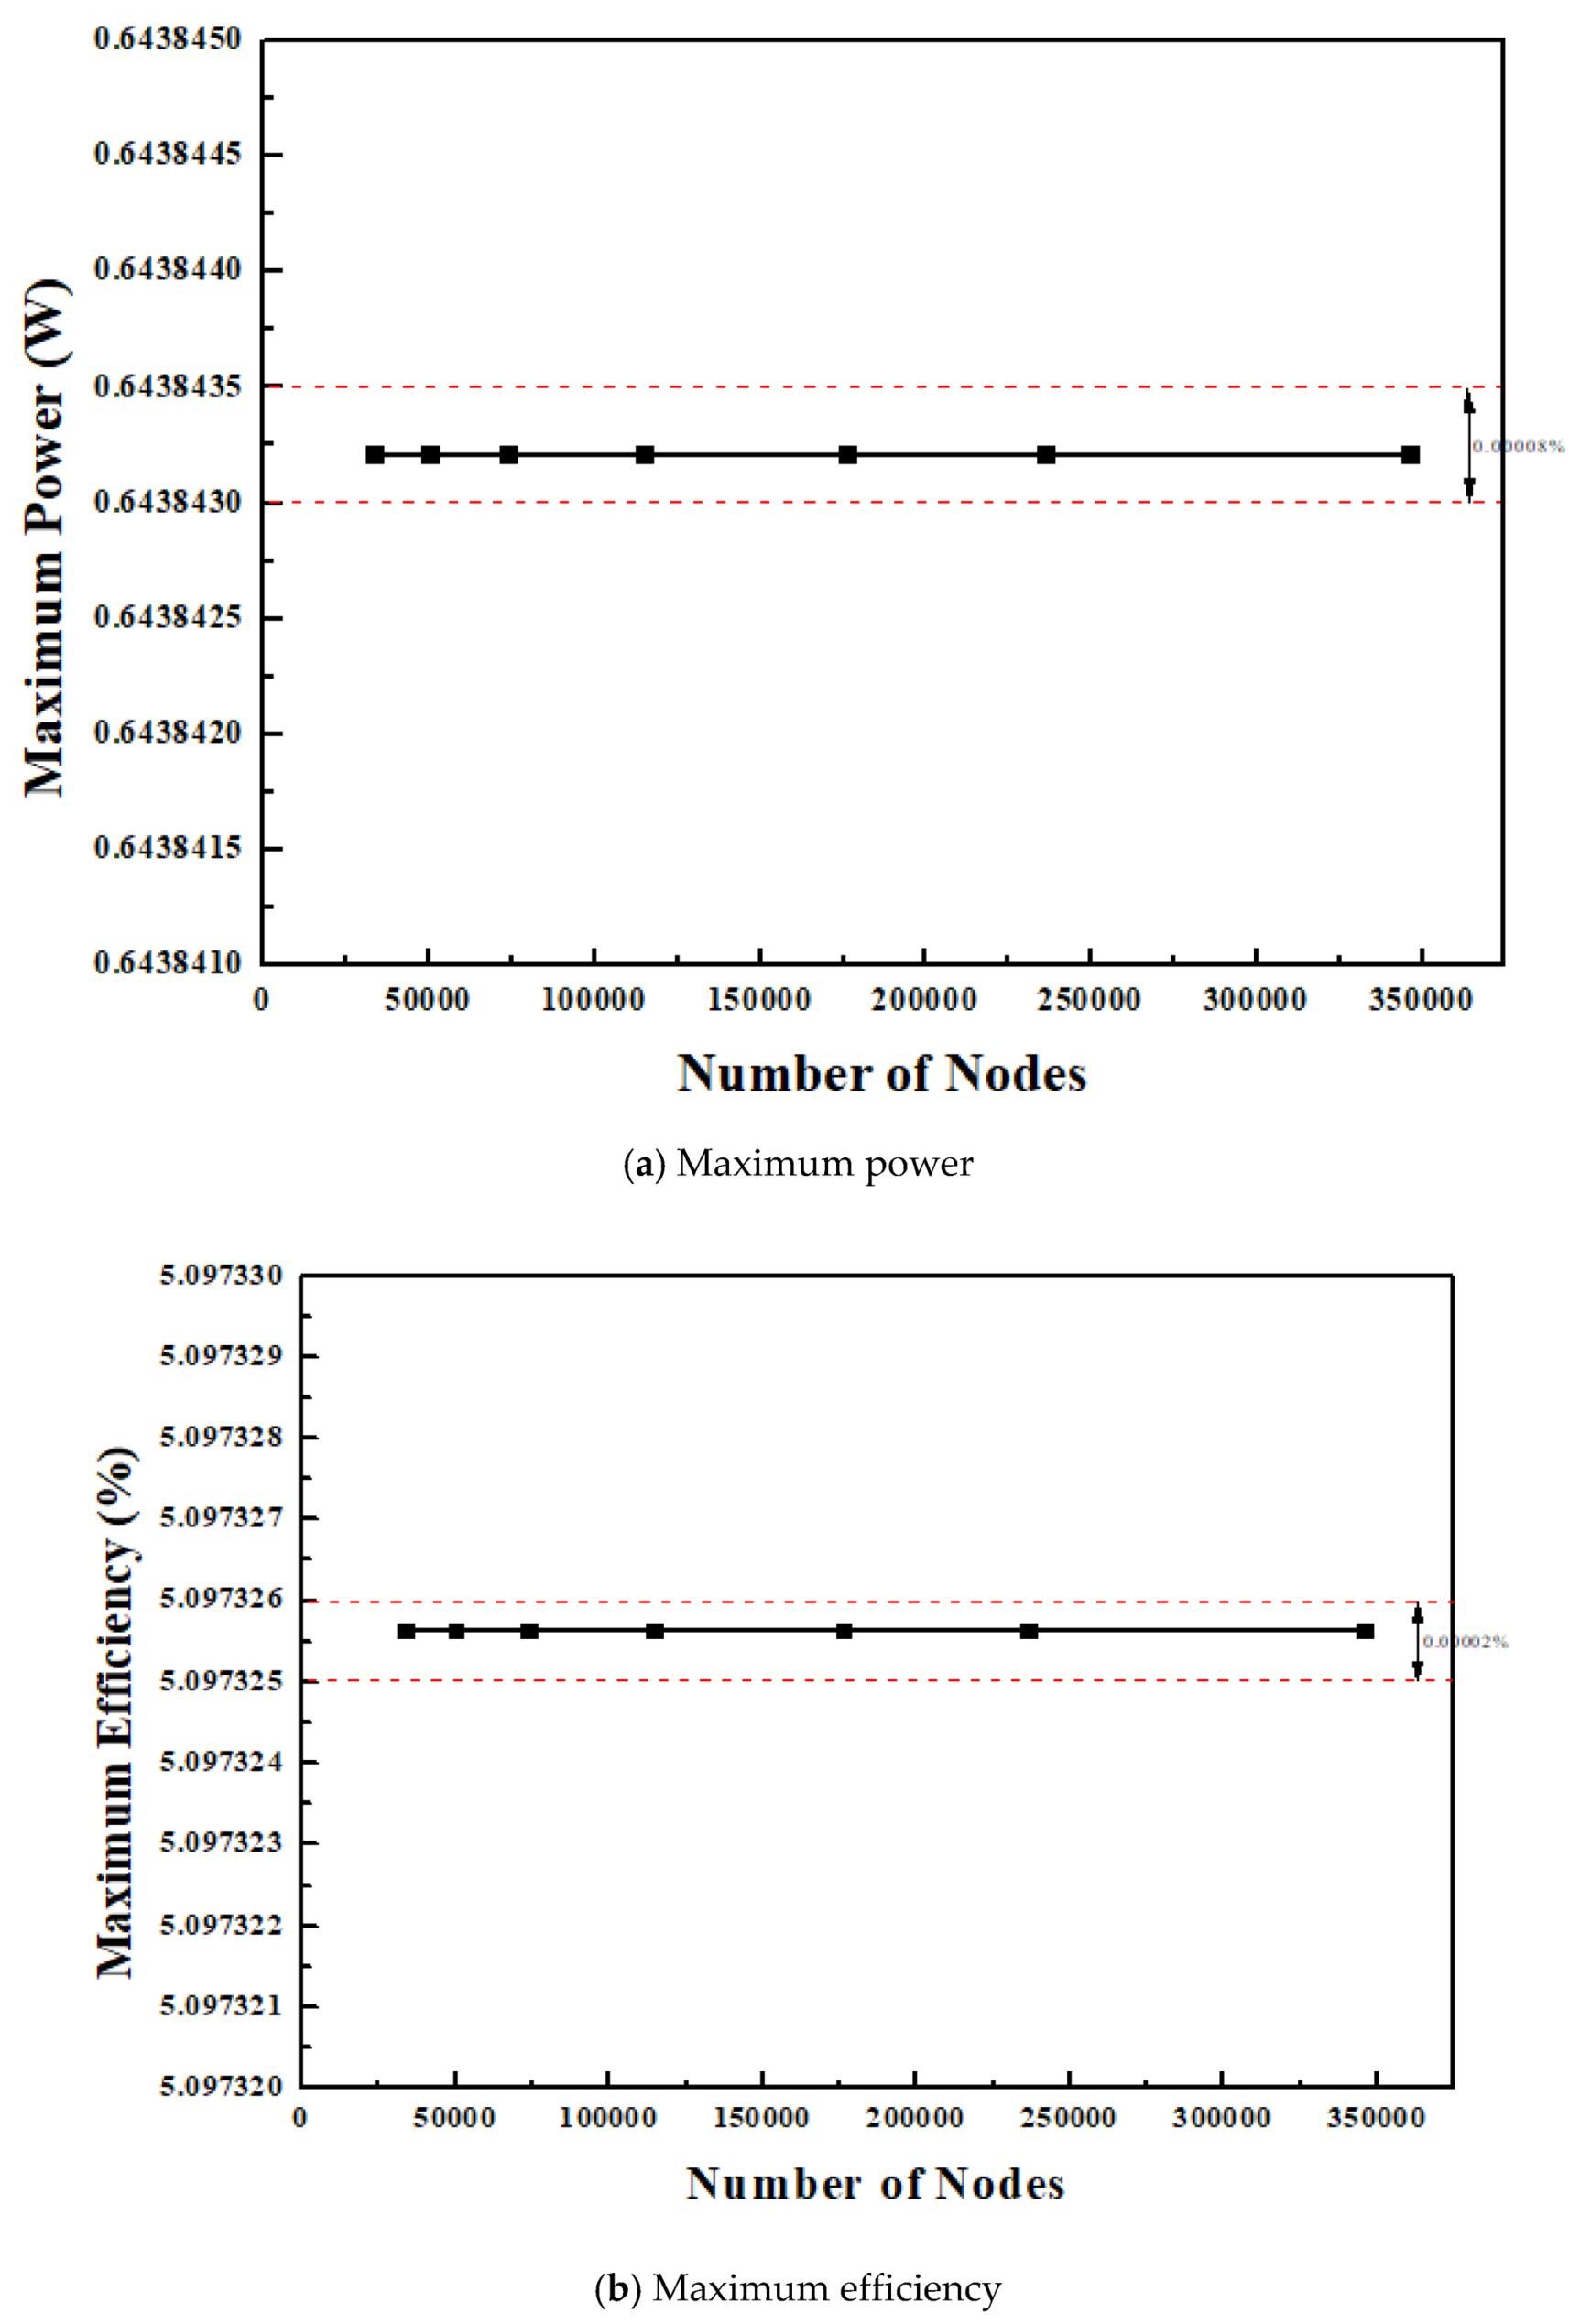
2.2. Mesh Convergence
2.3. Boundary Conditions
2.4. Governing Equations
2.5. Data Reduction
2.5.1. Physical Assumptions
2.5.2. Theoretical Analysis
2.5.3. Numerical Analysis
3. Results and Discussion
3.1. Validation
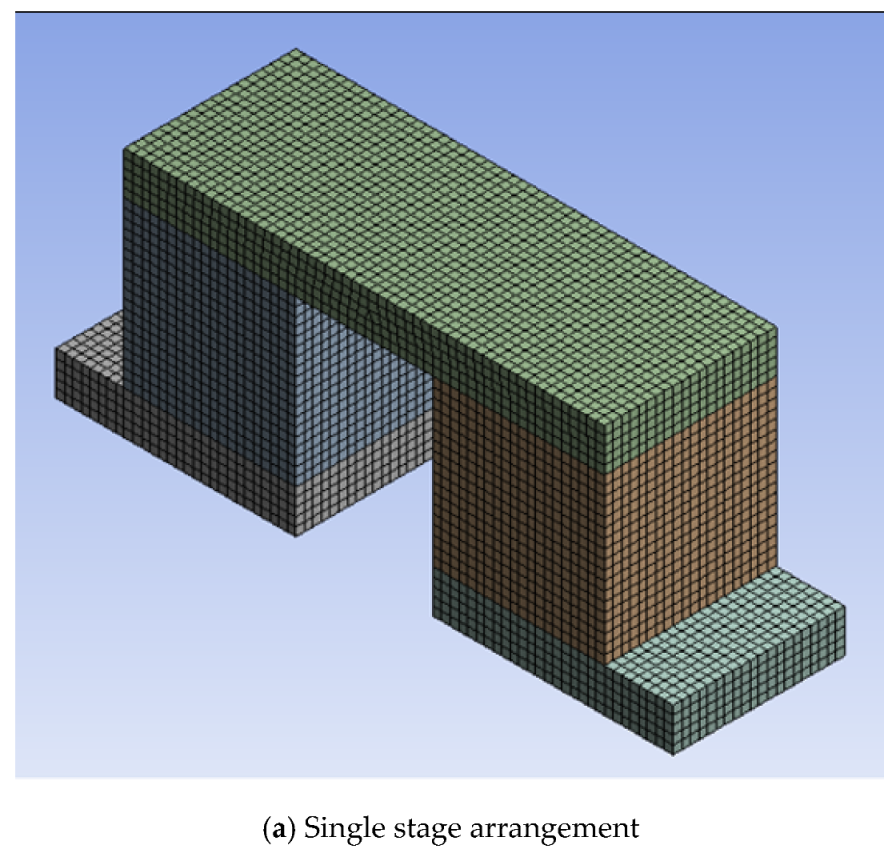
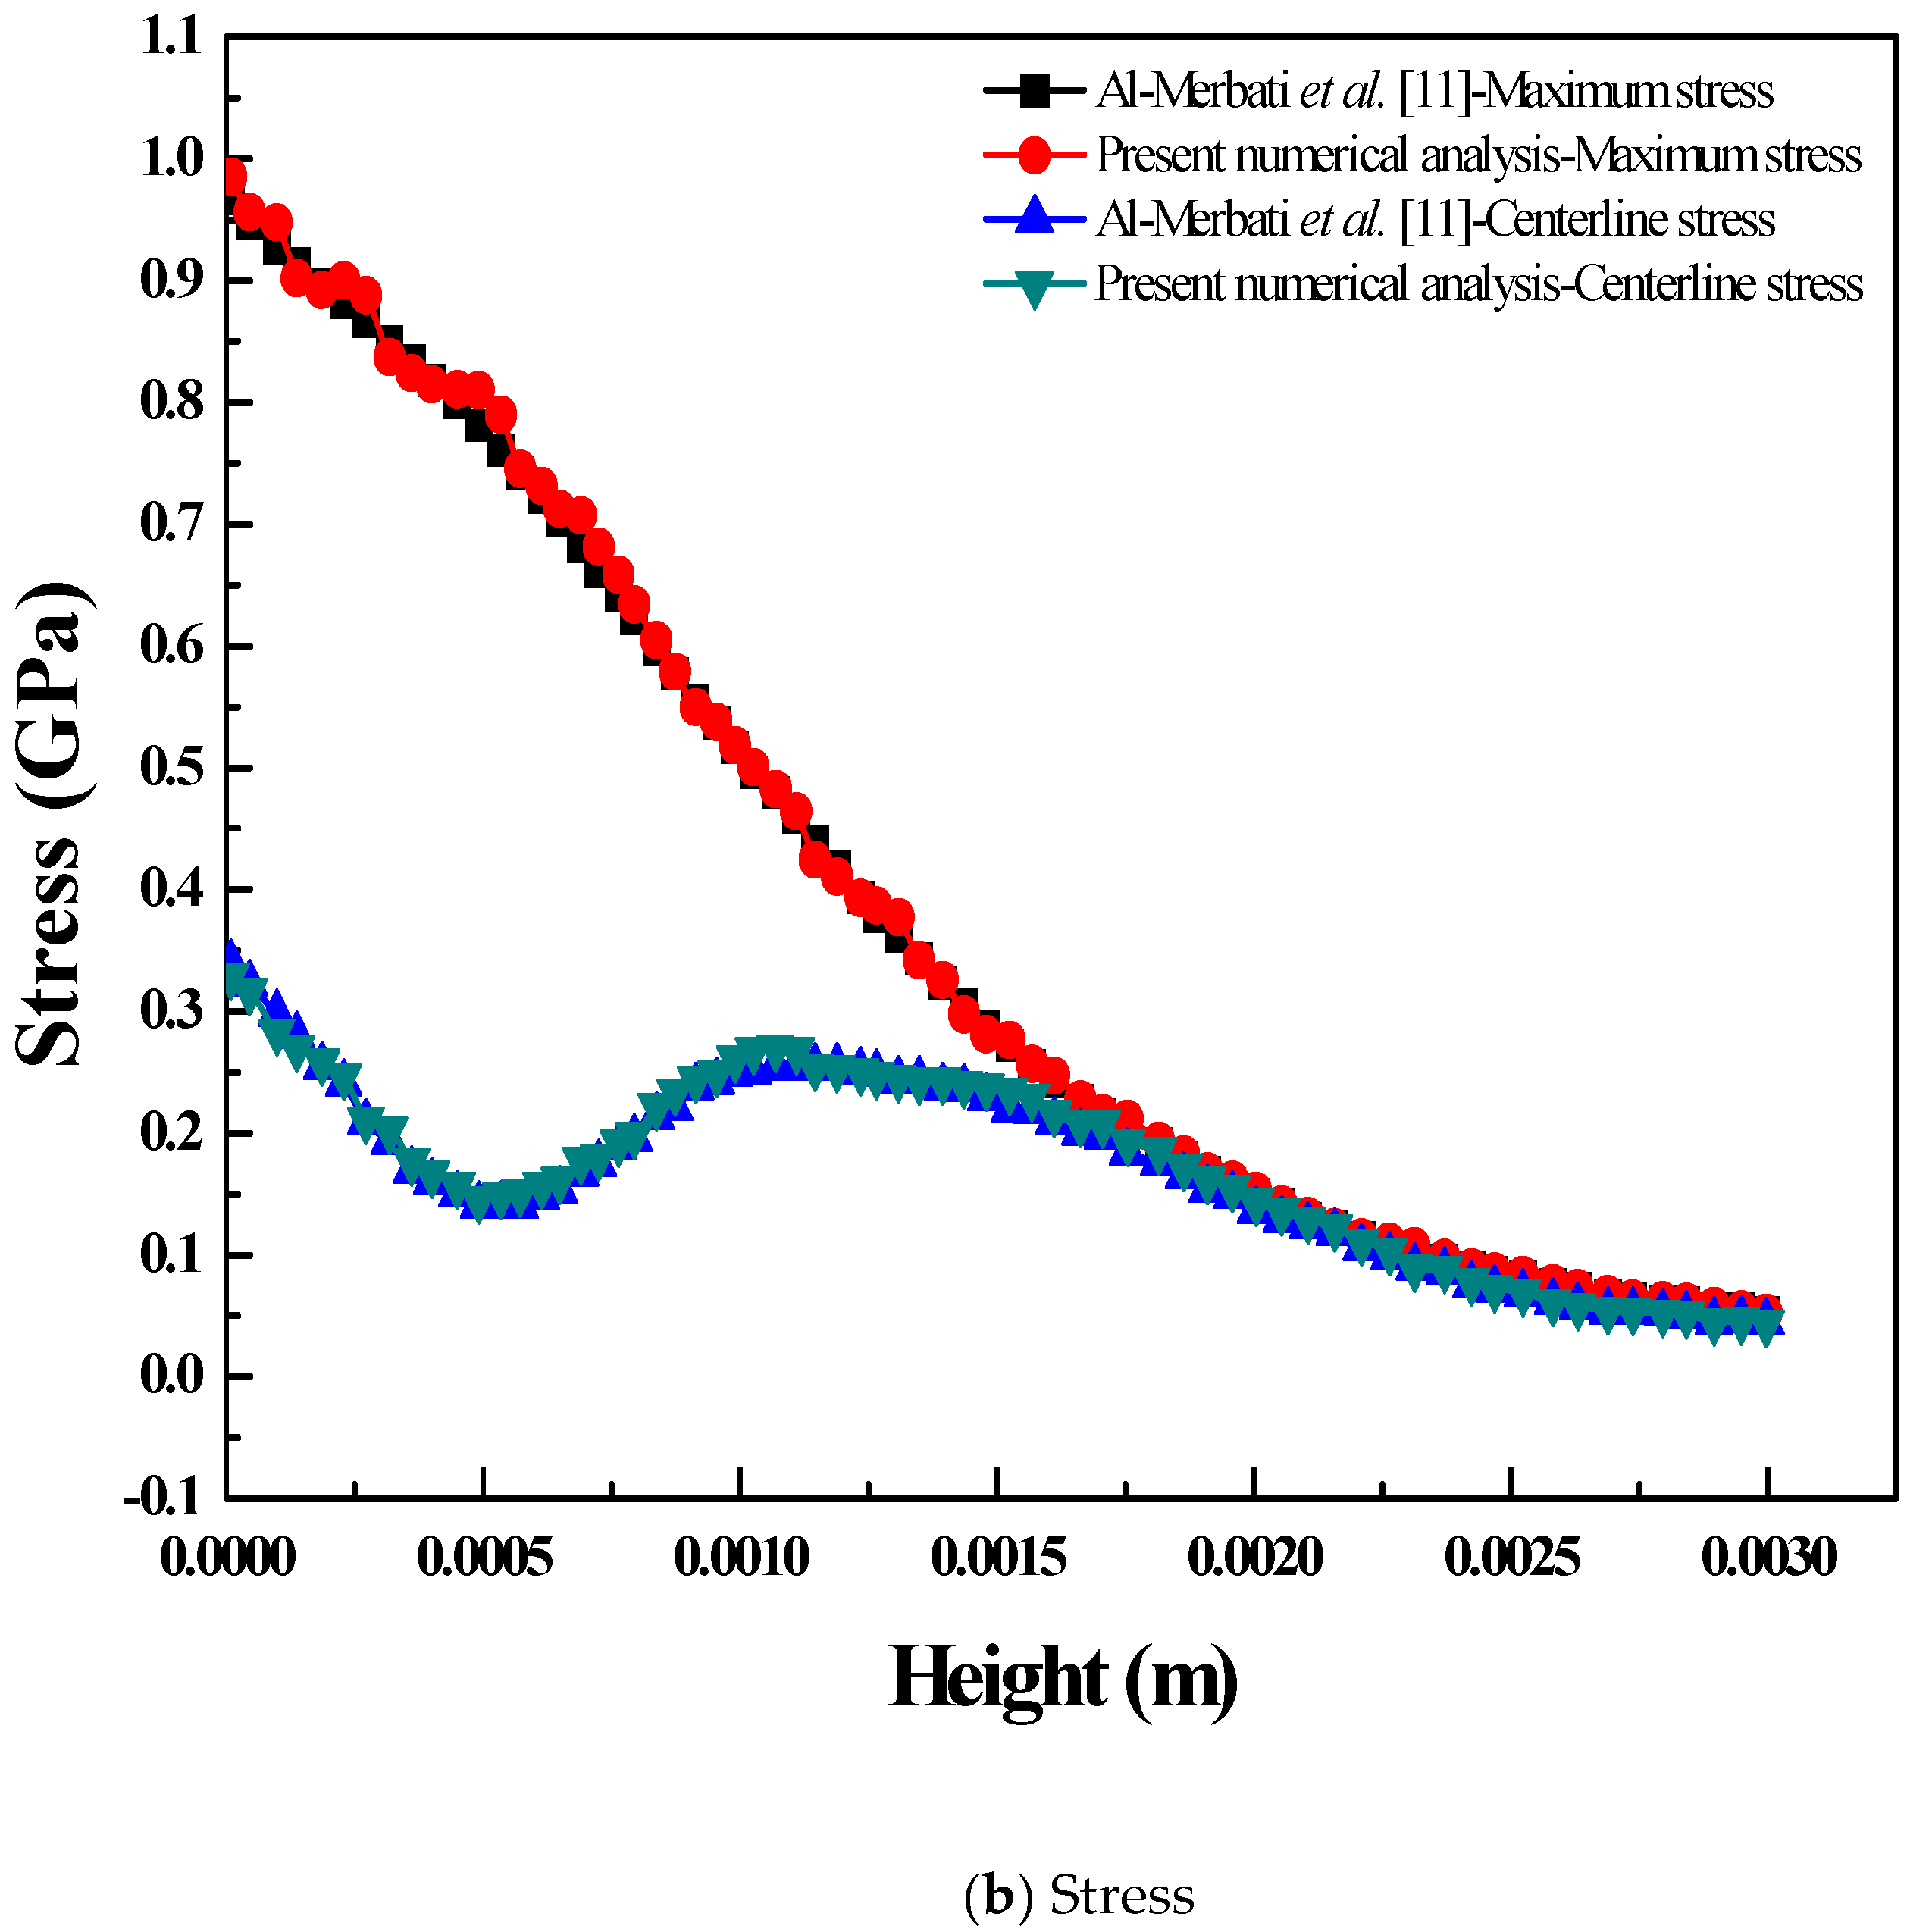
3.1.1. Code Validation
3.1.2. Validation of Numerical Results with Theoretical Results
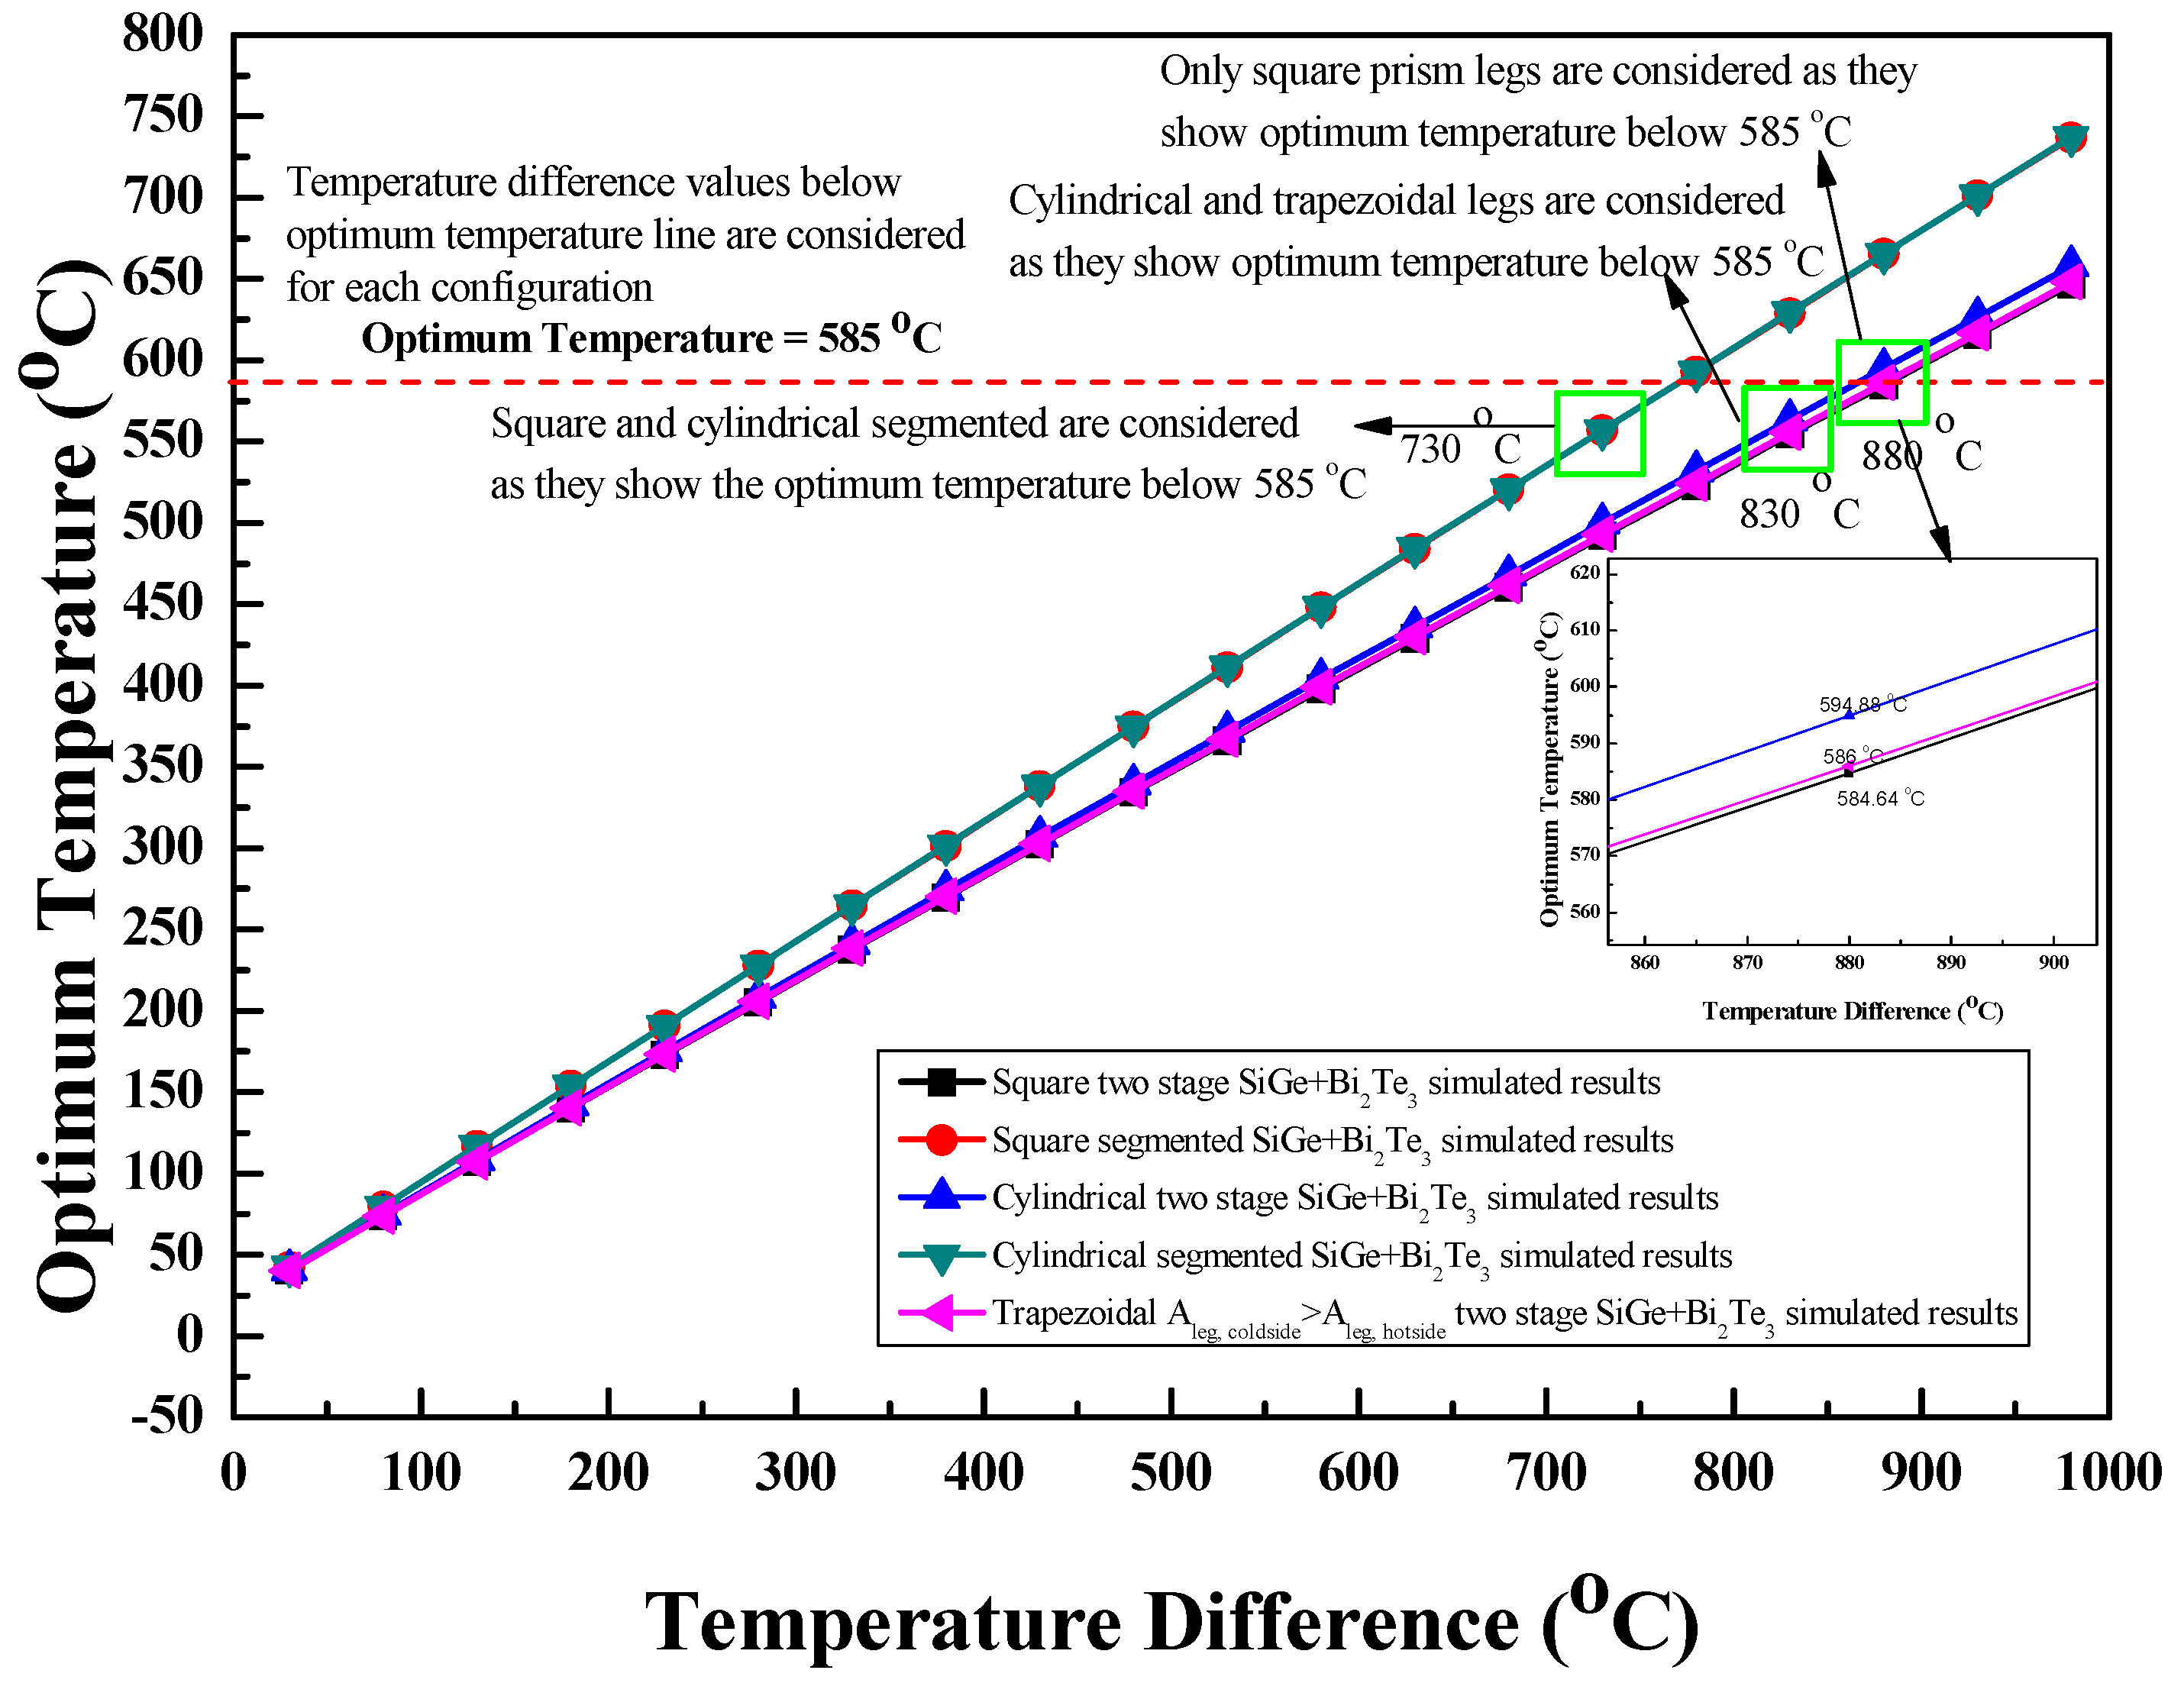
3.2. Optimum Temperature
3.3. Maximum Power
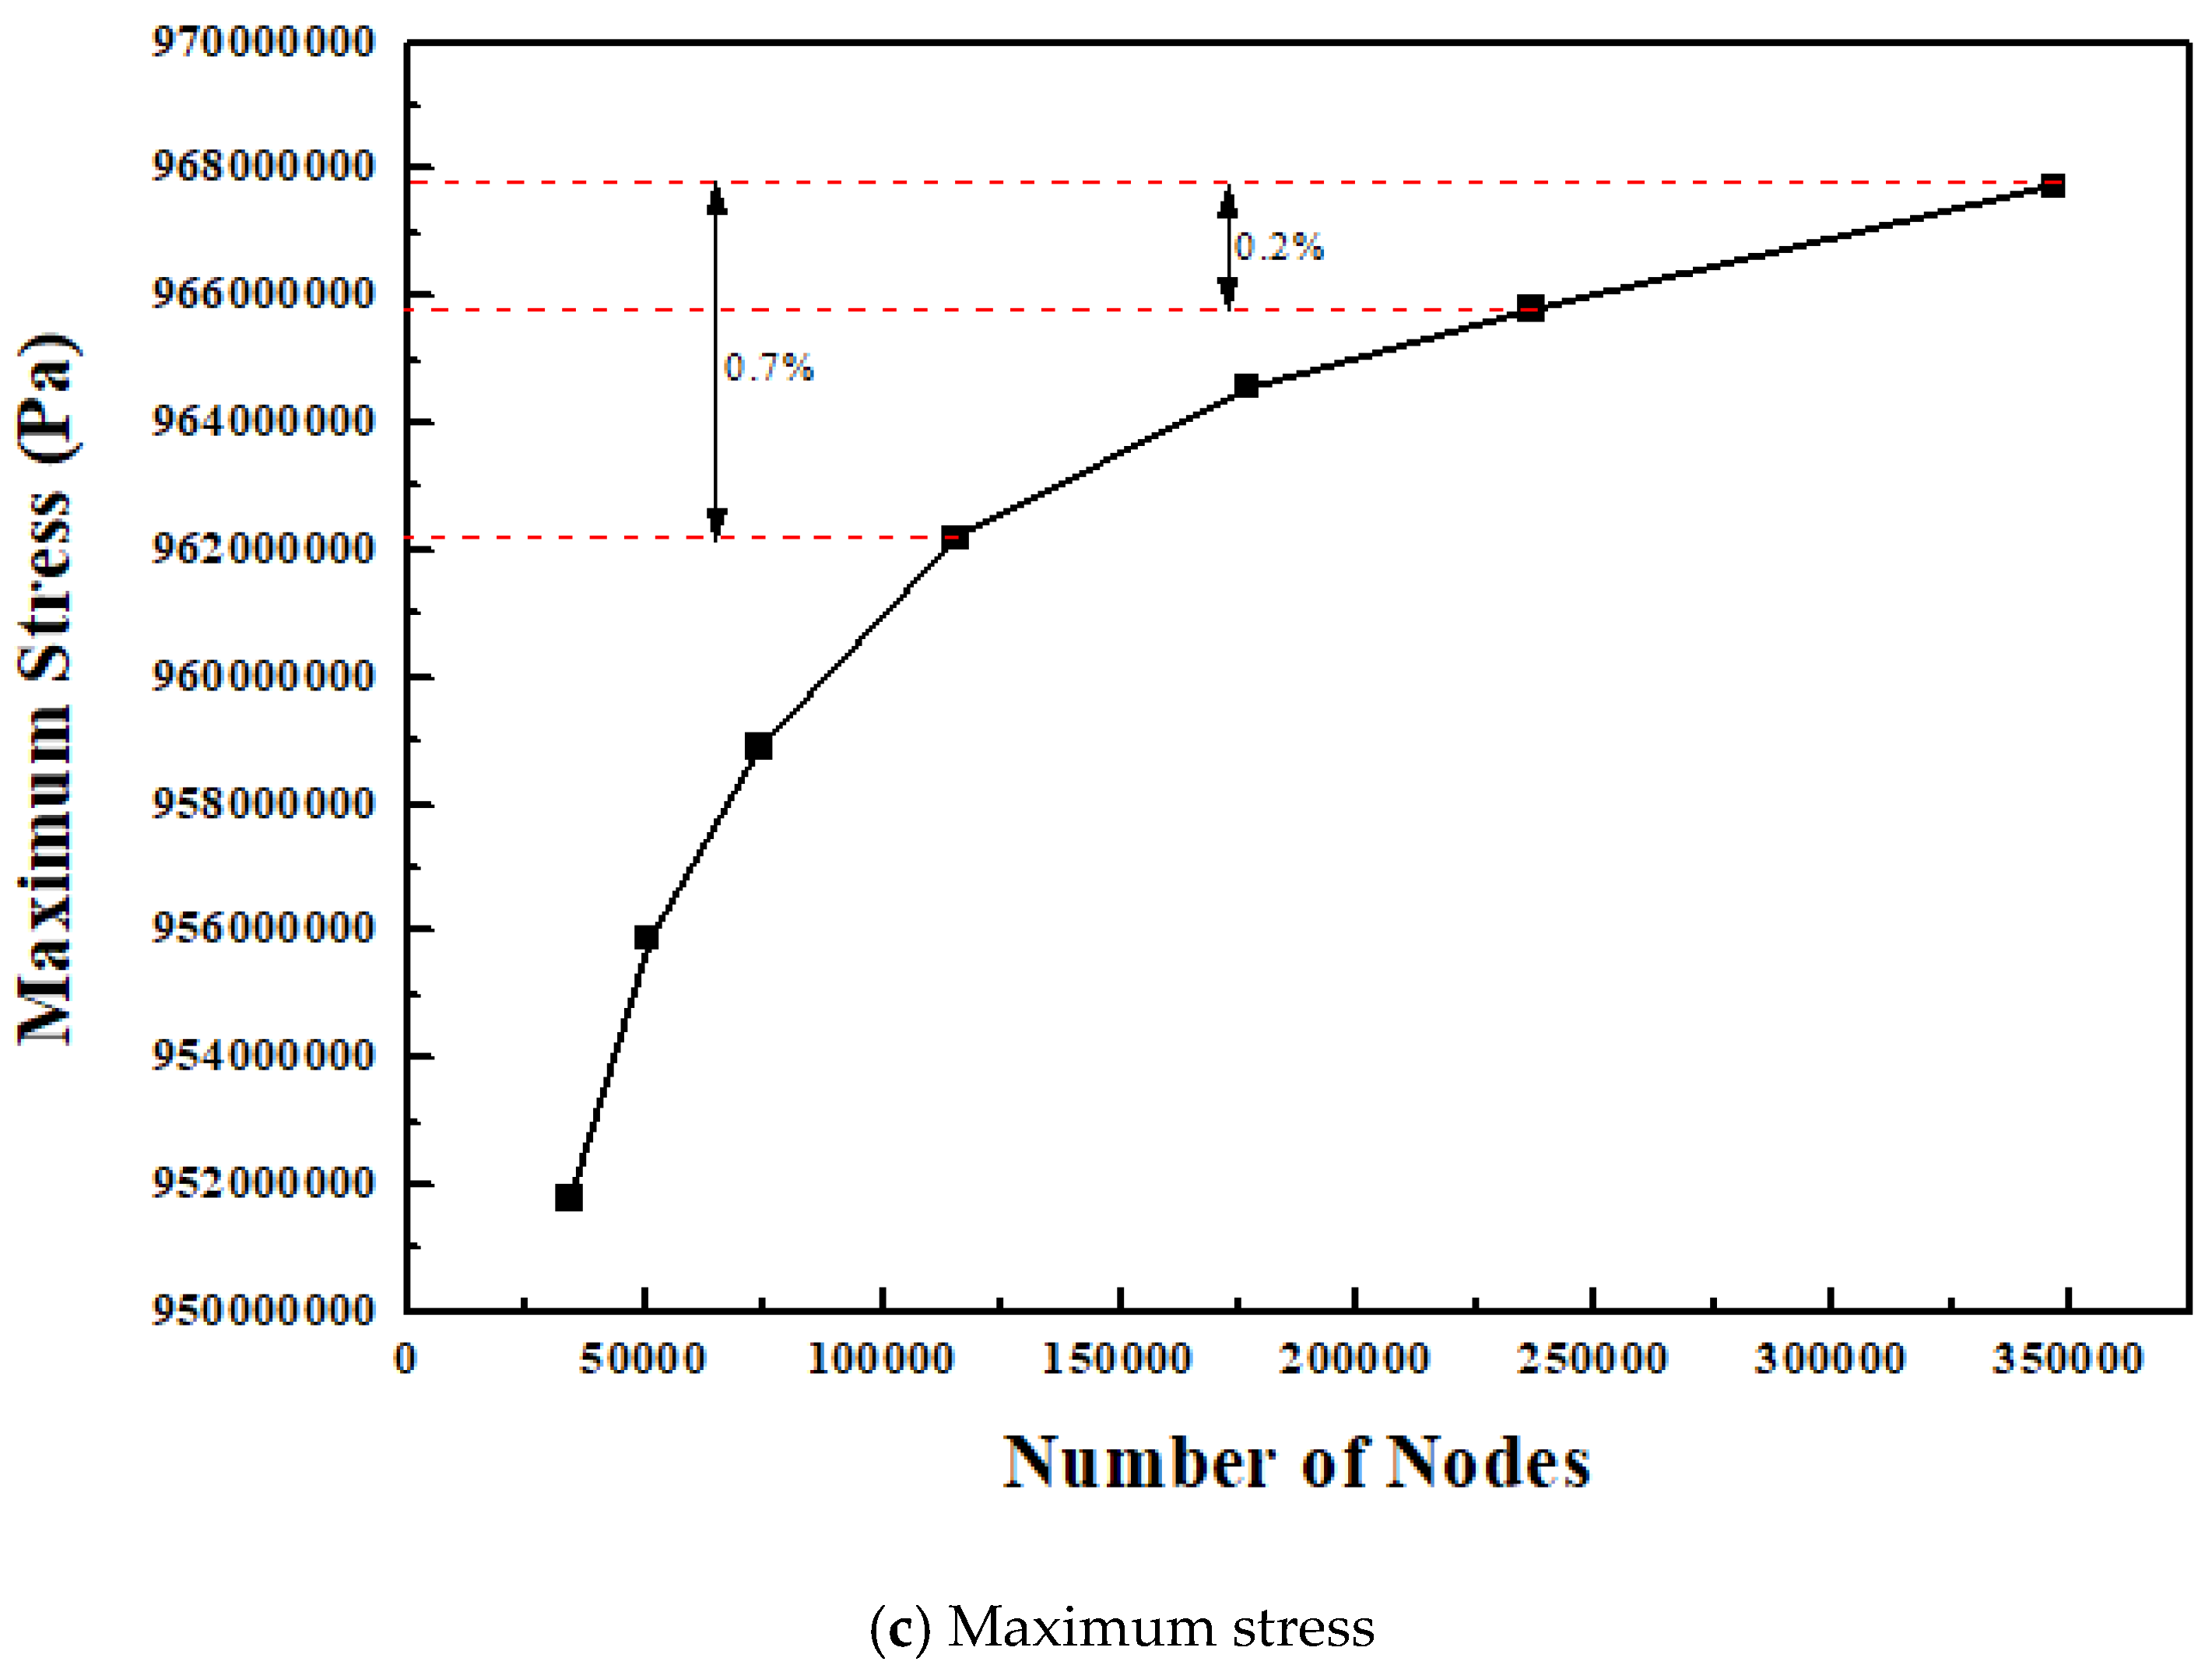
3.3.1. Single Stage Arrangement
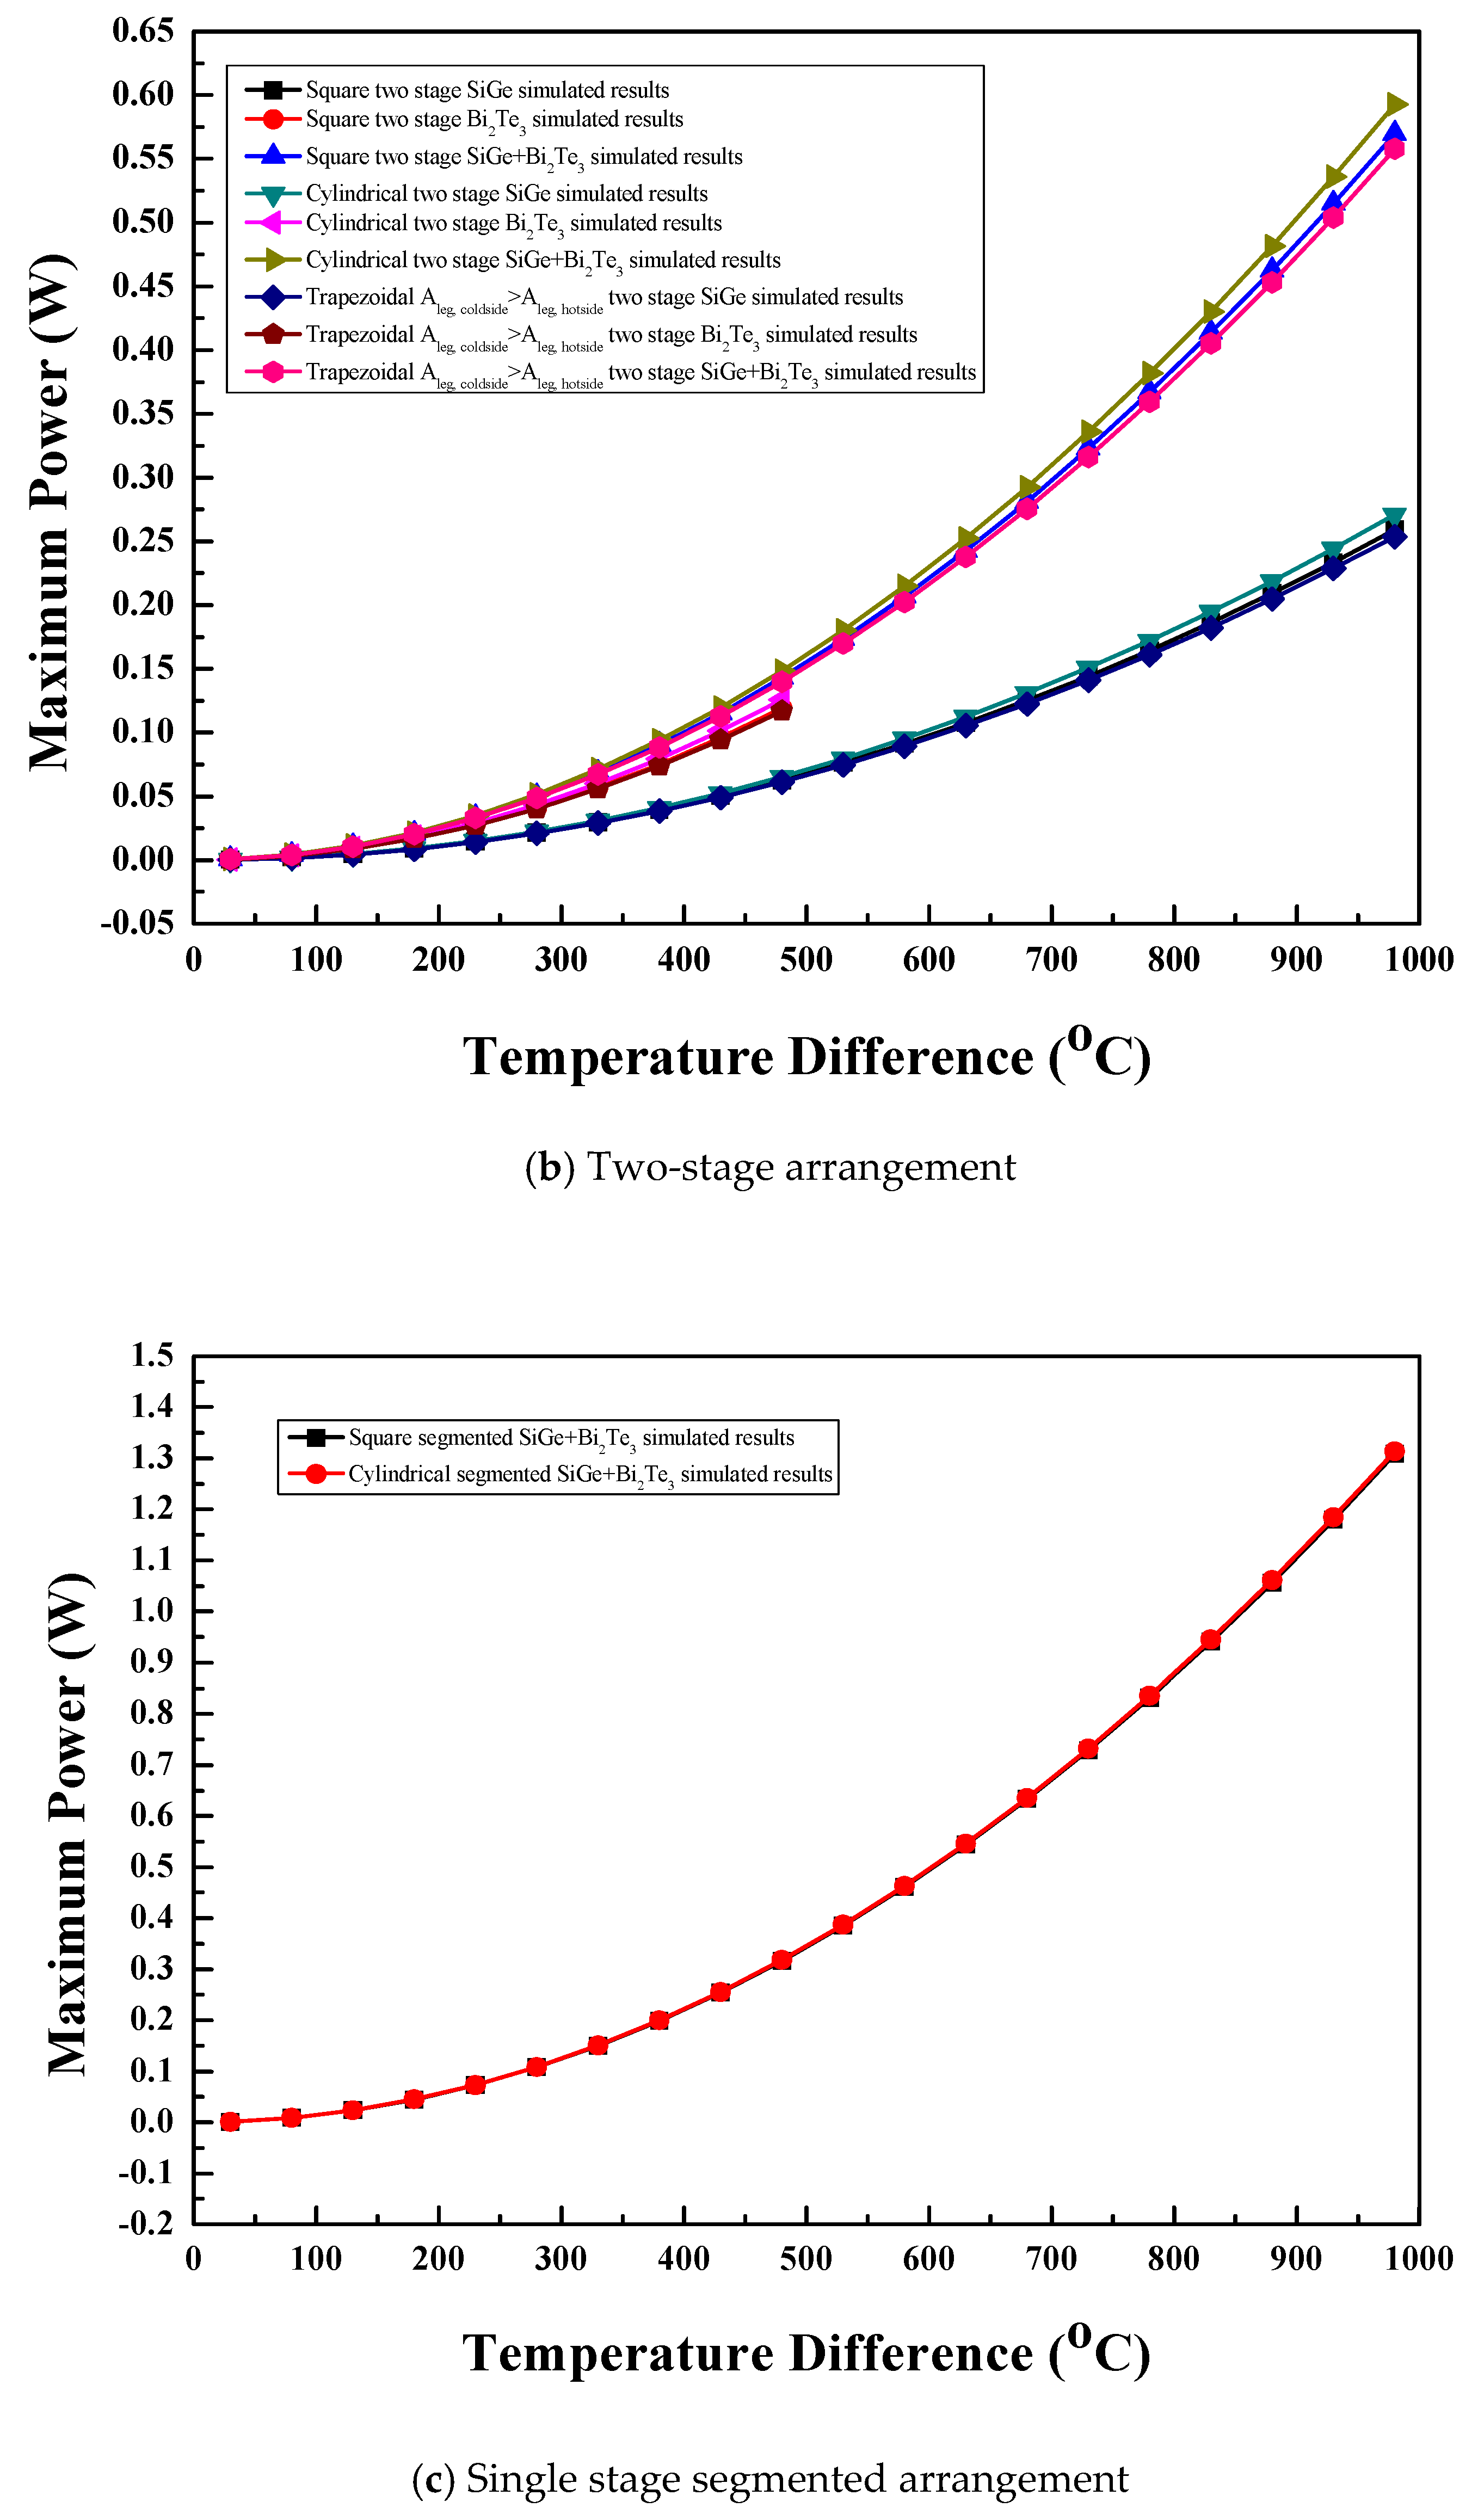
3.3.2. Two-Stage Arrangement
3.3.3. Single Stage Segmented Arrangement
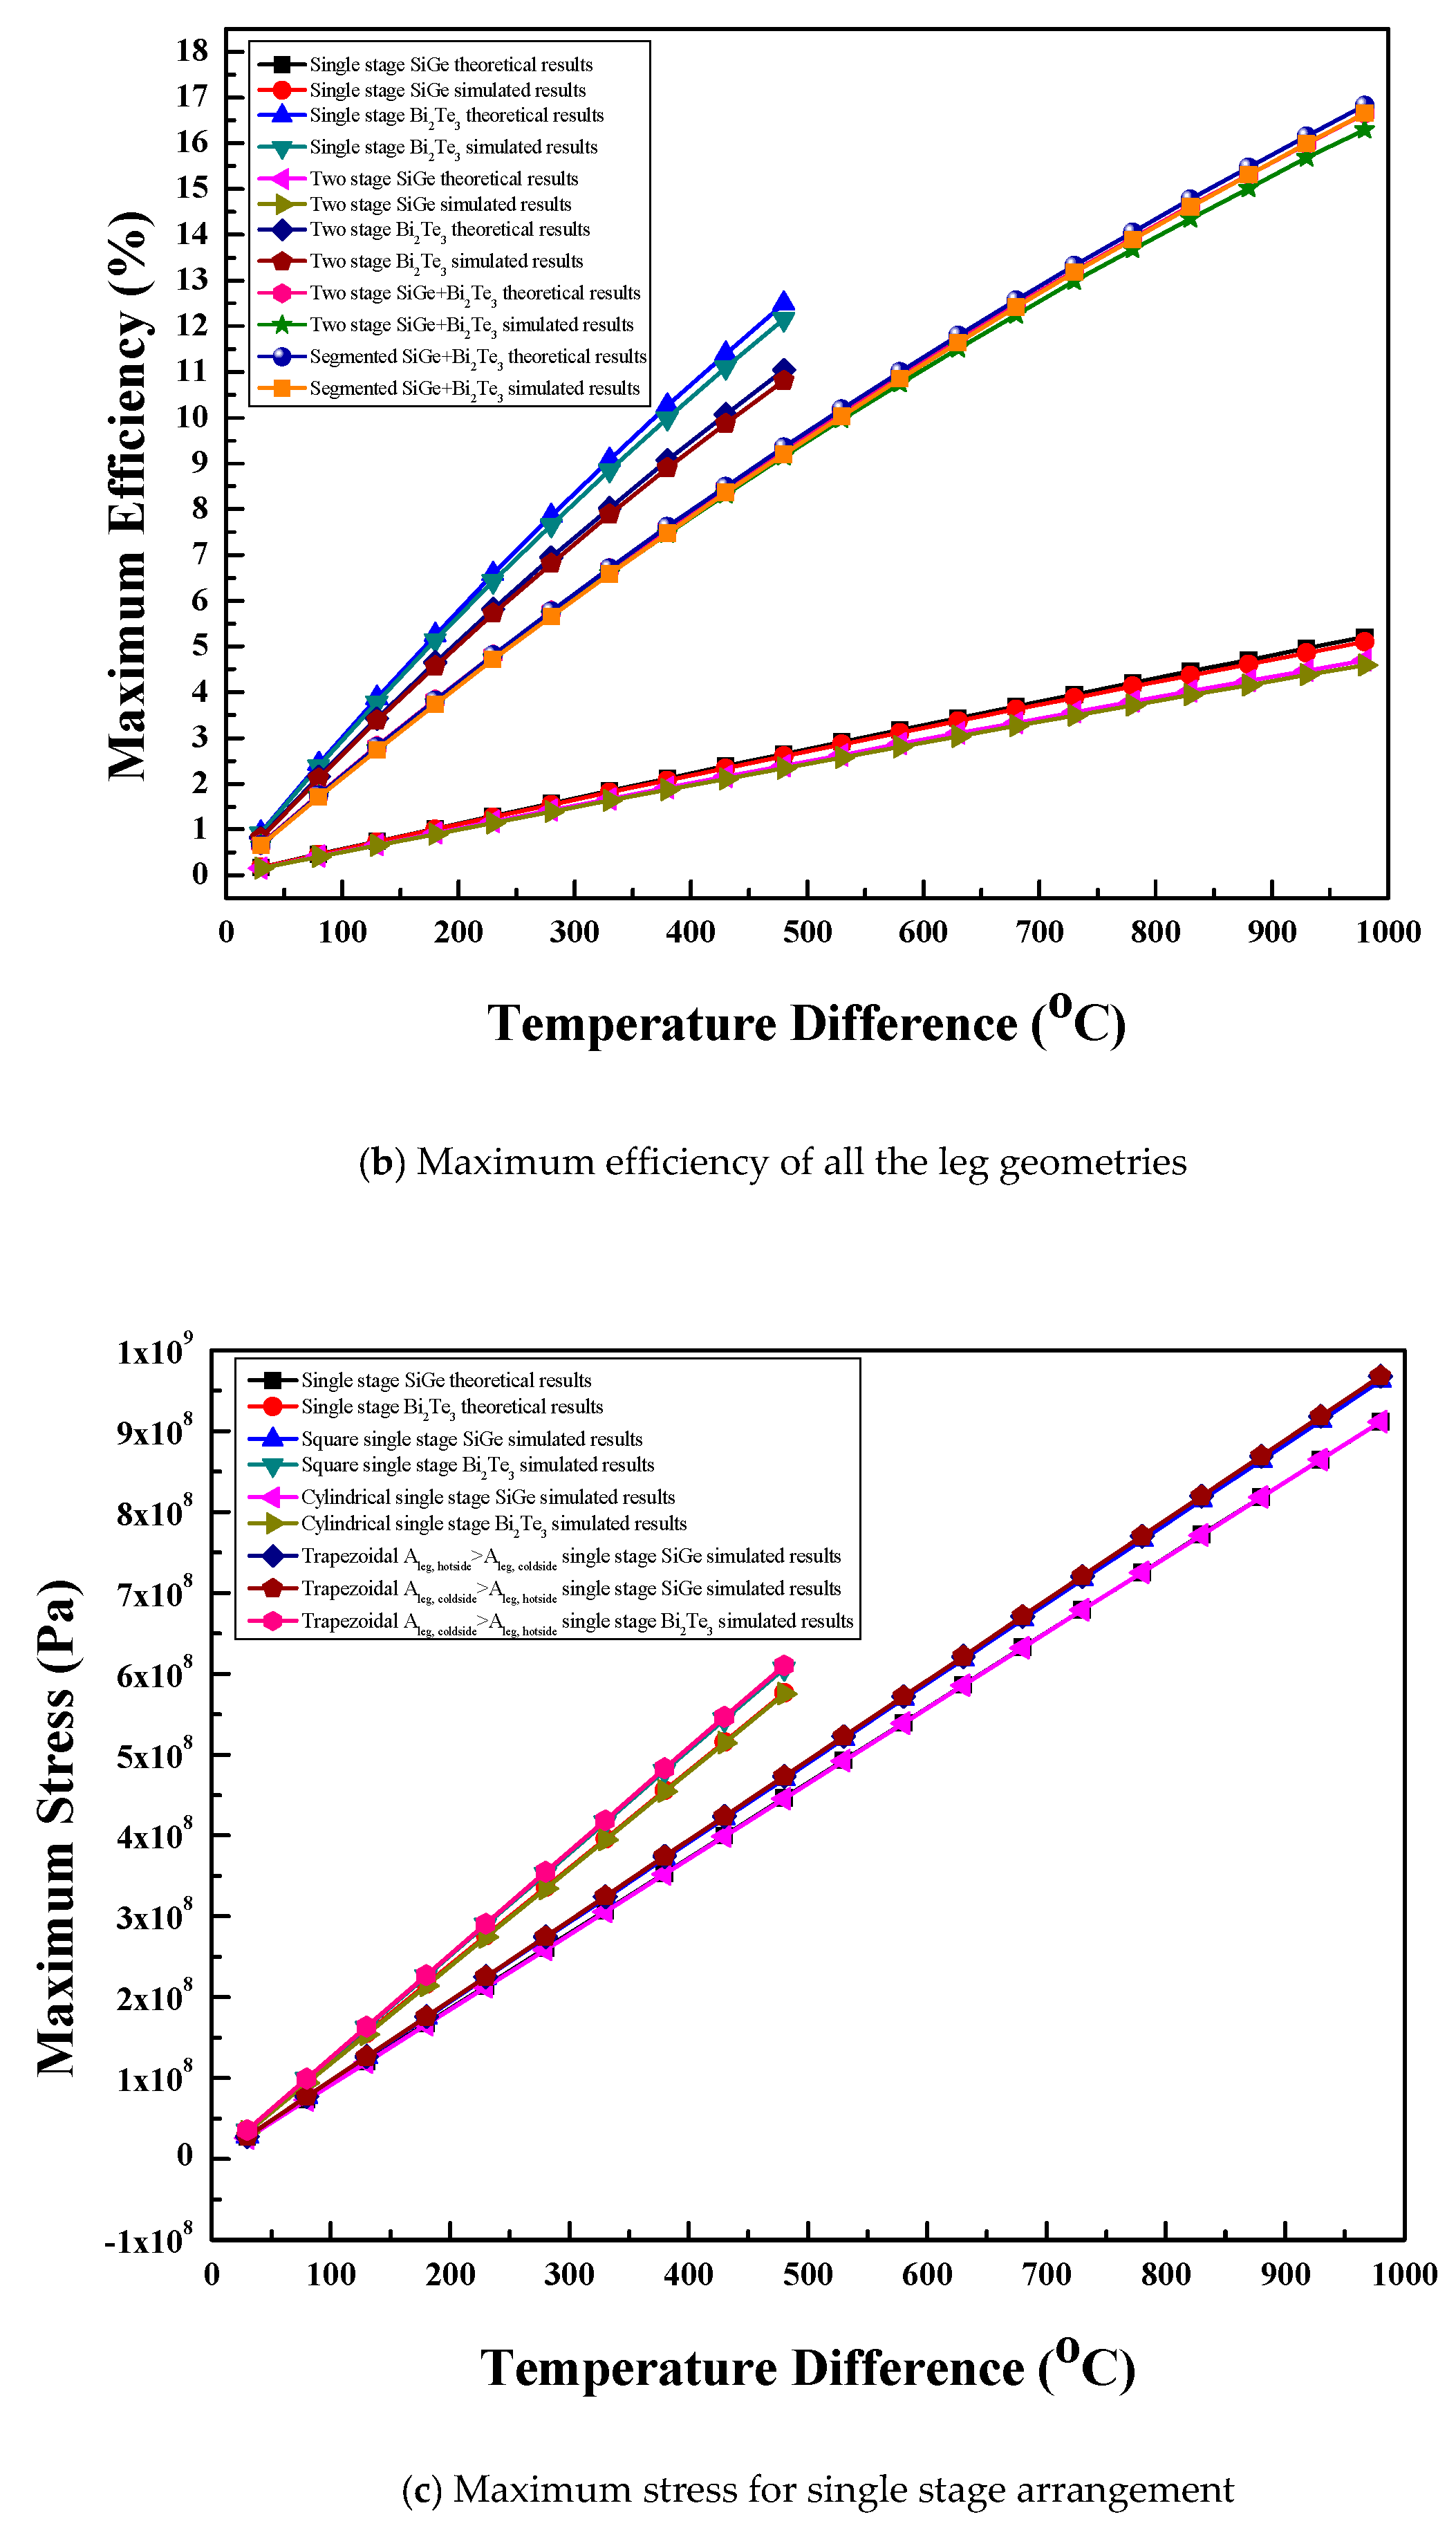
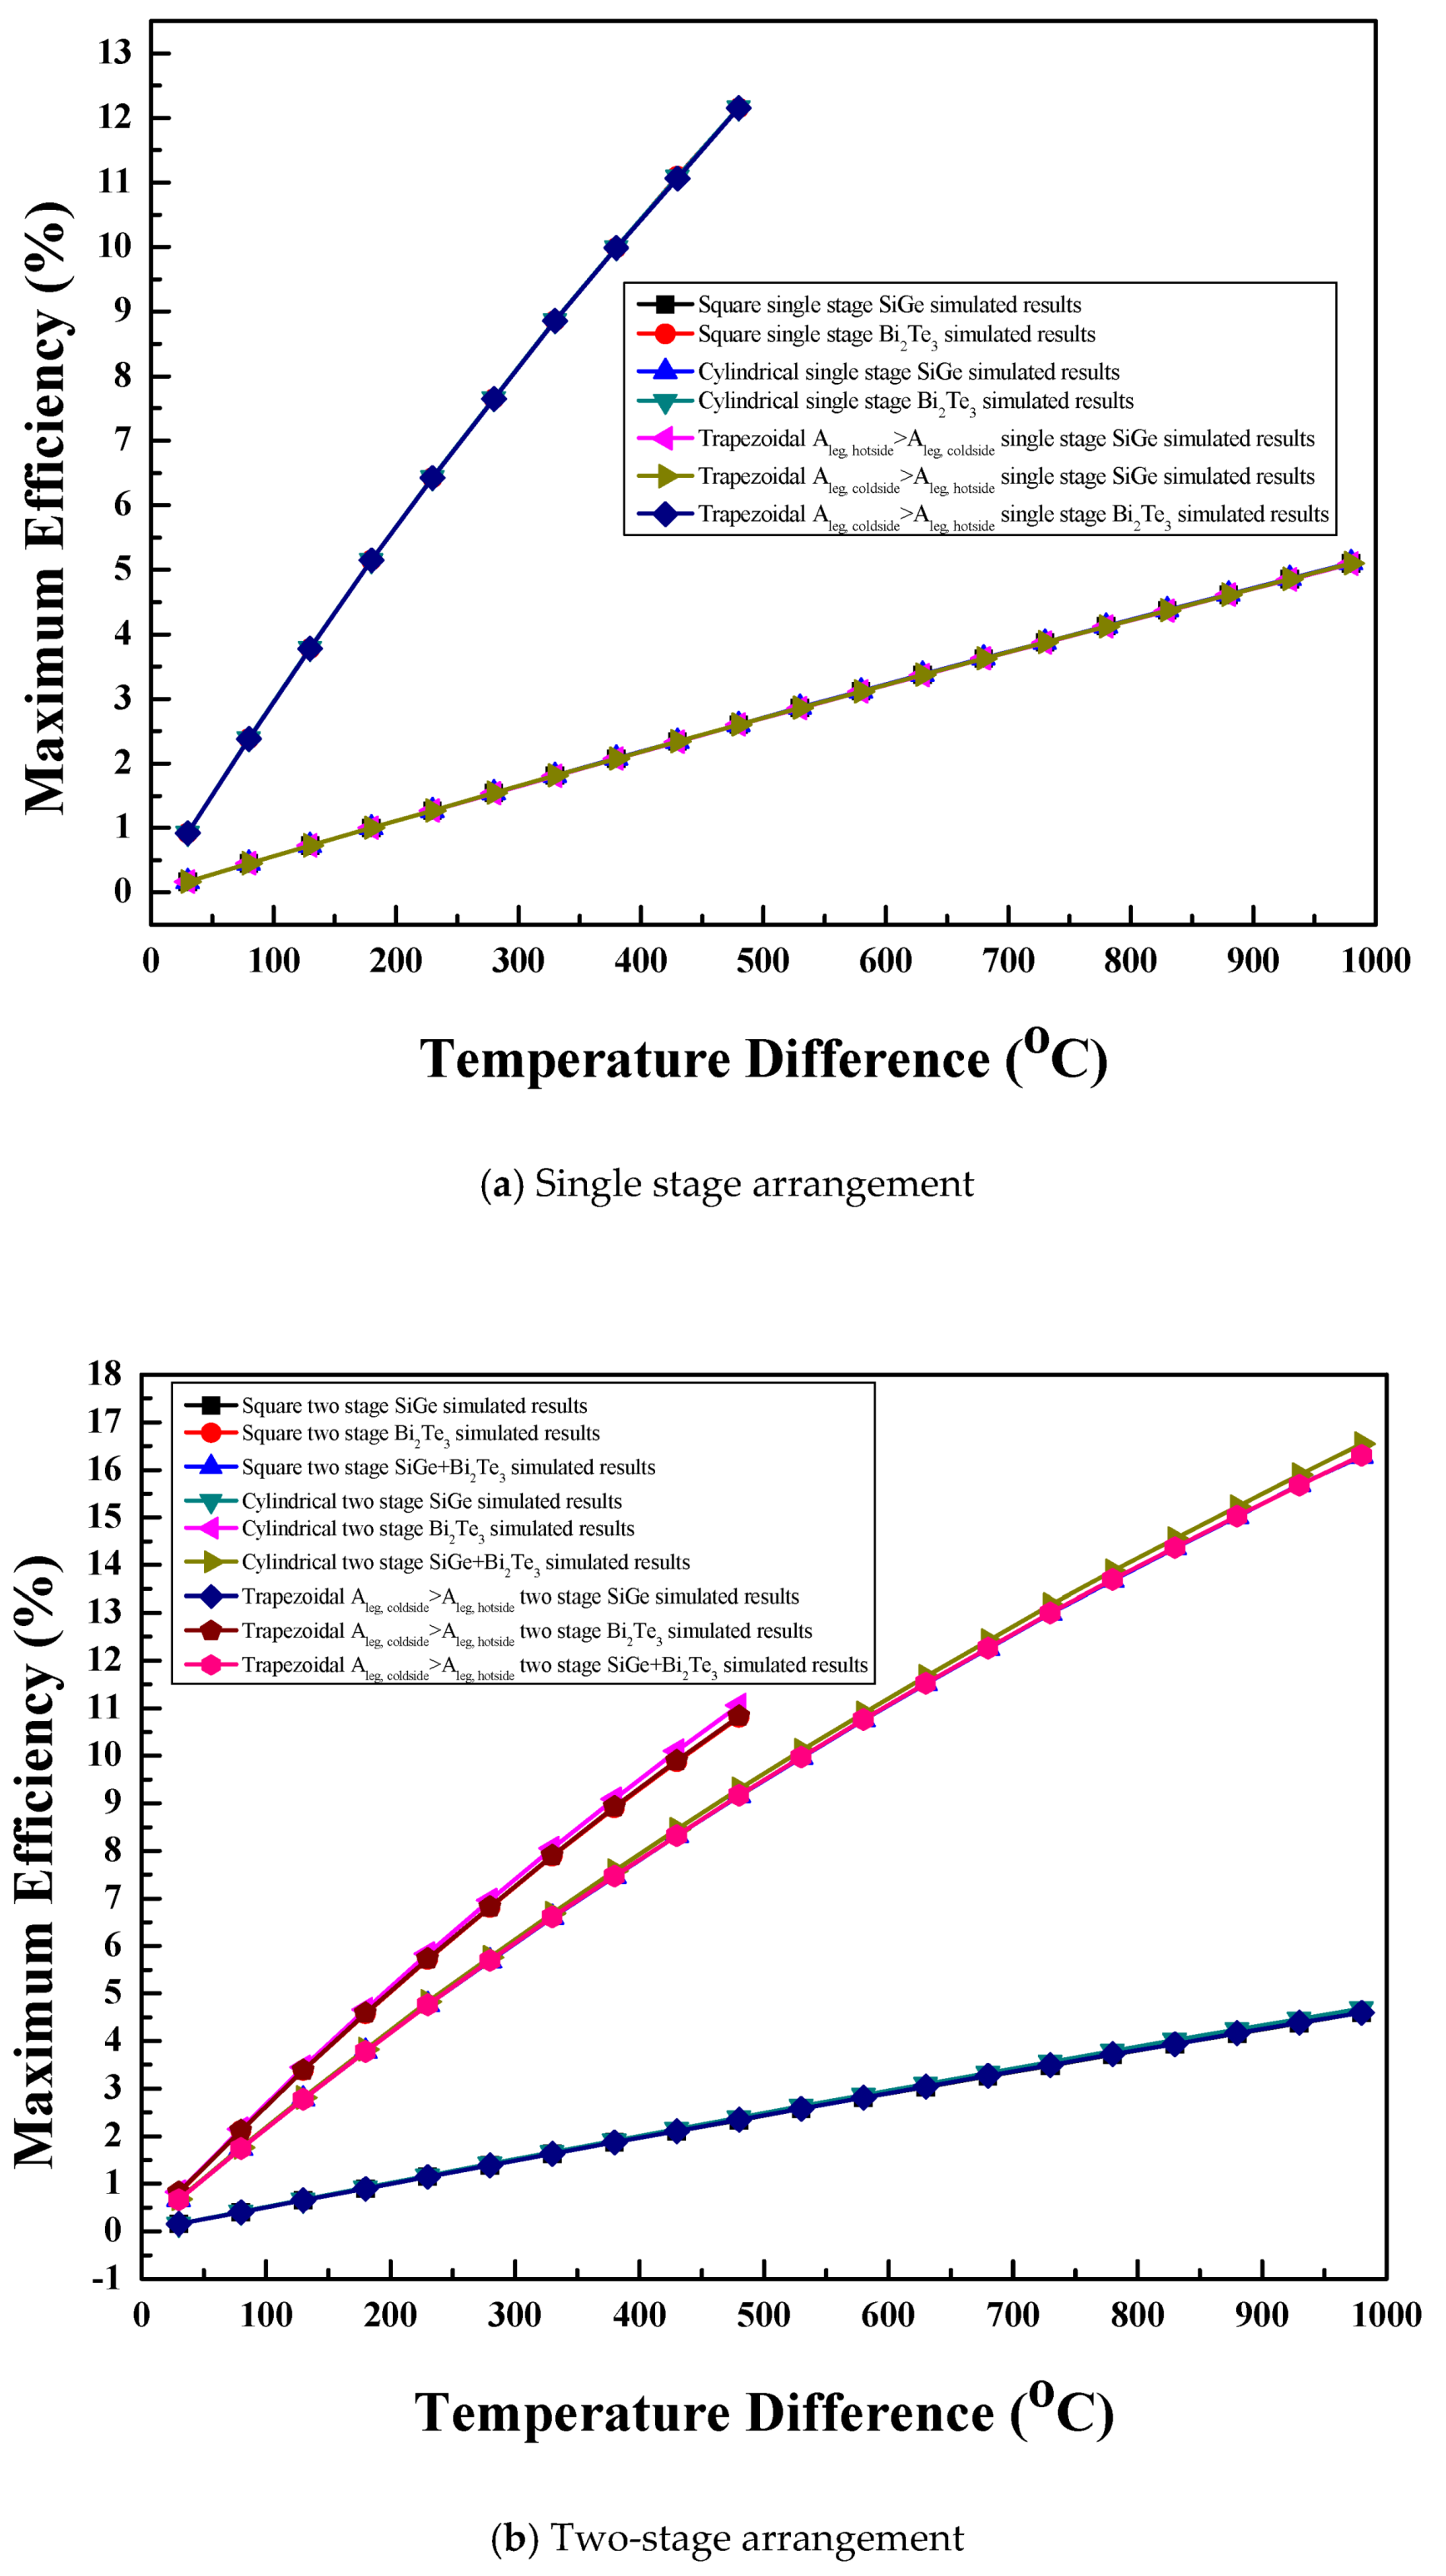
3.4. Maximum Efficiency
3.4.1. Single Stage Arrangement
3.4.2. Two-Stage Arrangement
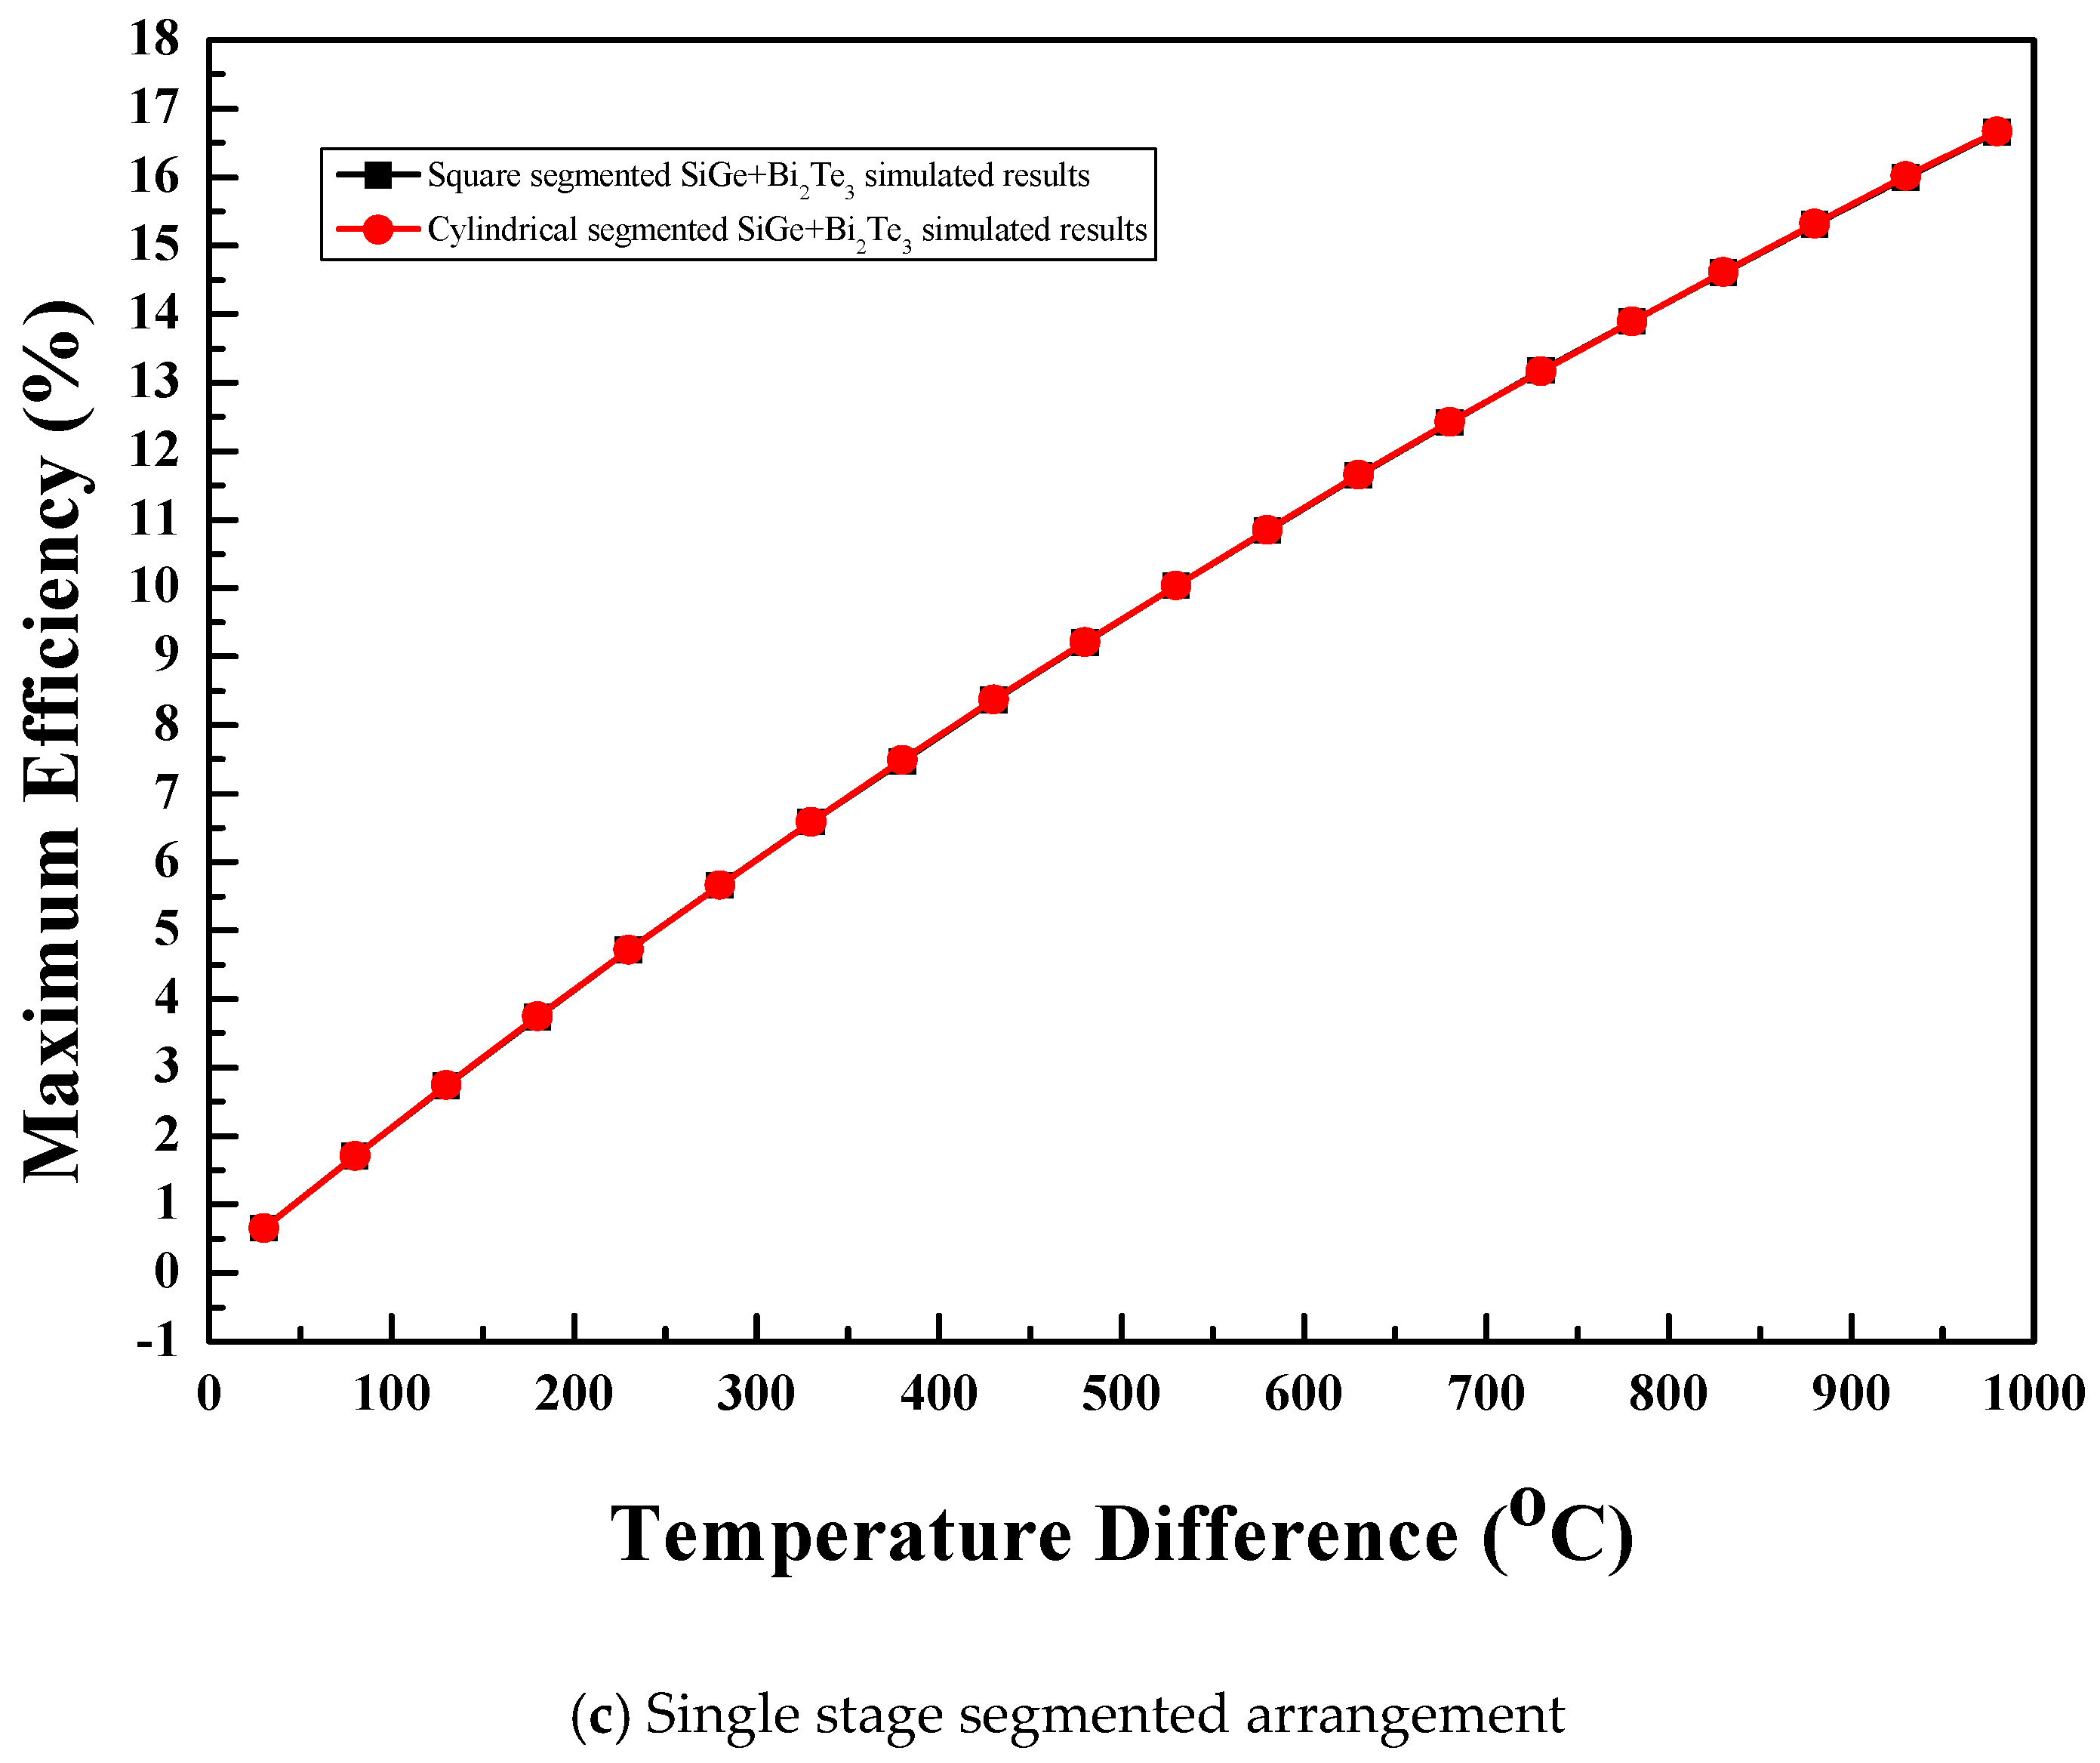
3.4.3. Single Stage Segmented Arrangement
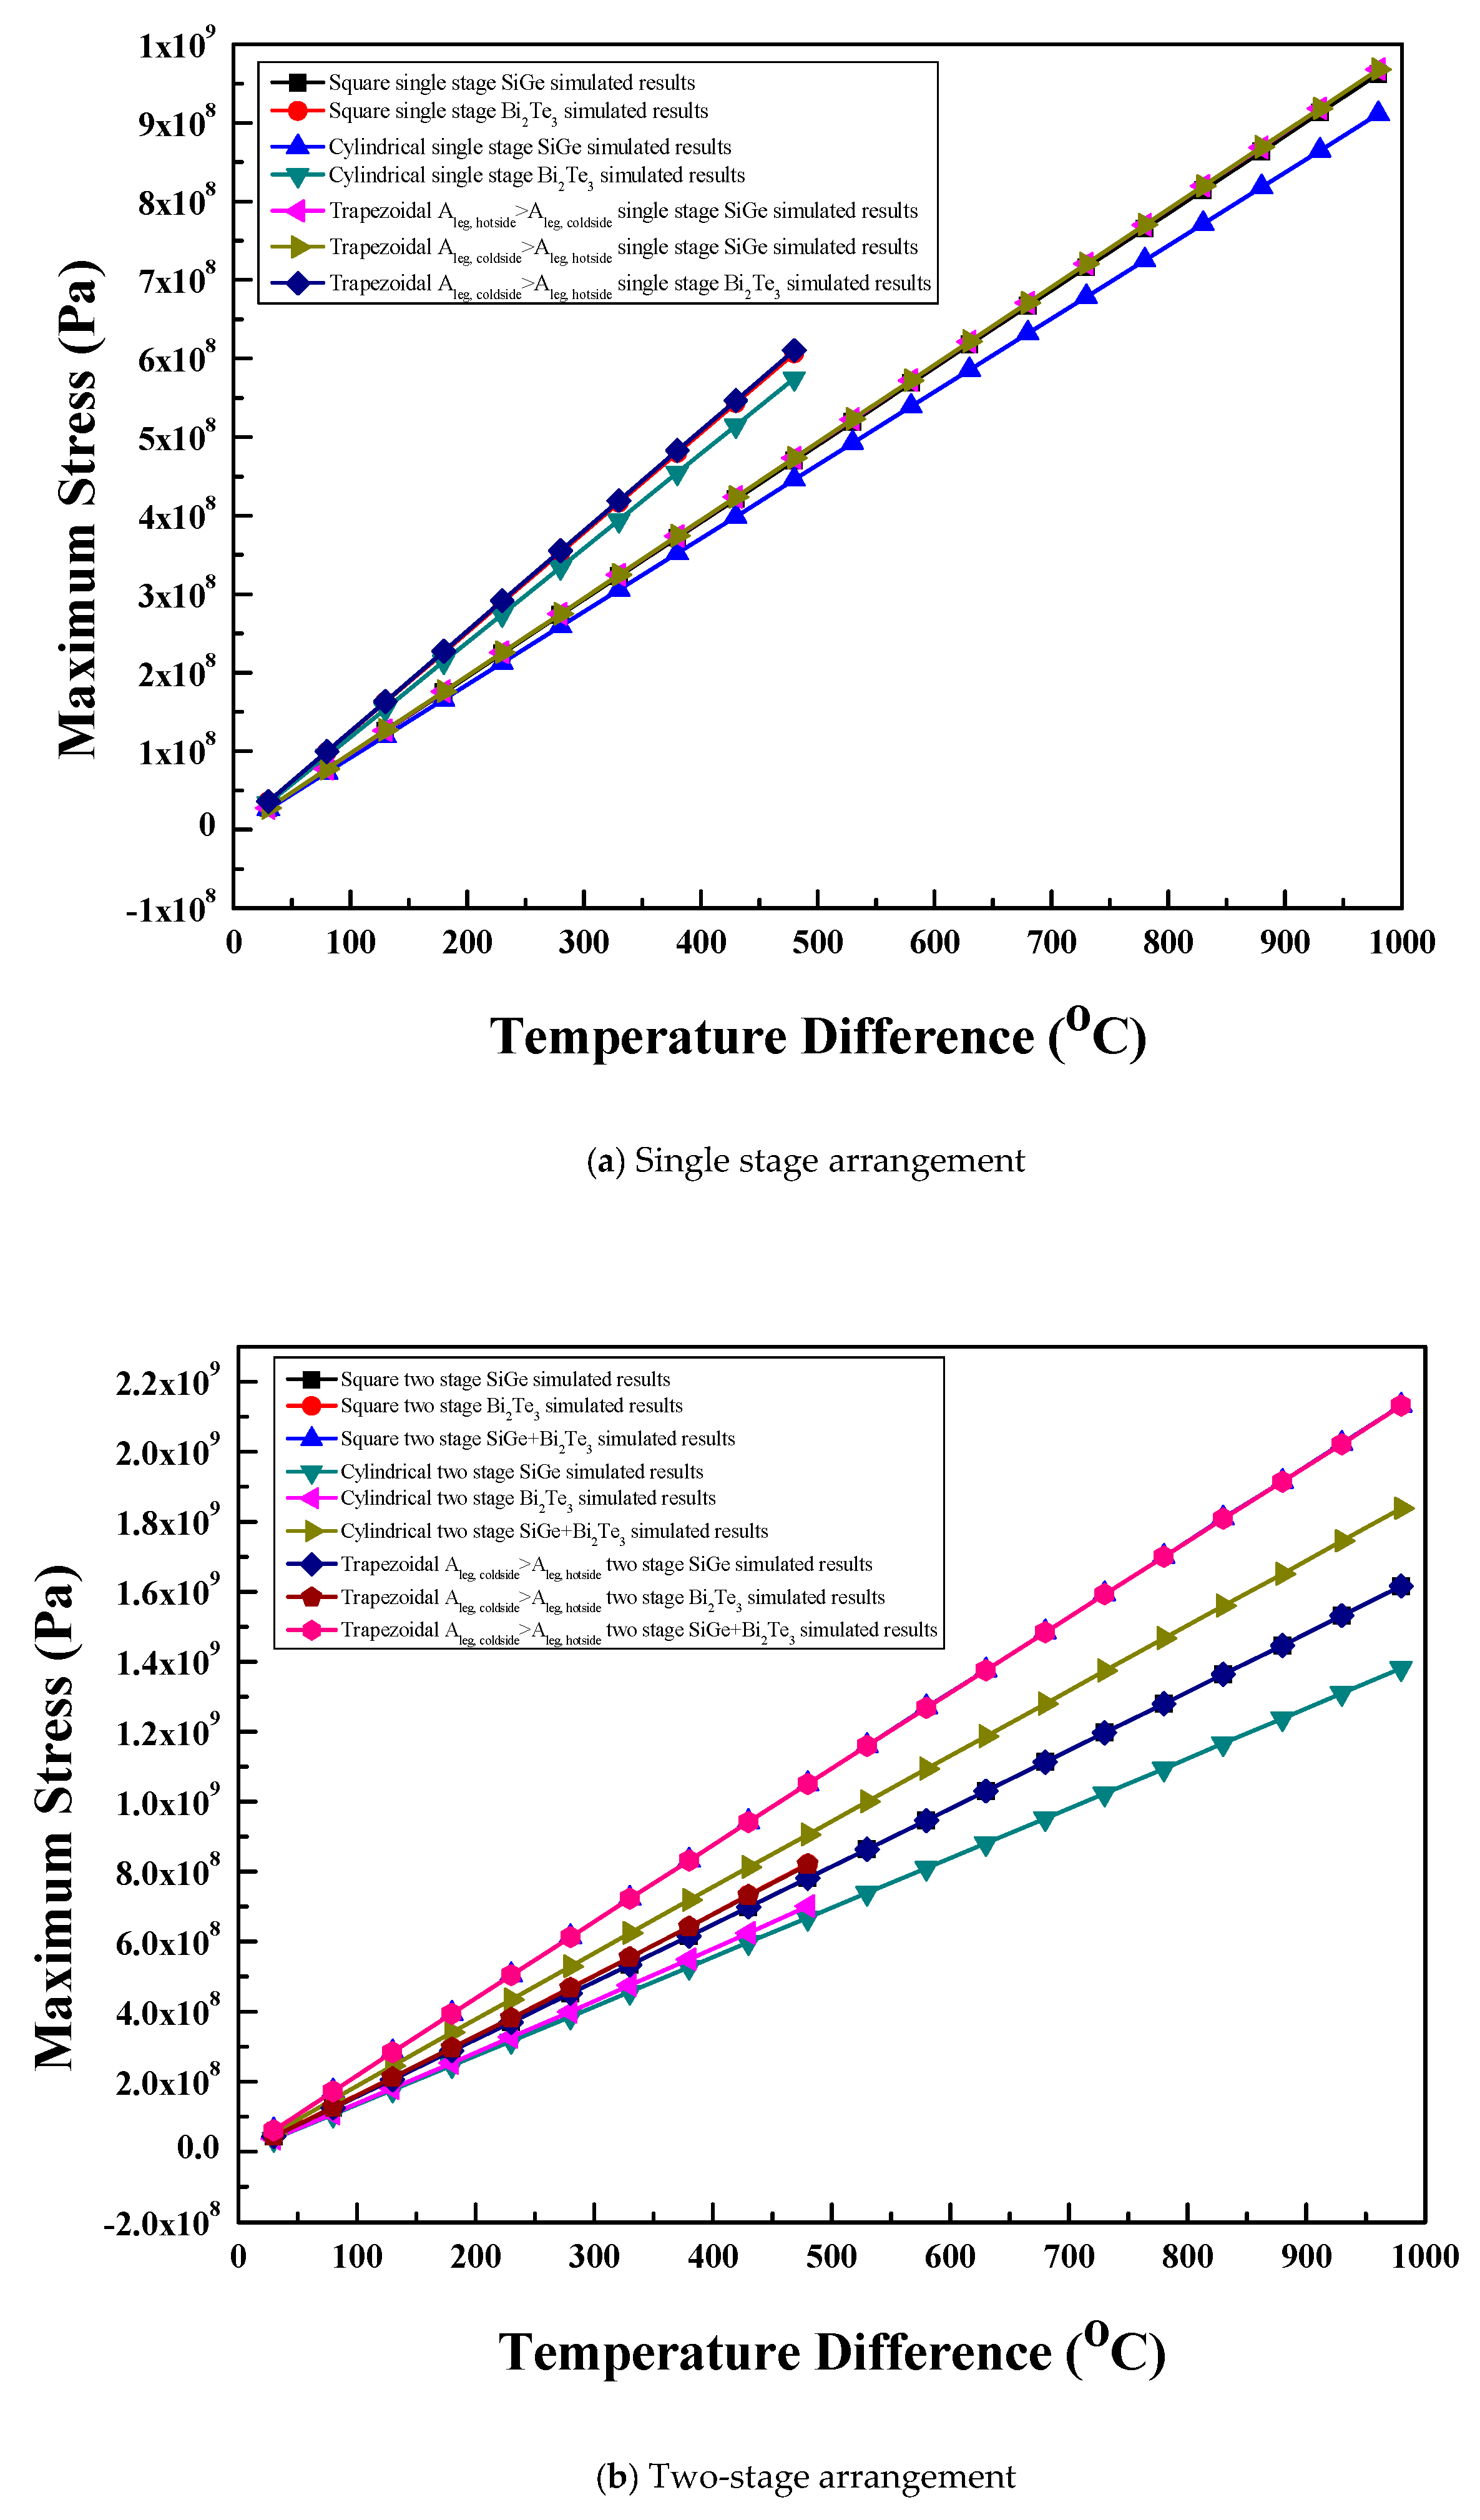
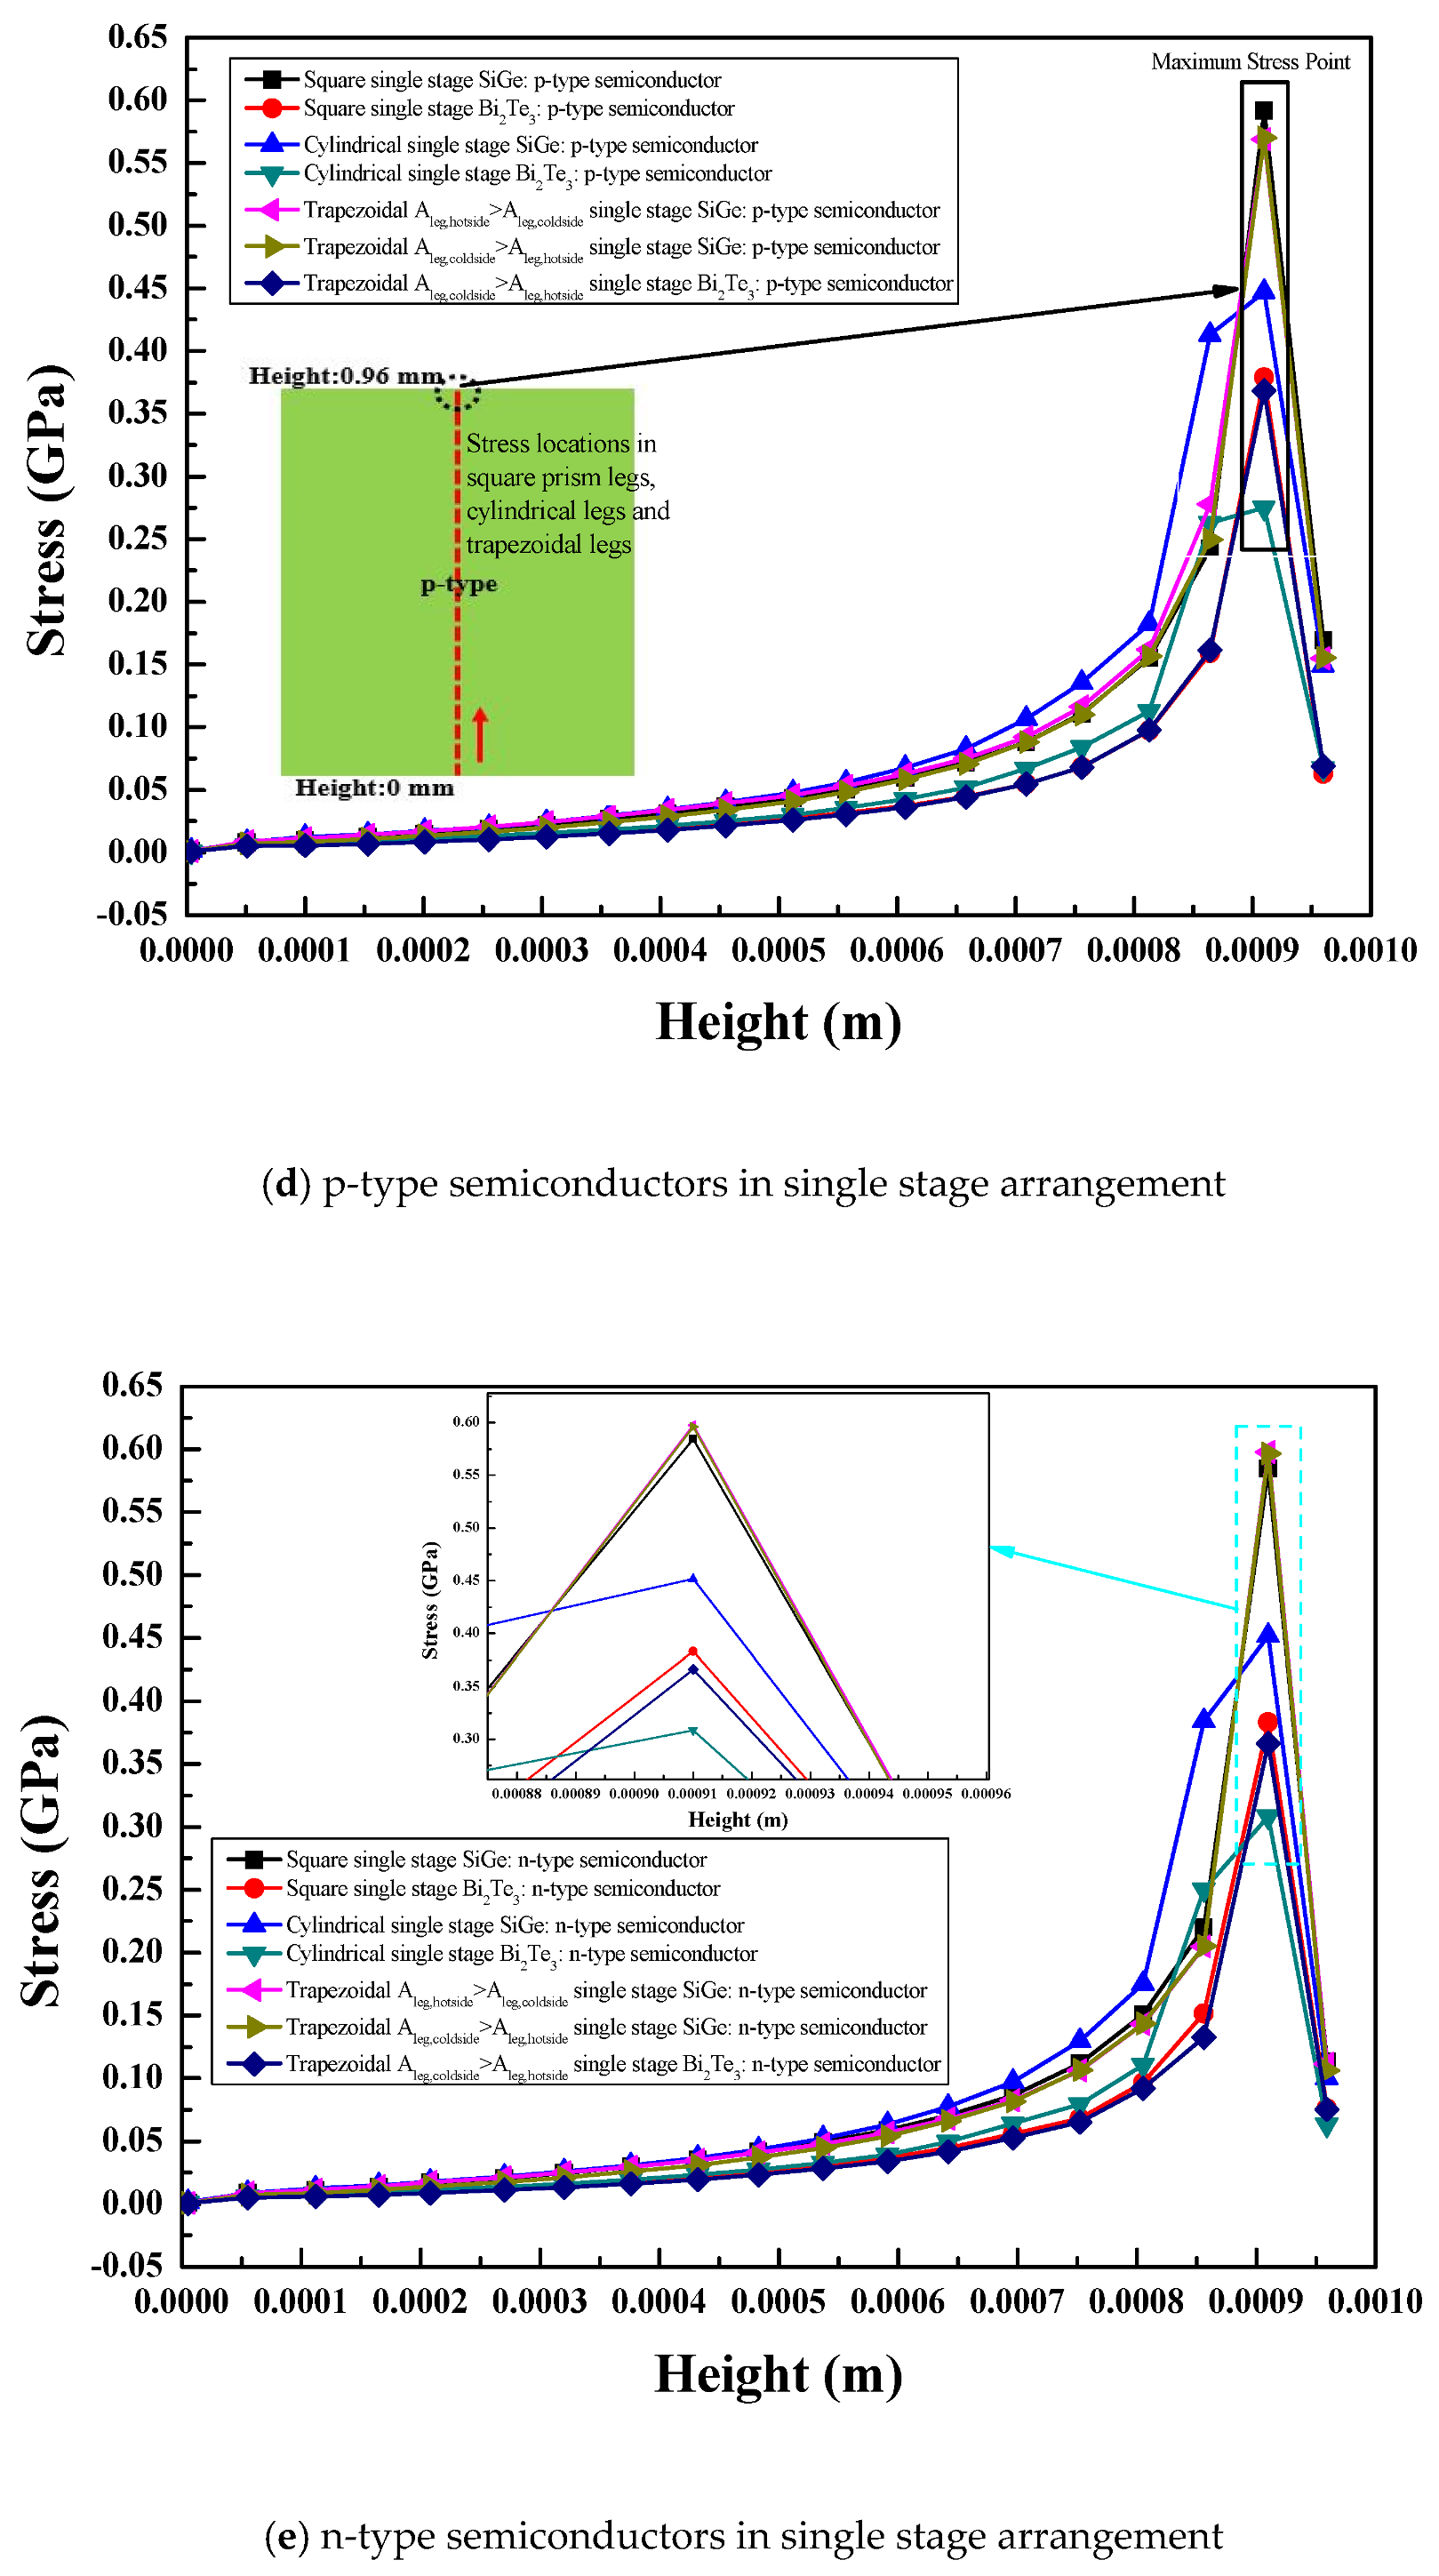
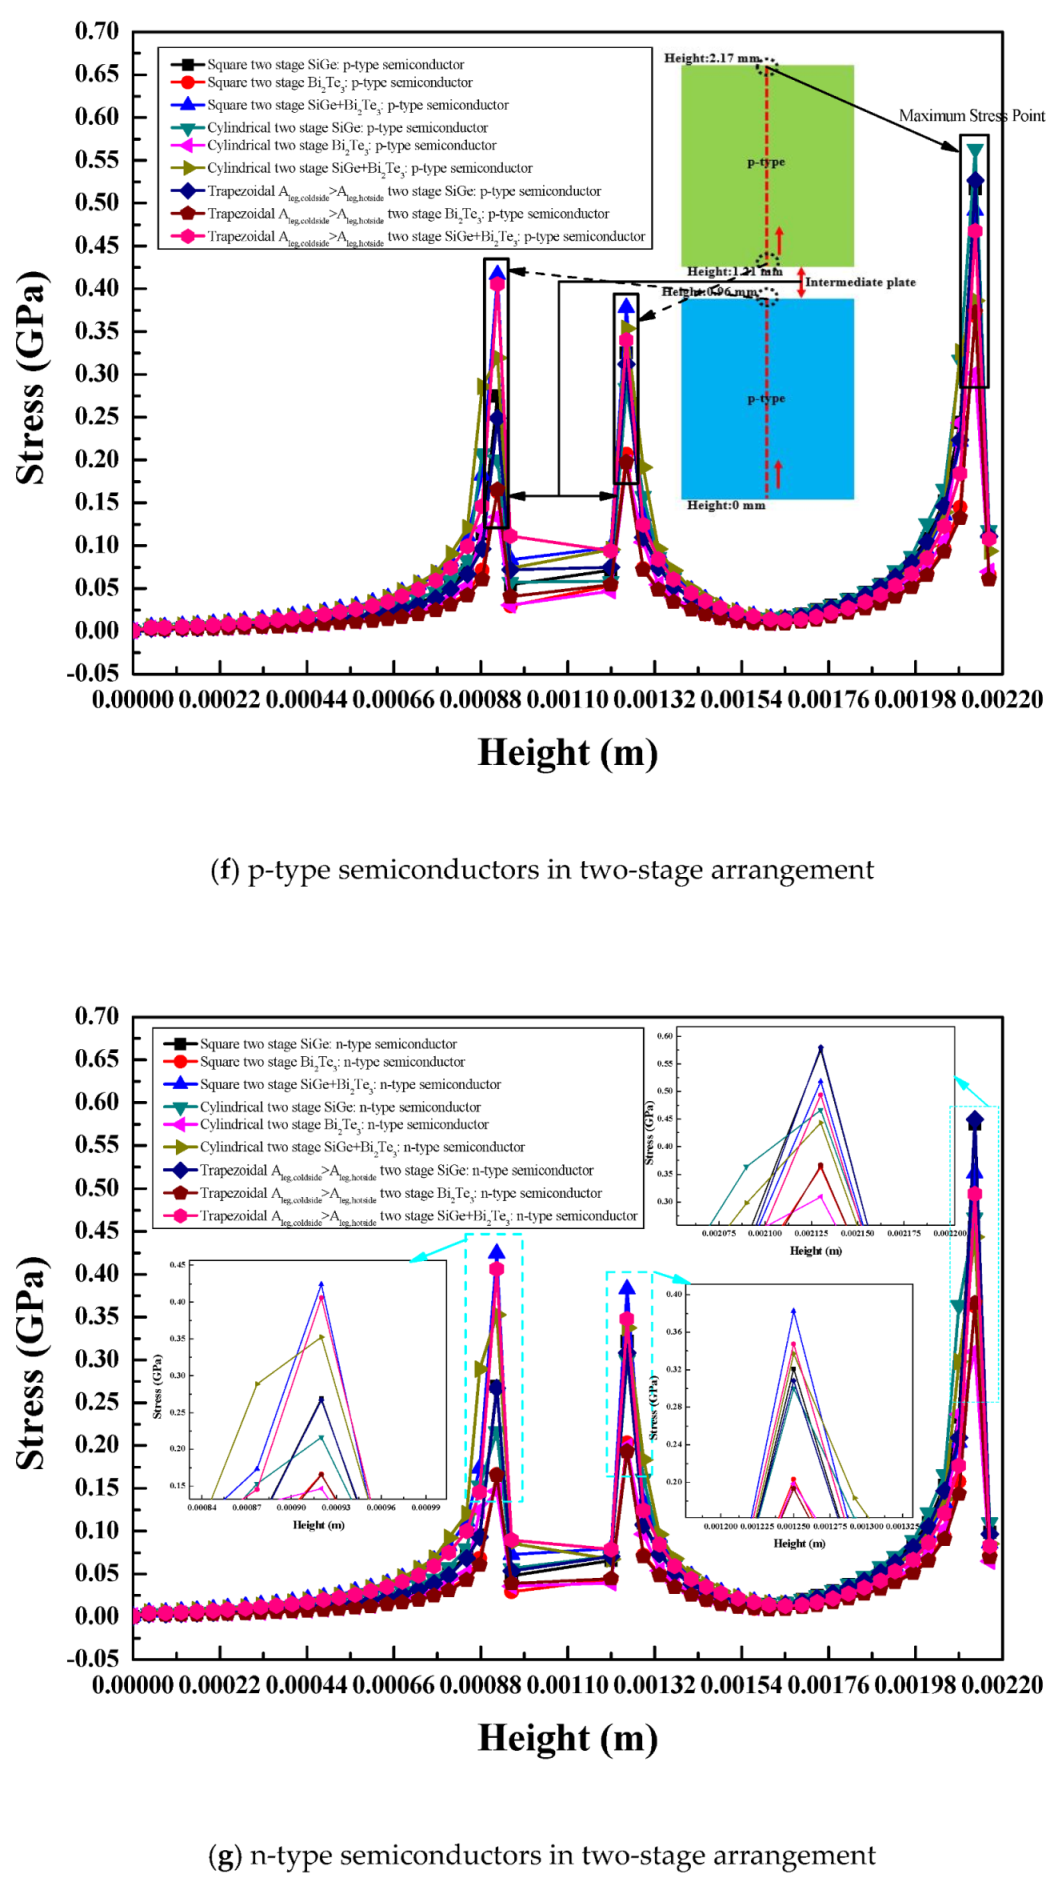
3.5. Maximum Stress
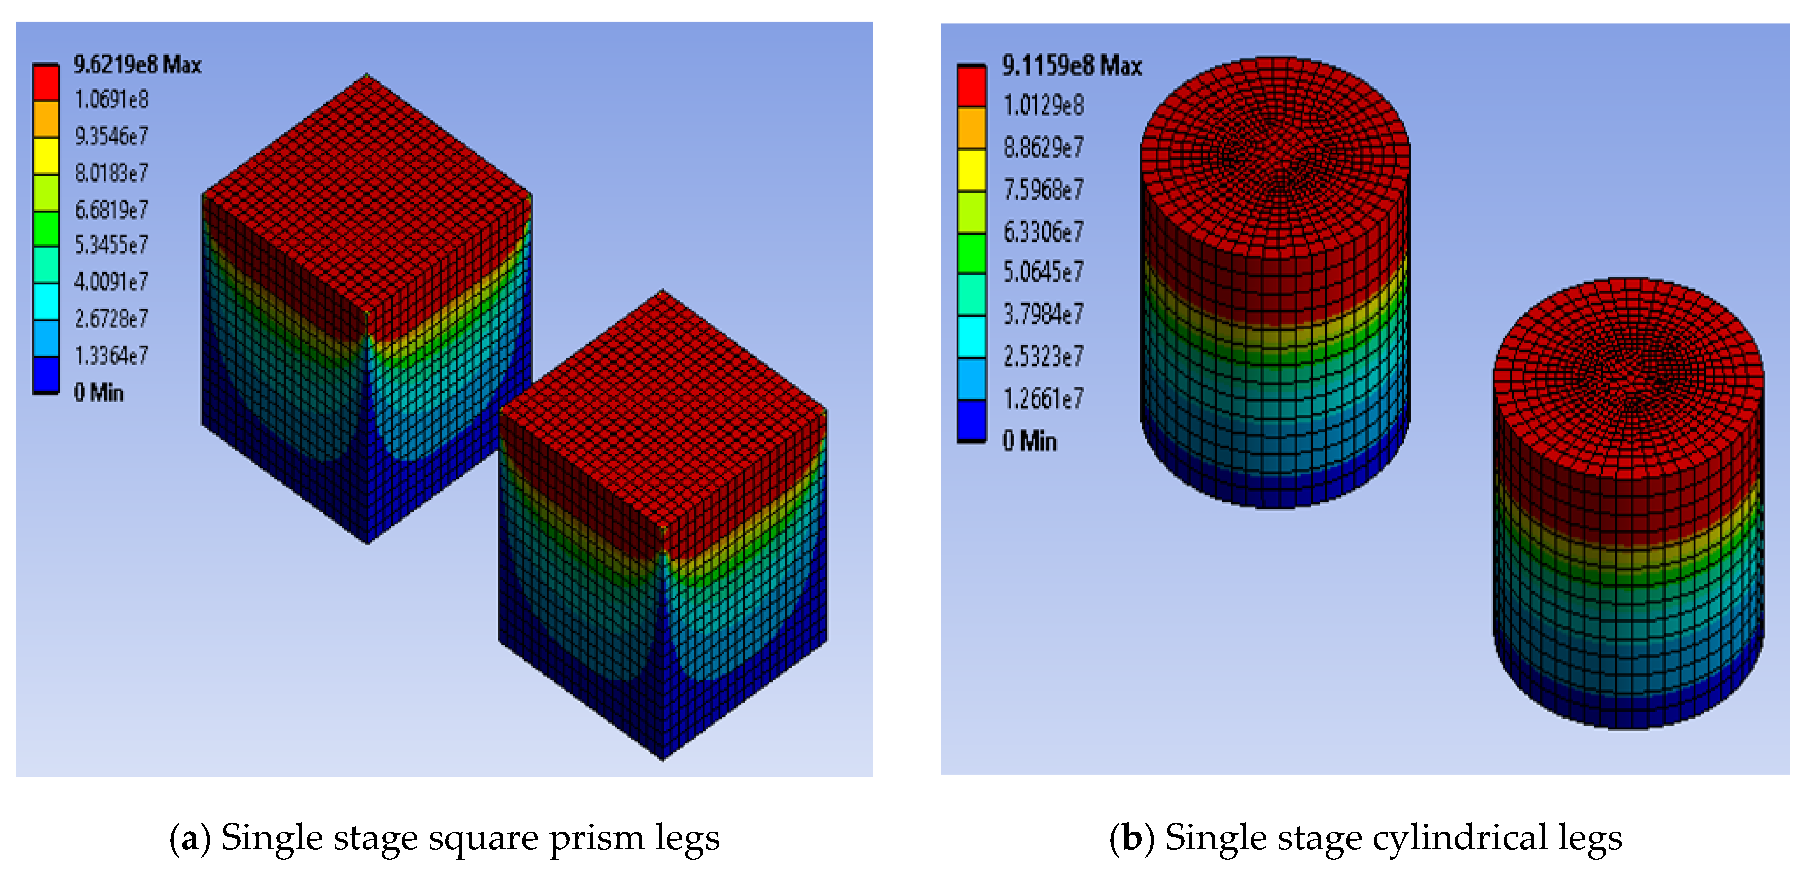
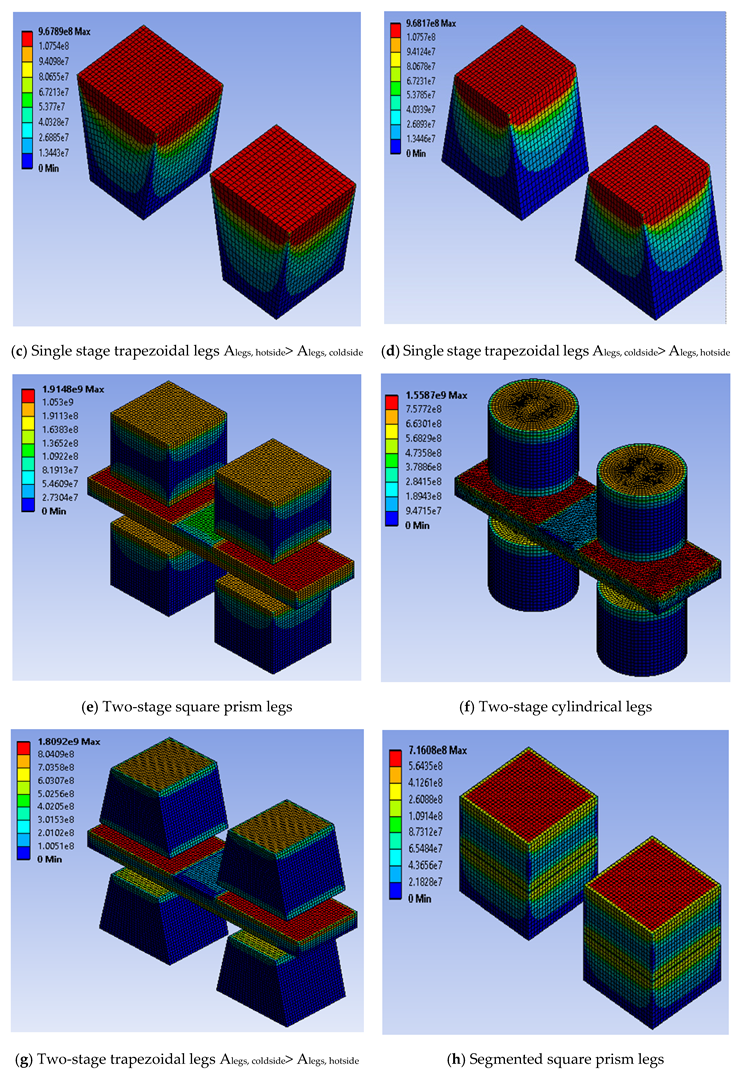
3.5.1. Single Stage Arrangement
3.5.2. Two-Stage Arrangement
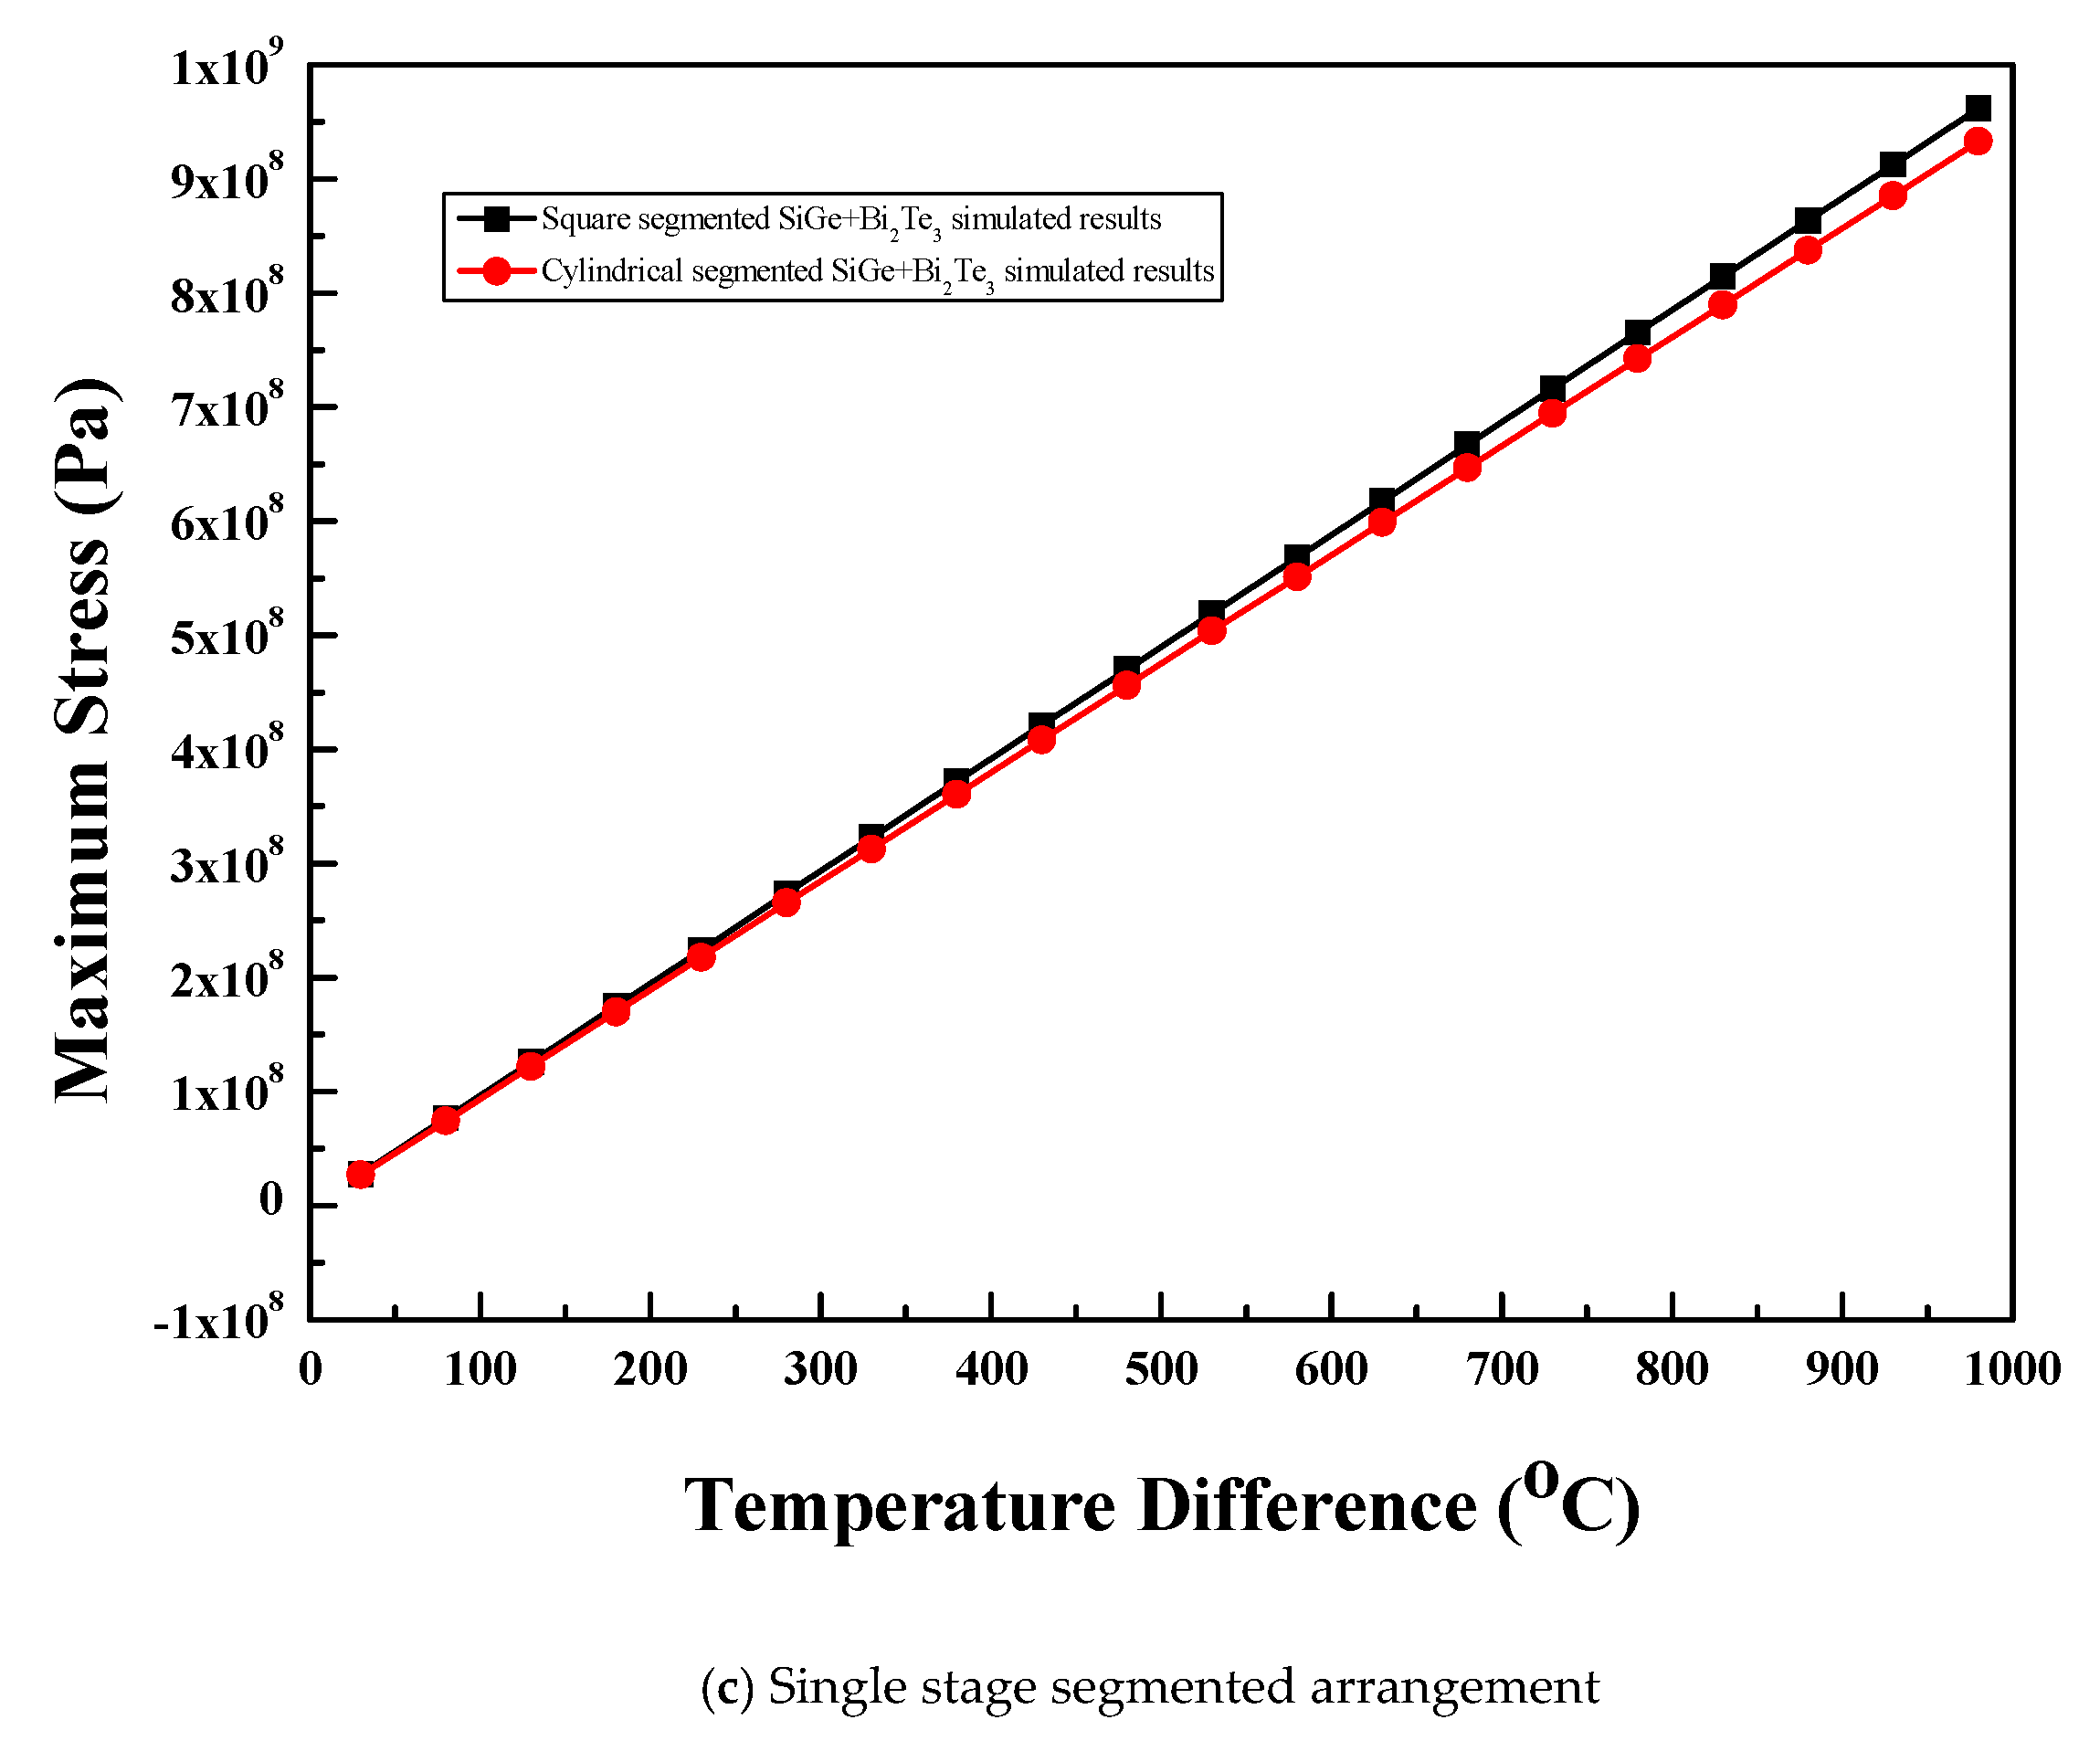
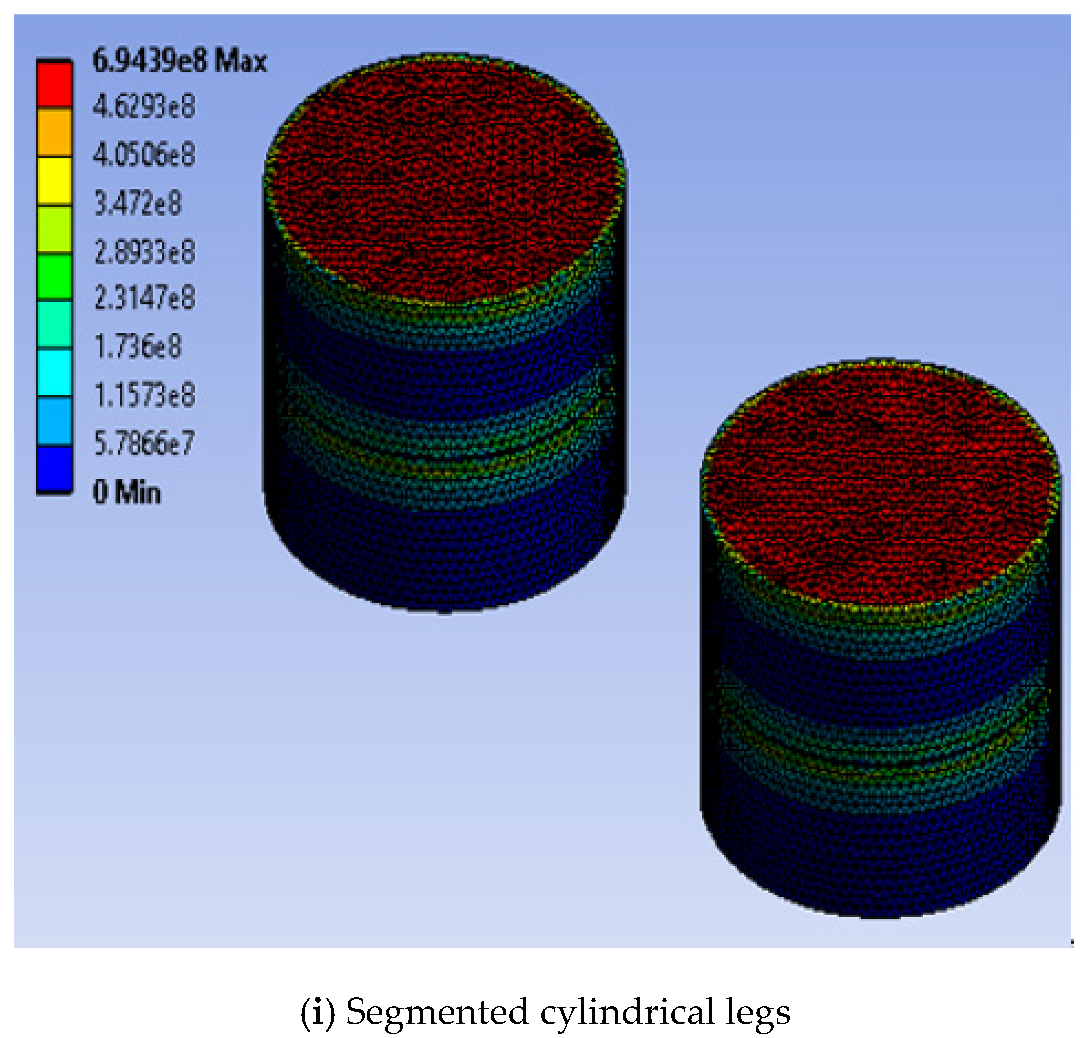
3.5.3. Single Stage Segmented Arrangement
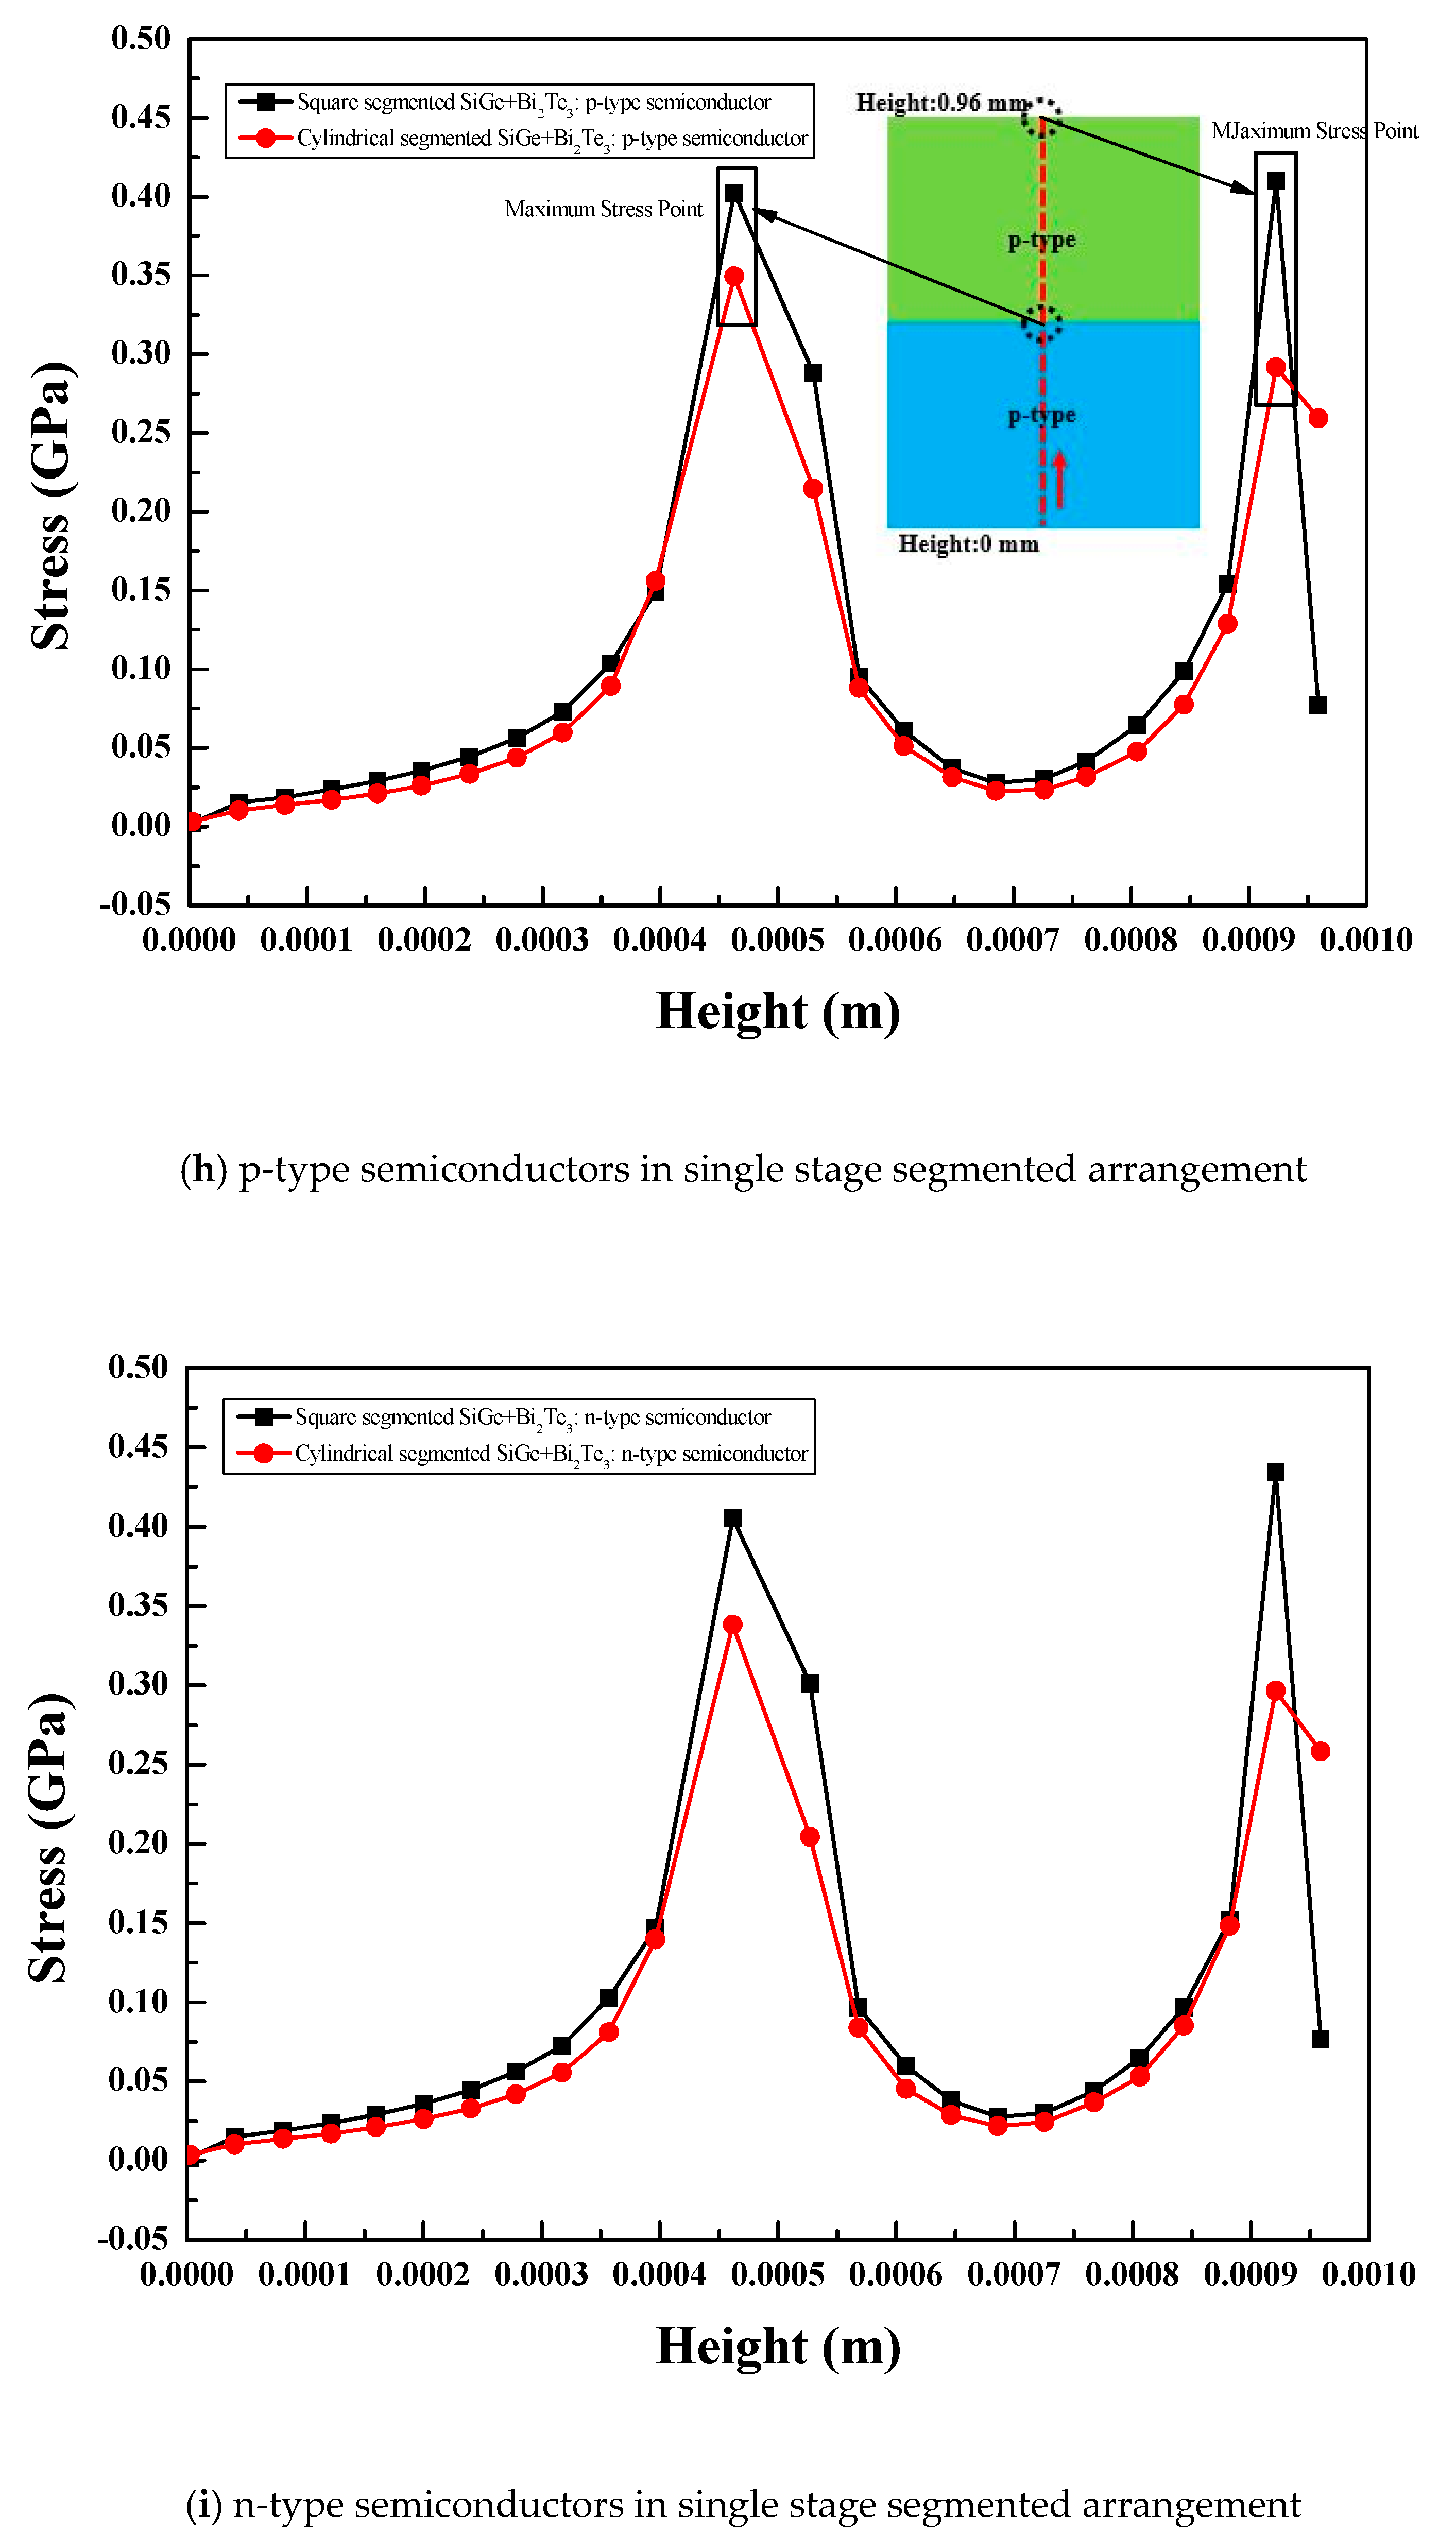
3.5.4. Stress Variation along Thermoelectric Leg Height
Single Stage Arrangement
Two-Stage Arrangement
Single Stage Segmented Arrangement
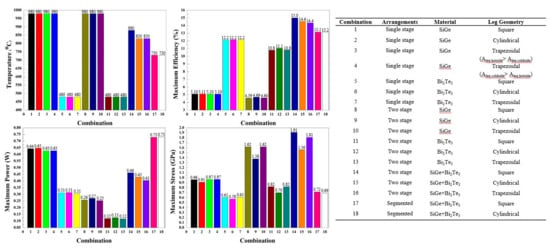
3.6. Selection of Optimum Configuration for the Thermoelectric Module
3.7. Effect of Soldering Layers
4. Conclusions
- (a)
- For all configurations of the thermoelectric module, the numerically predicted values of maximum power and maximum efficiency were validated at ±5% error and the numerically predicted values of maximum stress were validated at ±7% error with their theoretical values, respectively.
- (b)
- For the same arrangement and the same material, leg geometries with the same volume and same base area have a negligible effect on maximum power and maximum efficiency. However, the cylindrical legs showed lower values of maximum stress than that of the square prism and trapezoidal legs.
- (c)
- For the same arrangement and leg geometry, the SiGe+Bi2Te3 material for the thermoelectric module showed higher maximum power and maximum efficiency than the other individual materials. The thermal stress of the thermoelectric module with the SiGe+Bi2Te3 material was higher than those of the thermoelectric module with the SiGe and Bi2Te3 materials. In addition, the intensity of stress in the thermoelectric module with the SiGe+Bi2Te3 material could be reduced by using soldering layers without affecting maximum power and maximum efficiency.
- (d)
- The segmented arrangement of the thermoelectric module showed a higher maximum power and maximum efficiency and lower maximum stress in all combinations of the thermoelectric module. Therefore, the segmented arrangement of the thermoelectric module with cylindrical leg geometry and a combination of SiGe+Bi2Te3 materials was selected as the optimum configuration for the thermoelectric module with maximum power of 0.73 W, maximum efficiency of 13.2%, and maximum thermal stress of 0.69 GPa.
Author Contributions
Funding
Acknowledgments
Conflicts of Interest
Nomenclature
| A | Leg cross-sectional area (m2) |
| E | Yong modulus (GPa) |
| Electric field intensity (N/C or V/m) | |
| Heat absorbed (W) | |
| Theoretical optimum current (A) | |
| Numerical optimum current (A) | |
| Electric current intensity (A/ m2) | |
| K | Curvature (m−1) |
| Thermal conductivity of segment 1 (W/m °C) | |
| Thermal conductivity of segment 2 (W/m °C) | |
| L | Leg length (m) |
| Theoretical maximum power (W) | |
| Numerical maximum power (W) | |
| p | Peltier coefficient (V) |
| R | Internal resistance ( |
| Equivalent resistance ( | |
| RL | External load resistance ( |
| Hot junction temperature (°C) | |
| Cold junction temperature (°C) | |
| Average temperature (°C) | |
| Temperature difference (°C) | |
| Temperature gradient | |
| Theoretical optimum voltage (V) | |
| Numerical optimum voltage (V) | |
| Figure of Merit | |
| Coordinate (m) | |
| Equivalent Figure of Merit | |
| Seebeck coefficient (V/K) | |
| Theoretical maximum efficiency | |
| Numerical maximum efficiency | |
| Electrical resistivity of p-type (Ω m) | |
| Electrical resistivity of n-type (Ω m) | |
| Electrical conductivity of p-type (Ω−1 m−1) | |
| Electrical conductivity of n-type (Ω−1 m−1) | |
| Equivalent Seebeck coefficient (V/K) | |
| Seebeck coefficient of segment 1 (V/K) | |
| Seebeck coefficient of segment 2 (V/K) | |
| Electrical resistivity of segment 1 (Ω m) | |
| Electrical resistivity of segment 2 (Ω m) | |
| von-Mises stress (GPa) | |
| Thermal stress (i, j = 1,2,3) (GPa) | |
| Normal stress in longitudinal direction (GPa) | |
| Coefficient of thermal expansion (K−1) | |
| Strain | |
| Normal strain | |
| Poisson’s ratio | |
| Electrical potential gradient |
References
- Erturun, U.; Erermis, K.; Mossi, K. Effect of various leg geometries on thermo-mechanical and power generation performance of thermoelectric devices. Appl. Therm. Eng. 2014, 73, 128–141. [Google Scholar] [CrossRef]
- Shen, Z.G.; Liu, X.; Chen, S.; Wu, S.Y.; Xiao, L.; Chen, Z.X. Theoretical analysis on a segmented annular thermoelectric generator. Energy 2018, 157, 297–313. [Google Scholar] [CrossRef]
- Jin, Z.H. Thermal stresses in a multilayered thin film thermoelectric structure. Microelectron. Reliab. 2014, 54, 1363–1368. [Google Scholar] [CrossRef]
- Ma, Q.; Fang, H.; Zhang, M. Theoretical analysis and design optimization of thermoelectric generator. Appl. Therm. Eng. 2017, 127, 758–764. [Google Scholar] [CrossRef]
- Patil, M.S.; Seo, J.H.; Lee, M.Y. Numerical Study on Geometric Parameter effects of Power Generation Performances for Segmented Thermoelectric Generator. Int. J. Air-Cond. Refrig. 2018, 26, 1850004. [Google Scholar] [CrossRef]
- Erturun, U.; Erermis, K.; Mossi, K. Influence of leg sizing and spacing on power generation and thermal stresses of thermoelectric devices. Appl. Energy 2015, 159, 19–27. [Google Scholar] [CrossRef]
- Wu, Y.; Ming, T.; Li, X.; Pan, T.; Peng, K.; Luo, X. Numerical simulations on the temperature gradient and thermal stress of a thermoelectric power generator. Energy Conv. Manag. 2014, 88, 915–927. [Google Scholar] [CrossRef]
- Erturun, U.; Mossi, K. Thermoelectric devices with rotated and coaxial leg configurations: Numerical analysis of performance. Appl. Therm. Eng. 2015, 85, 304–312. [Google Scholar] [CrossRef]
- Jia, X.; Gao, Y. Optimal design of a novel thermoelectric generator with linear-shaped structure under different operating temperature conditions. Appl. Therm. Eng. 2015, 78, 533–542. [Google Scholar] [CrossRef]
- Yilbas, B.S.; Akhtar, S.S.; Sahin, A.Z. Thermal and stress analyses in thermoelectric generator with tapered and rectangular pin configurations. Energy 2016, 114, 52–63. [Google Scholar] [CrossRef]
- Al-Merbati, A.S.; Yilbas, B.S.; Sahin, A.Z. Thermodynamics and thermal stress analysis of thermoelectric power generator: Influence of pin geometry on device performance. Appl. Therm. Eng. 2013, 50, 683–692. [Google Scholar] [CrossRef]
- Ali, H.; Sahin, A.Z.; Yilbas, B.S. Thermodynamic analysis of a thermoelectric power generator in relation to geometric configuration device pins. Energy Conv. Manag. 2014, 78, 634–640. [Google Scholar] [CrossRef]
- Erturun, U.; Mossi, K. A feasibility investigation on improving structural integrity of thermoelectric modules with varying geometry. In Proceedings of the ASME 2012 Conference on Smart Materials, Adaptive Structures and Intelligent Systems, Stone Mountain, GA, USA, 19–21 September 2012; American Society of Mechanical Engineers: Stone Mountain, GA, USA; pp. 939–945. [Google Scholar]
- Yilbas, B.S.; Ali, H. Thermoelectric generator performance analysis: Influence of pin tapering on the first and second law efficiencies. Energy Conv. Manag. 2015, 100, 138–146. [Google Scholar] [CrossRef]
- Gao, J.L.; Du, Q.G.; Zhang, X.D.; Jiang, X.Q. Thermal stress analysis and structure parameter selection for a Bi2Te3-based thermoelectric module. J. Electron. Mater. 2011, 40, 884–888. [Google Scholar] [CrossRef]
- Zhang, L.; Tosho, T.; Okinaka, N.; Akiyama, T. Design of cascaded oxide thermoelectric generator. Mater. Trans. 2008, 49, 1675–1680. [Google Scholar] [CrossRef]
- Kanimba, E.; Pearson, M.; Sharp, J.; Stokes, D.; Priya, S.; Tian, Z. A modeling comparison between a two-stage and three-stage cascaded thermoelectric generator. J. Power Sources 2017, 365, 266–272. [Google Scholar] [CrossRef]
- Wilbrecht, S.; Beitelschmidt, M. The Potential of a Cascaded TEG System for Waste Heat Usage in Railway Vehicles. J. Electron. Mater. 2018, 47, 3358–3369. [Google Scholar] [CrossRef]
- Weng, C.C.; Lin, M.C.; Huang, M.J. A waste cold recovery from the exhausted cryogenic nitrogen by using thermoelectric power generator. Energy 2016, 103, 385–396. [Google Scholar] [CrossRef]
- Chen, G.; Mu, Y.; Zhai, P.; Li, G.; Zhang, Q. An investigation on the coupled thermal–mechanical–electrical response of automobile thermoelectric materials and devices. J. Electron. Mater. 2013, 42, 1762–1770. [Google Scholar] [CrossRef]
- Kaibe, H.; Aoyama, I.; Mukoujima, M.; Kanda, T.; Fujimoto, S.; Kurosawa, T.; Ishimabushi, H.; Ishida, K.; Rauscher, L.; Hata, Y.; et al. Development of thermoelectric generating stacked modules aiming for 15% of conversion efficiency. In Proceedings of the ICT 2005. 24th International Conference on Thermoelectrics, Clemson, SC, USA, 19–23 June 2005; pp. 242–247. [Google Scholar]
- Vargas-Almeida, A.; Olivares-Robles, M.A.; Camacho-Medina, P. Thermoelectric system in different thermal and electrical configurations: Its impact in the figure of merit. Entropy 2013, 15, 2162–2180. [Google Scholar] [CrossRef]
- Ibrahim, A.; Rahnamayan, S.; Martin, M.V.; Yilbas, B. Multi-objective thermal analysis of a thermoelectric device: Influence of geometric features on device characteristics. Energy 2014, 77, 305–317. [Google Scholar] [CrossRef]
- Turenne, S.; Clin, T.; Vasilevskiy, D.; Masut, R.A. Finite element thermomechanical modeling of large area thermoelectric generators based on bismuth telluride alloys. J. Electron. Mater. 2010, 39, 1926–1933. [Google Scholar] [CrossRef]
- Garud, K.S.; Seo, J.H.; Patil, M.S.; Bang, Y.M.; Pyo, Y.D.; Cho, C.P.; Lee, M.Y. Thermal-Electrical-Structural Performances of Hot Heat Exchanger with Different Internal Fins of Thermoelectric Generator for Low Power Generation Application. J. Therm. Anal. Calorim. 2020. [Google Scholar] [CrossRef]
- Jones, M.H.; Jones, S.H. The General Properties of Si, Ge, SiGe, SiO2 and Si3N4; Virginia Semiconductor: Fredericksburg, VA, USA, 2002. [Google Scholar]
- Bennis, A.; Leinenbach, C.; Raudzis, C.; Müller-Fiedler, R.; Kronmüller, S. Measurement technique for elastic and mechanical properties of polycrystalline silicon-germanium films using surface acoustic waves and projection masks. arXiv 2007, arXiv:0711.3305. [Google Scholar]
- Seo, J.H.; Patil, M.S.; Cho, C.P.; Lee, M.Y. Heat transfer characteristics of the integrated heating system for cabin and battery of an electric vehicle under cold weather conditions. Int. J. Heat Mass Transf. 2018, 117, 80–94. [Google Scholar] [CrossRef]
- Garud, K.S.; Seo, J.H.; Cho, C.P.; Lee, M.Y. Artificial Neural Network and Adaptive Neuro-Fuzzy Interface System Modelling to Predict Thermal Performances of Thermoelectric Generator for Waste Heat Recovery. Symmetry 2020, 12, 259. [Google Scholar] [CrossRef]
- Al-Merbati, A.S.; Yilbas, B.S.; Sahin, A.Z. A model study for cyclic thermal loading and thermal performance of a thermoelectric generator. Int. J. Energy Res. 2014, 38, 1351–1360. [Google Scholar] [CrossRef]
- Elzalik, M.; Rezk, H.; Mostafa, R.; Thomas, J.; Shehata, E.G. An experimental investigation on electrical performance and characterization of thermoelectric generator. Int. J. Energy Res. 2020, 44, 128–143. [Google Scholar] [CrossRef]
- Baheta, A.T.; Looi, K.K.; Oumer, A.N.; Habib, K. Thermoelectric Air-Conditioning System: Building Applications and Enhancement Techniques. Int. J. Air-Cond. Refrig. 2019, 27, 1930002. [Google Scholar] [CrossRef]
- Luo, Y.; Kim, C.N. Effects of the cross-sectional area ratios and contact resistance on the performance of a cascaded thermoelectric generator. Int. J. Energy Res. 2019, 43, 2172–2187. [Google Scholar] [CrossRef]
- Tritt, T.M. Thermoelectric phenomena, materials, and applications. Ann. Rev. Mater. Res. 2011, 41, 433–448. [Google Scholar] [CrossRef]
- Ali, H.; Yilbas, B.S. Configuration of segmented leg for the enhanced performance of segmented thermoelectric generator. Int. J. Energy Res. 2017, 41, 274–288. [Google Scholar] [CrossRef]


| Material | SiGe | Bi2Te3 | Copper | 63Sn-37Pb | Al2O3 |
|---|---|---|---|---|---|
| TM (°C) | 1177 | 585 | 1083 | 183 | 2072 |
| α (μV/K) | 115 (p-type) −115 (n-type) | 227 (p-type) −227 (n-type) | - | - | - |
| Z (K−1) | 2.38 × 10⁻⁴ | 1.53 × 10⁻³ | - | - | - |
| ρ (Ω m) | 1 × 10⁻⁵ | 1.95 × 10⁻⁵ | 1.84 × 10⁻⁸ | 1.45 × 10⁻⁷ | 1 × 10¹² |
| k (W/m K) | 5.56 | 1.73 | 394.5 | 50 | 17.2–37.2 |
| E (GPa) | 155 | 49.7 | 100–119 | 12–36 | 366–380 |
| v | 0.3 | 0.28 | 0.31 | 0.40 | 0.26 |
| αT (10−6/K) | 4.2 | 16.8 | 16.7–17.6 | 24 | 4.89–6.68 |
| Material | Arrangement | Thermoelectric Legs | Boundary Conditions |
|---|---|---|---|
| Temperature Conditions | |||
| SiGe | Single stage, two-stage | Square prism, cylindrical, trapezoidal | 50 °C–1000 °C |
| Bi2Te3 (without soldering layer) | Single stage, two-stage | Square prism, cylindrical, trapezoidal | 50 °C–500 °C |
| Bi2Te3 (with soldering layer) | Single stage, two-stage | Square prism | 50 °C–150 °C |
| SiGe+Bi2Te3 (without soldering layer) | Two-stage | Square prism, cylindrical, trapezoidal | 50 °C–1000 °C |
| SiGe+Bi2Te3 (without soldering layer) | Segmented | Square prism, cylindrical | 50 °C–1000 °C |
| SiGe+Bi2Te3 (with soldering layer) | Two-stage | Square prism | 50 °C–150 °C |
| Voltage Conditions | |||
| All configurations | Single stage, two-stage, segmented | Square prism, cylindrical, trapezoidal | 0 V to voltage value at which current and power become zero |
| Arrangements | Material | Leg Geometry | Maximum Power (W) |
|---|---|---|---|
| Single stage | SiGe | Square Cylindrical | |
| Single stage | SiGe | Trapezoidal (Aleg,hotside>Aleg,coldside) | |
| Single stage | SiGe | Trapezoidal (Aleg,coldside>Aleg,hotside) | |
| Single stage | Bi2Te3 | Square Cylindrical | |
| Single stage | Bi2Te3 | Trapezoidal | |
| Single stage (SL) | Bi2Te3 | Square | |
| Two-stage—1st stage | SiGe | Square Cylindrical | |
| Two-stage—2nd stage | SiGe | Square Cylindrical | |
| Two-stage—1st stage | SiGe | Trapezoidal | |
| Two-stage—2nd stage | SiGe | Trapezoidal | |
| Two-stage—1st stage | Bi2Te3 | Square Cylindrical | |
| Two-stage—2nd stage | Bi2Te3 | Square Cylindrical | |
| Two-stage—1st stage | Bi2Te3 | Trapezoidal | |
| Two-stage—2nd stage | Bi2Te3 | Trapezoidal | |
| Two-stage—1st stage | SiGe | Square Cylindrical | |
| Two-stage—2nd stage | Bi2Te3 | Square Cylindrical | |
| Two-stage—1st stage | SiGe | Trapezoidal | |
| Two-stage—2nd stage | Bi2Te3 | Trapezoidal | |
| Two-stage—1st stage (SL) | Bi2Te3 | Square | |
| Two-stage—2nd stage (SL) | Bi2Te3 | Square | |
| Two-stage—1st stage | SiGe | Square | |
| Two-stage—2nd stage (SL) | Bi2Te3 | Square | |
| Segmented | SiGe+Bi2Te3 | Square Cylindrical |
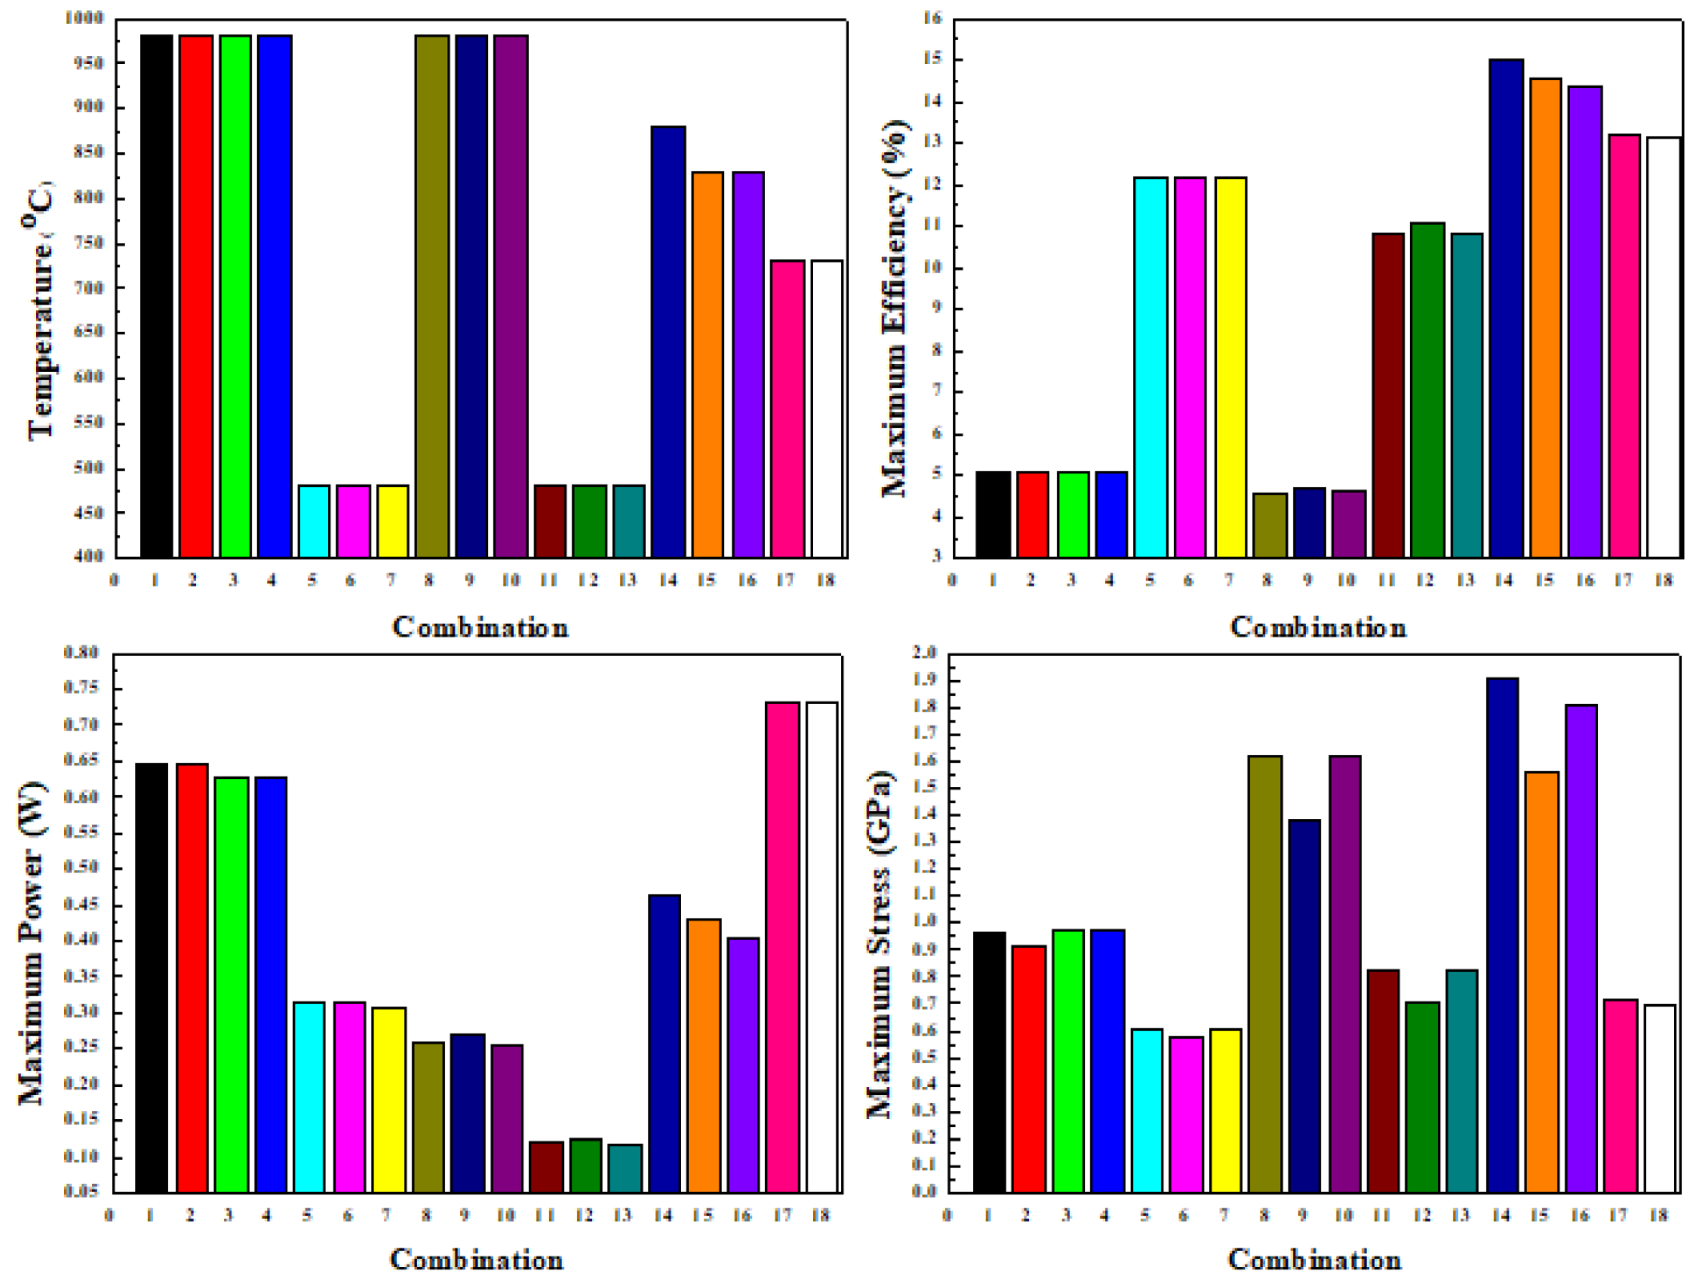
| Combination | Arrangements | Material | Leg Geometry | Maximum Temperature Difference (°C) | Maximum Power (W) | Maximum Efficiency (%) | Maximum Stress (GPa) |
|---|---|---|---|---|---|---|---|
| 1 | Single stage | SiGe | Square | 980 | 0.6438 | 5.0973 | 0.962 |
| 2 | Single stage | SiGe | Cylindrical | 980 | 0.6472 | 5.1058 | 0.912 |
| 3 | Single stage | SiGe | Trapezoidal (Aleg,hotside> Aleg,coldside) | 980 | 0.6275 | 5.0910 | 0.968 |
| 4 | Single stage | SiGe | Trapezoidal (Aleg,coldside> Aleg,hotside) | 980 | 0.6280 | 5.0964 | 0.968 |
| 5 | Single stage | Bi2Te3 | Square | 480 | 0.3132 | 12.156 | 0.607 |
| 6 | Single stage | Bi2Te3 | Cylindrical | 480 | 0.3145 | 12.163 | 0.575 |
| 7 | Single stage | Bi2Te3 | Trapezoidal | 480 | 0.3056 | 12.156 | 0.611 |
| 8 | Two-stage | SiGe | Square | 980 | 0.2590 | 4.5902 | 1.62 |
| 9 | Two-stage | SiGe | Cylindrical | 980 | 0.2710 | 4.6881 | 1.38 |
| 10 | Two-stage | SiGe | Trapezoidal | 980 | 0.2537 | 4.5982 | 1.62 |
| 11 | Two-stage | Bi2Te3 | Square | 480 | 0.1192 | 10.811 | 0.822 |
| 12 | Two-stage | Bi2Te3 | Cylindrical | 480 | 0.1258 | 11.060 | 0.701 |
| 13 | Two-stage | Bi2Te3 | Trapezoidal | 480 | 0.1169 | 10.833 | 0.821 |
| 14 | Two-stage | SiGe+Bi2Te3 | Square | 880 | 0.4627 | 15.011 | 1.91 |
| 15 | Two-stage | SiGe+Bi2Te3 | Cylindrical | 830 | 0.4302 | 14.551 | 1.56 |
| 16 | Two-stage | SiGe+Bi2Te3 | Trapezoidal | 830 | 0.4053 | 14.365 | 1.81 |
| 17 | Segmented | SiGe+Bi2Te3 | Square | 730 | 0.7293 | 13.172 | 0.716 |
| 18 | Segmented | SiGe+Bi2Te3 | Cylindrical | 730 | 0.7325 | 13.165 | 0.694 |
| Combination | Arrangements | Material | Leg Geometry | Computational Time (s)/Single Case |
|---|---|---|---|---|
| 1 | Single stage | SiGe | Square | 1200 |
| 2 | Single stage | SiGe | Cylindrical | 1560 |
| 3 | Single stage | SiGe | Trapezoidal (Aleg,hotside> Aleg,coldside) | 1500 |
| 4 | Single stage | SiGe | Trapezoidal (Aleg,coldside> Aleg,hotside) | 1440 |
| 5 | Single stage | Bi2Te3 | Square | 1260 |
| 6 | Single stage | Bi2Te3 | Cylindrical | 1380 |
| 7 | Single stage | Bi2Te3 | Trapezoidal | 1320 |
| 8 | Two-stage | SiGe | Square | 3300 |
| 9 | Two-stage | SiGe | Cylindrical | 6000 |
| 10 | Two-stage | SiGe | Trapezoidal | 4500 |
| 11 | Two-stage | Bi2Te3 | Square | 3540 |
| 12 | Two-stage | Bi2Te3 | Cylindrical | 5940 |
| 13 | Two-stage | Bi2Te3 | Trapezoidal | 8940 |
| 14 | Two-stage | SiGe+Bi2Te3 | Square | 3780 |
| 15 | Two-stage | SiGe+Bi2Te3 | Cylindrical | 6240 |
| 16 | Two-stage | SiGe+Bi2Te3 | Trapezoidal | 7140 |
| 17 | Segmented | SiGe+Bi2Te3 | Square | 1920 |
| 18 | Segmented | SiGe+Bi2Te3 | Cylindrical | 2100 |
| Arrangements | Material | Maximum Power-Theoretical (W) | Maximum Power-Numerical (W) | Maximum Efficiency-Numerical (%) | Maximum Stress-Numerical (GPa) |
|---|---|---|---|---|---|
| Single stage | Bi2Te3 | 0.0233 | 0.0230 | 3.7805 | 0.163 |
| Single stage (SL) | Bi2Te3 | 0.0279 | 0.0270 | 3.7486 | 0.022 |
| Two-stage | Bi2Te3 | 0.0091 | 0.0089 | 3.3790 | 0.212 |
| Two-stage (SL) | Bi2Te3 | 0.0104 | 0.0101 | 3.2696 | 0.024 |
| Two-stage | SiGe+Bi2Te3 | 0.0111 | 0.0109 | 2.7764 | 0.283 |
| Two-stage (SL) | SiGe+Bi2Te3 | 0.0120 | 0.0115 | 2.6337 | 0.151 |
© 2020 by the authors. Licensee MDPI, Basel, Switzerland. This article is an open access article distributed under the terms and conditions of the Creative Commons Attribution (CC BY) license (http://creativecommons.org/licenses/by/4.0/).
Share and Cite
Lee, M.-Y.; Seo, J.-H.; Lee, H.-S.; Garud, K.S. Power Generation, Efficiency and Thermal Stress of Thermoelectric Module with Leg Geometry, Material, Segmentation and Two-Stage Arrangement. Symmetry 2020, 12, 786. https://doi.org/10.3390/sym12050786
Lee M-Y, Seo J-H, Lee H-S, Garud KS. Power Generation, Efficiency and Thermal Stress of Thermoelectric Module with Leg Geometry, Material, Segmentation and Two-Stage Arrangement. Symmetry. 2020; 12(5):786. https://doi.org/10.3390/sym12050786
Chicago/Turabian StyleLee, Moo-Yeon, Jae-Hyeong Seo, Ho-Seong Lee, and Kunal Sandip Garud. 2020. "Power Generation, Efficiency and Thermal Stress of Thermoelectric Module with Leg Geometry, Material, Segmentation and Two-Stage Arrangement" Symmetry 12, no. 5: 786. https://doi.org/10.3390/sym12050786
APA StyleLee, M.-Y., Seo, J.-H., Lee, H.-S., & Garud, K. S. (2020). Power Generation, Efficiency and Thermal Stress of Thermoelectric Module with Leg Geometry, Material, Segmentation and Two-Stage Arrangement. Symmetry, 12(5), 786. https://doi.org/10.3390/sym12050786