Article

A Novel Method of Laser Coating Process on Worn-Out Cutter Rings of Tunnel Boring Machine for Eco-Friendly Reuse

by
Anil Kumar Agrawal
1,*,
Somnath Chattopadhyaya
1,
V. M. S. R. Murthy
1,
Stanisław Legutko
2 and
Grzegorz Krolczyk
3
1
Indian Institute of Technology (Indian School of Mines), Dhanbad 826004, India
2
Institute of Mechanical Engineering, Poznan University of Technology, 61-704 Poznan, Poland
3
Department of Manufacturing Engineering and Automation Products, Opole University of Technology, 45-758 Opole, Poland
*
Author to whom correspondence should be addressed.
Symmetry 2020, 12(3), 471; https://doi.org/10.3390/sym12030471
Submission received: 9 February 2020 / Revised: 22 February 2020 / Accepted: 28 February 2020 / Published: 17 March 2020
(This article belongs to the Special Issue Symmetry in Mechanical Engineering Ⅱ)

Abstract

:
Cutter rings form an integral part of tunnel boring machines (TBM). These cutters are deployed in various hard rock tunneling projects. The life of the cutter rings governs the economics of tunneling significantly. This paper presents a novel methodology to enhance hardness and wear resistance of used worn out disc cutters in TBM for eco-friendly reuse. Disc cutters are mainly made of H13 tool steel. To improve the hardness and wear resistance, a layer of tungsten carbide is coated on the used cutter rings. Considering the long operating hours of TBM, cutter rings get worn out due to severe interaction with the hard rock both in compression and rolling mode. Replacement of the cutter-ring is costly, and quite a time consuming and cumbersome job. Refurbishment is always a better option and laser cladding is a novel technique for enhanced life of cutters. It increases the hardness and wear resistance of the cutters to a considerable extent. Cladding is carried out with the help of a laser beam. In this method, a layer of nanoparticles of tungsten carbide powder is deposited on the worn-out surface of the cutters. For carrying out the investigation, different coating parameters are selected based on the central composite design (CCD). With different capacities of laser, a total of 13 samples were prepared at various scanning speeds varying between 200 to 300 mm/min and a level of laser power varying between 100 to 200 W. The coating is critically inspected by various means such as an optical microscope, FESEM, and EDS. Hardness testing was accomplished by Vicker’s hardness testing machine. Wear testing was carried out with the aid of pin on disc setup. The results shows an asymmetrical behavior between the yield parameters (hardness and wear rate) and process parameters (scanning speed and laser power). The hardness values increased from 16% to 95%. A correlation test was conducted between the hardness and wear rate. The results depict a clear negative correlation between them, indicating the advantage of laser coating for reducing cutter ring wear in TBM.

1. Introduction

The tunnel boring machine is a game-changer in mechanized tunneling technology. It is used for boring tunnels for various purposes such as irrigation, metro, subway, hydel, canals, and sewage [1]. The cutter head is located in front of the TBM structure and it rotates at a very slow rpm (2 to 8 rpm). It cuts the rocks by chipping and causes advancement of the tunnel face. Disc cutters are positioned on the cutter head and these disc cutters are a combination of various parts such as cutter ring, bearing, seal, cage, etc. Cutter rings are generally made of H13 tool steel and they directly interact with the rocks during the cutting process. Friction and abrasion occur between the cutter rings and the rocks resulting in wearing-out of the cutter ring [2]. Initially, the hardness of new cutter rings was observed to be in the range of 540 to 560 HV0.2. After running against rock their hardness decreases (413 to 460 HV0.2) due to wear-out of the hard face as well as an increase in ring width, chipping, abrasion, and spalling and pitting occurs. Typically, a TBM cutter head consists of 50–60 disc cutters as per the nature of rock to be tunneled through. The cost of each disc cutter ranges from 2500–$2800. New and worn out cutter rings are shown in Figure 1.
Cutter rings are costly and their replacement is quite time-consuming. Refurbishment happens to be a much acceptable option for ease of operation. Different types of rapid prototyping (RP) technologies are used for the refurbishment of material such as stereolithography (SLA), fused deposition modeling (FDM) and laminated object manufacturing (LOM) [3]. In SLA, parts are contrived by a fluid photosensitive resin within sight of laser radiation. The FDM method is used for fabricating layered surfaces. In this method, a thermoplastic filament is used in a supply head, and then this fused material is extruded from the head for making layers. In LOM, layers are formed with the help of paper, plastics, and metals with glued together. These layers are cut by a laser cutter. However, RP technologies are used for developing the functional parts directly from the metals without the aid of binders or other activities. Laser surface cladding (LSC) meets this challenging requirement. It is widely utilized for producing metal parts by metal powders with higher productivity. In this strategy, the materials are bolstered on the substrate under the laser beam by various means such as powder paste, powder blowing and wire feed [4]. In a comparatively short time, a laser beam interacts with them and thus, chemical and microstructural changes are observed [5]. The laser power, scanning speed, and beam diameter are the deciding factors for the thickness of the coating [6]. Different types of surface treatment and the composite coating is done using LSC. It is widely used for non-porous and crack-free surface treatment.
In mining and heavy engineering, failure due to the wear of cutting tools is a frequent phenomenon [7]. It affects the production, operation and economic strategies of the company [8]. Enhancement of the wear resistance of the machine cutting tools can be obtained by hard facing or coating of abrasion-resistant material [9]. A common method for the production of this hard facing is by using metal matrix composites (MMC). It is a mixture of hard ceramic phase and a ductile metal matrix. Ni- and Co-based compounds are frequently used with tungsten carbide (WC) for the hard facing of material [10]. WCs are usually supplied in the form of alloy powder, in which binding-agglomerates of WC particles are included and its hardness is in the range of 1500–2000 HV. Cermets of WC-Co are also used as abrasion-resistant materials in the industries. Using a CO2 laser, the coating of 83% WC on the surface of AISI 1043 presents less porosity, a high coating hardness and a very good adhesive layer substrate [11,12]. The other benefits of the coatings are erosion resistance, corrosion and oxidation barrier, reclamation of worn-out parts, enhanced electrical and thermal property [13,14].
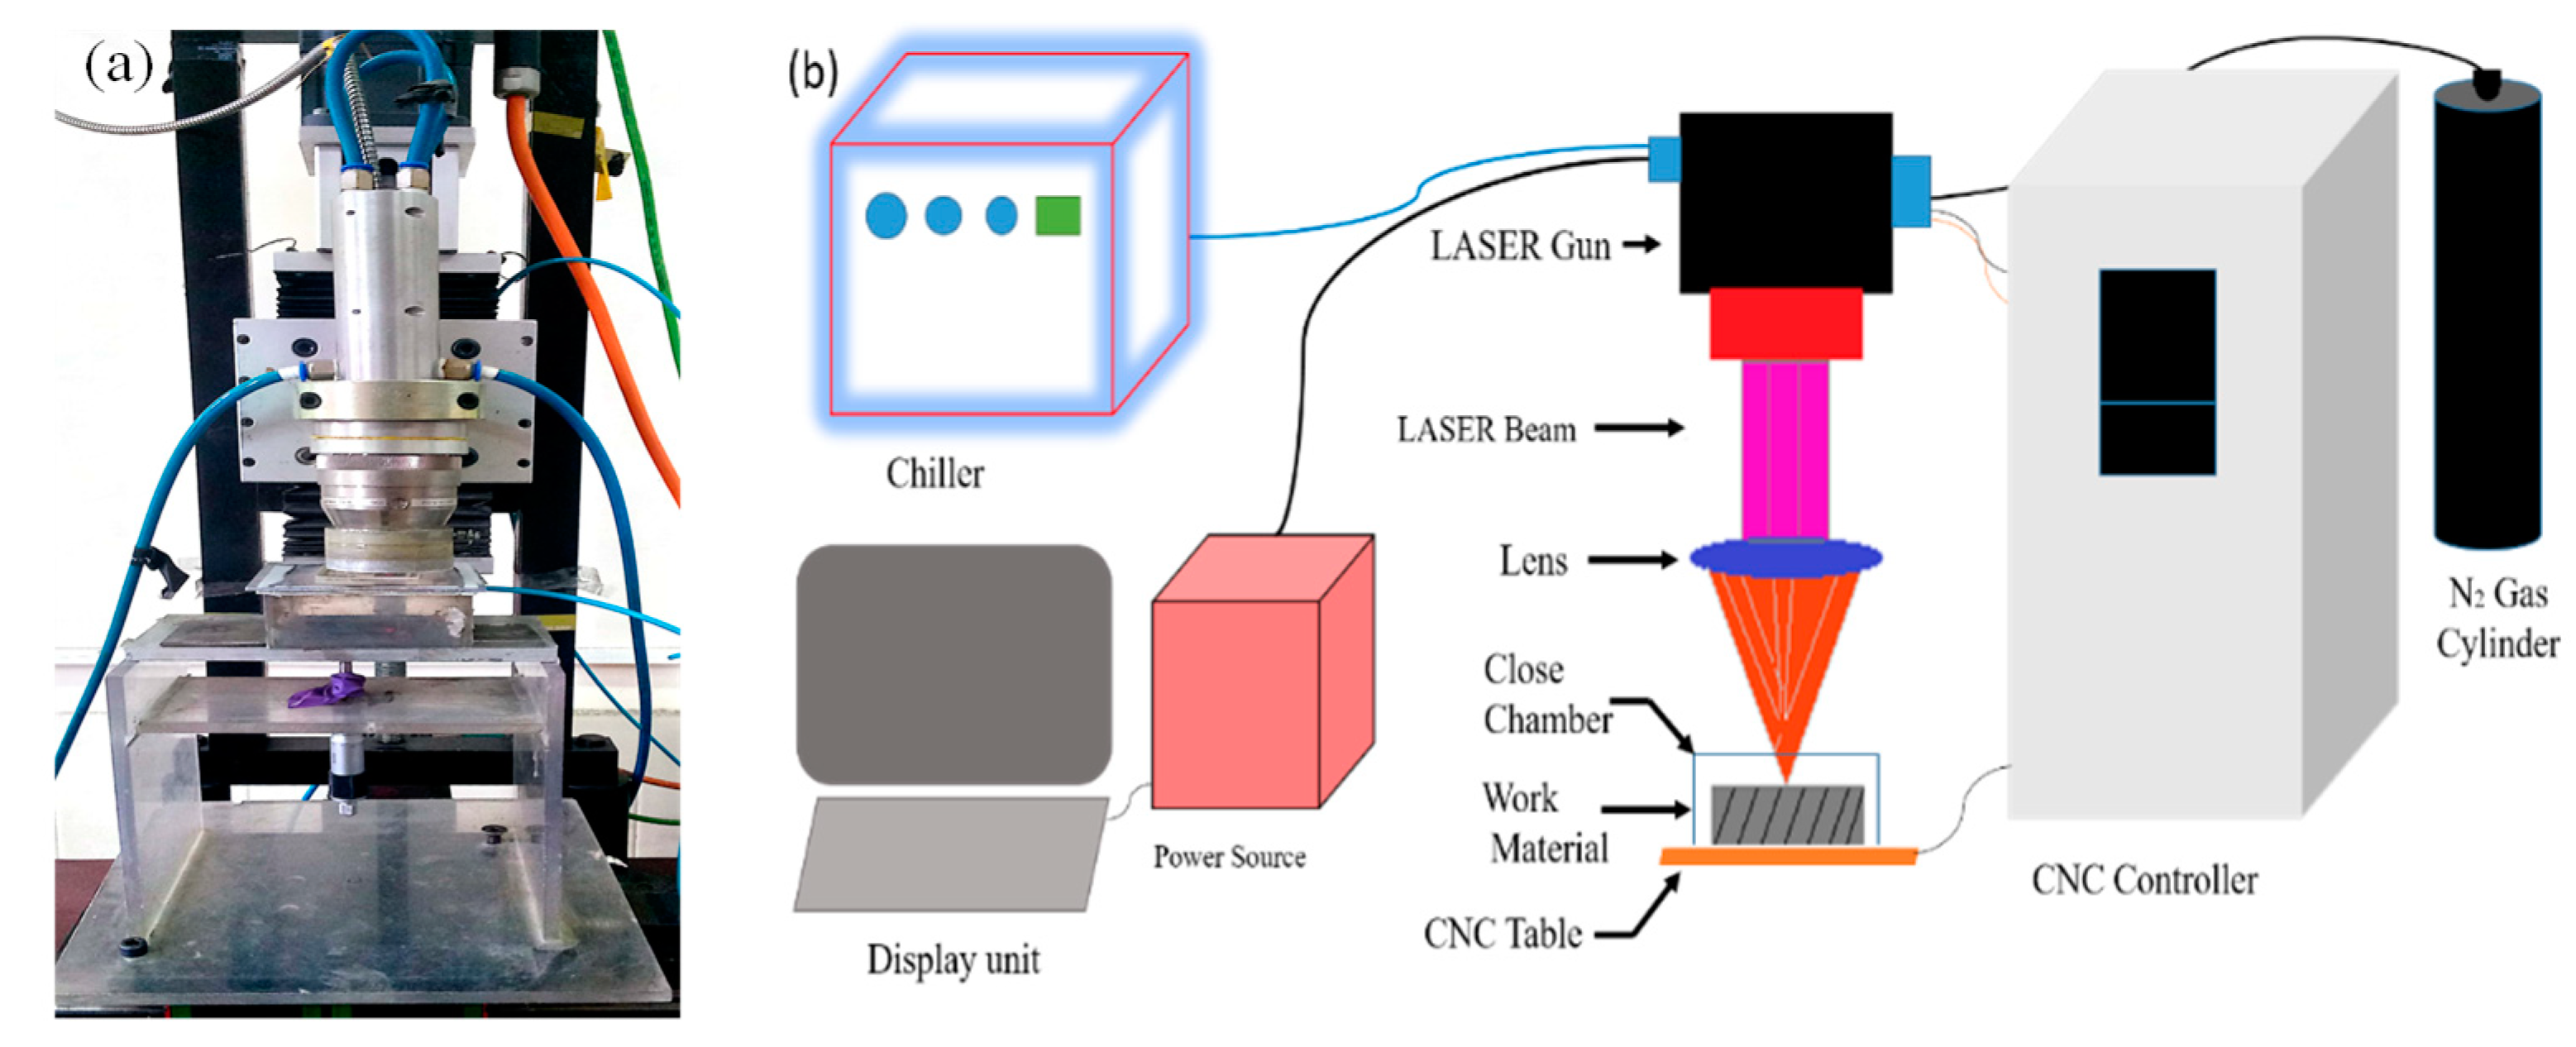
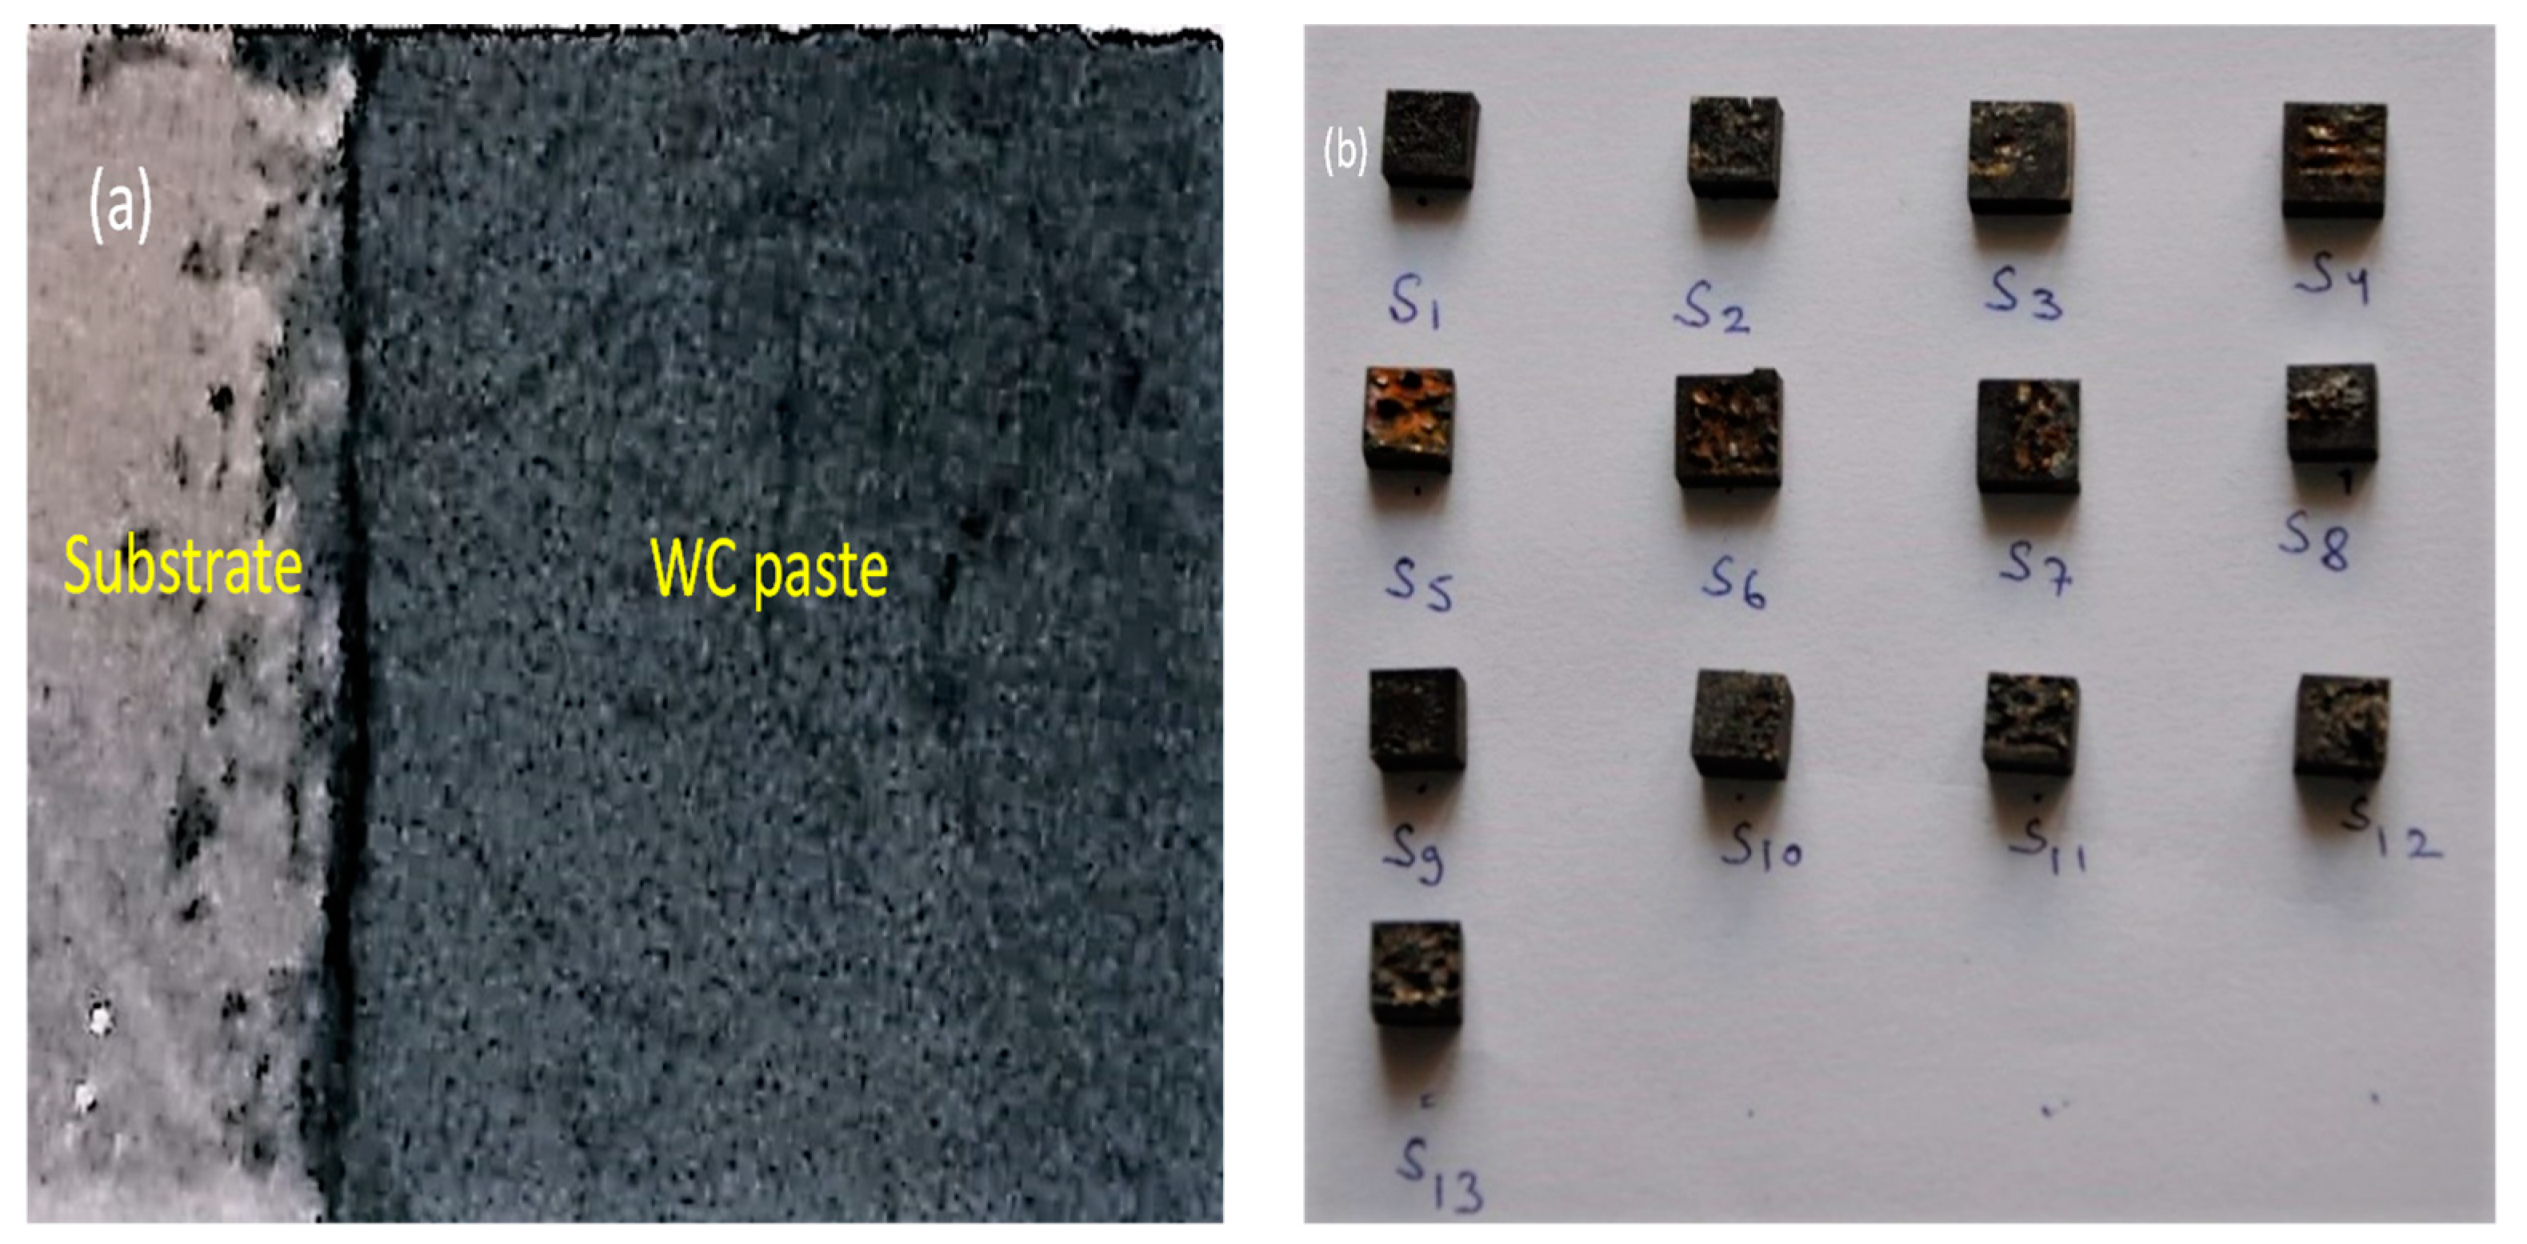
This paper reports the investigations carried out on the usage of WC coating on the worn-out cutter rings of disc cutters used in tunnel boring machine. The coating has been made with the help of a fiber laser in the presence of N2 shielding gas. WC nanopowder has been used as a coating material and H13 tool steel as a substrate. Initially, a 5 mm thick plate of H13 was made with the help of an abrasive cutter and wire electric discharge machining (WEDM). A 1 mm thick layer of WC paste has been formed with the help of polyvinyl alcohol (PVA) solution. A laser beam with different process parameters has been passed over the paste of WC. In situ formation of coating has been investigated by an optical microscope, FESEM and EDS. Hardness testing was done by the Vicker’s hardness testing machine. Wear testing has been performed on a pin on disc setup. ANOVA was employed to analyze the impact of laser processing-related parameters (laser speed, scanning speed) on the yields (hardness and wear rate) of the coating. A desirability test was performed to get the correlation of input and output parameters. A correlation test has also been carried out between the hardness and wear rate of coating, with the help of R-software.

2. Materials and Methods

2.1. Materials

The materials that have been used in the experimental work are H13 tool steel (worn out cutter ring) and WC nanopowder of 60 nm with 99.5% assay (as given by the manufacturer). PVA has been used as a solution for mixing WC nanopowder properly and for making a paste of that. The compositions of the materials used as substrate are given in Table 1.

2.2. Experimental Setup

The cladding was done on the fiber laser setup. Initially, the surface of the substrate was cleaned with acetone. WC nanoparticles were mixed with PVA solution and a paste was prepared. This paste was placed on the substrate and it was dried in the furnace at 80 °C for 2–3 h till moisture gets vaporized from the paste. The laser setup comprised of a continuous wave (CW) fiber laser with a power ranging from 100 to 400 W [15]. The laser head installed along the z-axis controls beam diameter and the table adjusts the scanning speed of the laser beam. The cladding chamber is in cuboid shape and made up of perspex material with a dimension (100 × 100 × 40 mm). It is put on the CNC table as shown in Figure 2. The cladding chamber is furnished with two openings, one for inlet of shielding gas (N2) and other for exhaust [16]. A quartz plate of dimension (50 × 50 × 2 mm) is set on the top center position of the cladding chamber to pass a laser beam [17]. The laser setup and its schematic diagram were shown in Figure 2.

2.3. Design of Experiment

The experiment was designed using the central composite method, with the two levels of each input parameter with 13 runs of the experiment [18]. The low and high levels of parameters were selected based on some pilot tests conducted earlier, taking into consideration the limitations of the available experimental setup (shown in Table 2). Thus, a completely randomized experimental design with 13 experimental runs was generated using Minitab 17.0 software (shown in Table 3). Figure 3 is shown the substrate with tungsten carbide paste and coated samples.

2.4. Equipment

The composition of the coating was checked by Zeiss energy-dispersive X-ray spectroscopy (EDS) [19]. The coating was verified by an Olympus optical microscope with the highest resolution of 50× and Zeiss field emission scanning electron microscope (FESEM). Hardness testing was carried out by the Chennai Metco Vicker’s hardness testing machine. Wear testing was executed with the help of a pin on disc setup (wear and friction monitoring machine TR-20).

3. Results

3.1. Coating

The cladding was done with the aid fiber laser at different settings. The major process control parameters are laser power and scanning speed with different combinations of the experiment. It was done based on the central composite method [20]. For testing of the deposited coating, an optical microscope was used in the presence of proper etchant (Murakami reagent). Figure 4a shows the interaction zone of the substrate and coating, and Figure 4b,c manifests the coating of tungsten carbide on the substrate. A needle and dendrite type of microstructure clearly showed the presence of tungsten carbide on the substrate in Figure 4b,c. The bonding strength between the coating and substrate is very high and homogeneous. Acute martensite was formed in the heat-affected zone (HAZ) and more uniform distribution of reinforcement particles is shown in Figure 4b, where martensites are predominantly of needle shape. This formation of micro constitutes has been found to determine the high hardness values. This happens due to the rapid cooling at room temperature [21]. The large heat energy evolved in the coating, joined with the favorable thermal gradients environment of the cladding core manifested slow rates of solidification. It provides adequate excitation and time for the WC particles to mix in the metallic matrix, at the portion of the coating outskirts, where thermal gradients are comparatively higher due to the fast cooling by convection to the surroundings and conduction at the cladding–substrate interface. One case, denoted by Figure 4c, is rich in mixed carbides with a dendritic growth [7].

3.2. Microstructure Analysis

Microstructure analysis was critically analyzed by FESEM of the laser cladding at different parametric settings. There is a straight impact of the laser power on the morphology of the coating. It can be observed from Figure 5a, that WC nanoparticles are evenly distributed and micro-holes are presented on the surface. Different levels of laser power produce a different coating thickness. When the laser power was low, “mess” type coating occurs. Two reasons may be responsible for this. The first one is due to a lack of energy. The refractory phase was not completely melted thus, gases are probably entrapped and form micro holes and cracks. The second is that the rapid heating and cooling forms thermal stresses which generate micropores in the coating. At moderate laser power, a good metrological bonding is obtained between the coatings. Some pores sporadically remain there but microstructures are comparatively finer in comparison to the earlier cases. At higher power, the coating is in more favorable condition; fishbone microstructures are formed with a less number of holes. At low scanning speed, the cladding is a mixture of the amorphous and crystalline regions, and at moderate scanning speed it is full of block grain structure. At a higher speed, it is full of dendritic microstructure. It could be observed that the cladding layers were dense and clear interface lines are visible at different scanning speeds. Cracks have been formed in some cladding layers (Figure 5b). The curvature of the interface decreased as heat input increased, indicating the change in dilution rates. The width and height varied with scanning speed. When scanning speed is high, these values are low (less time of solidification) and weaker due to the “heat-shielding effect”. The substrate under the interface exhibited a martensite structure and columnar crystal zone. Strip-shaped precipitates could be identified between columnar grains [22].
The laser beam, coating material and material interaction time are the root cause of the primary carbide phase in the metal matrix. This mainly depends on the primary WC particle dissolution decree and the quantity fraction in their compound size and overall content. The conditions of processing ought to be optimized to minimize the disruption of primary carbides. Decreased laser strength and increased scanning speed resulted in high porosity levels and layers cracking shown in Figure 5e. The good quality coatings were achieved at 220 W laser power and 250 mm/s scanning speed in combination. The amount of volume fraction of WC particles determines the surface roughness and structure of the coating. The lesser and harder the phase content is, the better the liquefied material flow will be, resulting in the formation of a smooth surface of coating [23]. A laser-clad layer can be classified into three parts, i.e., build-up, dilution, and heat-affected area. The dilution area is a melted mixture of deposited material and substrate. The heat affected area is just below the dilution zone in which the elevated temperature is less than the melting point [24]. Build-up and dilution areas are seriously affected by scanning speed. As the laser ray moves faster, the mass of volume and build-up becomes smaller. Nevertheless, reducing the scanning speed could minimize the dilution zones or in some cases, it gets completely disappeared [25]. The presence of porosity and globules was obtained in the coatings. This can be described by trapped gases present because of large liquid viscosity actuated by WC particles in the melt pool, as shown in Figure 5d. The thickness of the coating was also inspected and the average thickness of the coating found to be 680 µm, as shown in Figure 5f. The interface fusion line was irregular and non-linear in nature [26].

3.3. EDS Analysis

The scanning results of elements for sample using a spectrometer (EDS) are shown in Figure 6a. Figure 6b depicts the spectrum 1 elemental analysis of the coating side and Figure 6c shows the spectrum 2 elemental parts of the non-coating side. Detailed elements of coated and non-coated sides are shown in Table 4. It is revealed that Fe has the highest parts at 88.59% in the substrate. Other elements, such as C, Cr, and Mn, were lower but they also play a significant effect in enhancing the strength and hardness of the remelting layer by forming a substitutional solid solution. Based on the analysis, it was observed that the grain refinement and the solid-liquid shrinkage in the liquid pool increased due to the addition of nano-WC particles. Heat transfer capabilities of the coating surface improved during remelting, resulting in intimate coating combined with the matrix material.

3.4. Hardness Testing

Hardness testing was done by Vicker’s hardness testing machine at 200 gm load for 10 dual seconds. The metal elements Fe, Mn, V, Si, Cr, WC, and the non-metallic element C appeared (EDS analysis) to diffuse and there was strong bonding among the elements. The higher the laser power, the smaller the microstructure characteristics and the fewer the number of micro holes. As the laser power increased, hardness also increased from 16% to 95%. The microhardness increased with depth from the bonding interface to the coating surface. The scanning speed has a significant effect on the resulted coating hardness. Smaller the grain size, the higher will be the hardness (hall patch formula). As the scanning speed increases, the hardness and wear resistance of the coating gradually decrease due to change in microstructure. The hardness distribution in the thickness direction is shown in Figure 5a,b. It increased from the substrate to the interface zone and then to the cladding zone. Overall, the hardness of the cladding layer has significantly increased and the values are repeatable.
The hardness of coated layers ranged from 580 to 870 HV0.2. It is much higher than that of the substrate (400–460 HV0.2). However, there is a significant difference in hardness among the coatings and it is shown in Table 5. Hardness profile as a function of cladding depth was measured for all prepared samples. Profiles of the samples are shown in Figure 7. The high hardness values of the WC particles in laser coating are manifested. The reason may be the minimal heat damage during laser cladding.
ANOVA analysis helped in finding the influence and contribution of process parameters in the study [27]. This analysis of laser speed, scanning speed and hardness of the coating was done with the help of Minitab 17.0 and are shown in Table 6.
Regression Equation in Un-coded Units
Hardness = 771 + 1.63 Laser Power−1.79 Scanning Speed + 0.00078 Laser Power × Laser Power + 0.00138 Scanning Speed × Scanning Speed + 0.00050 Laser Power × Scanning Speed
From Table 6, it can be viewed that the p-value of the ANOVA is <0.001 [28]. This establishes the significance of the laser power and scanning speed on the variance of the hardness of the coating. The regression equation gives the relation between the input process parameter and yield parameter. The surface plot of hardness, laser speed, and scanning speed is shown in Figure 8a. The fit plot depicts that with the increasing scanning speed, hardness decreases (Figure 8b) and with increasing laser power, it increases (Figure 8c).

3.5. Wear Testing

Laser coated tungsten carbide has better wear resistance than the substrate. High hardness values of WC particles in laser cladding coating remains almost unchanged due to the loss of minimum heat during laser cladding. Wear testing was carried out with the help of a pin on disc setup (wear and friction monitoring machine TR-20) and is shown in Figure 9. The coated sample was attached to the rounded pin with the help of Araldite and left for 24 h. This pin was set up on the machine. This machine mainly contains a rotating disc of En 31. It is a good quality high carbon alloy steel having high hardness value with compressive strength and abrasion resistance. Compositions of En31 are C 0.9–1.2%, Si 0.1–0.35%, Mn 0.3–0.75%, S 0.05% max, P 0.05% max, Cr 1–1.6%, 0.05% max and the rest iron. A load of 1 kg was operating on the pin and disc was rotating at 350 rpm. The initial weight of the samples was recorded. All samples were tested for 1 min. After running of the pin on the disc, the weight of the pin was again noted. The differences in the weight give the wear of the samples. The substrate has the highest wear (loss in mass) 68 × 10−5 gm/min. All coated samples were also tested. Coated samples provided better results than uncoated samples or substrate and it is visible in Figure 10.
ANOVA analysis of laser speed, scanning speed and wear rate of the coating. It was done with the help of Minitab 17.0. The detail report was shown in Table 7.
Regression Equation in Un-coded Units
Wear rate/min = 73.1−0.367 Laser Power−0.154 Scanning Speed + 0.000025 Laser Power × Laser Power + 0.000325 Scanning Speed × Scanning Speed + 0.000600 Laser Power × Scanning Speed
The p-value of the ANOVA is <0.001, which confirms the significant effect of laser power and scanning speed have on the wear of the coating [29]. The surface plot of hardness, laser speed, and scanning speed was shown in Figure 11a. Wear of the cladding decreases with respect to an increase in laser power. It also increases with an increase in scanning speed. The fitted line plot gives similar results, i.e., with the increasing laser power wear of coating decreases (Figure 11b) and increases if the scanning speed increases (Figure 11c).

3.6. Desirability Test

Laser power and scanning speed contradict each other to the optimal setting of the input process parameter. The parameters are confounded in nature and it is difficult to achieve the optimal process parameters for better outcomes. The desirability function approach was used in this case. In this method, the translation of each response is carried out on a common scale. The desirability function ranges from 0 to 1 [30]. Therefore, the response feedback ‘xi’ is translated into possible values of xi in the desirability function Di (xi).
Di   ( xi ) = { 0   f o r   c o m p l e t e l y   u n d e s i r a b l e   v a l u e   o f   xi   1   f o r   c o m p l e t e l y   d e s i r a b l e   v a l u e   o f   xi   } .
In this experiment, desirability is to get the maximum hardness and minimum wear of the coating. Figure 12 shows the optimum parameter conditions required to achieve the desired outcome. In the graph, the x-axis is an input parameter (laser power, scanning speed) and the y-axis shows the desirability of the output parameter (wear rate and hardness).
The results show that the maximum hardness and minimum wear rate are obtained at laser power 220.71 W and scanning speed 179.28 mm/min.

3.7. Correlation Test

A correlation test was done with the help of R software between the hardness and wear rate of the coating. There is a negative correlation between those parameters [31]. Spearman correlation test was carried out. This correlation provides the relation between two parameters in the form of a numerical value. The outcome of these correlations lies between −1 to 1. In this experiment, all hardness data and wear rate data fit into the R- software. The detail report was shown in Table 8.
The correlation gives different types of results with Spearman (−0.9807163). These results show that there is a strong negative correlation between hardness and wear of the coating, indicating that as the hardness of the coating increases its wear decreases and the vice-versa.

4. Conclusions

In this paper, a nano-WC powder was coated on the worn-out cutter ring (substrate) using the LSC process. Laser power and scanning speed are two major process control parameters that are used for the coating. Thirteen samples were prepared on the basis of CCD at different input parameters.
The results of the study confirm the following observations:
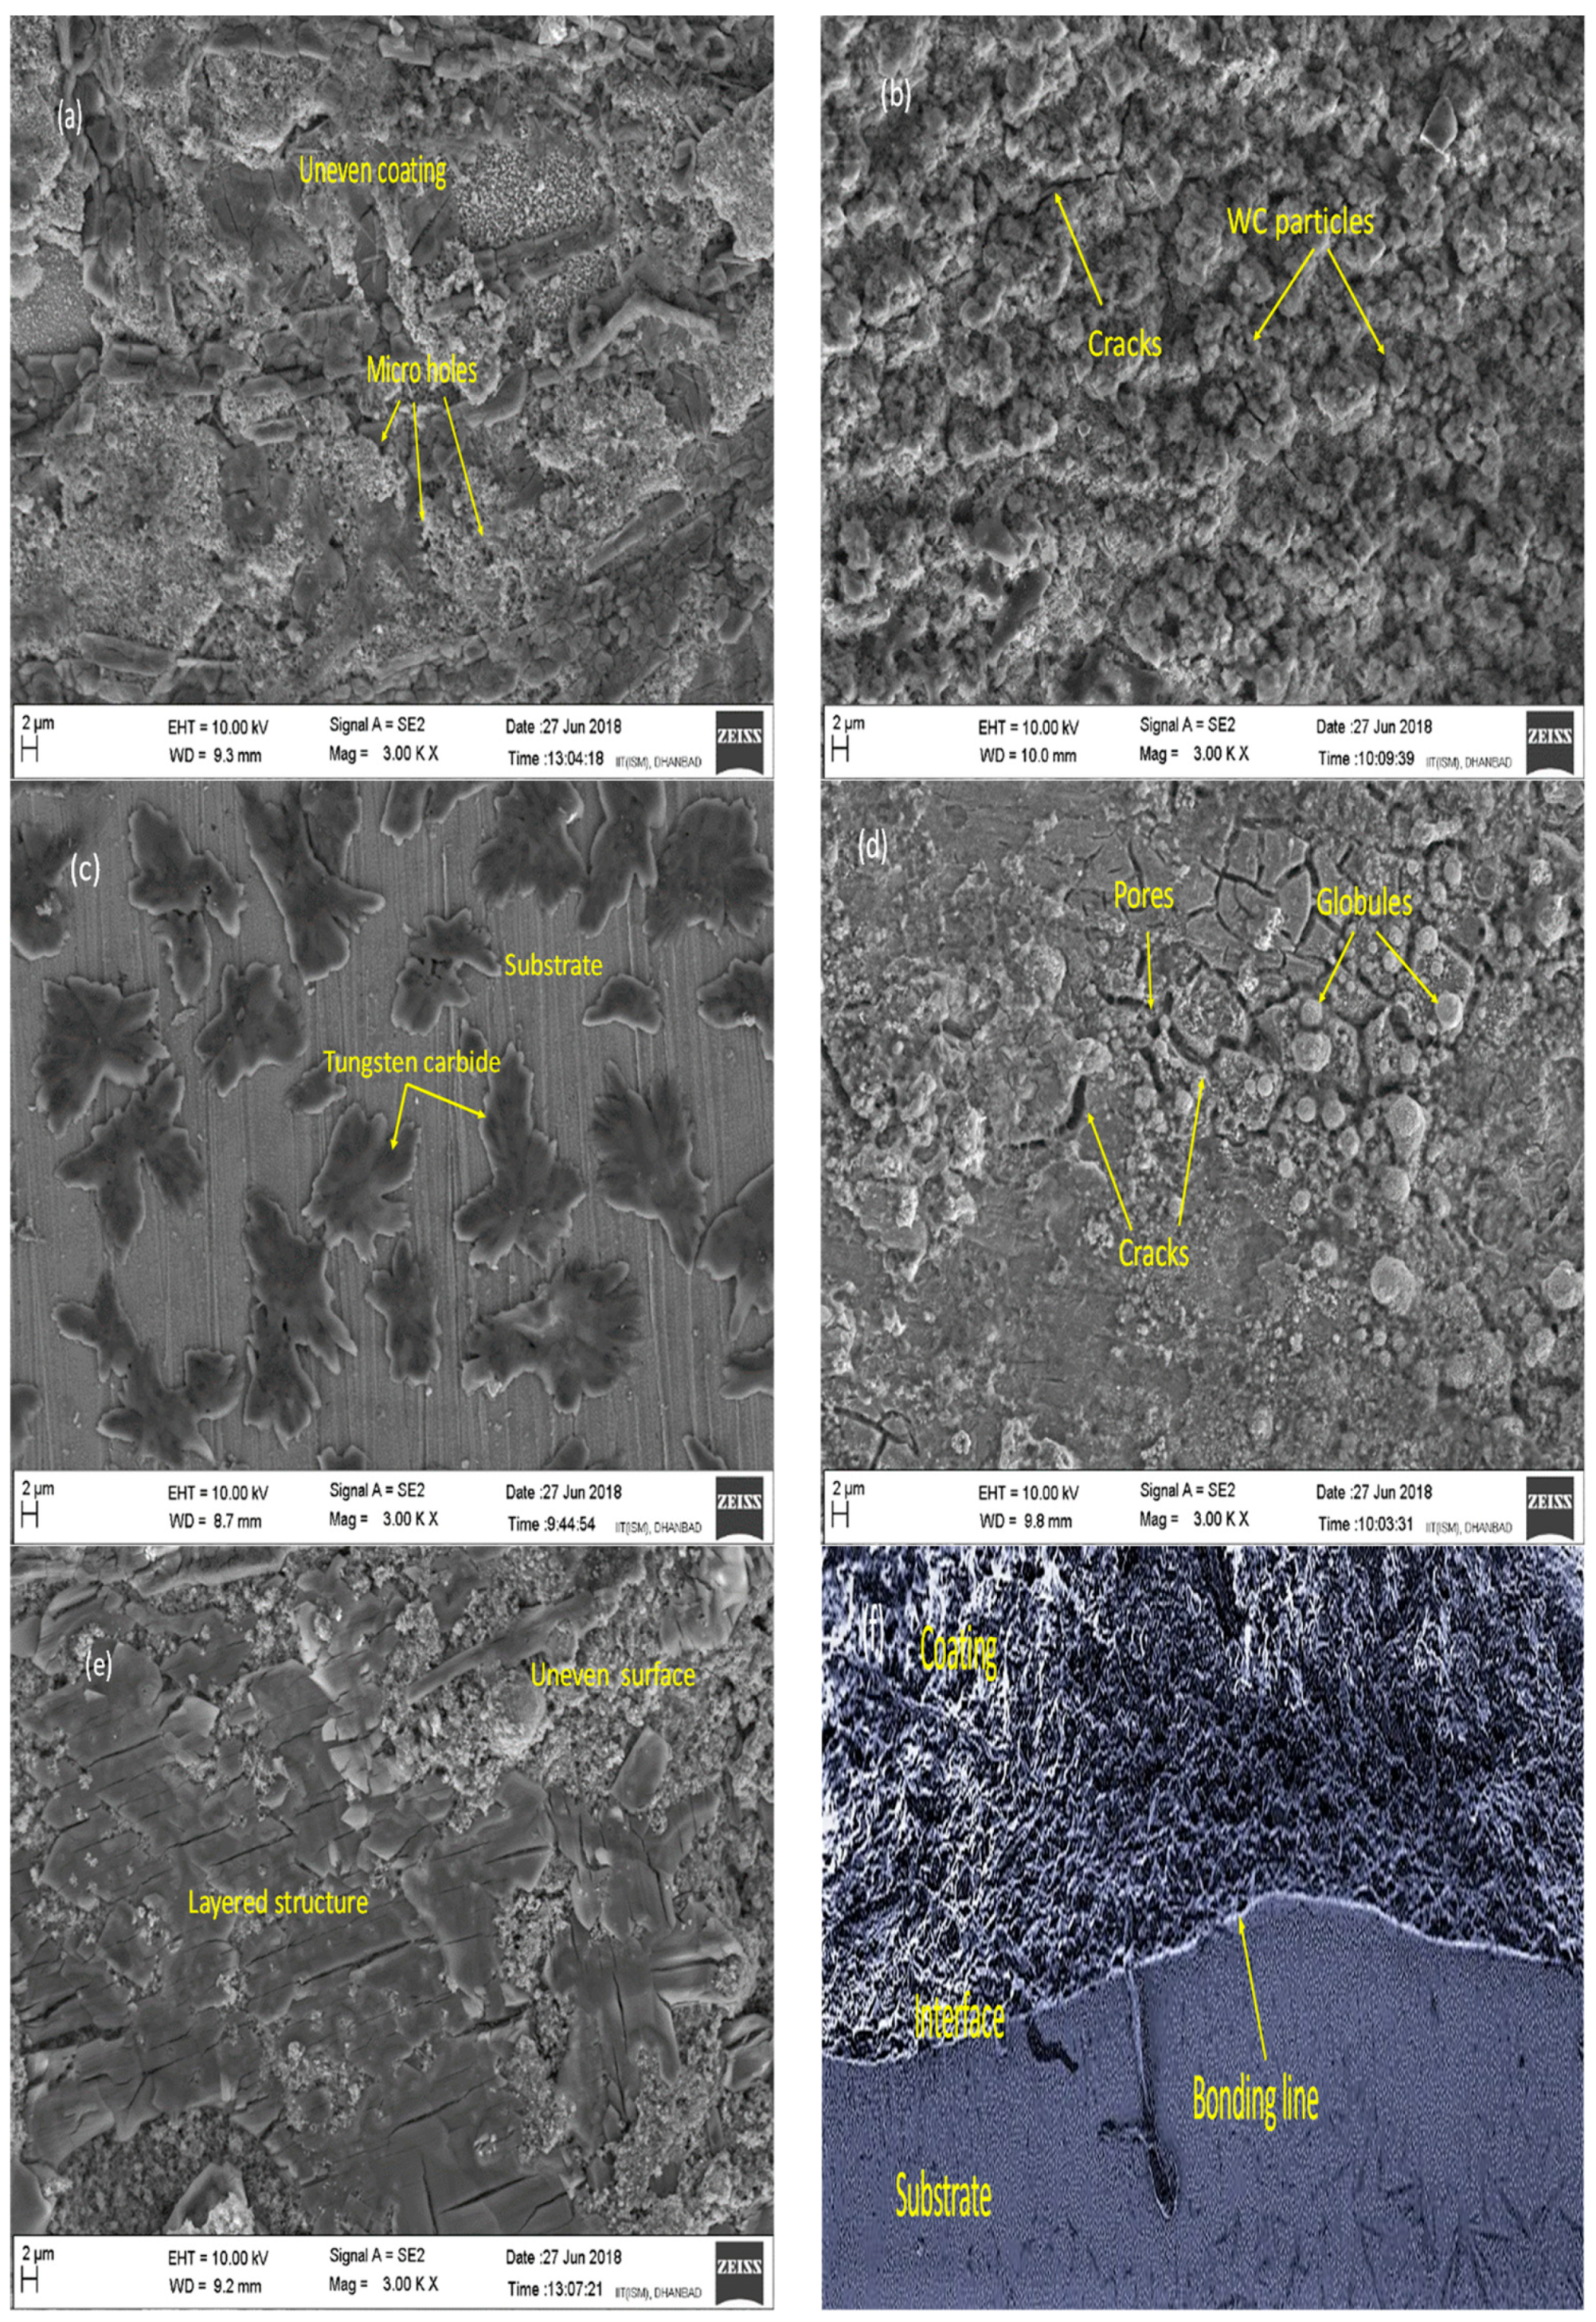
  • The laser cladding was performed at different values of the process control parameters provided a layered and uneven coating on the substrate.
  • Dendritic and needle type microstructures were formed and that shows the presence of WC on the cladding. Different types of deformities are present on the coating in the form of micro-holes, cracks, globules.
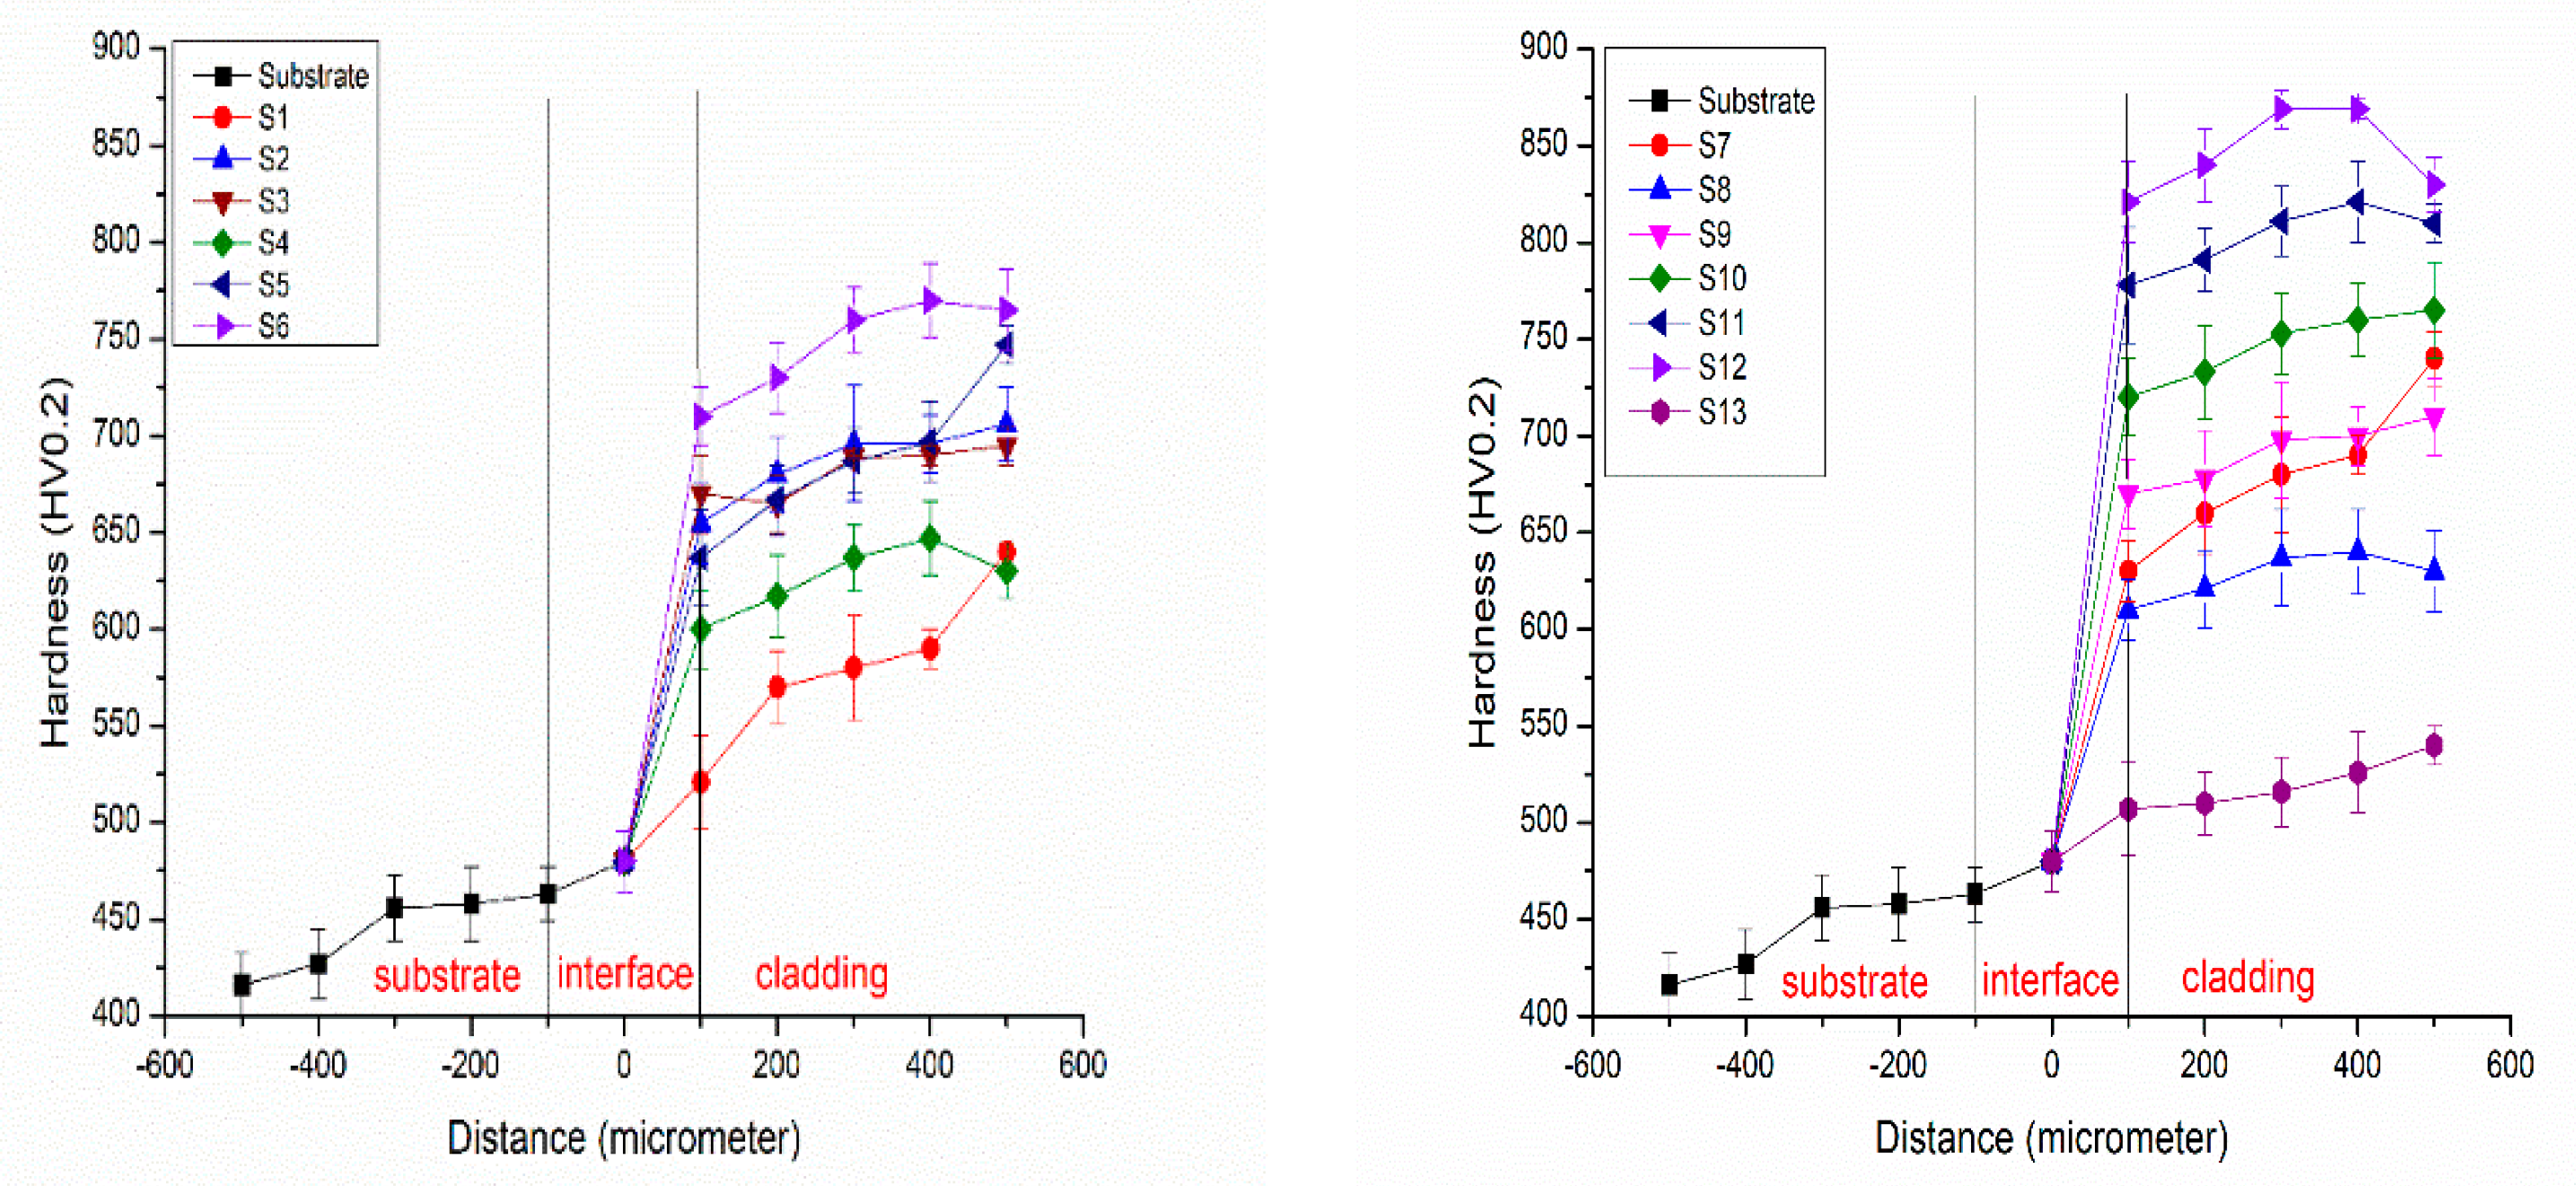
  • The hardness of coating layers varied from 580 to 870 HV0.2, which is much higher than that of the substrate (400–460 HV0.2). The microhardness increased due to strong bonding among the elements.
  • Wear of the substrate is 68 × 10−5 (loss in mass) g/min whereas the wear of the coated samples lies between 4 to 41 × 10−5 (loss in mass) g/min at different levels of process control parameters.
  • ANOVA depicts the crucial role of the major input parameters (laser power, scanning speed) on the response variables (hardness and wear).
  • The desirability function provides the optimal response of input parameters on the yield parameters. It shows that maximum hardness and minimum wear rate are attained at laser power (220 W) and scanning speed (179 mm/min).
  • A negative correlation (Spearman rho = −0.9807163) was observed between the hardness values and the wear of the coating. This depicts that with the increase in hardness of coating wear decreases.
These results show that the coating of WC on the substrate is an effective approach for eco-friendly reuse and refurbishment of worn out cutter rings for enhanced cutter life. This has direct economic benefits in deploying TBM technologies for tunneling projects.

Author Contributions

All the authors contributed equally to the conception of the idea, implementing and analyzing the experimental results, and writing the manuscript. All authors have read and agreed to the published version of the manuscript.

Funding

This research received no external funding.

Acknowledgments

This work was supported by the Central Power Research Institute under project no CPRI/2016-2017/492/ME and TEQIP fund of the Indian Institute of Technology (Indian School of Mines) Dhanbad 826004. The experiment was conducted in the Mechanical department workshop and testing was done in the CRF of the institute.

Conflicts of Interest

The authors declare no conflict of interest.

References

  1. Due, I.; Tunnelling, I.; Group, W.; Tunnelling, M.; Commission, E.; Innovation, T.; Technologies, N. Tunnel boring machines (TBMs) in difficult grounds. Tunn. Undergr. Space Technol. 2016, 57, 1–3. [Google Scholar] [CrossRef]
  2. Labaš, M.; Krepelka, F.; Ivaničová, L. Assessment of abrasiveness for research of rock cutting. Acta Montan. Slovaca 2012, 17, 65–73. [Google Scholar]
  3. Tolochko, N.K.; Mozzharov, S.E.; Yadroitsev, I.A.; Laoui, T.; Froyen, L.; Titov, V.I.; Ignatiev, M.B. Selective laser sintering and cladding of single-component metal powders. Rapid Prototyp. J. 2004, 10, 88–97. [Google Scholar] [CrossRef]
  4. Przybyøowicz, J.; Kusin, J. Structure of laser cladded tungsten carbide composite coatings. J. Mater. Process. Technol. 2001, 109, 154–160. [Google Scholar] [CrossRef]
  5. Beidi, Z.; Xiaoyan, Z.; Zmgyi, T.; Shuguo, Y.; Kun, C. Coarse cemented WC particle ceramic-metal produced by laser cladding composite coatings. Wear 1993, 170, 161–166. [Google Scholar]
  6. Hussain, M.; Mandal, V.; Kumar, V.; Das, A.K.; Ghosh, S.K. Development of TiN particulates reinforced SS316 based metal matrix composite by direct metal laser sintering technique and its characterization. Opt. Laser Technol. 2017, 97, 46–59. [Google Scholar] [CrossRef]
  7. Klaic, M.; Murat, Z.; Staroveski, T.; Brezak, D. Tool wear monitoring in rock drilling applications using vibration signals. Wear 2018, 408–409, 222–227. [Google Scholar] [CrossRef]
  8. Amado, J.M.; Tobar, M.J.; Alvarez, J.C.; Lamas, J.; Yáñez, A. Laser cladding of tungsten carbides (Spherotene®) hardfacing alloys for the mining and mineral industry. Appl. Surf. Sci. 2009, 255, 5553–5556. [Google Scholar] [CrossRef]
  9. Fernández, J.E.; Vijande, R.; Tucho, R.; Rodríguez, J.; Martín, A. Materials selection to excavator teeth in mining industry. Wear 2001, 250, 11–18. [Google Scholar] [CrossRef]
  10. Amado, J.M.; Tobar, M.J.; Yáñez, A. Laser cladding of NiCr-WC metal matrix composites: Dependence on the matrix composition. In Proceedings of the 36th International MATADOR Conference; Springer: London, UK, 2010; pp. 459–462. [Google Scholar] [CrossRef]
  11. Cadenas, J.M.C.M.; Fernandez, E.; Fernandez, M.R. Laser cladding of tungsten carbide powder. WIT Trans. Eng. Sci. 1997, 17, 247–256. [Google Scholar]
  12. Krolczyk, G.; Legutko, S.; Stoić, A. Influence of cutting parameters and conditions onto surface hardness of duplex stainless steel after turning process. Teh. Vjesn. 2013, 20, 1077–1080. [Google Scholar]
  13. Ramous, E.; Giordano, L.; Tiziani, A.; Badan, B.; Cantello, M. Laser Cladding of Ceramic and Metallic Coatings on Steel. Key Eng. Mater. 1990, 47, 425–434. [Google Scholar] [CrossRef]
  14. Maruda, R.W.; Feldshtein, E.; Legutko, S.; Krolczyk, G.M. Analysis of contact phenomena and heat exchange in the cutting zone under minimum quantity cooling lubrication conditions. Arab. J. Sci. Eng. 2016, 41, 661–668. [Google Scholar] [CrossRef] [Green Version]
  15. Zhang, X.; Xia, Y.; Zhang, Y.; Tan, Q.; Zhu, Z.; Lin, L. Experimental study on wear behaviors of TBM disc cutter ring under drying, water and seawater conditions. Wear 2017, 393, 109–117. [Google Scholar] [CrossRef]
  16. Gupta, A.; Hussain, M.; Misra, S.; Das, A.K.; Mandal, A. Processing and characterization of laser sintered hybrid B 4 C/cBN reinforced Ti-based metal matrix composite. Opt. Lasers Eng. 2018, 105, 159–172. [Google Scholar] [CrossRef]
  17. Xu, J.; Luo, Y.; Zhu, L.; Han, J.; Zhang, C.; Chen, D. Effect of shielding gas on the plasma plume in pulsed laser welding. Measurement. 2019, 134, 25–32. [Google Scholar] [CrossRef]
  18. Mandal, V.; Hussain, M.; Kumar, V.; Das, A.K.; Singh, N.K. Development of reinforced TiN-SS316 metal matrix composite (MMC) using direct Metal laser sintering (DMLS) and its characterization. Mater. Today Proc. 2017, 4, 9982–9986. [Google Scholar] [CrossRef]
  19. Rajmohan, T.; Palanikumar, K. Application of the central composite design in optimization of machining parameters in drilling hybrid metal matrix composites. Measurement 2013, 46, 1470–1481. [Google Scholar] [CrossRef]
  20. Lepper, K.; Rigney, D.A. Application of EDS peak enhancement ratios for compositional analysis of microstructures evolved during sliding wear. Wear 1998, 221, 134–137. [Google Scholar] [CrossRef]
  21. Montgomery, D.C. Introduction to Statistical Quality Control, 7th ed.; Wiley: Arizona State University, Tempe, AZ, USA, 2013. [Google Scholar]
  22. Franklin, O.O.; Akinlabi, E.T.; Nyembwe, K.D. Effect of laser power on the microstructure and microhardness property of hybrid fabricated Ti6A14V based metal matrix composite. Lect. Notes Eng. Comput. Sci. 2016, 2224, 6–9. [Google Scholar]
  23. Qiu, X.W.; Li, G.; Ren, X.; Qiu, L. Influence of Scanning Speed on Microstructure and Properties of Ni Based Laser Cladding Coating. Rare Met. Mater. Eng. 2009, 38, 325–328. [Google Scholar]
  24. Ibrahim, M.Z.; Kuo, T.; Yusof, F.; Hamdi, M. Influence of Laser Power and Scanning Speed on the Hardness and Microstructure of Fe-Based Metallic Glass Coating on Nickel-Free Stainless Steel Substrate. In Proceedings of the International Symposium on Novel and Sustainable Technology, Tainan City, Taiwan, 19–21 October 2017; pp. 3–6. [Google Scholar]
  25. Jiang, W.H.; Kovacevic, R. Laser deposited TiC/H13 tool steel composite coatings and their erosion resistance. J. Mater. Process. Technol. 2007, 186, 331–338. [Google Scholar] [CrossRef]
  26. Kumar, P.; Saw, K.; Kumar, U.; Kumar, R.; Chattopadhyaya, S.; Hloch, S. Effect of laser power and welding speed on microstructure and mechanical properties of fibre laser-welded Inconel 617 thin sheet. J. Braz. Soc. Mech. Sci. Eng 2017, 39, 4579–4588. [Google Scholar] [CrossRef]
  27. Mahapatra, S.S.; Patnaik, A.; Satapathy, A. Taguchi method applied to parametric appraisal of erosion behavior of GF-reinforced polyester composites. Wear 2008, 265, 214–222. [Google Scholar] [CrossRef]
  28. KumAR, R.; ChAttopAdhyAyA, S.; Hloch, S.; Krolczyk, G.; Legutko, S. Wear characteristics and defects analysis of friction stir welded joint of aluminium alloy 6061-T6. Eksploat. i Niezawodn. 2016, 18, 128–135. [Google Scholar] [CrossRef]
  29. Shariq, M.; Srivastava, M.; Tripathi, R.; Chattopadhyaya, S.; Vilaca, P.; Gubeljak, N.; Krolczyk, G. Optimization and characterization of friction surfaced coatings of ferrous alloys. Mater. Test 2018, 60, 707–718. [Google Scholar] [CrossRef]
  30. Mandal, A.; Dixit, A.R.; Das, A.K.; Mandal, N. Modeling and Optimization of Machining Nimonic C-263 Superalloy using Multicut Strategy in WEDM. Mater. Manuf. Process 2016, 31, 860–868. [Google Scholar] [CrossRef]
  31. Faria, A.C.L.; Benassi, U.M.; Rodrigues, R.C.S.; Ribeiro, R.F.; de Mattos, M.D.C. Analysis of the relationship between the surface hardness and wear resistance of indirect composites used as veneer materials. Braz. Dent. J. 2007, 18, 60–64. [Google Scholar] [CrossRef]
Figure 1. (a) cutter head with cutter rings; (b) new cutter ring; (c,d) worn out cutter rings.
Symmetry 12 00471 g001
Figure 2. (a) Image of laser setup; (b) schematic diagram of laser setup.
Symmetry 12 00471 g002
Figure 3. (a) Substrate and tungsten carbide (WC) paste (b) coated samples.
Symmetry 12 00471 g003
Figure 4. (a) Top view of coated sample; (b,c) coated samples.
Symmetry 12 00471 g004
Figure 5. FESEM image of samples (a) S2, (b) S3, (c) S5, (d) S9, (e) S1, (f) S7 (cross-sectional view).
Symmetry 12 00471 g005
Figure 6. (a) EDS image of coated sample; (b) elemental graph of coated part; (c) elemental graph of substrate.
Symmetry 12 00471 g006
Figure 7. Variation of micro-hardness in the cross-sectional direction.
Symmetry 12 00471 g007
Figure 8. (a) Surface plot of hardness, laser power and scanning speed. (b) Fitted line plot of hardness and scanning speed. (c) Fitted line plot of hardness and laser power.
Symmetry 12 00471 g008
Figure 9. (a,b) Image of pin on disc setup.
Symmetry 12 00471 g009aSymmetry 12 00471 g009b
Figure 10. Image of wear v/s sample.
Symmetry 12 00471 g010
Figure 11. (a) Surface plot of wear rate, laser power and scanning speed. (b) Fitted line plot of wear rate and laser power. (c) Fitted line plot of wear rate and scanning speed.
Symmetry 12 00471 g011
Figure 12. Desirability function plot.
Symmetry 12 00471 g012
Table 1. Chemical composition of H13 tool steel (wt. %).
ElementMnCVSiMoCrFe
H130.300.520.920.961.235.03Balance
Table 2. Low and high level of parameters.
ParametersLow LevelHigh Level
Scanning Speed(mm/min)200300
Laser Power(W)100200
Table 3. Range of input parameters.
Experiment No.Scanning Speed (mm/min)Laser Power (W)Experiment No.Scanning Speed (mm/min)Laser Power (W)
S1250150S8250150
S2300100S9250150
S3250150S10180150
S4250150S1125080
S5200100S12250220
S6300200S13200200
S7320150
Table 4. Percentage of elements before and after coating (wt. %).
ElementsCCrSiMnFeVW
Before coating4.374.661.110.5688.590.71----
After coating4.341.62----0.769.74----83.54
Table 5. Hardness testing of the coating was done by Chennai Metco Vickers’s hardness.
Sample No.S1S2S3S4S5S6S7
Hardness (HV0.2)580 ± 27696 ± 30689 ± 1637 ± 17687 ± 17760 ± 17680 ± 30
Sample no.S8S9S10S11S12S13
Hardness (HV0.2)637 ± 25698 ± 30753 ± 21811 ± 18869 ± 10516 ± 18
Table 6. ANOVA of laser power, scanning speed and hardness.
SourceDegrees of FreedomAdjusted Sum of Squares Adjusted Mean of SquaresF-Valuep-Value
Model5100,35320,070.643.100.000
Linear2100,24950,124.4107.640.000
Laser Power179,13979,139.0169.940.000
Scanning Speed121,11021,109.845.330.000
2-Way Interaction166.20.010.911
Laser Power*Scanning Speed166.20.010.911
Error73260465.7
Total12103,613
Model SummarySR-sqR-sq(adj)R-sq(pred)
21.579896.85%94.61%78.75%
Table 7. ANOVA of laser power, scanning speed and wear rate.
SourceDegrees of FreedomAdjusted Sum of SquaresAdjusted Mean of SquaresF-Valuep-Value
Model51089.96217.99222.680.000
Linear21076.35538.17656.000.000
Laser Power1880.76880.76491.650.000
Scanning Speed1195.59195.58820.350.003
2-Way Interaction19.009.0000.940.365
Laser Power*Scanning Speed19.009.0000.940.365
Error767.279.610
Total121157.23
Model SummarySR-sqR-sq(adj)R-sq(pred)
3.1000794.19%90.03%71.13%
Table 8. Correlation test.
Correlation TestCodeTypeOutputAlternate HypothesisSample Estimates
SpearmanCor.test (Hardness, Wear rate, method= “spearman”)rankS =720.98,
p-value = 3.79 × 10 −9
true rho is not equal to 0rho −0.9807163

