Article

Earthquake Vulnerability Mapping Using Different Hybrid Models

1
Department of Geography Information System (GIS), Mamaghan Branch, Islamic Azad University, Mamaghan 5375113135, Iran
2
Department of Watershed Management Engineering, Faculty in Natural Resources and Marine Science, Tarbiat Modares University, Tehran 14115-111, Iran
3
Mining Engineering, Sahand University of Technology, Sahand 51335-1996, Iran
4
Department of Geoinformatics, University of Salzburg, 5020 Salzburg, Austria
*
Author to whom correspondence should be addressed.
Symmetry 2020, 12(3), 405; https://doi.org/10.3390/sym12030405
Submission received: 8 February 2020 / Revised: 25 February 2020 / Accepted: 29 February 2020 / Published: 4 March 2020

Abstract

:
The main purpose of the present study was to mathematically integrate different decision support systems to enhance the accuracy of seismic vulnerability mapping in Sanandaj City, Iran. An earthquake is considered to be a catastrophe that poses a serious threat to human infrastructures at different scales. Factors affecting seismic vulnerability were identified in three different dimensions; social, environmental, and physical. Our computer-based modeling approach was used to create hybrid training datasets via fuzzy-multiple criteria analysis (fuzzy-MCDA) and multiple criteria decision analysis-multi-criteria evaluation (MCDA-MCE) for training the multi-criteria evaluation–logistic regression (MCE–LR) and fuzzy-logistic regression (fuzzy-LR) hybrid model. The resulting dataset was validated using the seismic relative index (SRI) method and ten damaged spots from the study area, in which the MCDA-MCE model showed higher accuracy. The hybrid learning models of MCE-LR and fuzzy-LR were implemented using both resulting datasets for seismic vulnerability mapping. Finally, the resulting seismic vulnerability maps based on each model were validation using area under curve (AUC) and frequency ratio (FR). Based on the accuracy assessment results, the MCDA-MCE hybrid model (AUC = 0.85) showed higher accuracy than the fuzzy-MCDA model (AUC = 0.80), and the MCE-LR hybrid model (AUC = 0.90) resulted in more accurate vulnerability map than the fuzzy-LR hybrid model (AUC = 0.85). The results of the present study show that the accuracy of modeling and mapping seismic vulnerability in our case study area is directly related to the accuracy of the training dataset.

Graphical Abstract

1. Introduction

During the 20th century, more than 1100 destructive earthquakes occurred in various parts of the world, resulting in the deaths of more than 1,500,000 people, of which about 90% were due to insufficient engineering and safety standards for buildings [1]. Earthquakes are natural events that can also have long-term social and economic adverse impacts on societies. The vulnerability of cities and settlement areas to natural disasters such as earthquakes is to some extent a consequence of the role of human behaviors and is strongly related to the importance of planning systems in reducing the damaging effects of natural disasters [2].
In developed countries the financial casualties of natural disasters are generally high while human casualties are low; however, in developing countries this is the reverse, indicating better planning in developed countries [3]. It is not possible to accurately control or predict natural disasters such as earthquakes, or how particular measures can help in making cities less vulnerable to a disaster event [4].
The complex nature and variable effects that disaster events can have on societies in general, and specifically cities, can partly be attributed to the variable nature of hazard distribution (especially seismic intensity), the number of people exposed, environmental vulnerability, and the degree of resistance of communities [5]. Much of the physical and economic damage caused by such incidents is often attributed to a lack of planning and weaknesses in building standards and infrastructure codes [6]. As cities are more vulnerable to catastrophes due to their high population, densities of buildings and infrastructure, ways of assessing seismic physical vulnerability in urban areas are needed [7]. With the expansion of the physical and economy of urban communities, the need to reduce risks has gradually become not only a reliable factor in controlling risk, but has also become more important as a vulnerability mitigation plan. One of the managerial measures that can play a significant role in reducing the damage caused by natural disasters is the zoning of natural hazards. In order to reduce earthquake risks, comprehensive studies are needed to identify the impacts of earthquakes in urban and rural areas and identify areas with high vulnerability [8]. Dimensions affecting the risk of cities can broadly be divided into three groups, i.e., environmental, physical and social aspects. The most important natural factors affecting earthquake hazards are fault lines, lithology, slope degree, and proximity to faults. The physical dimension is the most tangible dimension of the role of urban planning in reducing the impact of earthquakes. One of the most important physical dimensions is the urban structure and urban land use [9].
Different areas of the city are vulnerable to crises due to the type of population living there [10]. Criteria such as distance and proximity to faults, horizontal acceleration of land, number of floors in buildings, remoteness, proximity to treatment centers, building density, distance from hazardous sites and facilities, population density, building materials, and adjacent land uses have a significant impact on reducing or increasing earthquake damage [11].
To identify earthquake risk areas, various studies have been conducted in recent decades. Some studies with a strong focus on holistic risk analyses include a seismic risk assessment, e.g., the authors of [12] who introduced a new approach to seismic risk assessment and stated that in order to achieve effective risk management, it is necessary to identify social and environmental vulnerabilities in addition to determining physical and economic damages. The readiness of citizens in three New Zealand cities three years after the Christchurch earthquake was examined in [13]. Their results showed to what degree people were aware of the likelihood of danger and vulnerability in their area of residence. The whole of Japan was zoned in [14] using statistical methods and principal component analysis (PCA) based on gravity, earthquake, active fault and seismic parameters, and in [15] risk assessment using an artificial neural network (ANN) was performed, which addressed the lack of accurate validation methods which can be one of the shortcomings of these studies. Using social, environmental and physical metrics, another study performed post-earthquake hazard modeling and studied the health of individuals and the threat of poisonous insects, using a hierarchical analysis process model to weigh the criteria [16].
Many studies have also used only a limited number of criteria and have carried out a one-dimensional seismic vulnerability assessment, including: [17], which assessed the economic damages of highway bridges in Campania, Italy and has used statistical methods of updating ground motion prediction and fragility (their results show that the structural dependence of land movement is an important factor in the economic damage caused by earthquakes); [18], which used an expert system containing specialized knowledge for masonry structures in assessing the seismic vulnerability of old buildings in Sri Lanka; [19], which performed a seismic vulnerability assessment by focusing on one of the Romanian cities subject to earthquake, using multi-criteria analysis and a number of physical and social criteria, the results of which identified 385 earthquake-prone structures, as well as the decision-making process to reduce the damage. Other methods and models have been used to map natural hazard vulnerability in some current studies, including certainty factors (CF) [20], ANN [21,22], logistic regression (LR) [23], support vector machine (SVM) [24,25,26], convolutional neural network (CNN) [27], ordered weight averaging (OWA) [4], fuzzy quantifier algorithm [28], adaptive neuron-fuzzy inference system (ANFIS) [29,30], and different multiple criteria decision analysis (MCDA) models [31] such as the analytic hierarchy process (AHP) [32,33,34] and the analytical network process (ANP) [35,36]. Several models and techniques have also been integrated and combined to produce more efficient hybrid models [37,38,39]. Ghorbanzadeh et al. (2019) [22] integrated a hazard susceptibility index with a social/infrastructural vulnerability index using a geographic information system multi-criteria decision making (GIS-MCDM). Their hazard susceptibility index was generated based on mostly environmental conditioning factors, such as the slope angle and distance to streams using an ANN. They emphasized different types of land use and construction, like industrial, residential, and recreation areas for creating the infrastructural vulnerability index. The dataset of infrastructural vulnerability index was combined with the social vulnerability factors, e.g., population, age, and family information.
Given the importance of earthquake-related issues and their effects, the main purpose of this study was to develop a model for earthquake vulnerability assessment in Sanandaj City, in order to eliminate the shortcomings of previous studies, such as: not using all the criteria that affect the earthquake; modeling with individual models containing uncertainties; lack of final validation for the final models; and so on. In addition, estimation of vulnerable population and risk assessment of different areas of the city in critical times was based on different degrees such as low, moderate and high and many other goals of this study. In this study, in order to determine the vulnerability areas and to prepare earthquake susceptibility map, five models, namely OWA, fuzzy logic, AHP, ANP and logistic regression (LR), and four hybrid models, namely (ANP-AHP)-fuzzy, (ANP-AHP)-OWA, and OWA-LR, and fuzzy-LR, were used. Accordingly, the average weight of the AHP and ANP models was used to construct the OWA and fuzzy models. Also, for simplicity, we used the (ANP-AHP)-fuzzy (A-fuzzy) and (ANP-AHP)-OWA (A-OWA) hybrid models to make training sites, so that two training datasets would be created and the OWA-LR and fuzzy-LR hybrid models would be built separately. Finally, the seismic relative index (SRI) validation method was used for the initial validation of two A-fuzzy and A-OWA hybrid models and relative operating characteristic (ROC) curves for four hybrid models and frequency ratio (FR) [40] methods were used to validate the final hybrid models of fuzzy-LR (FLR) and OWA-LR (OLR).

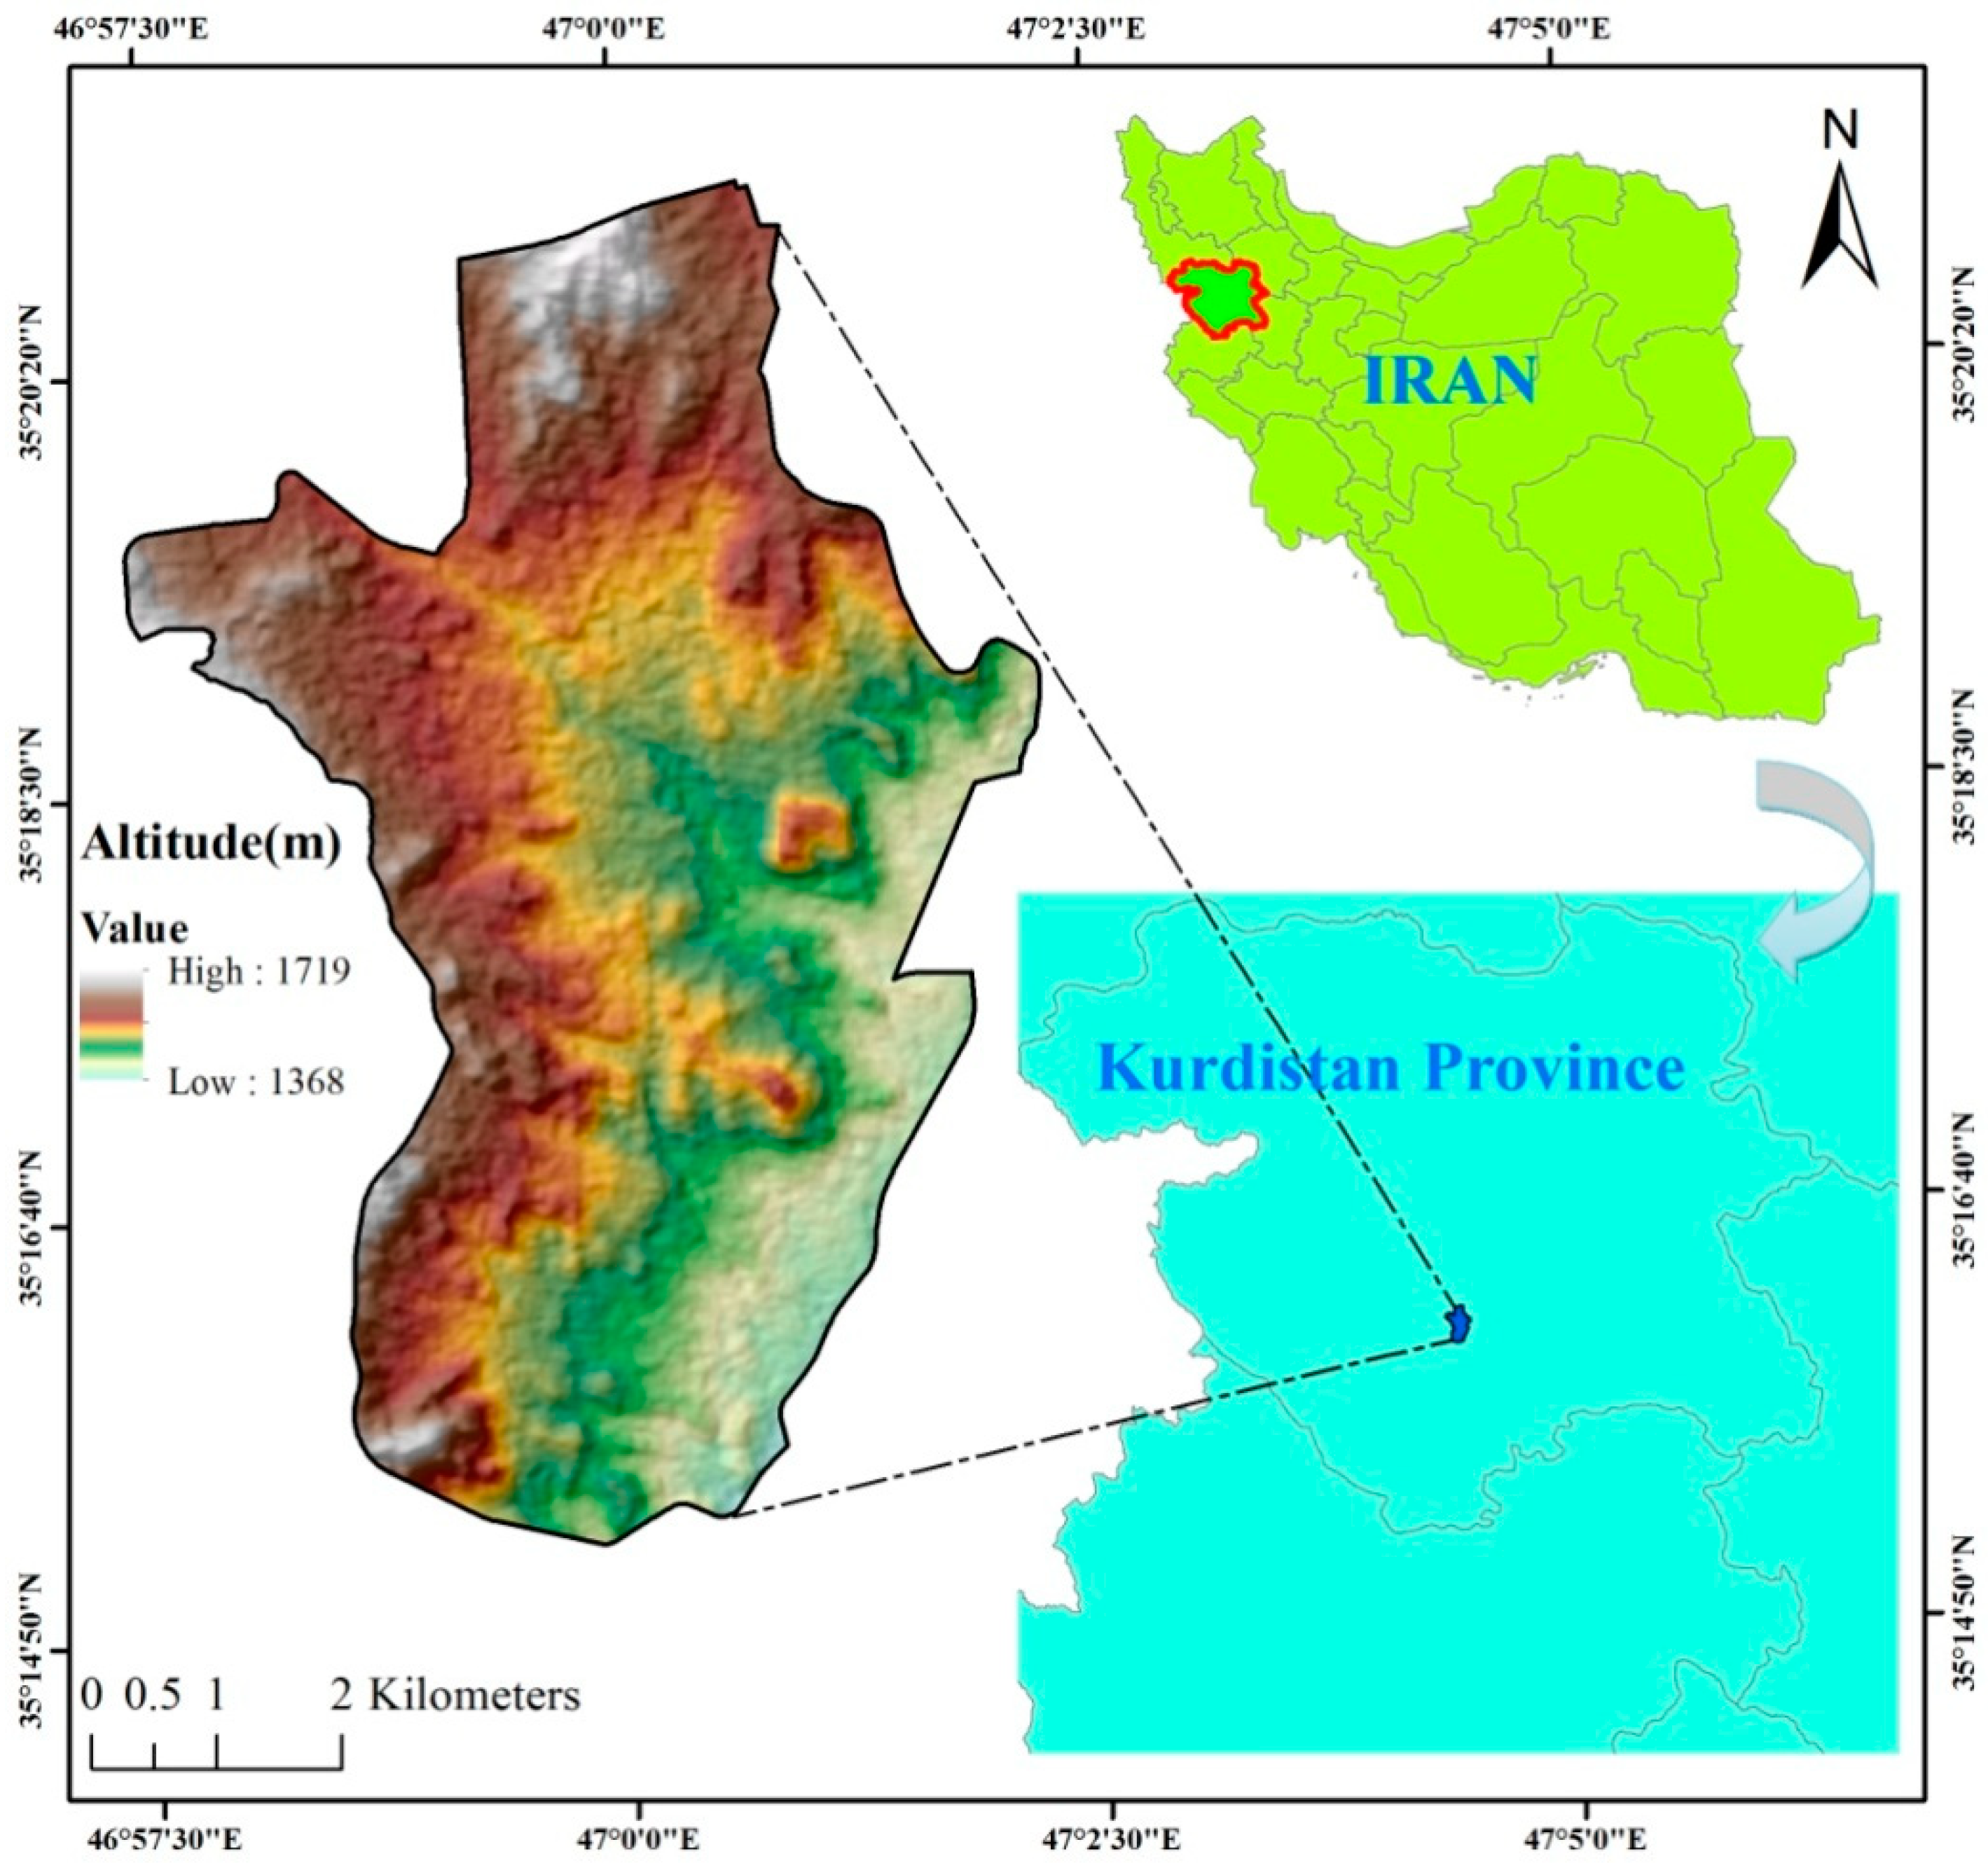
2. Overview of the Study Area
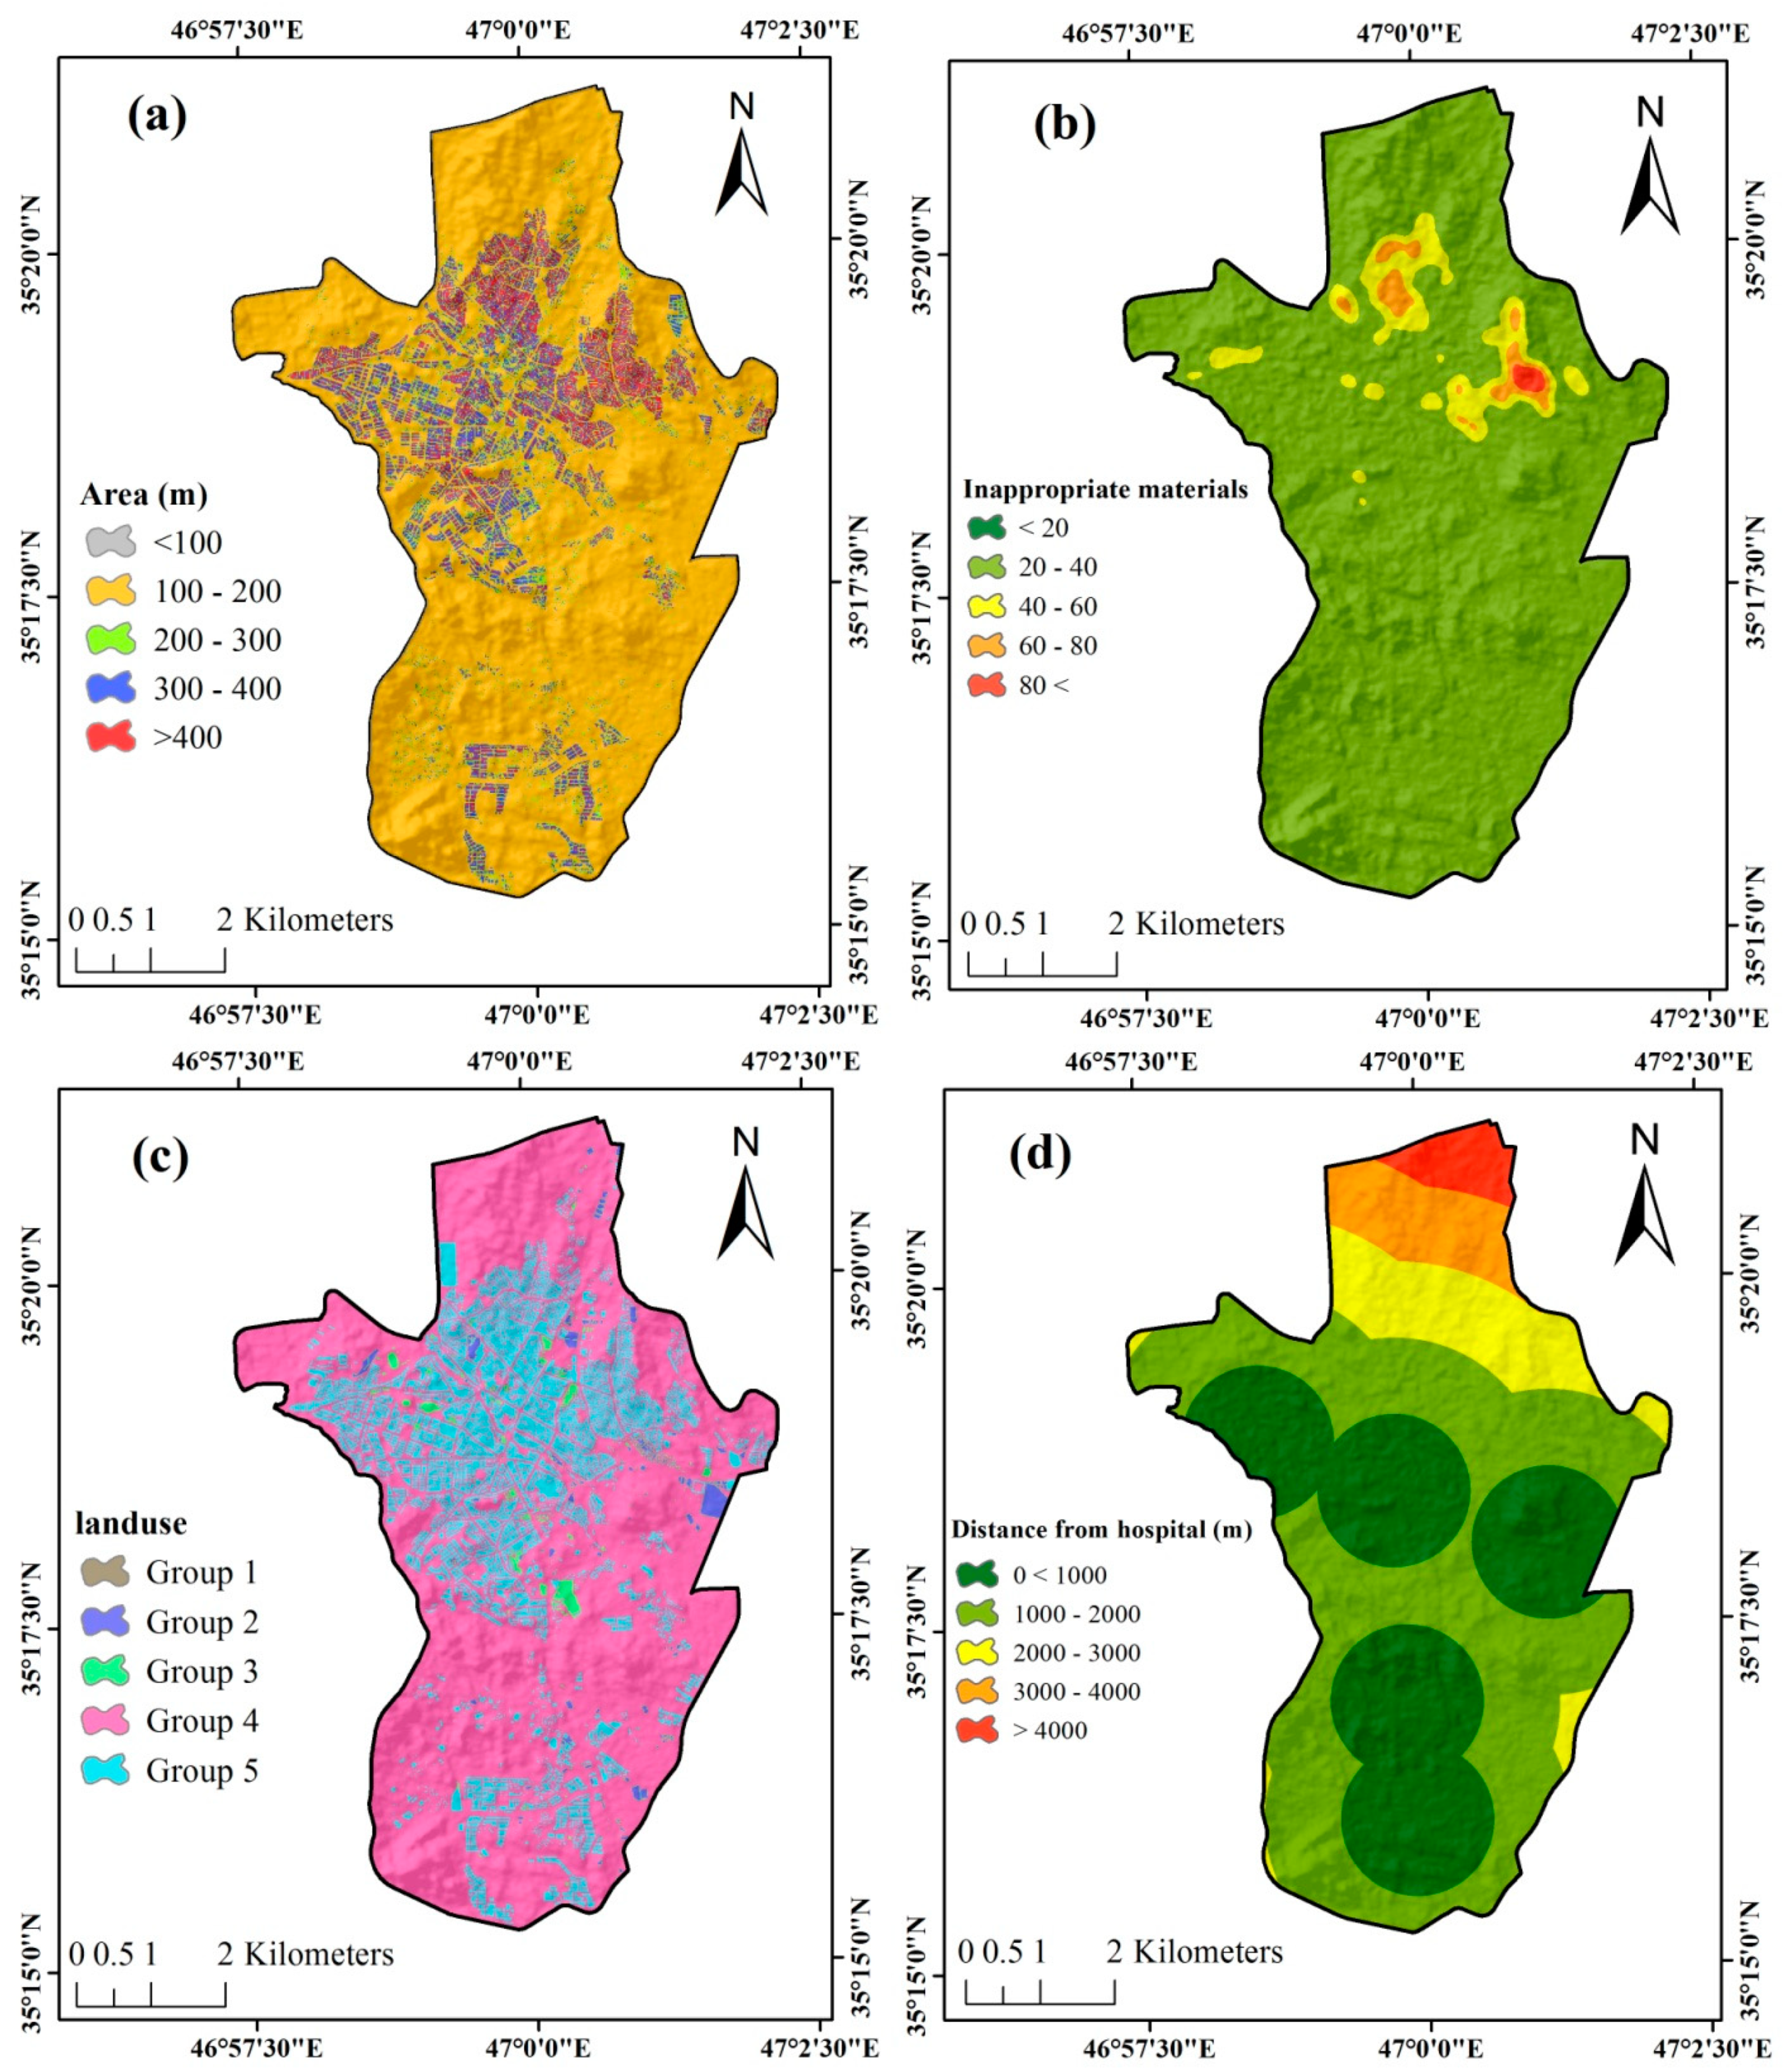
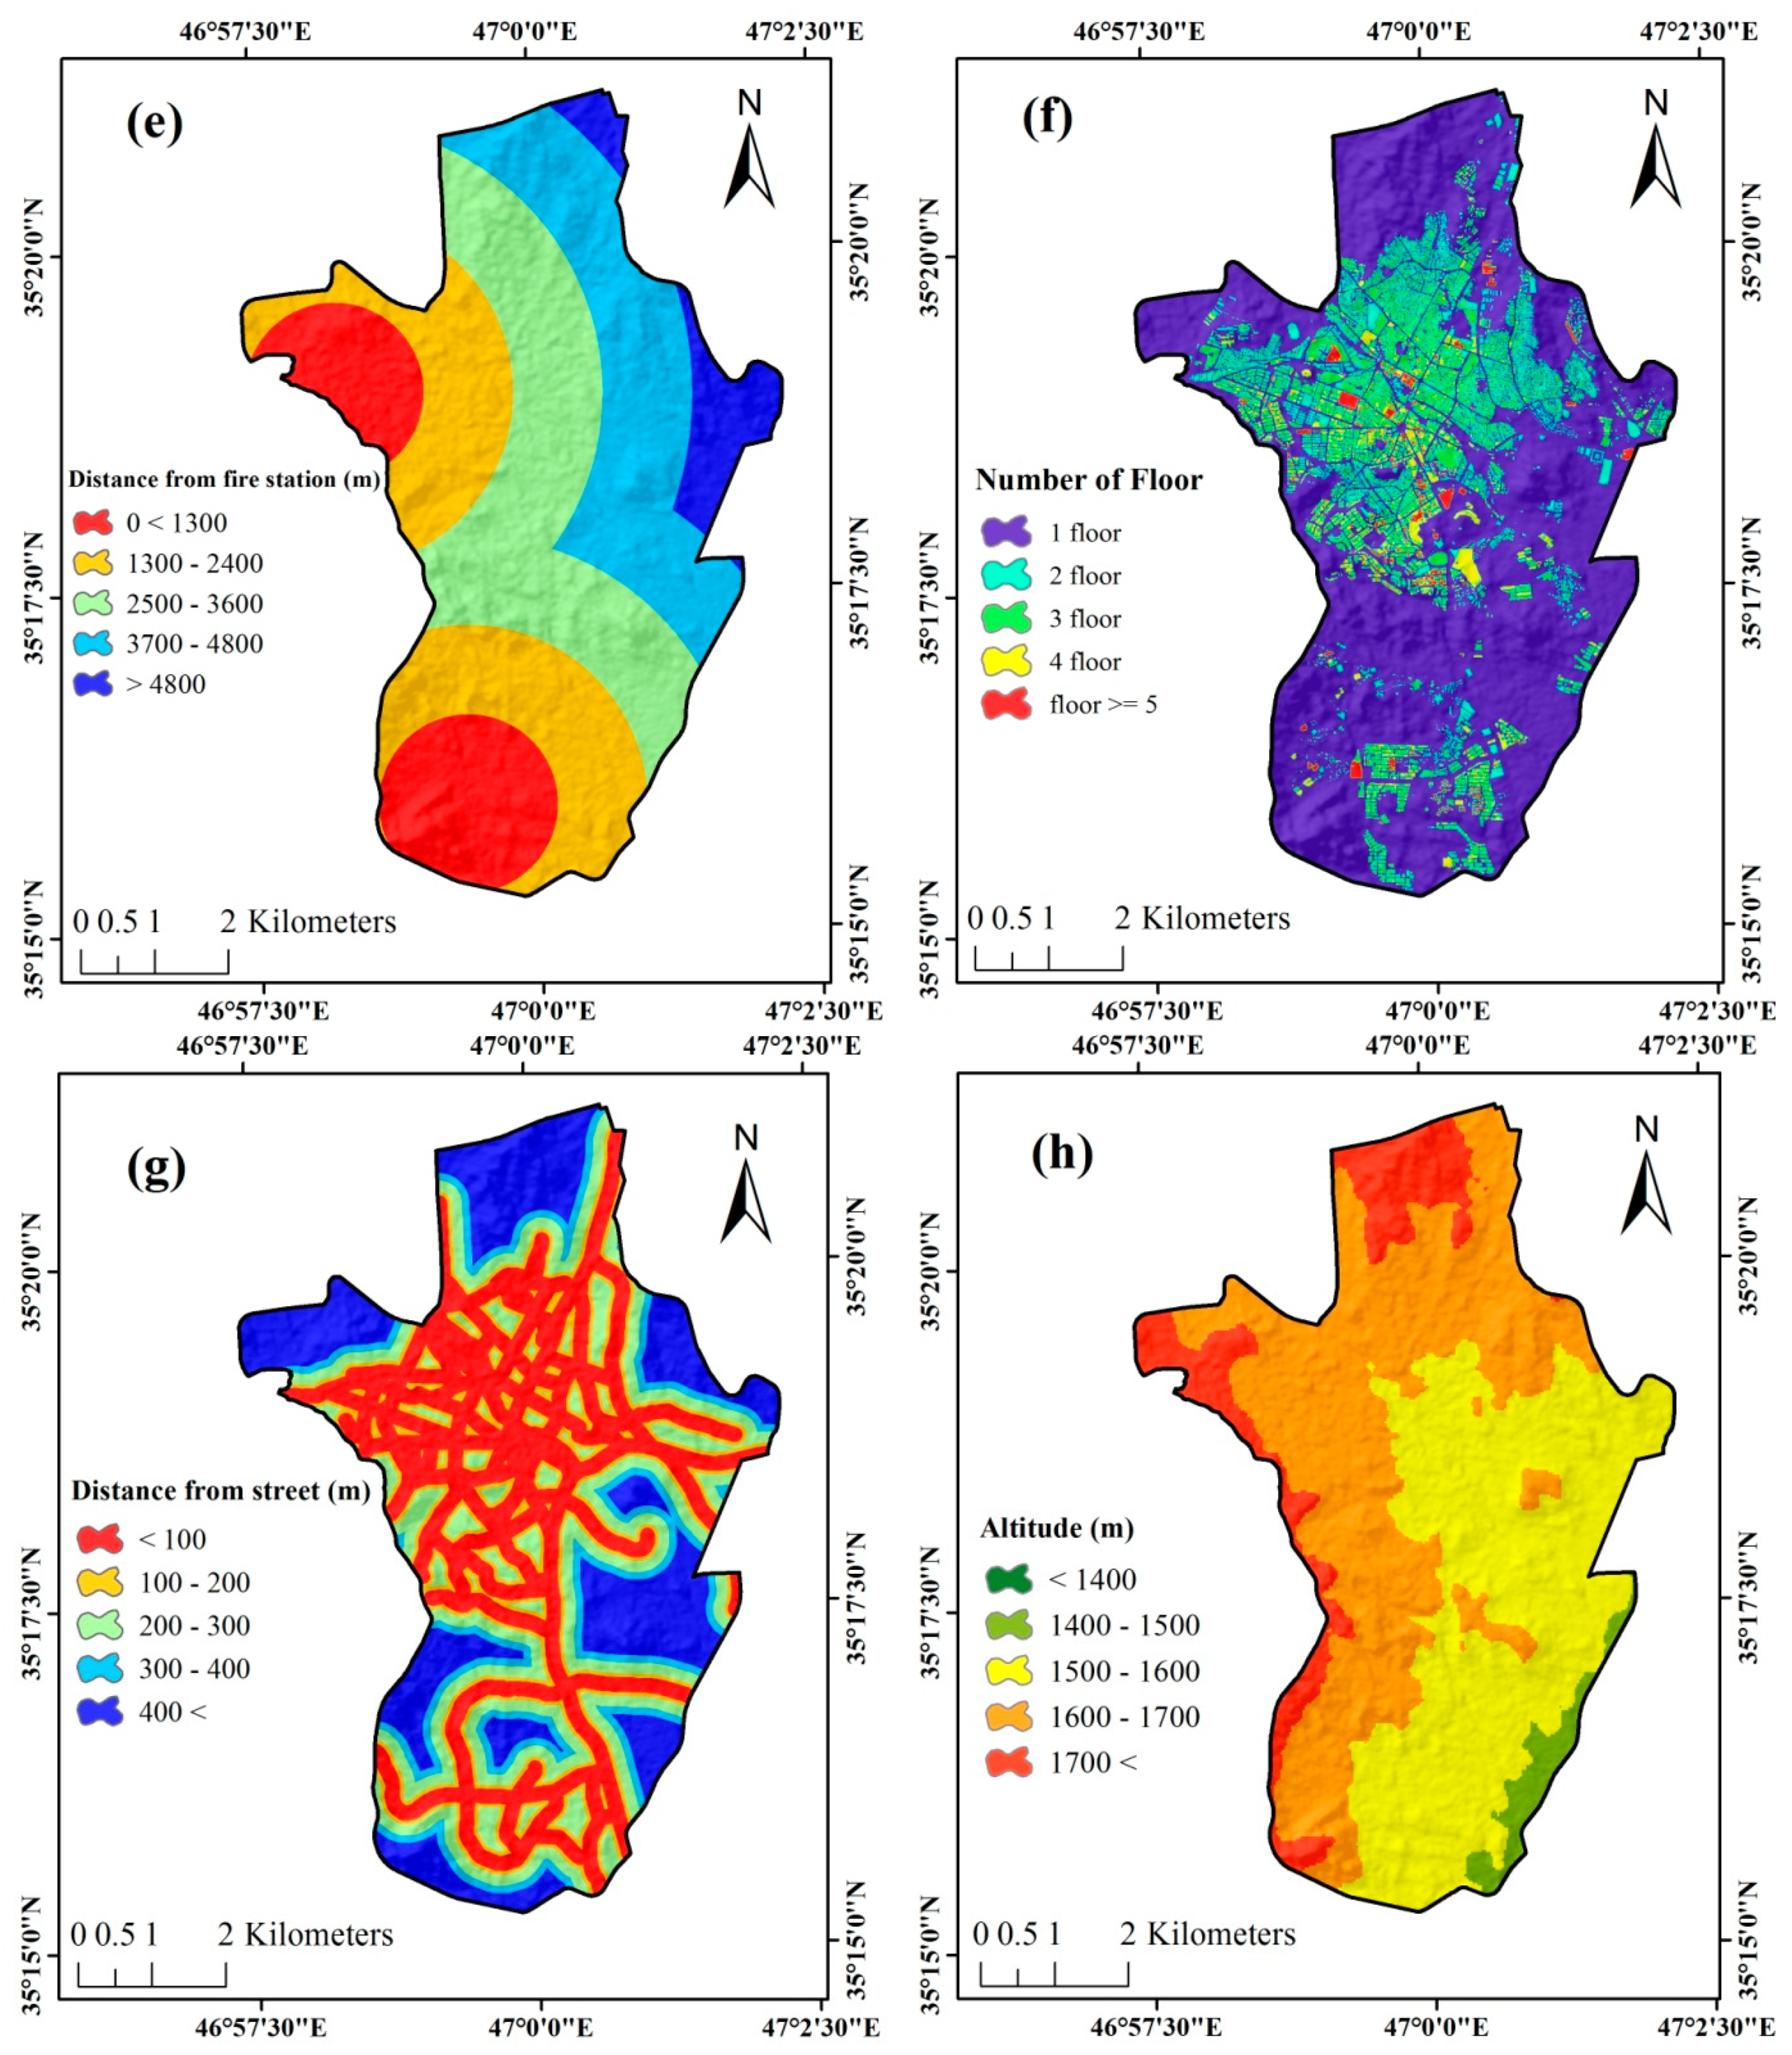
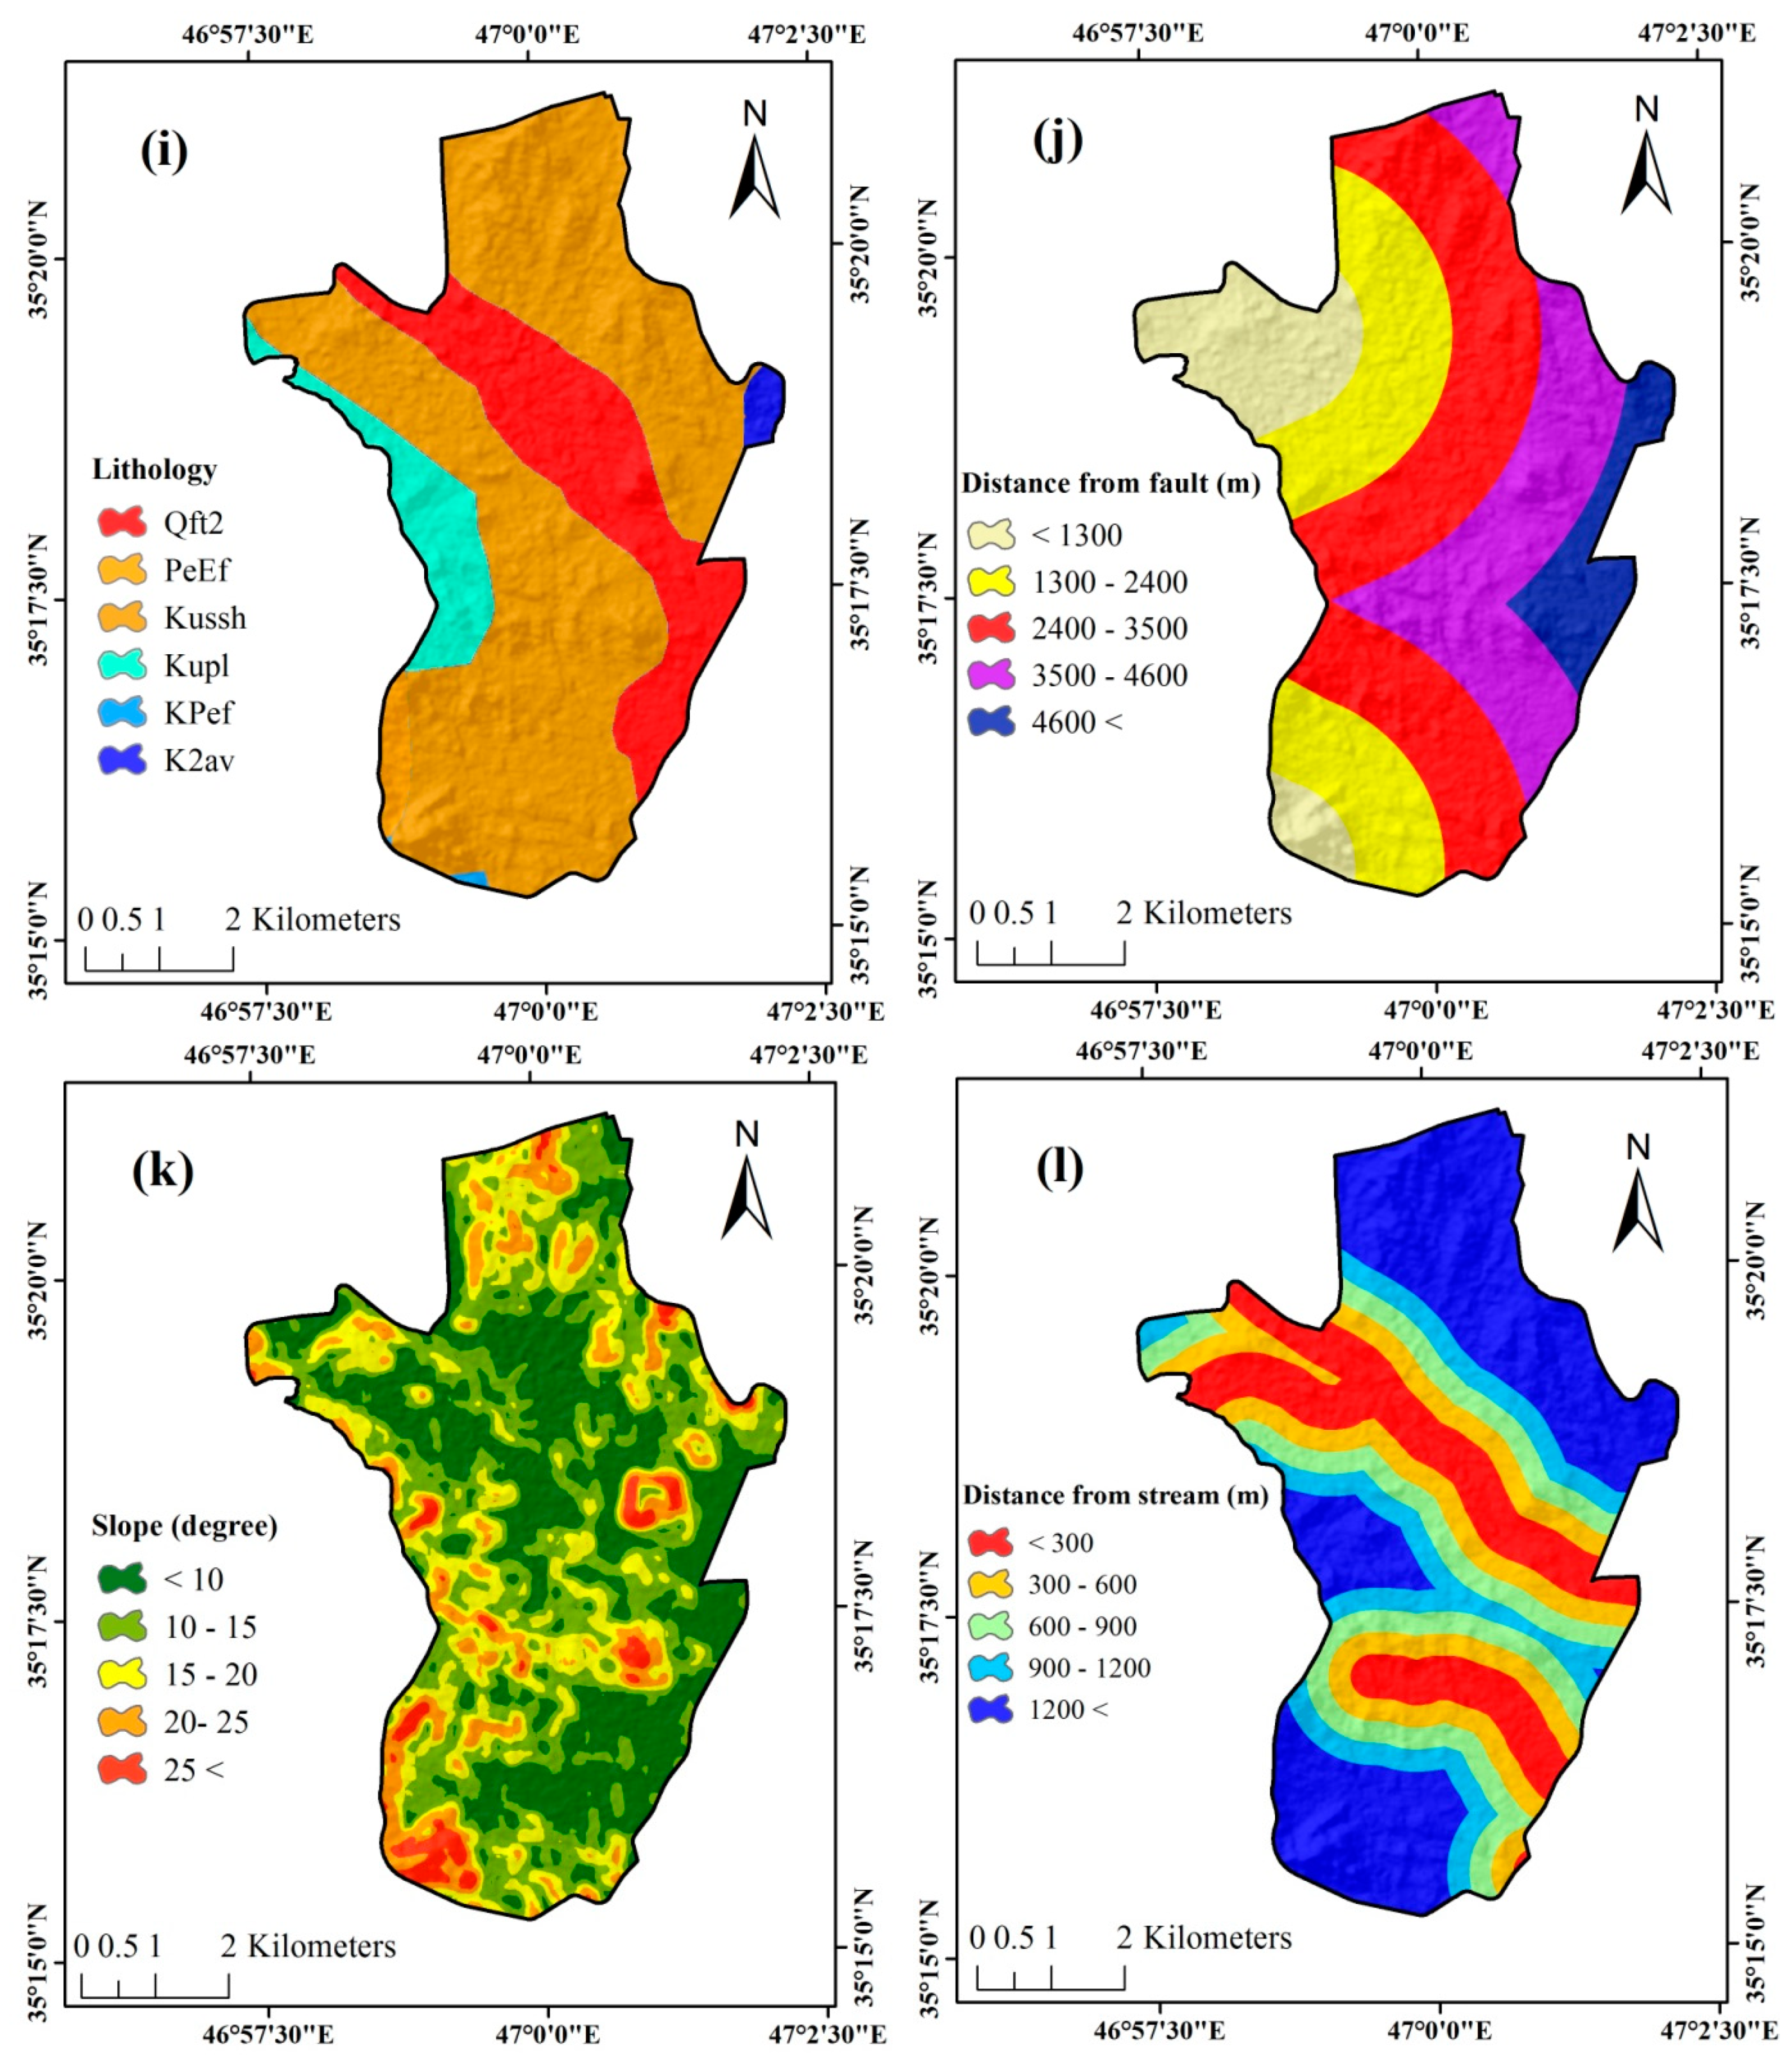
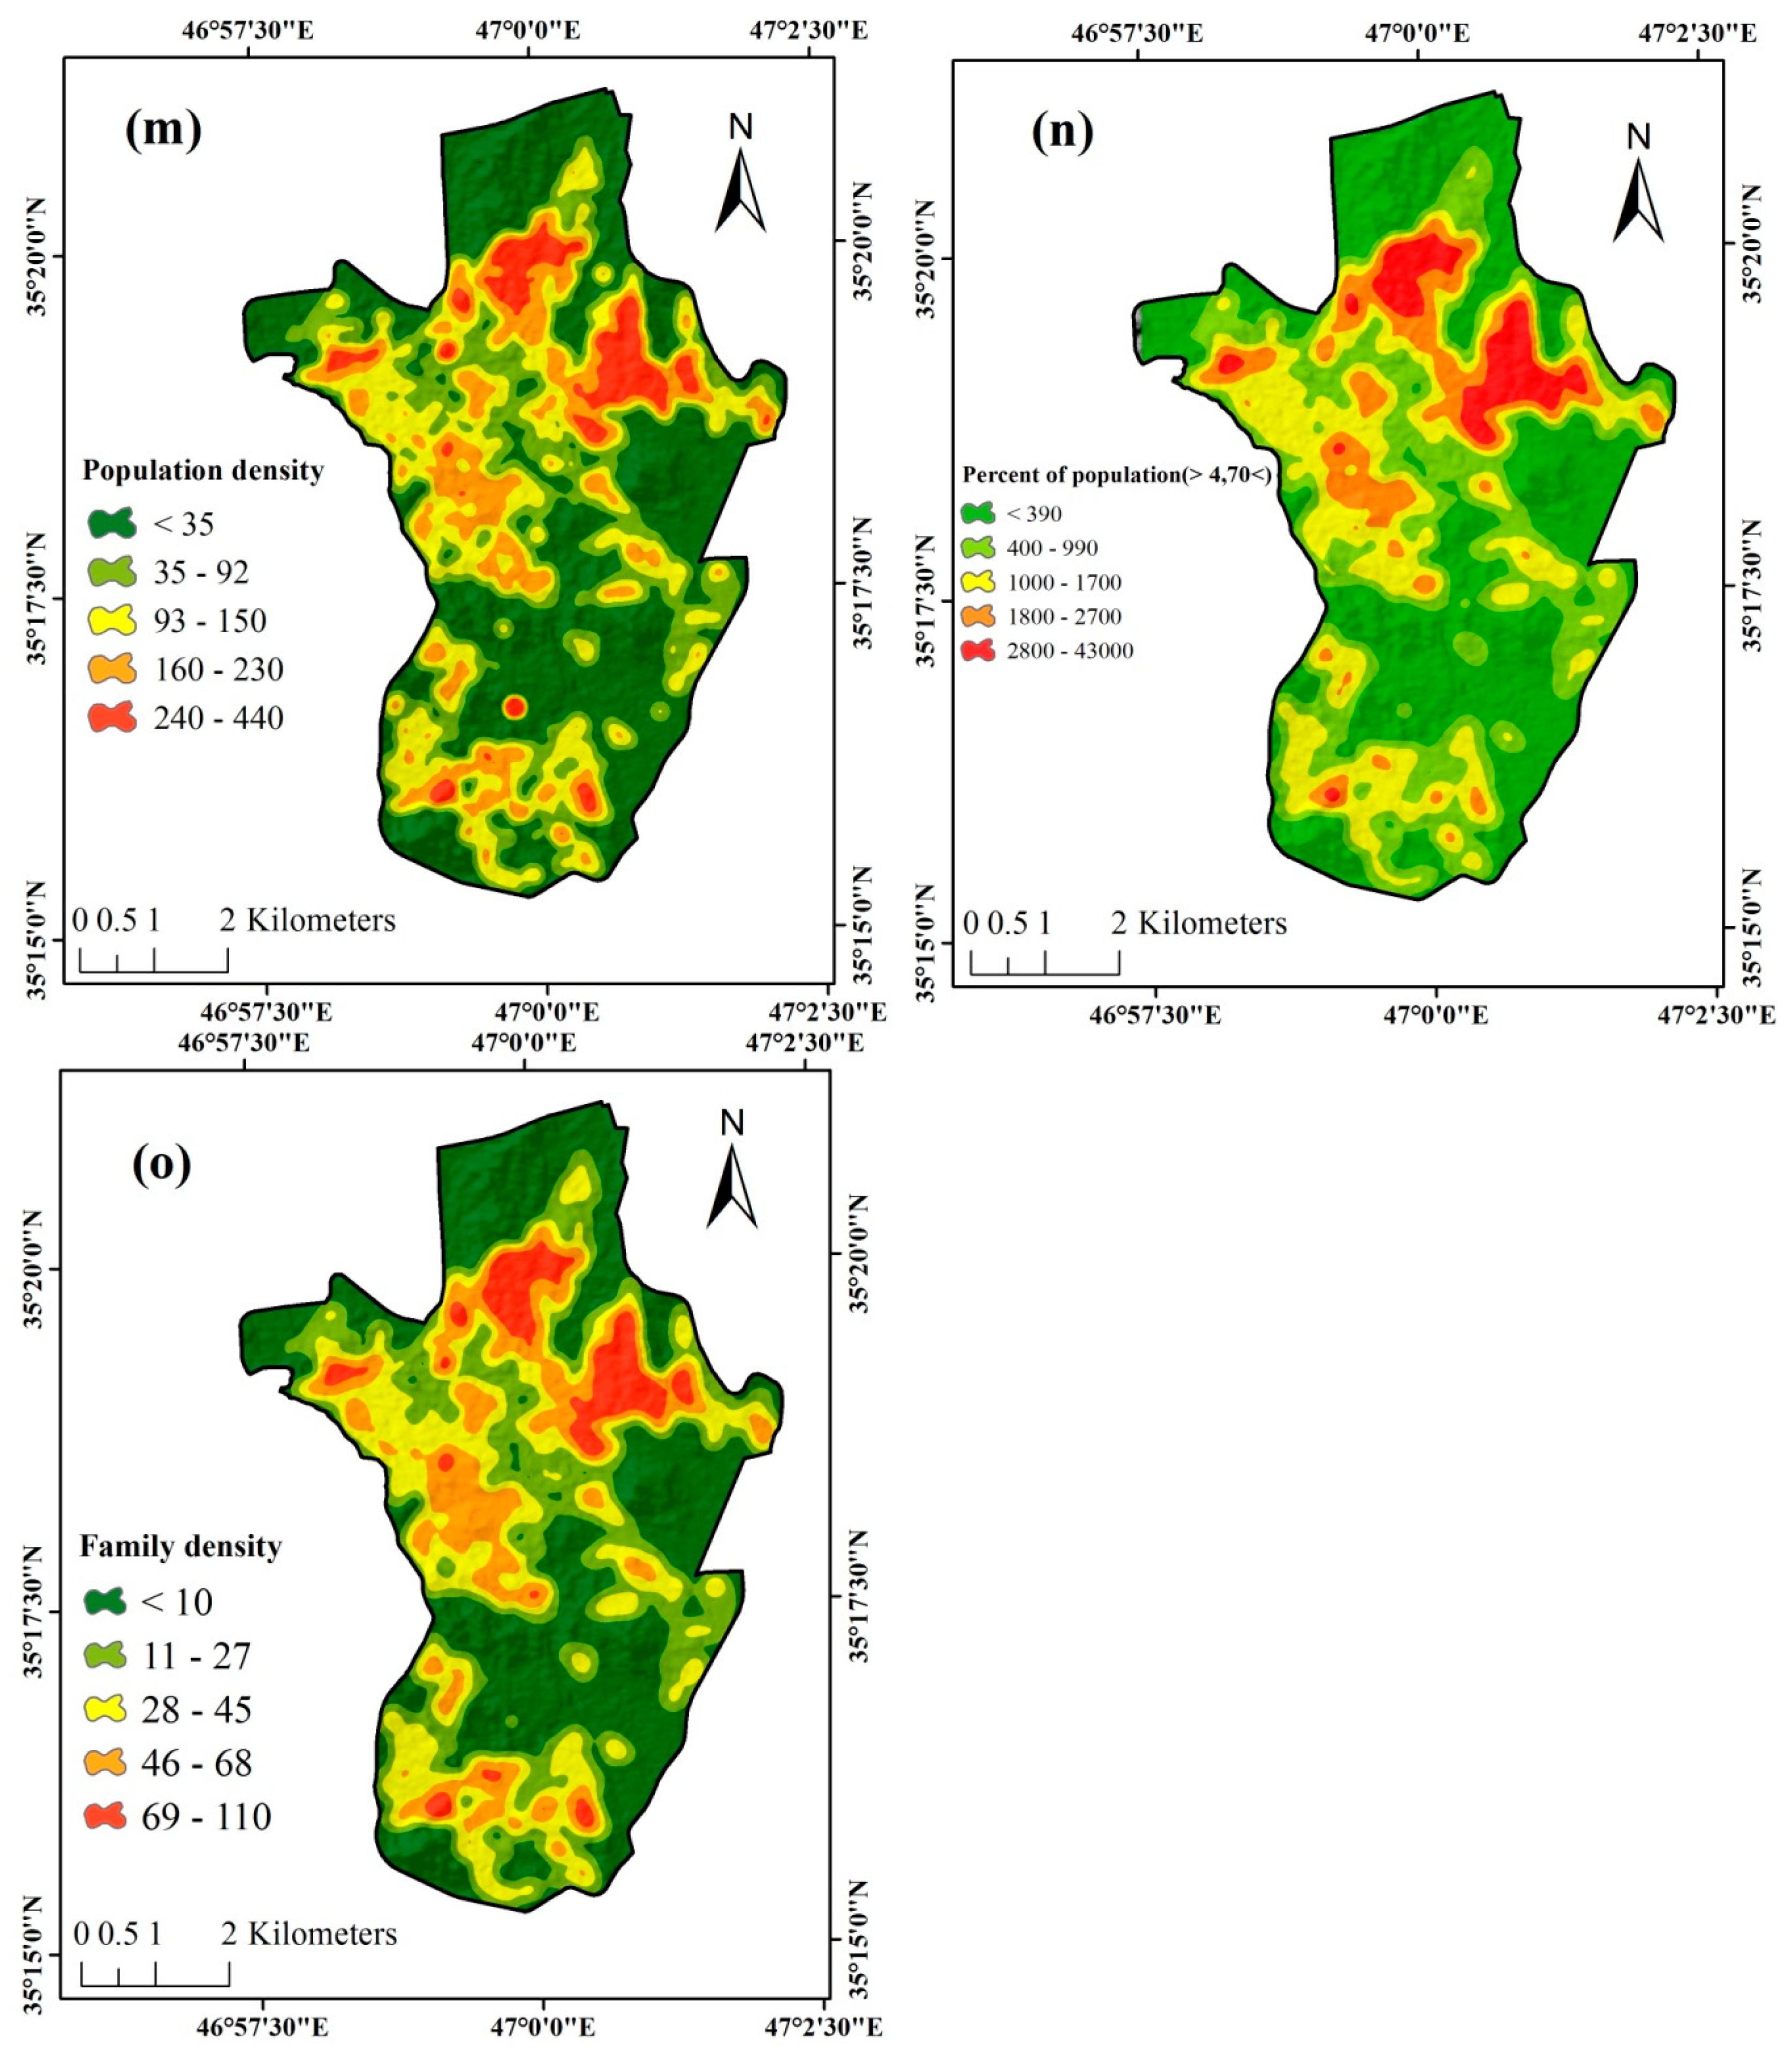
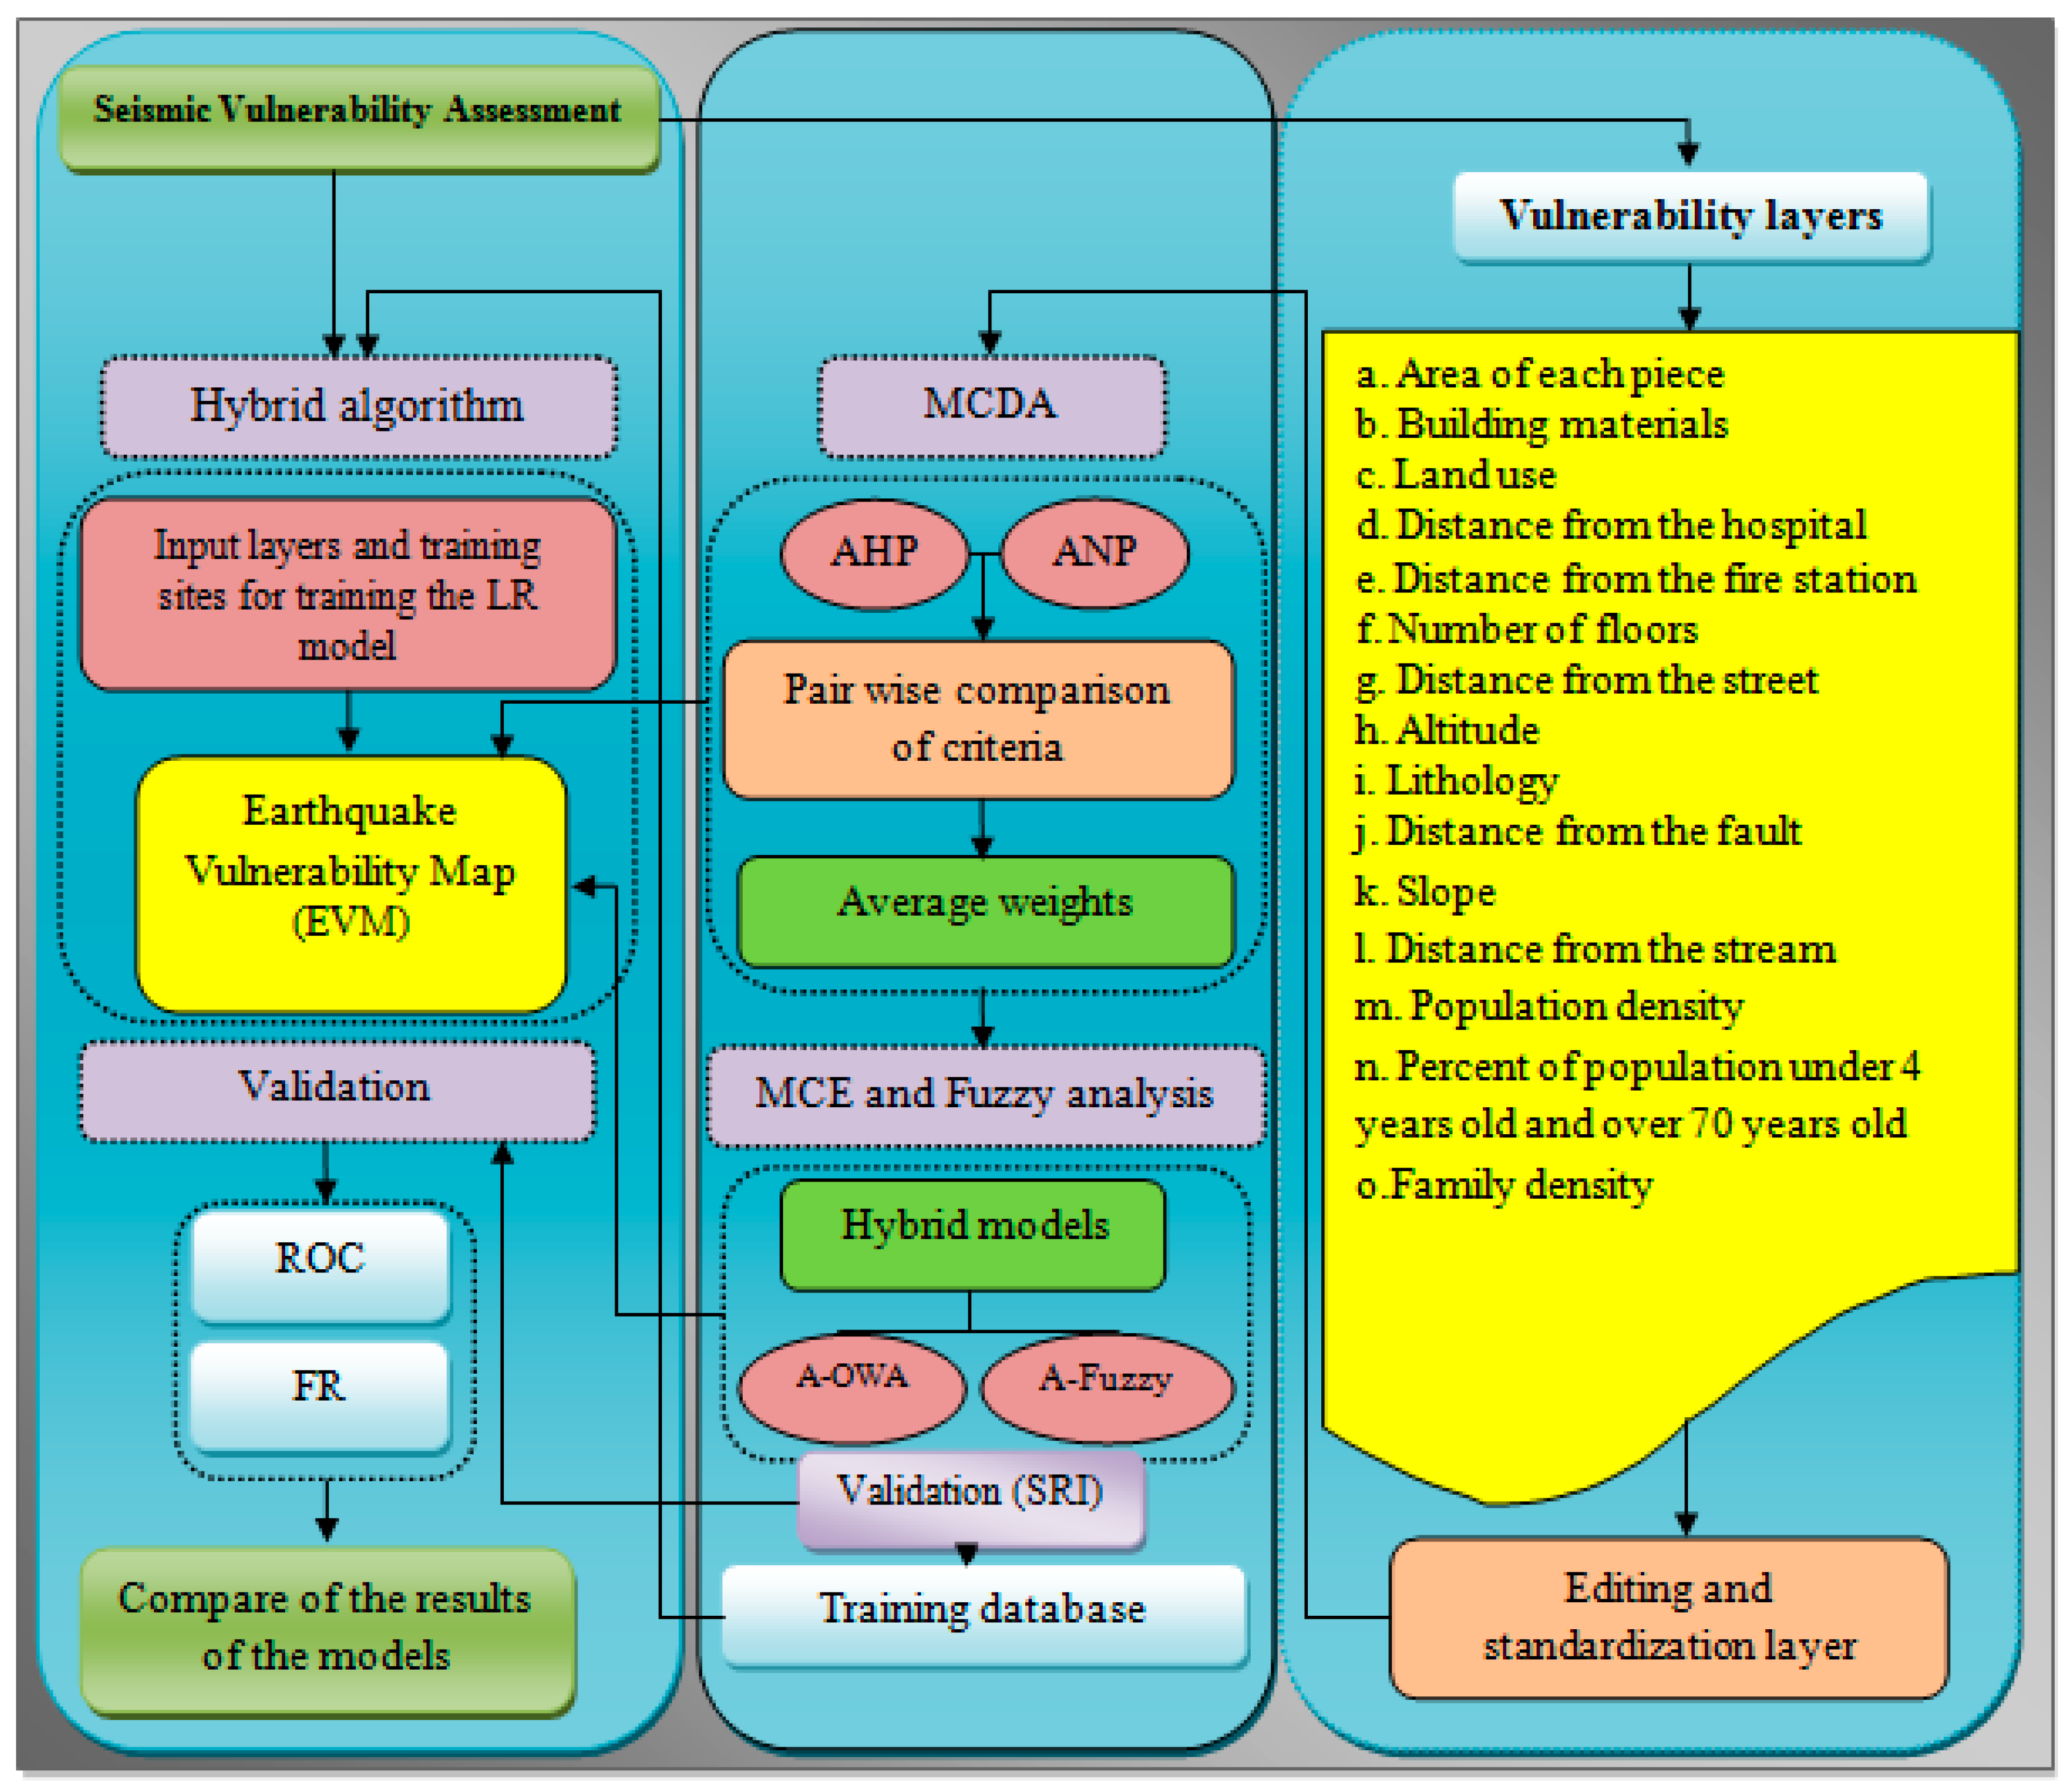
Sanandaj City is located in Kurdistan province and western Iran, which covers an area of 3033 square kilometers with 35°18′52″ N and 46°59′32″ E (Figure 1). It also has a population of 334,833 according to the 2016 census. The elevation of this city ranges from 1368 to 1720 m in the western part of Kurdistan province. Sanandaj City is surrounded by natural features between mountains and hills that are part of the Zagros Mountains. The topography of the city and the surrounding mountains have made the city naturally flat in a relatively flat valley with elevated hills at various points, with slopes ranging from 25 to 40 degrees. The main rock units of this city are dark-gray shale and sandstone. According to Iran′s active fault maps, Sanandaj City is located in a relatively quiet structure zone of Sanandaj-Sirjan, but due to the crossing of two famous faults Zagros Javan and Marivan-Sirjan, it is exposed to surrounding earthquakes (Table 1). The Zagros Mountains are formed by the movement of the Arabian plate and its impact on the Iranian and Caucasian plate, which is one of the most seismically active parts of Iran, indicating that this section has many faults and features and there is a high potential for seismic hazard in this area [41].

Data Used

The factors affecting the seismic vulnerability were prepared based on three different dimensions, which were social, environmental and physical factors, including population density, distance from the hospital, percentage of population under 4 years old and over 70 years old, building materials, distance from the fire station, distance from the street, area of each piece, land use, distance from the fault, the number of floors, distance from the stream, lithology, and altitude. The data used in this present study are shown in Figure 2.
Distance from the fault; the faults are one of the objective forms of tectonic factors whose presence or absence can be examined in relation to the seismic hazard of different areas. Fault distance plays a key role in resilience to earthquake hazards, as proximity to it causes high seismic risk and damage, and distance from it will reduce the risk and consequently higher resilience [42].
Population density; increasing population growth, population density, and poor distribution of services and infrastructure pose risks to society [43]. In recent earthquakes around the world, it can be said that most of the damage is to humans and with the increase in population it is predicted that in the future the mortality rate will be higher. The earthquake hazard coefficient in urban centers is also more complex and riskier due to urbanization without planning and development [44].
Distance from the hospital; access to health services such as hospitals play a key role in controlling post-emergency complications and providing earthquake rescue and hospitalization services. Proper and quick access to medical facilities will increase earthquake resilience [45].
The number of floors; the number of floors in a building is directly related to the earthquake vulnerability. The higher the number of floors of a building despite its quality, the greater the vulnerability. The number of floors in the building, if not in accordance with safety principles, will definitely increase the damage [46]. Even if the elevation is met with due diligence and calculations, it is difficult for the evacuation of buildings, search and rescue people. In addition, due to the large population of multi-floor buildings, it is slower to do at the time of the accident and due to the high volume of rescue operations; it is very difficult to save the lives of the occupants of high-rise buildings.
Building materials; the type of building materials is one of the most important criteria in determining the vulnerability of cities to earthquakes. Obviously, structures made of high strength and standard materials have good earthquake safety [47].
Area of each piece; from factors affecting the earthquake vulnerability in the area of buildings. The greater the area of the building, the less waste it will cause to the buildings and the surrounding passages [48].
Land use; proper deployment of land uses on the basis of urban planning principles such as proper accessibility, proper distance from the hotspots biological, safety, comfort, and utility can substantially reduce the amount of vulnerability, injury and economic damage [49]. For this reason, the type of urban land use has a significant impact on earthquake vulnerability.
Distance from the street; generally, communication networks are set. up for motor, bicycle and pedestrian traffic. In addition, escaping dangerous situations and facilitating the relief and assistance of the injured require roads and streets to pass vehicles. In most earthquake-affected areas, the number of casualties is not always due to the earthquake itself, but often due to the blockage of communications networks. Therefore, communication networks play a key role in reducing earthquake vulnerability [50].
Slope; the slope is another factor affecting the vulnerability of earthquakes to urban environments. Degradation in terrain with steep topography, especially at the top of hills and peaks, is greatly enhanced. According to construction standards, a slope of 5 to 9 percent is suitable for urbanization [42].
Lithology; lithological conditions are one of the most important environmental parameters in earthquake events. So that the more geological formation of harder minerals, the lower the earthquake wave transmission power, and the weaker the destructive power of the earthquake. Also, the gaps and cracks in the geological formations are one of the most important areas for earthquake power transfer from earthquake focal point to ground level [50]. The geological units are represented in Figure 3, and detailed corresponding descriptions are shown in Table 2.
Percentage of population under 4 years old and over 70 years old; in events such as earthquakes, everyone in the community is vulnerable, but older people and children are the most vulnerable groups in a community and more attention is needed to minimize pain and injury [51]. Children do not tolerate disruption well and older people are psychologically fragile because of their disrupted life rhythms. Elderly, in addition to the specific problems of old age, are exposed to social traits such as social incompatibility, social isolation, rejection, and lack of social support [42].
Distance from the fire station; access to the fire stations through the communication networks will speed up rescue operations and service the injured. As such, the greater the distance from the fire stations, the more likely it is to be vulnerable [52].
Distance from the stream; the presence of rivers will create post-glacial alluvial sands, making the surface vulnerable to vibration and lubrication [53]. As a result, buildings in the vicinity of the waterway network are subject to slip.
Altitude; is one of the effective parameters in earthquake vulnerability [54]. The highs and lows available in each area are highly correlated with landslide susceptibility in each area [55]. So, because of the amount of erosion and its relation to human activity, the higher the altitude of an area, the greater the seismic vulnerability.

3. Earthquake Vulnerability Mapping

This study consisted of four stages (see Figure 4). In the first part, using the expert opinions and previous studies, 15 layers were selected as conditioning layers in urban seismic vulnerability and then in order to use layers in modeling, using specific functions in ArcGIS10.4 software the layers were edited and standardized. In the second part, using the AHP and ANP models, the pairwise comparison matrices were formed. Moreover, to create hybrid models, the mean weight of AHP and ANP models was obtained, Thereby, using the weighted average, the A-fuzzy and A-OWA hybrid models were run as maps with five sensitivity classes. In addition, in order to validate the hybrid models, 10 damaged sites in Sanandaj were harvested using the Global Positioning System (GPS).
The developed model is built in accordance with the combination of ANN with hybrid models for seismic vulnerability assessment (SVA). In the third part, the proposed model is presented. The model consists of two main stages, the ANN and the A-OWA, and A-fuzzy hybrid models. Considering that the LR model in the field of environmental hazards zoning has important features such as accuracy and fast computation ability [56], these algorithms were considered for this part of our methodology. To implement the LR model, we need standardized factors and training data. For this reason, two training databases were created through the combined models of A-fuzzy and A-OWA. Each training database consists of 150 points that were randomly selected from five sensitivity classes (30 points from each sensitivity class). After training the LR model, the fuzzy-LR and OWA-LR hybrid models were validated using the harvested points.

3.1. Background of the Multi-Criteria Decision and Statistical Models Used

3.1.1. Fuzzy Logic

Fuzzy logic is a multi-valued logic, meaning its parameters and variables can take into account all values between the two numbers in addition to considering 0 or 1 [57]. The attribution of each member of the reference set to a specific subset member is not definitive; that is, it cannot be stated with certainty whether the member belongs to this set. This uncertainty assessment is done by assigning a number between 0 and 1 to this member. If this number is equal to 0, it can be stated with certainty that the target member does not belong to the set, and if this number is 1 it can also be claimed that the target member belongs to that set. In this way, the subsets of a fuzzy set can be represented by assigning the numbers 0 and 1 to each set member [58]. The application of fuzzy logic includes five main steps:
Fuzzification: In the fuzzification step, the inputs are converted to fuzzy information. In fact, the numbers and information that need to be processed will become fuzzy sets and numbers.
i.
Rules Base: This section covers all the rules and conditions that are specified “if … then” by an expert to be able to control the decisions of a “decision system”.
ii.
Fuzzy inference: In this section, the degree of fuzzy inputs′ compliance with the basic rules is determined. Thus, based on the percentage of adaptation, different decisions are produced as a result of fuzzy inference.
iii.
Aggregation: Because decisions are made on the basis of testing all the rules in parallel, as a result, all the rules calculated by the above method are brought together and a fuzzy set of output is created.
iv.
Defuzzification: In the last step, the results of fuzzy inference, which are fuzzy sets, are converted into quantitative data and information. A variety of methods are used for defuzzification, but the COG (relation 1) method provided by the Center of Gravity (COG) is most used [59].
C O G ( A ) =   a b μ A ( x ) x d x a b μ A ( x ) d x
where μ A   ( x ) is the aggregate membership function, x is the crisp output of the fuzzy system and [a, b] is the interval in which the aggregated fuzzy set A is defined. The fuzzy operators are represented in Table 3.
The general form of a fuzzy set is as follows:
A =   { ( μ A ( x i ) / x i ) | x i X , i =   1 , , n x }
There are several operators for fuzzy logic [60,61], presented in the Table 3.

3.1.2. Analytical Hierarchical Process (AHP)

The AHP is considered to be one of the most common decision-making methods [62]. This method is one of the most commonly used methods for ranking and determining the importance of factors that prioritize each criterion using pairwise comparisons of options [63]. If there are too many options, it is difficult to form a matrix of paired comparisons. Given that all comparisons are made in pairs, decision-makers are able to compare verbal judgments with each other; thereby, element A is compared to element B, the decision-makers will say that the importance of element A over B will be one of the modes in Table 4 [64]. For example, if the three alternatives a, b, and c are compared to criteria a, b, and c, then the alternatives are initially compared to the three criteria a, b, and c, and the weight of each alternative obtained given those three criteria, the self-criteria are compared, and finally, in the weighted linear combination, the final weight of the alternatives will be calculated [65].
After the criteria have been prioritized, the consistency ratio (CR) (relation) of these criteria should be calculated and the value of the consistency ratio should be less than 0.1. The consistency ratio is obtained by dividing the consistency index (CI) by the average random consistency index (RI). The RI was compiled by Saaty in the year 1991 [67] for various sizes and the CI is calculated by the following Equation.
C R   =   C I R I
C I   =   μ M a x   n n 1
where n is the number of criteria, and μ M a x is the maximum 8 value. Weights should be corrected if the CR value exceeds 0.1 [68]. Although, in the AHP method, the experts and decision-makers are asked to compare the factors considering their experience and intellectual skills, it may not fully reproduce the experts thinking style. Moreover, the weightings of the AHP method is not very reliable; and the associated uncertainty by comparison, evaluation, and development according to the preference of experts and decision-makers have a substantial influence on AHP weightings [69].

3.1.3. Analytic Network Process (ANP)

The ANP is a multi-criteria decision-making technique and falls into the category of compensatory models, like AHP [36]. This model is designed based on the hierarchical analysis process and the network has replaced the hierarchy [69]. One of the assumptions of the hierarchical analysis process is that the higher sections and branches of the hierarchy are independent of the lower sections and levels [70]. In many decisions, however, decision elements cannot be modeled hierarchically and independently of each other. Therefore, to solve such a problem, they combine different elements. Saaty suggests using the network analysis process technique. In the hierarchical analysis process, the relationships between different levels of decision making are considered one-sided [70,71].
The main advantage of this approach is that the different elements are measured based on their relationships and not hierarchically, and given the complexity of the different issues, better results can be obtained. Although the analytic network process also employs a pairwise comparative measurement scale, like the hierarchical analysis process it does not impose an absolutely hierarchical structure on the problem, but it does model the decision problem with Applying a system perspective with feedback [72]. Since the ANP is also based on the pairwise comparisons that are filled by experts and decision-makers, the associated uncertainty can also threaten the final weightings of this method like the AHP. To deal with the uncertainty problems and enhance the accuracy of results, several studies have integrated different techniques and approaches with AHP and ANP models, such as the interval-AHP decision support model [62] and the integration of fuzzy theory with MCDAs [57]. The integration of fuzzy theory with AHP and ANP methods, compared to use only the AHP and ANP methods, have greater reliability and certainty.

3.1.4. Ordered Weight Average (OWA)

There are different weight composition methods for calculating the final weight in multi-criteria decision-making methods, one of the most important of which is the OWA. This method, first proposed by Yager [73], combines weighting with prioritization of evaluation criteria, and in addition to weighting the criteria, prioritizing them. Prioritizing weights allows for direct control of criteria. The main feature of this method is its reclassification. The coefficients of weights are not directly applied to the criteria but are applied to the prioritized position of the criteria values for the chosen alternative, for example, the weight of the first-priority evaluation criterion is assigned to the one that has the most value and highest amount among those criteria [74].
The OWA operator depicts n dimension space to one dimension [75]. There are three basic operations (or integration functions) based on the bellman model for fuzzy set integration operations: fuzzy set sharing operators, fuzzy set community operators, and average operators [73].
The OWA operator contains the fuzzy min and max, where the max operator in line with the logical OR and the minimum operator in line with the logical AND [74].
F   ( X i j )   =   ( X 1 i Y 1 i + X 2 i Y 2 i + + X n i + Y n i )
In the equation, X is the values of the criteria for the alternative i and Y is the weight of these criteria.

3.1.5. Logistic Regression (LR)

LR is one of the predictive statistical methods that predict the trend of the dependent variable using independent variables. This model can be considered as a generalized linear model that uses the logit function as the link function and its error follows the polynomial distribution. To be two-sided, it is possible for a random event to occur in two situations. This model considers several physical parameters that may influence the probability of a flood occurring. One of the advantages of logistic regression is that the data do not need to be normal distribution and the effective factors can be continuous or discrete [76]. Therefore, the main purpose of logistic regression is to determine a suitable model for defining the relationship between the dependent variable and the factors influencing the flood to generate coefficients for each variable. The logistic regression for predicting the presence or absence of a phenomenon at 0 and 1, depends on the values of the predictor variables [77]. In general, the relationship between the event and its dependence on several variables is expressed as follows:
P   ( e v e n t )   =   e z ( 1 +   e z )
where P (event) is the probability of a flood occurring. The probability of occurrence varies from 0 to 1 as the value of Z varies from − to + . Z is a function of the linear combination function of the effective factors that represent the linear relationship and b0 is the width of the model′s origin.
Z   =   b 0 +   b 1 X 1 +   b 2 X 2 + +   b n X n
The general equation of logistic regression is as follows:
Y   =   l o g i t   ( p )   =   l n ( p 1 p )   =   b 0 +   b 1 X 1 +   b 2 X 2 + +   b n X n
where Y is the probability of flood occurrence, bn (i = 0, 1, …, n) estimation coefficients of the sample data, n number of independent variables, and Xn (i = 0, 1, …, n) independent variables. The positive coefficients indicate the correlation between the effective factors and the dependent variable, and the negative coefficients indicate the effect of the opposite. Because the relationship between the independent variables and the probability of occurrence is nonlinear, the iterative algorithm is necessary for parameter estimation [78].

3.2. Validation and Accuracy Assessment

3.2.1. Relative Operating Characteristic (ROC)

The accuracy of the final map of earthquake susceptibility was evaluated using a ROC. The ROC is a relative factor that shows the position of a class compared to the actual map using the Boolean method and specifies the likelihood of that class [79]. In this method, the area under the curve (AUC) is a graph whose vertical axis represents the actual positive percentage and the horizontal axis represents the false positive percentage [80]. The AUC represents the area under the ROC curve, and the larger the value, the more efficient the final classification performance is evaluated. Normally, the value of AUC has a range of 0.5–1. The higher value of AUC indicates the better prediction capacity of the models. If the AUC value is approximate 1, the accuracy of the prediction model is very high.

3.2.2. Seismic Relative Index (SRI)

The seismic relative index (SRI) has been used in this study as a novel approach to validate seismic vulnerability assessment results. Using this index and examining the seismic vulnerability point distribution in sensitivity classes, the accuracy of the hybrid models implemented in this study will be measured. This index can be calculated by relation (9):
R I   =   100 ( p i P i ) / ( p i P i )
In relation to (9), p i is the percentage of existing pixels and P i is the percentage of seismic vulnerability points in each sensitivity class.

3.2.3. Frequency Ratio (FR)

The FR is one of the evaluation techniques to determine the spatial relationship between data and classes of different factors. Based on the numerical values of FR, the percentage of data in each class i of factor j represents a correlation with the rate of occurrence [81]. The FR index is calculated using the values of each class as follows:
FR = ( L i Kji pix ) ( li   Kji * L i )
where Li is the point of occurrence in each class of the Kji criterion, ∑pix is the total number of pixels in the range, li is the pixel values in each class of the Kji criterion, and ∑Li is the total number of occurrence points in the studied range.

4. Experiment Results and Analysis

In order to construct two A-MCE and A-fuzzy hybrid models, the average weight of ANP and AHP decision models was calculated, based on which the sensitivity classes were ranked in each layer (Table 5). The factors used in the study came from in three main groups, physical, environmental, and social, and were classified based on the natural break method.
Given that there were differences in the calculations of the weights of the factors in the two decision-making models AHP and ANP for pairwise comparisons, the weighted means were used. The fuzzy hybrid model was mapped using layers fuzzy with values from 0 to 1 and applying combined weights obtained by the MCDA technique in ArcGIS software. Then, in order to prepare the A-OWA hybrid map by standardizing the layers based on the MAX and MIN method, the A-OWA hybrid model was implemented by applying hybrid weights in the IDRISI software.
Based on the results of Table 5, the combined weight calculated for effective layers is based on the weighted normalized multi-criteria decision analysis (MCDA) method. Also, population density and distance from fault factors, with values of 0.088 and 0.087 respectively, had the highest weight, and altitude had the lowest weight in the study with 0.039.

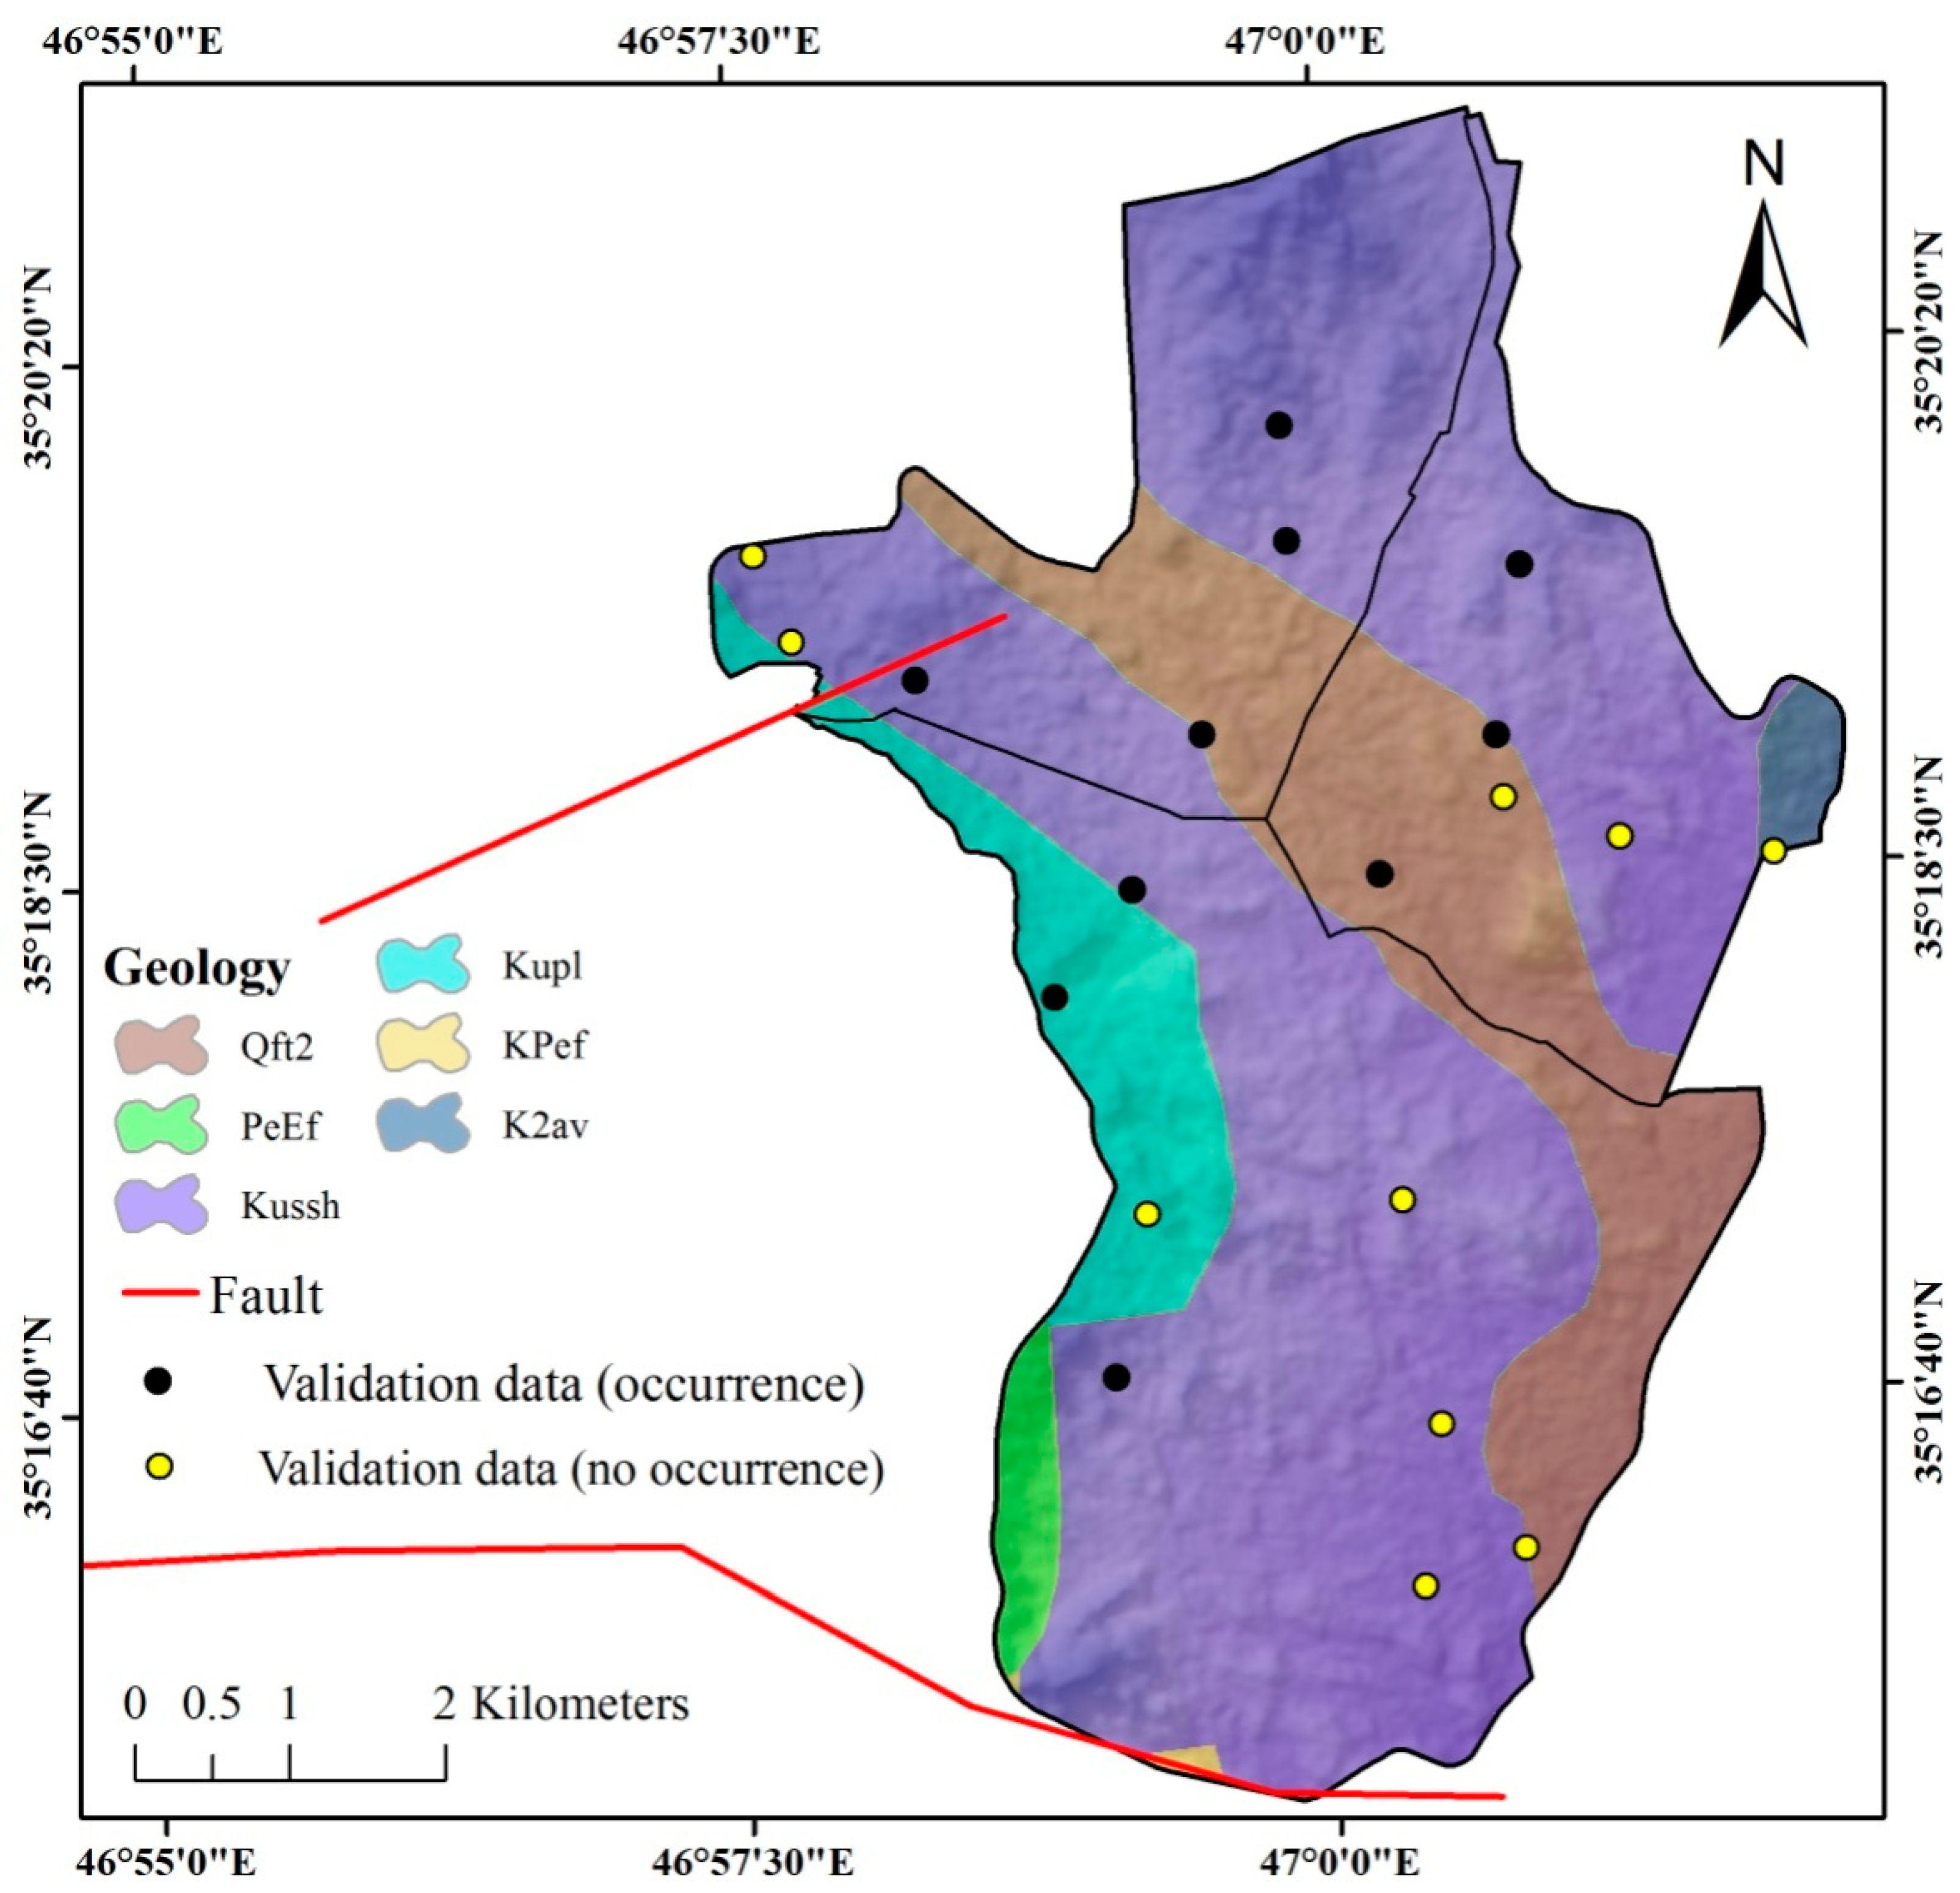
Selection of Training Sites Used in Modeling

The outputs of the hybrid models A-OWA and A-fuzzy are maps with five vulnerability classes very low, low, moderate, high, and very high (see Figure 5). Providing training data plays an important role in the accuracy of the vulnerability map. In fact, the most important step in training artificial neural networks involves collecting, selecting and processing training data. Therefore, in order to comply with this principle, it is necessary to select the appropriate data at the training stage. Due to the lack of available earthquake records in the study area and insufficient sampling, the proposed method in this study employs a new training technique. As described in the preceding section, the purpose of using the AHP-ANP hybrid weight and the A-OWA and A-fuzzy hybrid models in this study is to create two suitable training databases for training the LR neural network. At this point, two training databases are created through two hybrid models. So, in each of the A-OWA and A-fuzzy base maps, 150 training points were randomly selected as final training sites (see Figure 5). In order to compare the accuracy of the results of the two hybrid models, 10 points of earthquake damage from 12 November 2017 (Sar-e Pol Zahab earthquake) and 26 August, 2018 (Tazeh Abad earthquake) was recorded with GPS during field surveys in the study area. The accuracy of the sensitivity results of the models was then measured using the seismic relative index (Table 6).
Based on the numerical values in Figure 6 and Table 6 for the R-index using 10 occurrence points, the percentage of dispersal of these points in the very low to very high vulnerability class for each class of A-OWA and A-fuzzy models was 86% and 84% respectively. The SRI result demonstrates the high accuracy of the A-OWA hybrid model in showing seismic vulnerability sensitivity classes based on available points. This validation step was performed to test the training databases.

5. Results

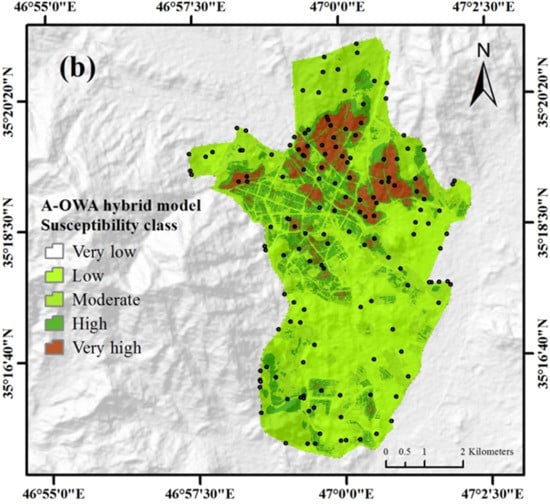
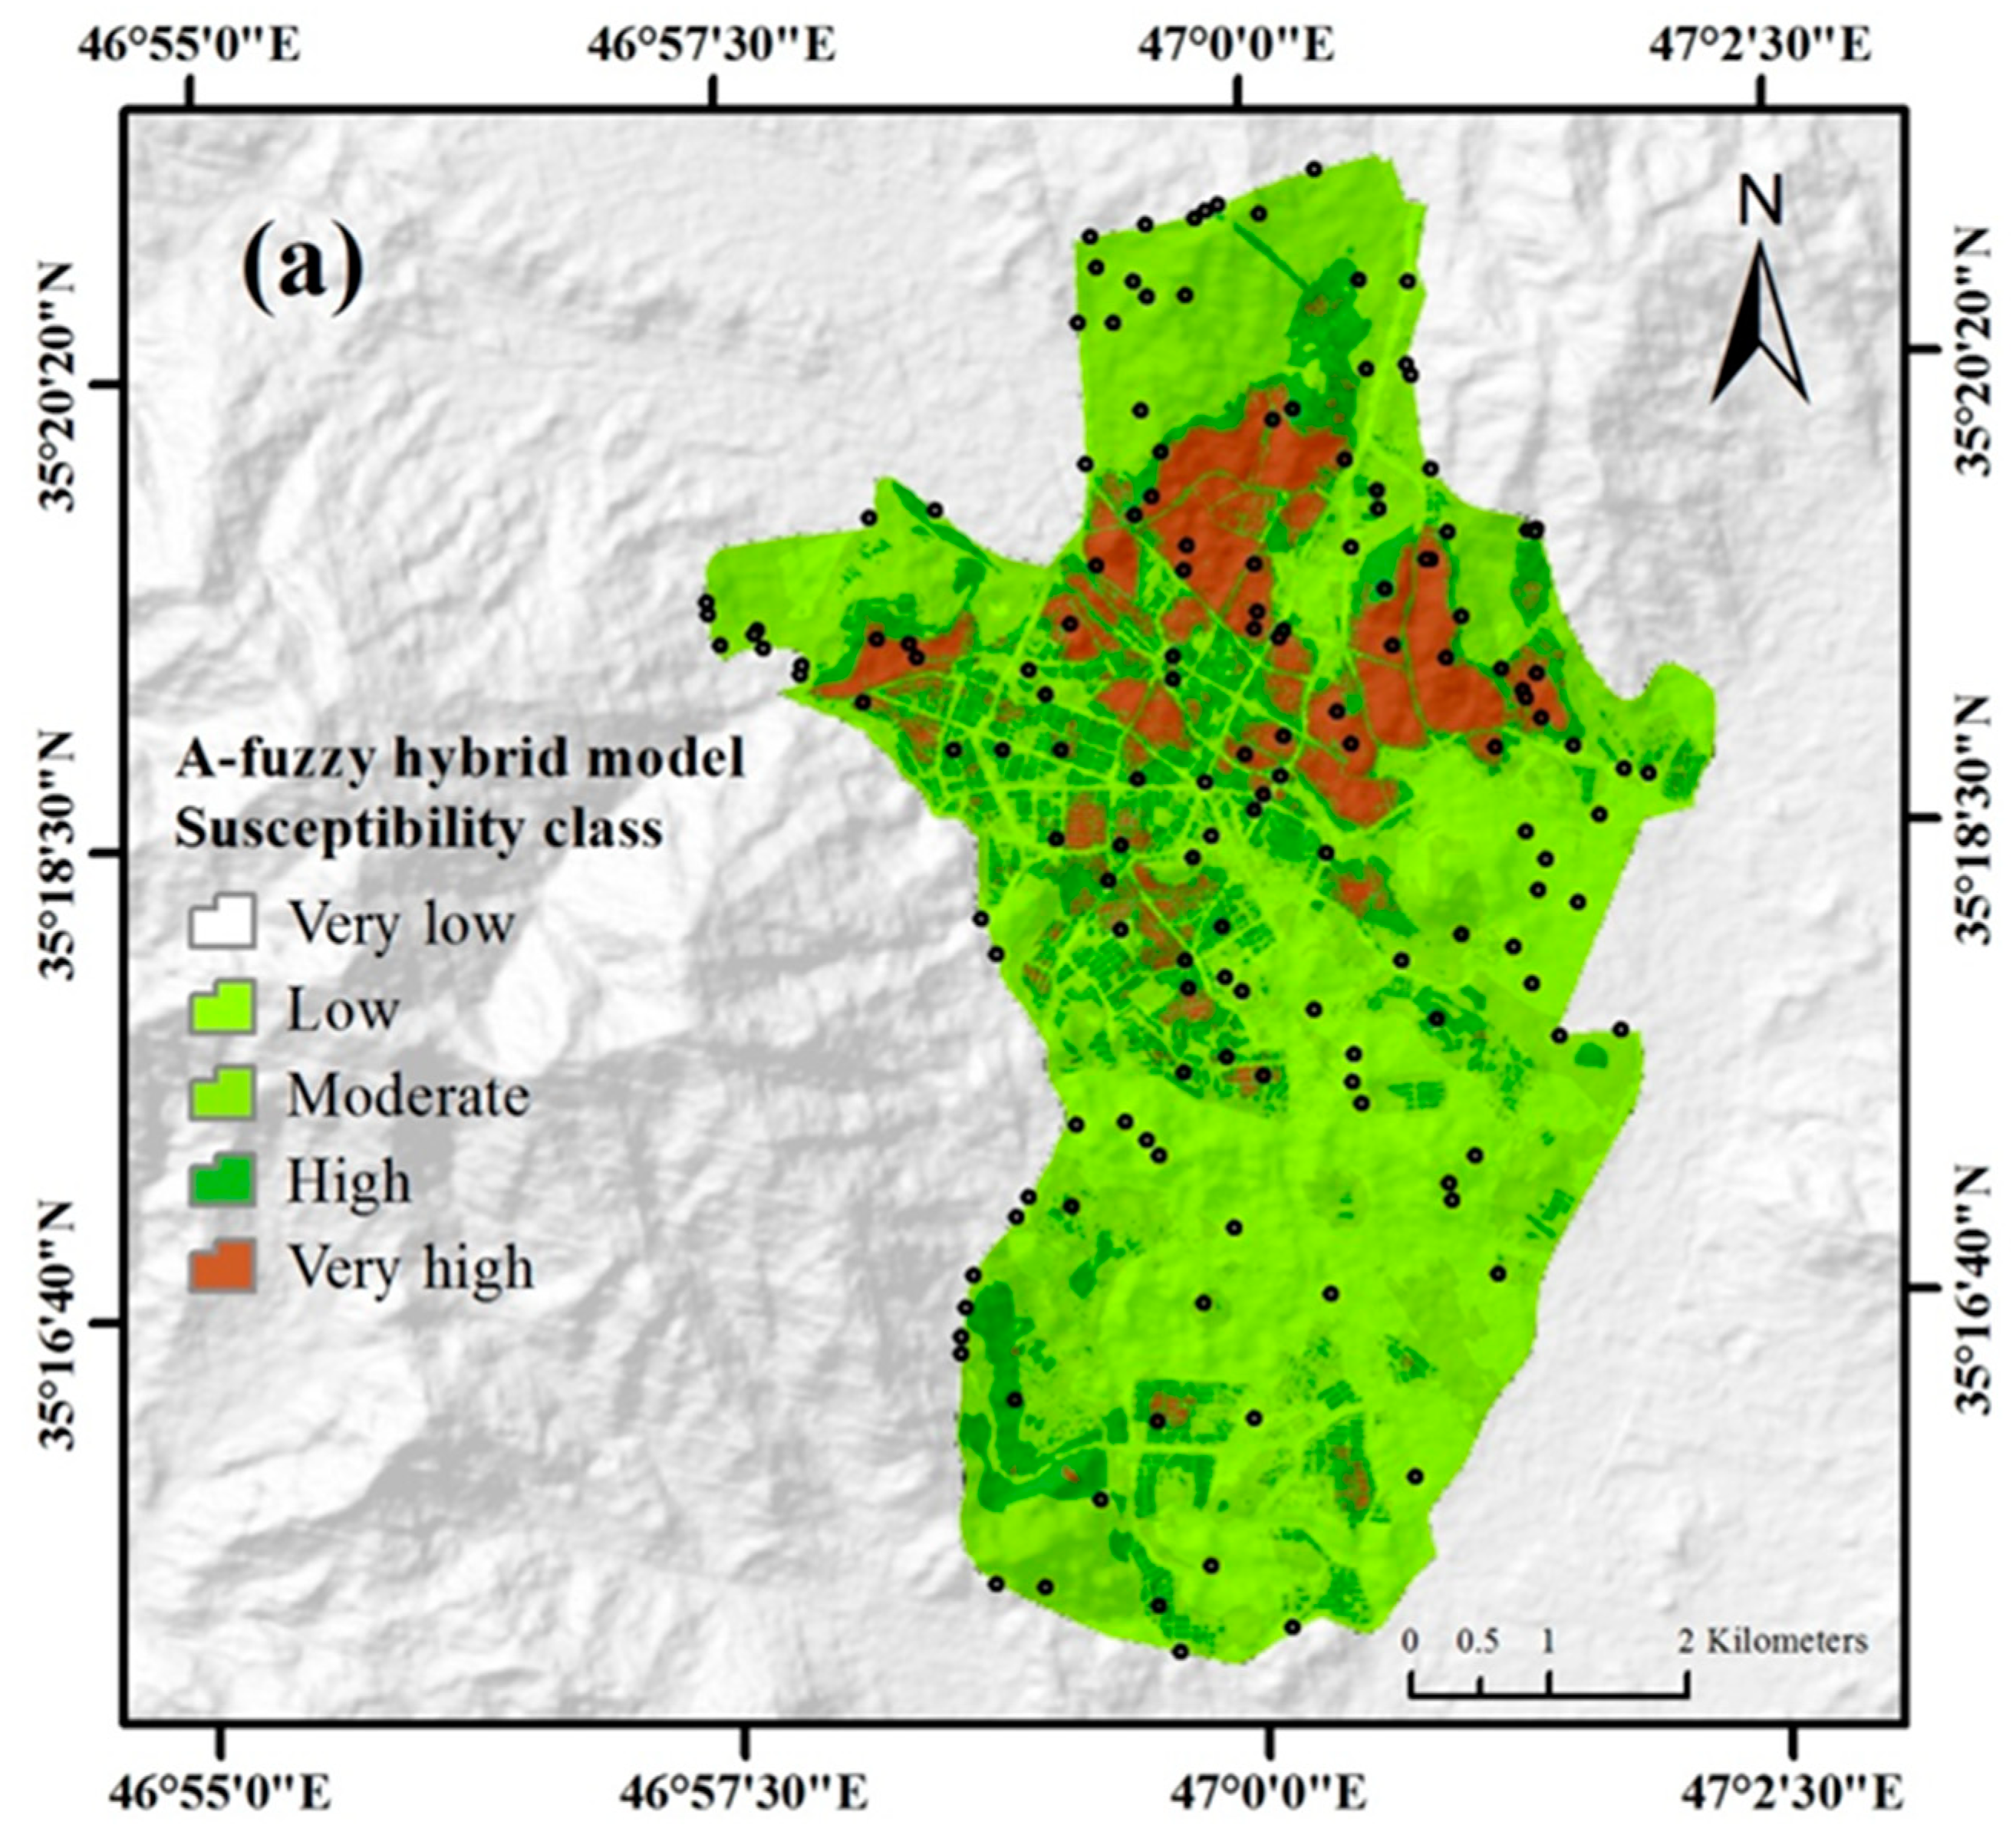
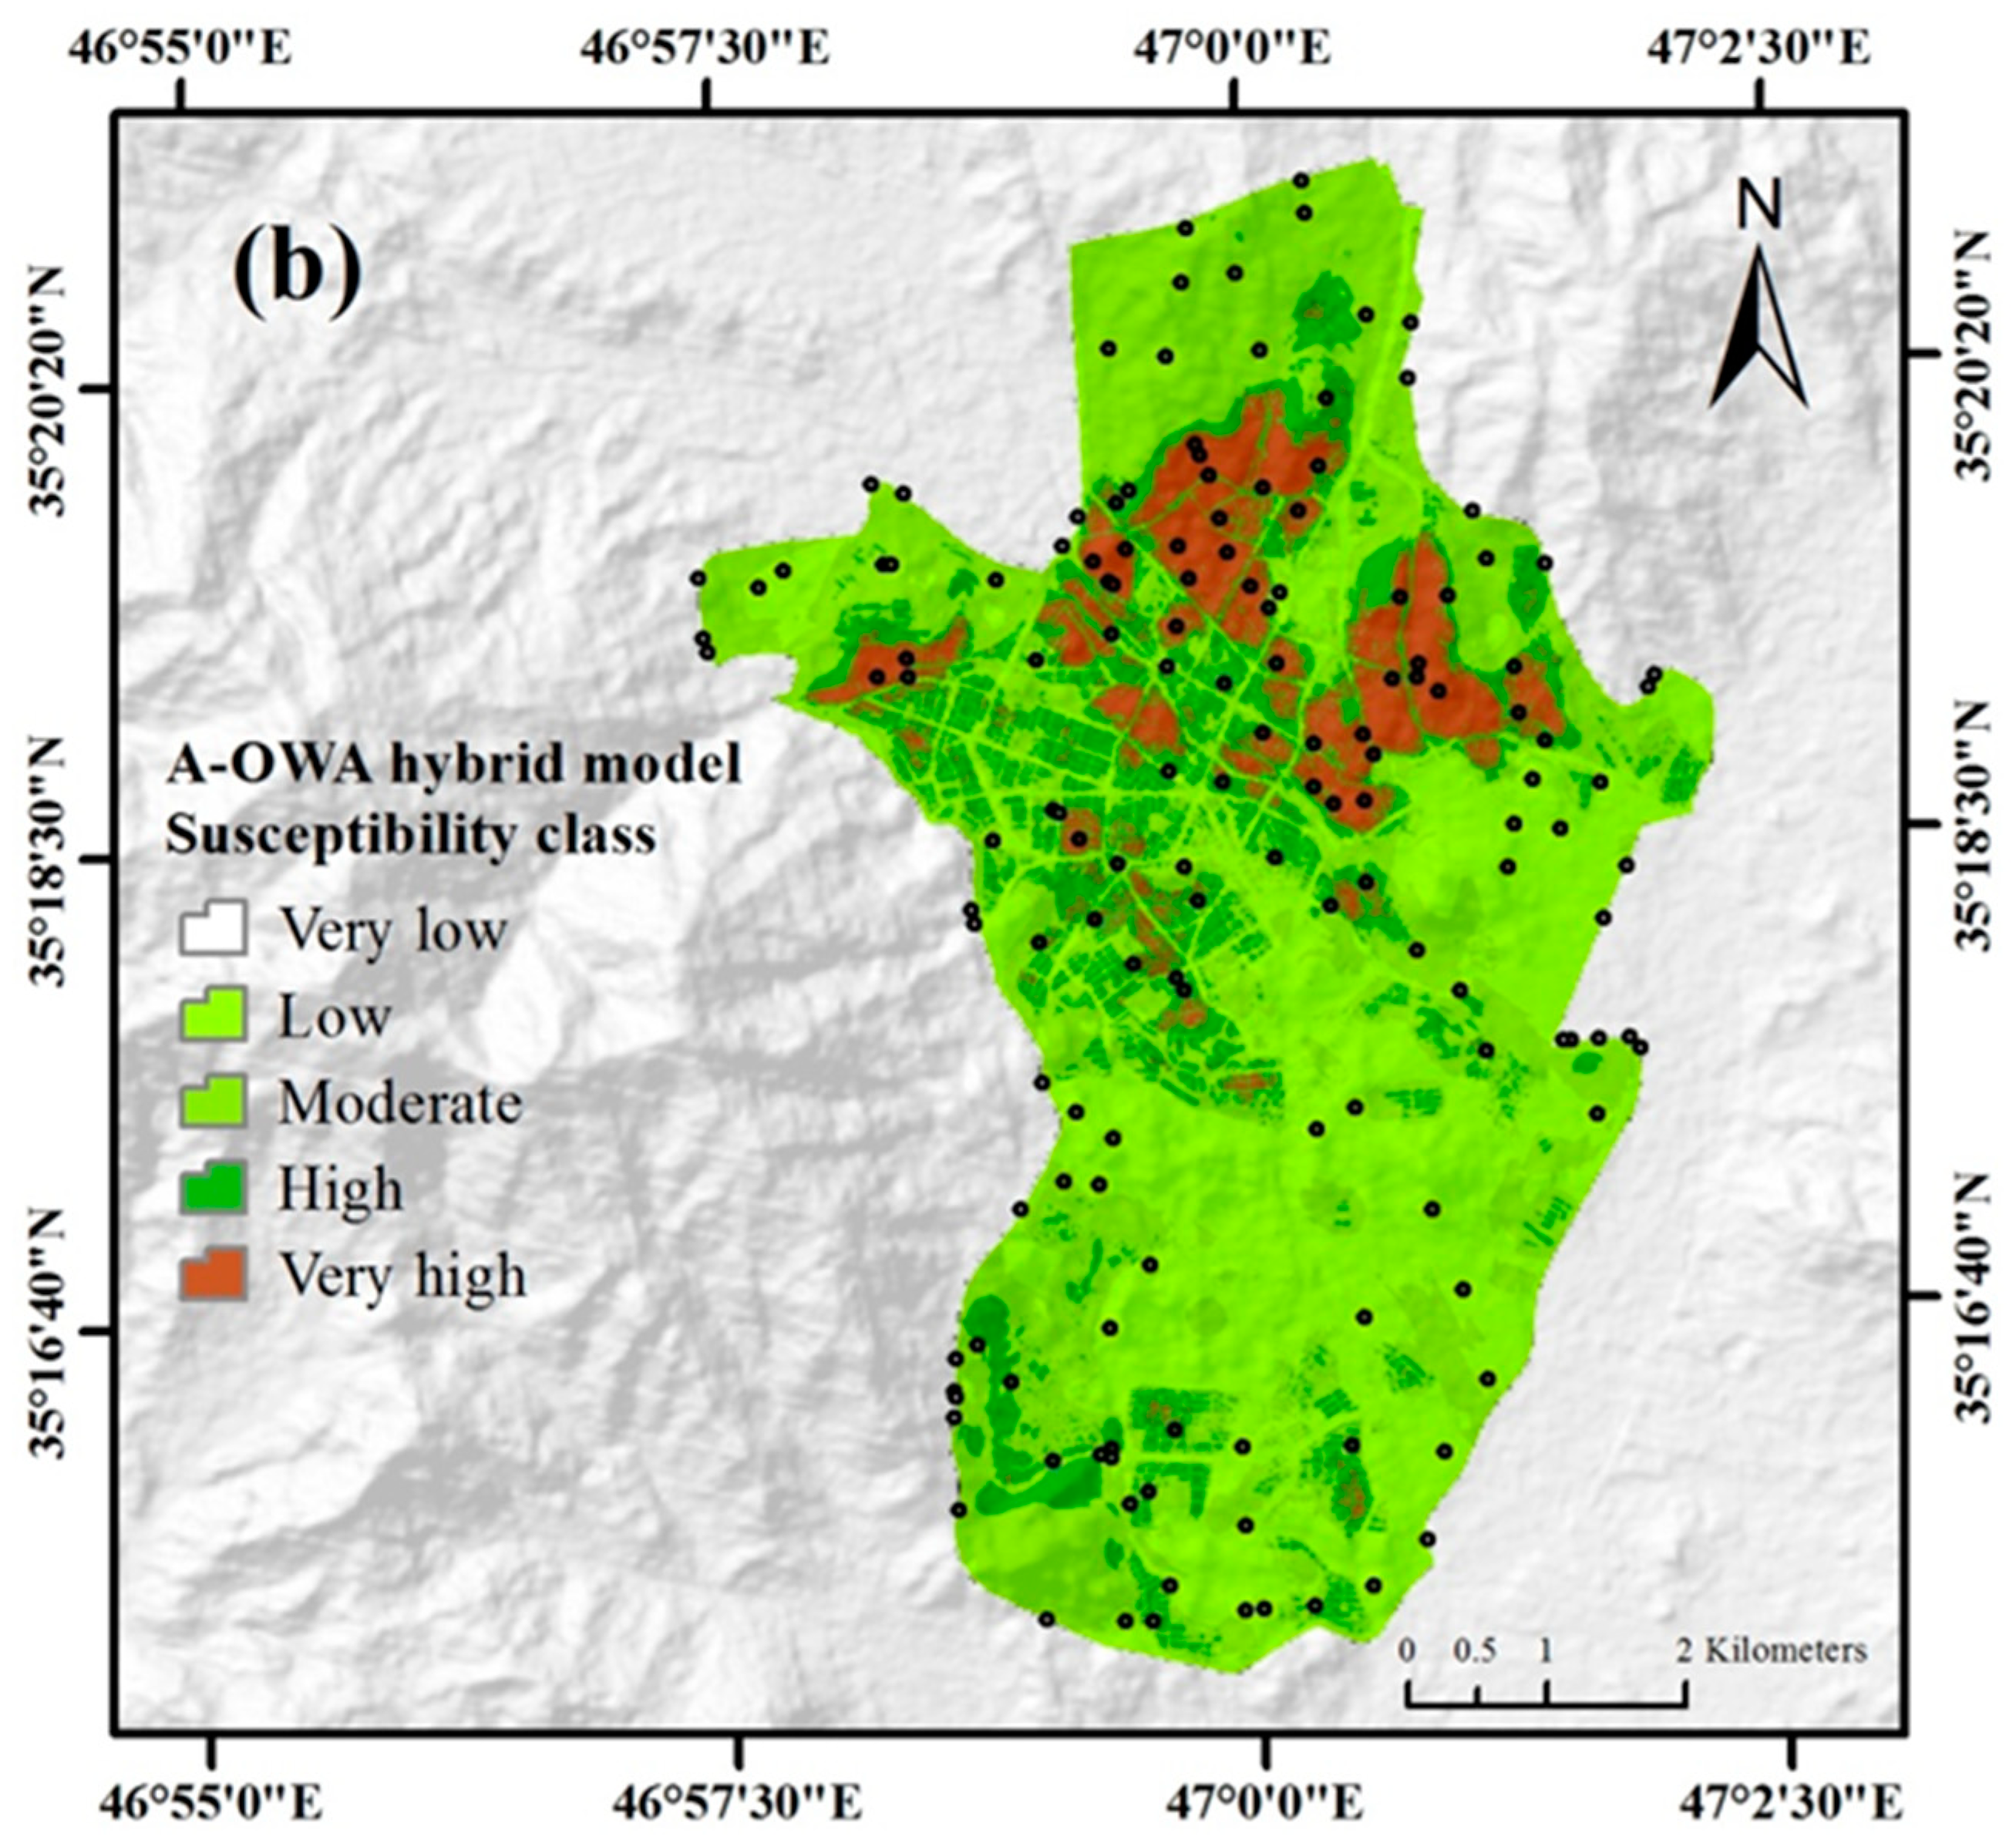
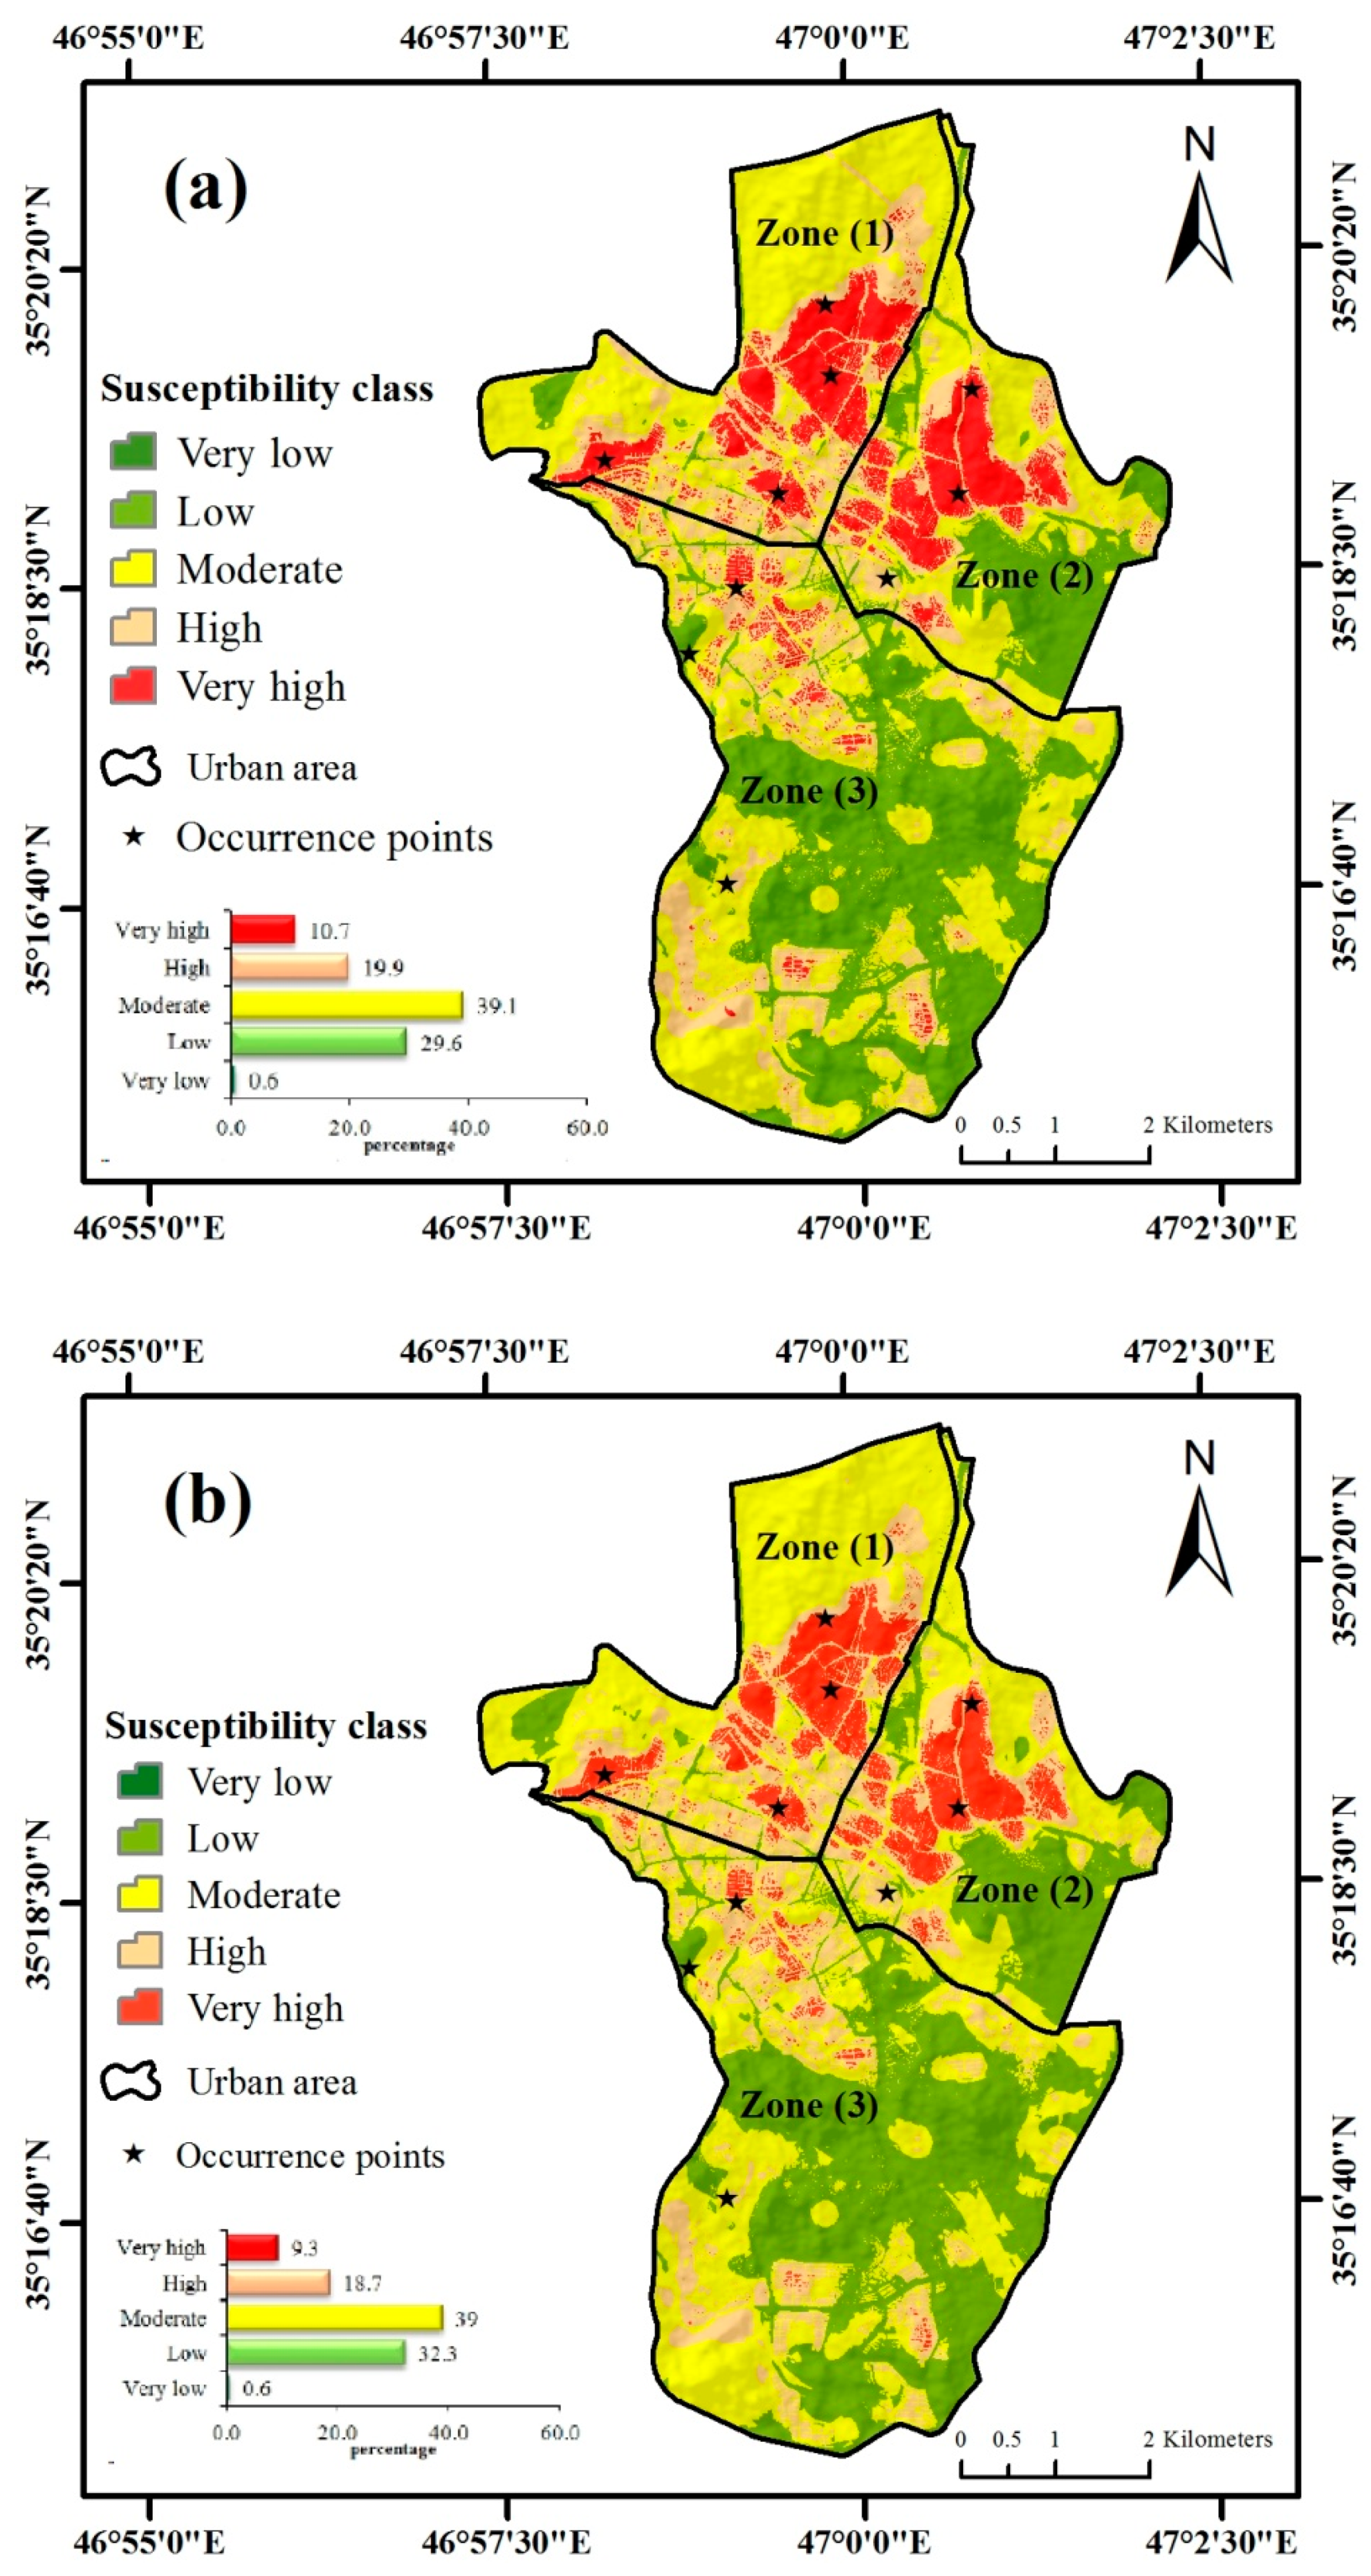
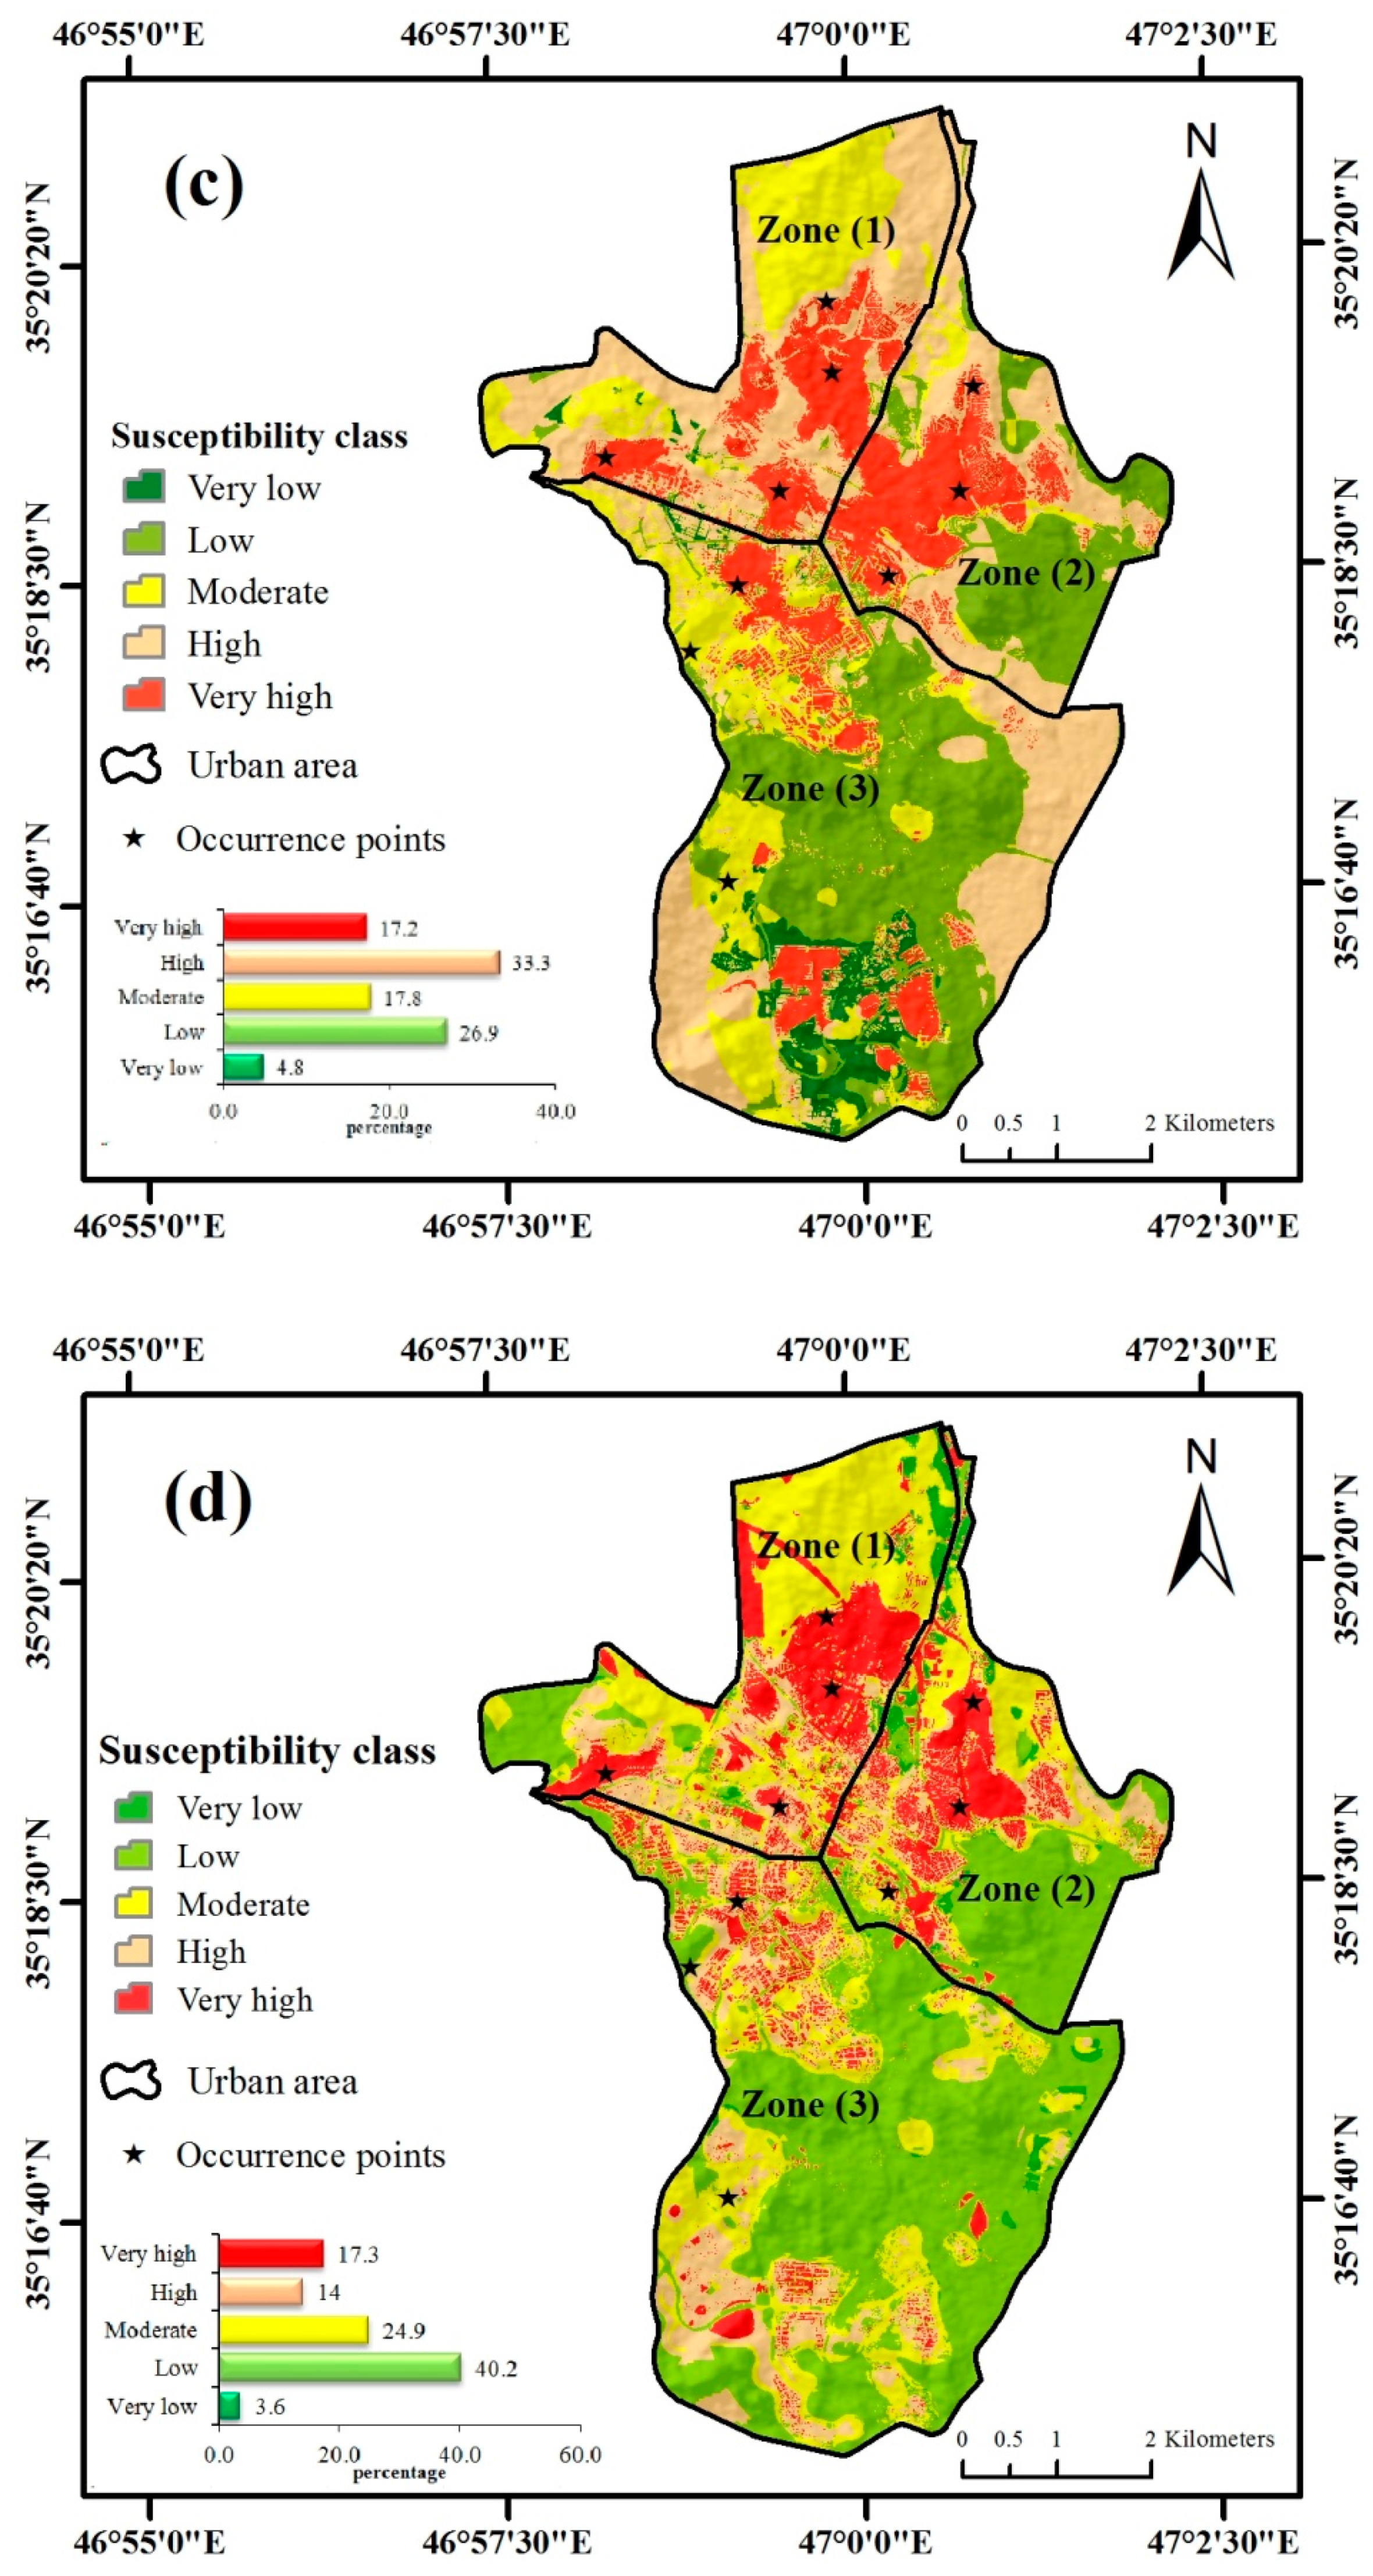
5.1. Seismic Vulnerability Map

After constructing two training databases using the A-OWA and A-fuzzy hybrid models, the LR model was run each time through one of the training sets using input values (standardized data). For modeling seismic vulnerability in Sanandaj City, the LR model was implemented in classification mode using IDRISI Selva software (version 18). We also used the classification option for output to show the percentage of seismic vulnerability. Since in the LR model the dependent variable (training points) must be binary (0 or 1), the training values were used as occurrence (1) and non-occurrence (0) in model implementation. After ANN analysis, the seismic vulnerability map was prepared using the LR model in five classes very low, low, moderate, high and very high vulnerability classes (Figure 7c,d). The seismic vulnerability map was generated by the combined OWA-LR and fuzzy-LR methods and the final maps were transferred to the ArcGIS software.

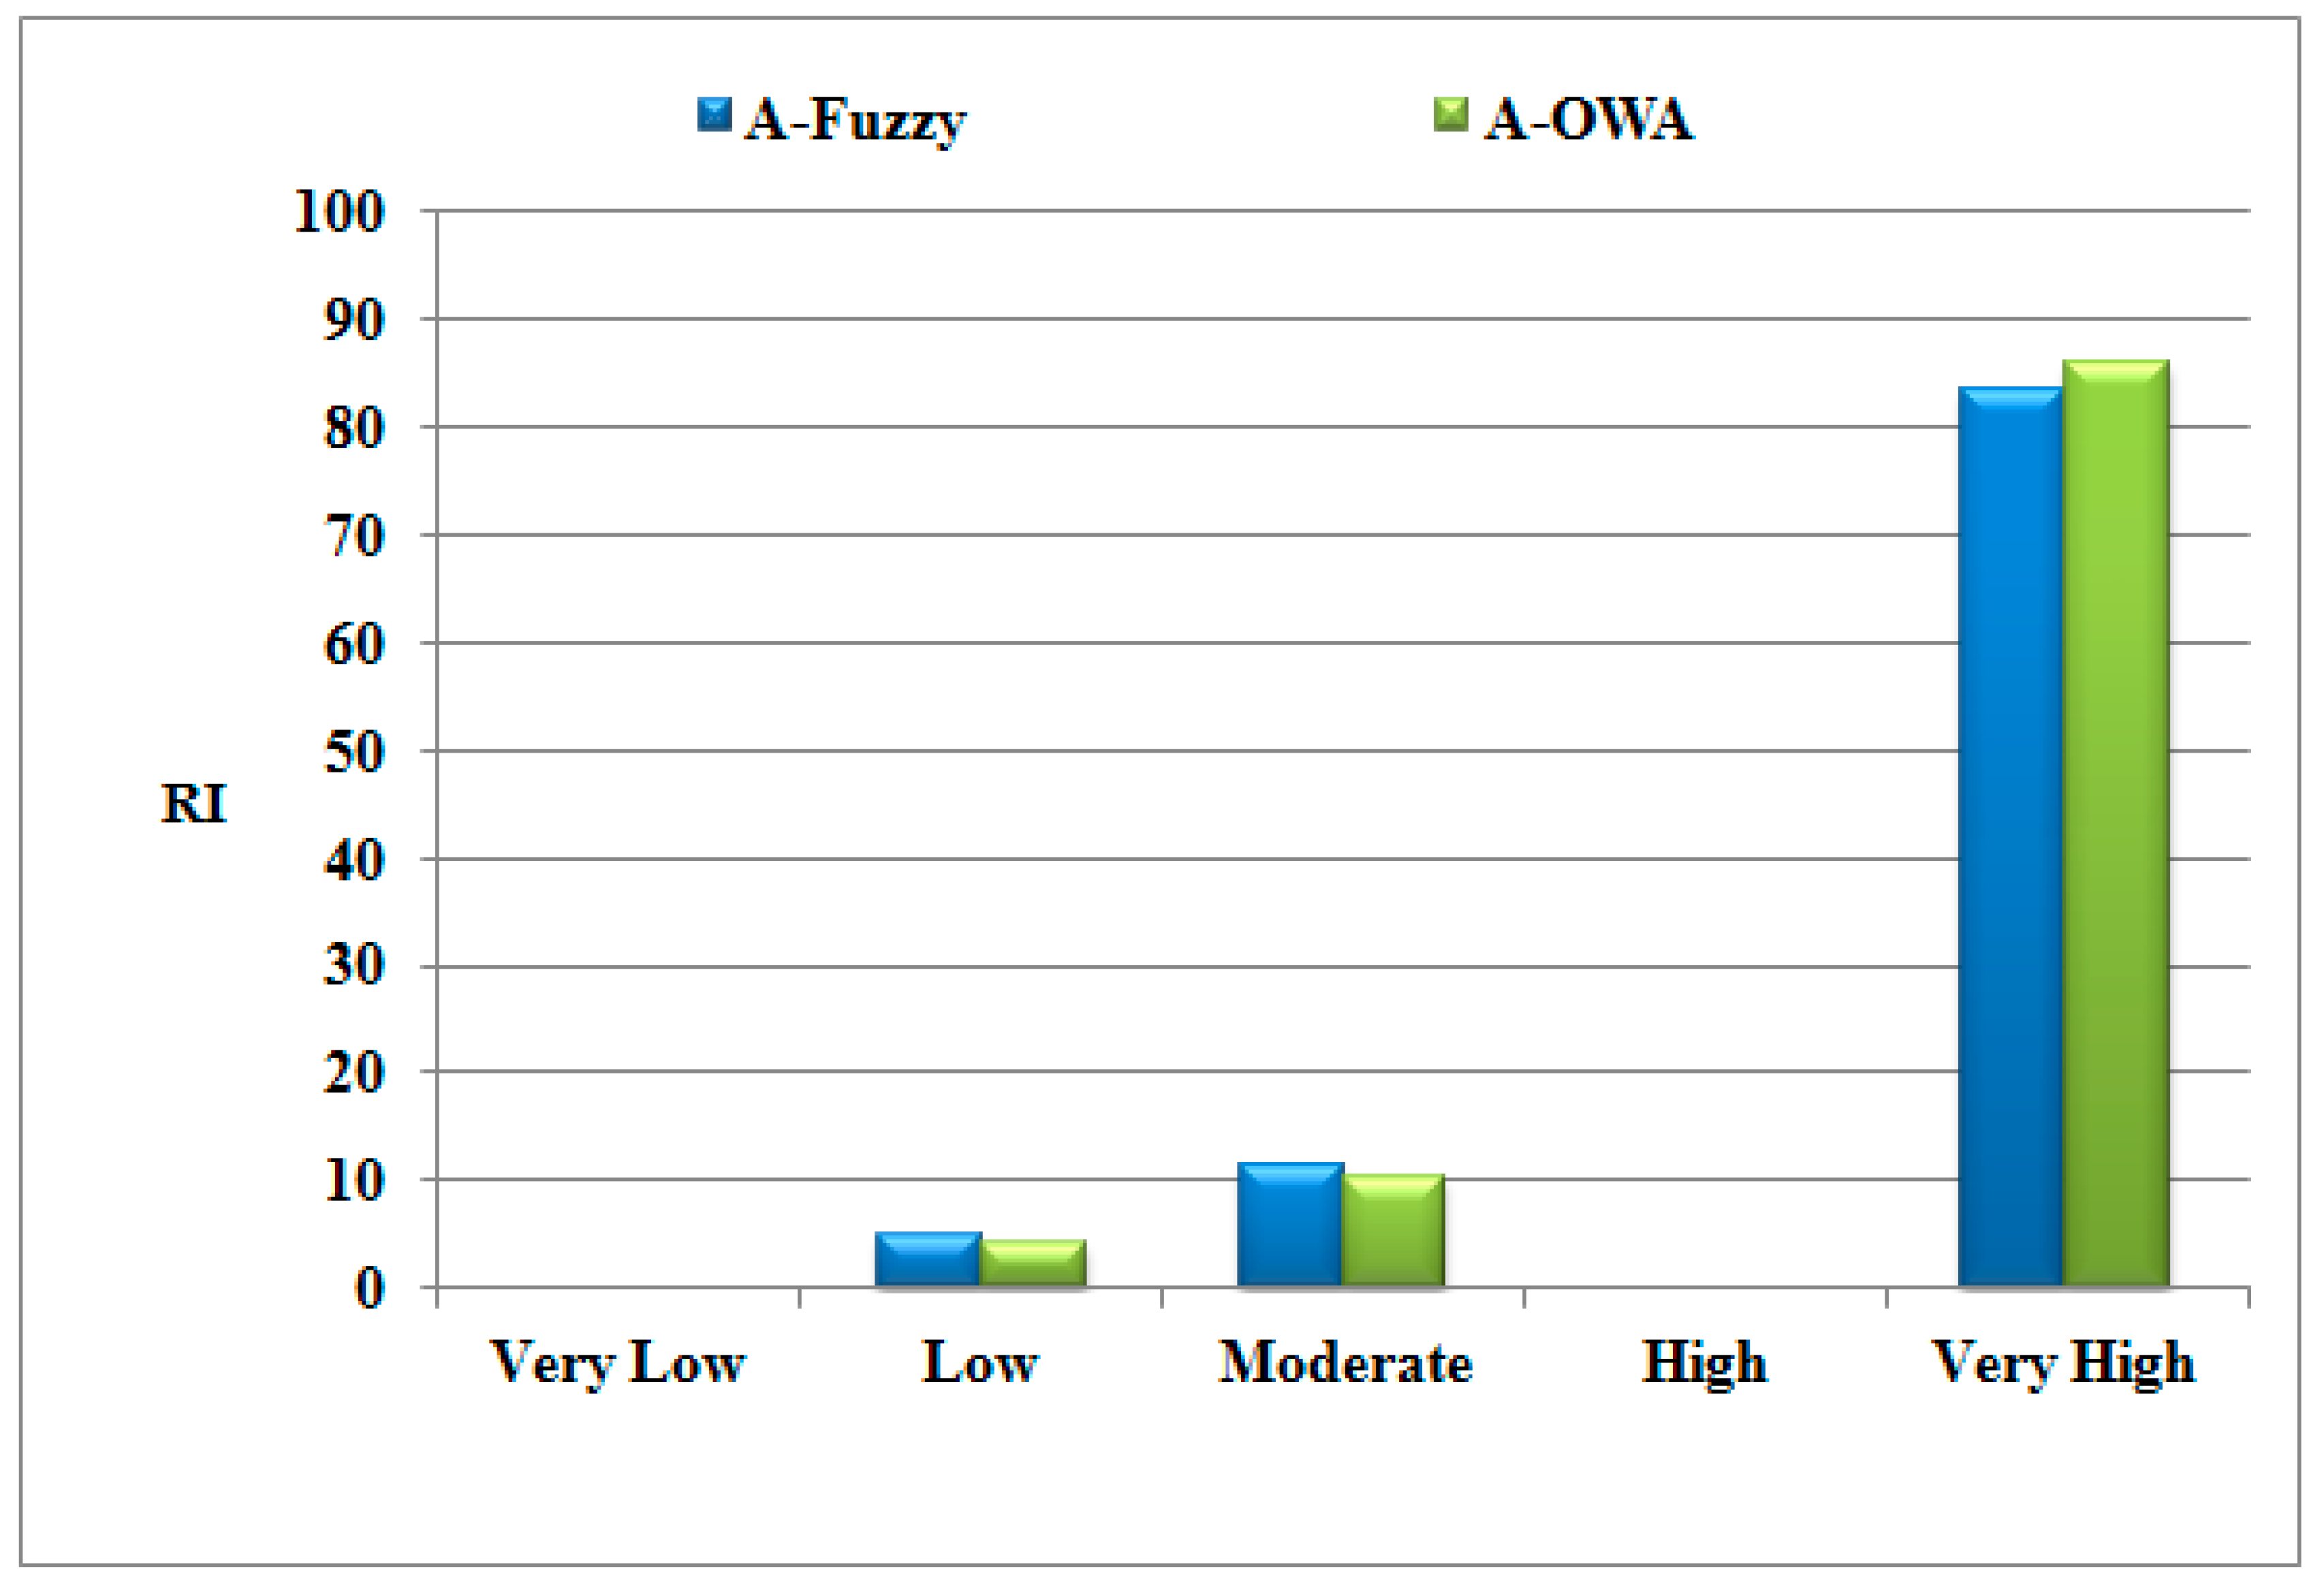
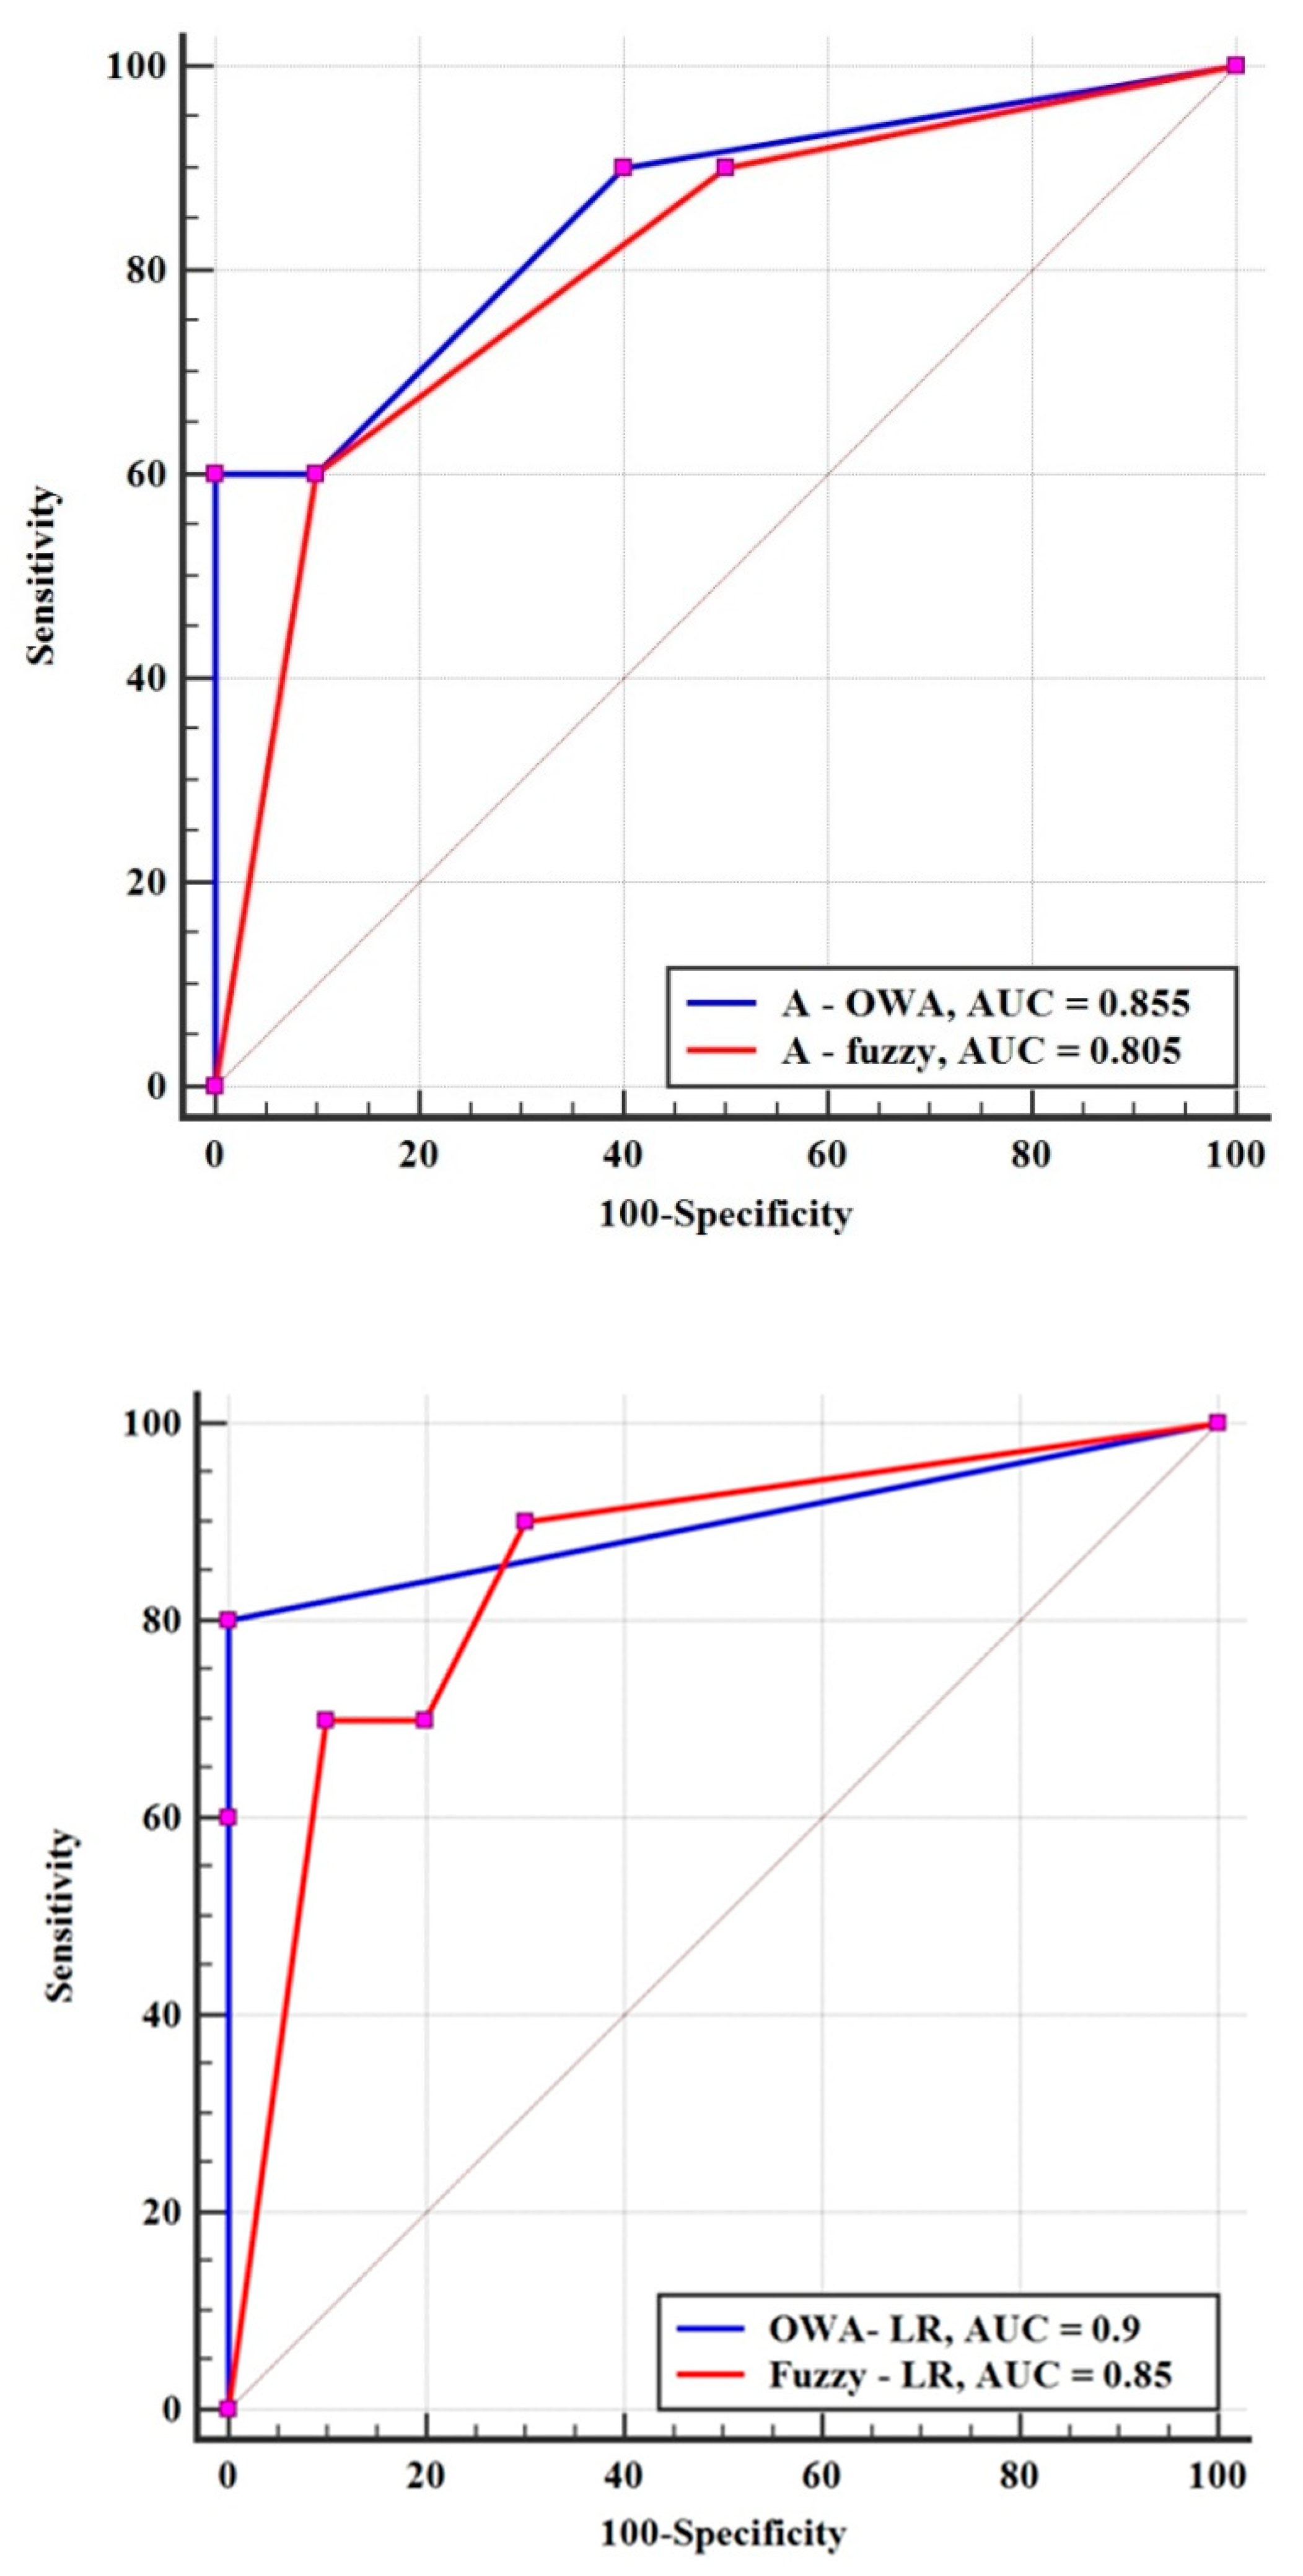
5.2. Validation of the Seismic Susceptibility Maps

In this section, we describe the validation of A-OWA, A-fuzzy, OWA-LR and fuzzy-LR hybrid models, which was performed to evaluate the accuracy of seismic vulnerability map in Sanandaj. Accordingly ROC curve have been used to investigate the accuracy of earthquake vulnerability maps produced [54]. The results of the ROC curve analysis showed that the AUC for ensemble models OWA_LR, fuzzy-LR, A-OWA, and A-fuzzy had values of 0.9, 0.85, 0.855 and 0.805, respectively (Figure 8 and Table 7). Therefore, the OWA-LR hybrid model with AUC = 0.9 was the most accurate in preparing the earthquake vulnerability map in the studied logic.
In order to validate the combined models of OWA-LR and fuzzy-LR, FR index was used. By observing the logical relationship between the vulnerability points and the sensitivity classes, the high values of FR in the very high class for each model indicate its high accuracy compared to the other models (see Table 8). This distribution indicates that there is a positive relationship between the percentage of presence of vulnerability points and the high susceptibility class.

6. Discussion and Conclusions

Identifying areas prone to seismic vulnerability is one of the most important issues in crisis management in cities. Although many methods and techniques have been developed to assess earthquake hazards around the world so far, the goals of all these studies are to reduce the economic losses and resulting losses. Researchers have previously focused on individual models for vulnerability, assessing the location of natural disasters such as earthquakes. However, many hybrid models have recently been used to model natural hazards [37,40,81]. The purpose of this study was to introduce new hybrid learning models for seismic vulnerability mapping in Sanandaj City. In fact, the basis of this study was the application of hybrid models and synthetic neural network training in combination to predict the location of earthquake hazards. Fifteen factors were selected as effective factors in measuring seismic vulnerability. The purpose of using hybrid models in this study was to provide detailed analyses and eliminates some of the unreliable results in individual models. Artificial neural networks can be used to provide classified maps in predicting natural disasters such as earthquakes with good accuracy worldwide. After building the A-OWA and A-fuzzy hybrid models and creating training databases, the fuzzy-LR and OWA-LR hybrid models were implemented. Comparing the accuracy of hybrid models using the area under curve (AUC) and FR shown, the A-OWA hybrid model with AUC = 0.855 is more accurate than the A-fuzzy hybrid model with AUC = 0.805.
In addition, by comparing the accuracy of hybrid models, the OWA-LR model with AUC = 0.9 and lower standard error (STD error = 0.0677) and FR = 12 index value in class of high sensitivity, than the Fuzzy-LR hybrid model with AUC = 0.85 and FR = 10.30 has higher accuracy. However, other models such as A-fuzzy and A-OWA have also been powerful models, with high predictive accuracy of earthquake sensitivity in this study (Table 8). In principle, two types of hybrid models have been used to construct training data for integration with artificial neural networks in this study. Therefore, the models used in the study may have lower accuracy when used with individual modes. In this study, all hybrid models provided accurate predictions regarding the seismic vulnerability assessment. Nevertheless, based on the results, the high accuracy of the hybrid A-OWA model and the lower standard error (STD error = 0.083) increase the accuracy of the training database. Therefore, the validation of the training database constructed and the final accuracy of the combined models by the damaged points have provided reliable accuracy in this study.
According to the results of the OWA-LR hybrid model, as an optimal model, 44% of Sanandaj city space is in the low and very low vulnerability spectrum and 25% is in the moderate vulnerability spectrum. In addition, about 32% of the city area is in vulnerable classes and the highest vulnerability is in urban areas 1 and 2. One of the main causes of seismic vulnerability in the north of Sanandaj is physical and social criteria, such as worn-out urban texture, population density, number of floors, distance from health centers, and so on. Meanwhile environmental factors such as proximity to the fault are more influential in vulnerability to the south of the city (Zone 3). Therefore, attention should be paid to the strengthening of worn-out urban texture and better access to health centers in urban areas 1 and 2 of Sanandaj City. In addition, consideration of construction in open areas of Zone 3 based on environmental factors (distance from the fault, lithology) will reduce the amenity of earthquake damage.
In order to reduce the damage caused by an earthquake, an earthquake vulnerability map can show suitable areas for building and housing and be used by planners. Human science and technology at the present moment cannot cope with the earthquake and prevent it from happening, so man must use his science and technology to adapt to environmental hazards. Due to access restrictions, it is not possible to thoroughly investigate all the factors affecting the city′s vulnerability, but with field reviews and expert opinions, this study attempted to address this issue with the highest number of indicators. Therefore, in this study, three factors affecting earthquake vulnerability in the three physical, environmental and social dimensions were used. Due to the limitations of each of the ANP and AHP models in weight determination this study used a novel approach to order the average weight of both models, to obtain the optimal weight of each agent. Finally, in order to improve the AHP and ANP models and to build two hybrid models, the earthquake vulnerability map of Sanandaj was produced by combining the weight of multi-criteria decision-making models AHP and ANP and combining this with two fuzzy and OWA models. In addition, a new hybrid approach was used to train the LR neural network model to overcome the limitations of access to seismic vulnerability points in Sanandaj city. Thus, the A-OWA and A-fuzzy hybrid models, as the basis for building educational databases, can overcome the limitations of data access in such studies. In order to ensure the accuracy of the hybrid models, the seismic relative index validation method based on 10 vulnerability points recorded by the researchers in this study in urban areas was used. As a result, by combining the logistic regression (LR) model with MCDA-fuzzy and MCDA-OWA hybrid models, two maps using these models were also prepared. After modeling, the accuracy of the first A-OWA and A-fuzzy hybrid models in building the training database were compared with the accuracy of the new hybrid models (OWA-LR and Fuzzy-LR) built through them. The results of the evaluation of the models used showed that the A-OWA hybrid database and hybrid model OWA-LR with the Area under curve (AUC = 0.855 and AUC = 0.9) are the most accurate models for mapping earthquake vulnerability. Therefore, it can be concluded that the accuracy of the educational database used in the study influenced the accuracy of the final model. Therefore, the new hybrid model OWA-LR is introduced as the most desirable model in this study. According to this model, 17.3% of the study area is very highly vulnerable. Results of the potential earthquake vulnerability map showed that Zone 1 and parts of Zone 2 are more sensitive to the earthquake and more possible to be damaged in these areas than other zones. In Zones 1 and 2, in addition to the influence of natural factors on seismic vulnerability, physical and human factors caused by high population density and households, poor quality of building materials, low width of passages have played a greater role. Although there are necessary and appropriate post-crisis service facilities such as hospitals and fire stations in these areas, inadequate performance of buildings and pedestrian networks will hamper relief operations. Due to the distribution of high vulnerability locations in the north and west of the city, it is necessary to consider these areas for earthquake resilience, earthquake preparedness and risk reduction operations. In urban Zone 3 environmental factors such as proximity to major faults and high slope also had more impact on seismic vulnerability. Also improvement in crisis management projects in the area, by taking measures such as rebuilding buildings, preventing non-regular construction, taking into account environmental conditions for the construction of houses in Zone 3, building a fire station and an emergency medical center in the vulnerable areas of Sanandaj city it is essential.

Author Contributions

Conceptualization, P.Y., M.A., and F.S.; Data curation, P.Y., M.A., and F.S.; Funding acquisition, O.G., and T.B.; Investigation, P.Y., M.A., and F.S.; Methodology, P.Y., M.A., and F.S.; Supervision, T.B.; Validation, P.Y., M.A., and F.S.; Visualization, P.Y., M.A., and F.S.; Writing—original draft, P.Y., M.A., F.S., and O.G.; Writing—review & editing, M.A., O.G., and T.B. All authors read and approved the final manuscript.

Funding

This research is partly funded by the Austrian Science Fund (FWF) through the GIScience Doctoral College (DK W 1237-N23).

Acknowledgments

Open Access Funding by the Austrian Science Fund (FWF).

Conflicts of Interest

The authors declare no conflict of interest.

References

  1. Lantada, N.; Pujades, L.G.; Barbat, A.H. Vulnerability index and capacity spectrum based methods for urban seismic risk evaluation. Nat. Hazards 2009, 51, 501–524. [Google Scholar] [CrossRef]
  2. Rashed, T.; Weeks, J. Assessing vulnerability to earthquake hazards through spatial multicriteria analysis of urban areas. Int. J. Geogr. Inf. Sci. 2003, 17, 547–576. [Google Scholar] [CrossRef]
  3. Ebert, A.; Kerle, N. Urban Social Vulnerability Assessment Using Object-Oriented Analysis of Remote Sensing and GIS Data. A Case Study for Tegucigalpa, Honduras. Int. Arch. Photogramm. Remote Sens. Spat. Inf. Sci. 2008, 37, 1307–1312. [Google Scholar]
  4. Asadi, Y.; Samany, N.N.; Ezimand, K. Seismic vulnerability assessment of urban buildings and traffic networks using fuzzy ordered weighted average. J. Mt. Sci. 2019, 16, 677–688. [Google Scholar] [CrossRef]
  5. Wald, D.; Jaiswal, K.; Marano, K.; Bausch, D. Earthquake impact scale. Nat. Hazards Rev. 2011, 12, 125–139. [Google Scholar] [CrossRef] [Green Version]
  6. Linares, R.; Alejandra, R. Panama Prepares the City of david for Earthquakes, project highlights. Panama 2012, 9, 1–4. Available online: http://siteresources.worldbank.org/INTLACREGTOPURBDEV/Resources/840343-1319570618921/PH_Issue_9_CITY_DAVID_PRINT.pdf (accessed on 4 March 2020).
  7. Xing, H.; Zhonglin, Z.; Shaoyu, W. The prediction model of earthquake casuailty based on robust wavelet v-SVM. Nat. Hazards 2015, 77, 717–732. [Google Scholar] [CrossRef]
  8. Merciu, C.; Ianos, I.; Merciu, G.; Jones, R.; Pomeroy, G. Mapping accessibility for earthquake hazard response in the historic urban centre of Bucharest. Nat. Hazards Earth Syst. Sci. 2018, 18, 2011–2026. [Google Scholar] [CrossRef] [Green Version]
  9. Frigerio, I.; De Amicis, M. Mapping social vulnerability to natural hazards in Italy: A suitable tool for risk mitigation strategies. Environ. Sci. Policy 2016, 63, 187–196. [Google Scholar] [CrossRef]
  10. Martins, V.N.; e Silva, D.S.; Cabral, P. Social vulnerability assessment to seismic risk using multicriteria analysis: The case study of Vila Franca do Campo (São Miguel Island, Azores, Portugal). Nat. Hazards 2012, 62, 385–404. [Google Scholar] [CrossRef]
  11. Kumlu, K.B.Y.; Tüdeş, Ş. Determination of earthquake-risky areas in Yalova City Center (Marmara region, Turkey) using GIS-based multicriteria decision-making techniques (analytical hierarchy process and technique for order preference by similarity to ideal solution). Nat. Hazards 2019, 96, 999–1018. [Google Scholar] [CrossRef]
  12. Carreño, M.L.; Cardona, O.D.; Barbat, A.H. New methodology for urban seismic risk assessment from a holistic perspective. Bull. Earthq. Eng. 2012, 10, 547–565. [Google Scholar] [CrossRef]
  13. McClure, J.; Johnston, D.M.; Henrich, L.; Milfont, T.L.; Becker, J. When a hazard occurs where it is not expected: Risk judgments about different regions after the Christchurch earthquakes. Nat. Hazards 2015, 75, 635–652. [Google Scholar] [CrossRef]
  14. Kumamoto, T.; Masataka, T. Multivariate statistical analysis for seismotectonic zonation by the use of earthquake, active fault and crustal structure. In Proceedings of the Japan Geosciences Union Meeting, Takayama, Japan, 26–28 October 2011. [Google Scholar]
  15. Asim, K.M.; Idris, A.; Iqbal, T.; Martinez-Alvarez, F. Earthquake prediction model using support vector regressor and hybrid neural networks. PLoS ONE 2018, 13. [Google Scholar] [CrossRef] [PubMed]
  16. Dehghani, R.; Mohammadzadeh, N.; Salehi, M.; Kassiri, H. Earthquake planning and crisis management with an emphasis on the facilities, utilities, and services of the health care centers of Tiran and Karvan County, Isfahan Province, Iran: A case study. J. Acute Dis. 2018, 7, 115. [Google Scholar]
  17. Miano, A.; Jalayer, F.; De Risi, R.; Prota, A.; Manfredi, G. A case-study on scenario-based probabilistic seismic loss assessment for a portfolio of bridges. In Proceedings of the 12th International Conference on Applications of Statistics and Probability in Civil Engineering (ICASP12), Vancouver, BC, Canada, 12–15 July 2015; pp. 12–15. [Google Scholar]
  18. De Silva, S.; De Silva, G.S.; Padmal, H. Assessment method for seismic vulnerability of old masonry buildings in Sri Lanka. Procedia Eng. 2018, 212, 61–68. [Google Scholar] [CrossRef]
  19. Banica, A.; Rosu, L.; Muntele, I.; Grozavu, A. Towards urban resilience: A multi-criteria analysis of seismic vulnerability in Iasi City (Romania). Sustainability 2017, 9, 270. [Google Scholar] [CrossRef] [Green Version]
  20. Dou, J.; Yunus, A.P.; Tien Bui, D.; Sahana, M.; Chen, C.W.; Zhu, Z.; Wang, W.; Thai Pham, B. Evaluating GIS-based multiple statistical models and data mining for earthquake and rainfall-induced landslide susceptibility using the LiDAR DEM. Remote Sens. 2019, 11, 638. [Google Scholar] [CrossRef] [Green Version]
  21. Tian, Y.; Xu, C.; Hong, H.; Zhou, Q.; Wang, D. Mapping earthquake-triggered landslide susceptibility by use of artificial neural network (ANN) models: An example of the 2013 Minxian (China) Mw 5.9 event. Geomat. Nat. Hazards Risk 2019, 10, 1–25. [Google Scholar] [CrossRef] [Green Version]
  22. Ghorbanzadeh, O.; Blaschke, T.; Gholamnia, K.; Aryal, J. Forest fire susceptibility and risk mapping using social/infrastructural vulnerability and environmental variables. Fire 2019, 2, 50. [Google Scholar] [CrossRef] [Green Version]
  23. Bagheri, V.; Uromeihy, A.; Aghda, S.M.F. Evaluation of ANFIS and LR models for seismic rockfalls’ susceptibility mapping: A case study of Firooz Abad-Kojour, Iran, Earthquake (2004). Environ. Earth Sci. 2018, 77, 800. [Google Scholar] [CrossRef]
  24. Ghorbanzadeh, O.; Valizadeh Kamran, K.; Blaschke, T.; Aryal, J.; Naboureh, A.; Einali, J.; Bian, J. Spatial prediction of wildfire susceptibility using field survey gps data and machine learning approaches. Fire 2019, 2, 43. [Google Scholar] [CrossRef] [Green Version]
  25. Tavakkoli Piralilou, S.; Shahabi, H.; Jarihani, B.; Ghorbanzadeh, O.; Blaschke, T.; Gholamnia, K.; Meena, S.R.; Aryal, J. Landslide Detection Using Multi-Scale Image Segmentation and Different Machine Learning Models in the Higher Himalayas. Remote Sens. 2019, 11, 2575. [Google Scholar] [CrossRef] [Green Version]
  26. Abdollahi, S.; Pourghasemi, H.R.; Ghanbarian, G.A.; Safaeian, R. Prioritization of effective factors in the occurrence of land subsidence and its susceptibility mapping using an SVM model and their different kernel functions. Bull. Eng. Geol. Environ. 2019, 78, 4017–4034. [Google Scholar] [CrossRef]
  27. Ghorbanzadeh, O.; Blaschke, T.; Gholamnia, K.; Meena, S.R.; Tiede, D.; Aryal, J. Evaluation of Different Machine Learning Methods and Deep-Learning Convolutional Neural Networks for Landslide Detection. Remote Sens. 2019, 11, 196. [Google Scholar] [CrossRef] [Green Version]
  28. Pourghasemi, H.R.; Beheshtirad, M.; Pradhan, B. A comparative assessment of prediction capabilities of modified analytical hierarchy process (M-AHP) and Mamdani fuzzy logic models using Netcad-GIS for forest fire susceptibility mapping. Geomat. Nat. Hazards Risk 2016, 7, 861–885. [Google Scholar] [CrossRef] [Green Version]
  29. Ghorbanzadeh, O.; Rostamzadeh, H.; Blaschke, T.; Gholaminia, K.; Aryal, J. A new GIS-based data mining technique using an adaptive neuro-fuzzy inference system (ANFIS) and k-fold cross-validation approach for land subsidence susceptibility mapping. Nat. Hazards 2018, 94, 497–517. [Google Scholar] [CrossRef] [Green Version]
  30. Termeh, S.V.R.; Kornejady, A.; Pourghasemi, H.R.; Keesstra, S. Flood susceptibility mapping using novel ensembles of adaptive neuro fuzzy inference system and metaheuristic algorithms. Sci. Total Environ. 2018, 615, 438–451. [Google Scholar] [CrossRef]
  31. Ziemba, P. Towards strong sustainability management—A generalized PROSA method. Sustainability 2019, 11, 1555. [Google Scholar] [CrossRef] [Green Version]
  32. Guan, X.; Qian, L.; Li, M.; Chen, H.; Zhou, L. Earthquake relief emergency logistics capacity evaluation model integrating cloud generalized information aggregation operators. J. Intell. Fuzzy Syst. 2017, 32, 2281–2294. [Google Scholar] [CrossRef]
  33. Gudiyangada Nachappa, T.; Tavakkoli Piralilou, S.; Ghorbanzadeh, O.; Shahabi, H.; Blaschke, T. Landslide Susceptibility Mapping for Austria Using Geons and Optimization with the Dempster-Shafer Theory. Appl. Sci. 2019, 9, 5393. [Google Scholar] [CrossRef] [Green Version]
  34. Shahabi, H.; Khezri, S.; Ahmad, B.B.; Hashim, M. Landslide susceptibility mapping at central Zab basin, Iran: A comparison between analytical hierarchy process, frequency ratio and logistic regression models. Catena 2014, 115, 55–70. [Google Scholar] [CrossRef]
  35. Ghorbanzadeh, O.; Blaschke, T. Wildfire Susceptibility Evaluation by Integrating an Analytical Network Process Approach into Gis-Based Analyses. Int. J. Adv. Sci. Eng. Technol. 2018, 6, 48–53. [Google Scholar]
  36. Pirnazar, M.; Karimi, A.Z.; Feizizadeh, B.; Ostad-Ali-Askari, K.; Eslamian, S.; Hasheminasab, H.; Ghorbanzadeh, O.; Hamedani, M.H. Assessing flood hazard using gis based multi-criteria decision making approach; Study area: East-azerbaijan province (kaleybar chay basin). J. Flood Eng. 2017, 8, 203–223. [Google Scholar]
  37. Rahmati, O.; Ghorbanzadeh, O.; Teimurian, T.; Mohammadi, F.; Tiefenbacher, J.P.; Falah, F.; Pirasteh, S.; Ngo, P.-T.T.; Bui, D.T. Spatial Modeling of Snow Avalanche Using Machine Learning Models and Geo-Environmental Factors: Comparison of Effectiveness in Two Mountain Regions. Remote Sens. 2019, 11, 2995. [Google Scholar] [CrossRef] [Green Version]
  38. Pourghasemi, H.R.; Rahmati, O. Prediction of the landslide susceptibility: Which algorithm, which precision? Catena 2018, 162, 177–192. [Google Scholar]
  39. Shahabi, H.; Hashim, M. Landslide susceptibility mapping using GIS-based statistical models and Remote sensing data in tropical environment. Sci. Rep. 2015, 5, 9899. [Google Scholar] [CrossRef] [Green Version]
  40. Razandi, Y.; Pourghasemi, H.R.; Neisani, N.S.; Rahmati, O. Application of analytical hierarchy process, frequency ratio, and certainty factor models for groundwater potential mapping using GIS. Earth Sci. Inform. 2015, 8, 867–883. [Google Scholar] [CrossRef]
  41. Ghodrati Amiri, G.; Andisheh, K.; Razavian Amrei, S.A. Probabilistic seismic hazard assessment of Sanandaj, Iran. Struct. Eng. Mech. 2009, 32, 563–581. [Google Scholar] [CrossRef]
  42. Alizadeh, M.; Hashim, M.; Alizadeh, E.; Shahabi, H.; Karami, M.R.; Beiranvand Pour, A.; Pradhan, B.; Zabihi, H. Multi-criteria decision making (MCDM) model for seismic vulnerability assessment (SVA) of urban residential buildings. ISPRS Int. J. Geo-Inf. 2018, 7, 444. [Google Scholar] [CrossRef] [Green Version]
  43. Hassanzadeh, R.; Nedović-Budić, Z.; Razavi, A.A.; Norouzzadeh, M.; Hodhodkian, H. Interactive approach for GIS-based earthquake scenario development and resource estimation (Karmania hazard model). Comput. Geosci. 2013, 51, 324–338. [Google Scholar] [CrossRef]
  44. Rahman, N.; Ansary, M.A.; Islam, I. GIS based mapping of vulnerability to earthquake and fire hazard in Dhaka city, Bangladesh. Int. J. Disaster Risk Reduct. 2015, 13, 291–300. [Google Scholar] [CrossRef]
  45. Karimzadeh, S.; Miyajima, M.; Hassanzadeh, R.; Amiraslanzadeh, R.; Kamel, B. A GIS-based seismic hazard, building vulnerability and human loss assessment for the earthquake scenario in Tabriz. Soil Dyn. Earthq. Eng. 2014, 66, 263–280. [Google Scholar] [CrossRef]
  46. Sivakumar, N.; Karthik, S.; Thangaraj, S.; Saravanan, S.; Shidhardhan, C.K. Seismic vulnerability of open ground floor columns in multi storey buildings. Int. J. Sci. Eng. Res. (IJSER) 2013, 1, 52–58. [Google Scholar]
  47. Cole, G.L.; Dhakal, R.P.; Chouw, N. Building Pounding Damage Observed in the 2011 Christchurch earthquake Christchurch Earthquake. Earthq. Eng. Struct. Dyn. 2011, 41, 893–913. [Google Scholar] [CrossRef]
  48. Sinha, N.; Priyanka, N.; Joshi, P.K. Using spatial multi-criteria analysis and ranking tool (SMART) in earthquake risk assessment: A case study of Delhi region, India. Geomat. Nat. Hazards Risk 2016, 7, 680–701. [Google Scholar] [CrossRef] [Green Version]
  49. Rimal, B.; Baral, H.; Stork, N.E.; Paudyal, K.; Rijal, S. Growing city and rapid land use transition: Assessing multiple hazards and risks in the Pokhara Valley, Nepal. Land 2015, 4, 957–978. [Google Scholar] [CrossRef] [Green Version]
  50. Hosseini, K.A.; Hosseini, M.; Jafari, M.K.; Hosseinioon, S. Recognition of vulnerable urban fabrics in earthquake zones: A case study of the Tehran metropolitan area. J. Seismol. Earthq. Eng. 2009, 10, 175–187. [Google Scholar]
  51. Armaş, I.; Toma-Danila, D.; Ionescu, R.; Gavriş, A. Vulnerability to earthquake hazard: Bucharest case study, Romania. Int. J. Disaster Risk Sci. 2017, 8, 182–195. [Google Scholar] [CrossRef]
  52. Duzgun, H.S.B.; Yucemen, M.S.; Kalaycioglu, H.S.; Celik, K.; Kemec, S.; Ertugay, K.; Deniz, A. An integrated earthquake vulnerability assessment framework for urban areas. Nat. Hazards 2011, 59, 917. [Google Scholar] [CrossRef]
  53. Potter, S.H.; Becker, J.S.; Johnston, D.M.; Rossiter, K.P. An overview of the impacts of the 2010–2011 Canterbury earthquakes. Int. J. Disaster Risk Reduct. 2015, 14, 6–14. [Google Scholar] [CrossRef] [Green Version]
  54. Yariyan, P.; Karami, M.R.; Ali Abbaspour, R. Exploitation of mcda to learn the radial base neural network (rbfnn) aim physical and social vulnerability analysis versus the earthquake (case study: Sanandaj city, iran). Int. Arch. Photogramm. Remote Sens. Spat. Inf. Sci. 2019. [Google Scholar] [CrossRef] [Green Version]
  55. Pachauri, A.K.; Pant, M. Landslide hazard mapping based on geological attributes. Eng. Geol. 1992, 32, 81–100. [Google Scholar] [CrossRef]
  56. Chen, W.; Shahabi, H.; Shirzadi, A.; Li, T.; Guo, C.; Hong, H.; Li, W.; Pan, D.; Hui, J.; Ma, M. A novel ensemble approach of bivariate statistical-based logistic model tree classifier for landslide susceptibility assessment. GeoIn 2018, 33, 1398–1420. [Google Scholar] [CrossRef]
  57. Moslem, S.; Ghorbanzadeh, O.; Blaschke, T.; Duleba, S. Analysing Stakeholder Consensus for a Sustainable Transport Development Decision by the Fuzzy AHP and Interval AHP. Sustainability 2019, 11, 3271. [Google Scholar] [CrossRef] [Green Version]
  58. Theodoridou, P.; Varouchakis, E.; Karatzas, G. Spatial analysis of groundwater levels using Fuzzy Logic and geostatistical tools. J. Hydrol. 2017, 555, 242–252. [Google Scholar] [CrossRef]
  59. Negnevitsky, M.; Intelligence, A. Artificial Intelligence: A Guide to Intelligent Systems, 2nd ed.; Addison-Wesley Inc.: New York, NY, USA, 2005. [Google Scholar]
  60. Zadeh, L.A. Fuzzy sets. Inf. Control 1965, 8, 338–353. [Google Scholar] [CrossRef] [Green Version]
  61. Mamdani, E.H. Application of fuzzy algorithms for control of simple dynamic plant. In Proceedings of the Institution of Electrical Engineers; IET: London, UK, 1974; pp. 1585–1588. [Google Scholar]
  62. Ghorbanzadeh, O.; Moslem, S.; Blaschke, T.; Duleba, S. Sustainable Urban Transport Planning Considering Different Stakeholder Groups by an Interval-AHP Decision Support Model. Sustainability 2018, 11, 9. [Google Scholar] [CrossRef] [Green Version]
  63. Duleba, S.; Moslem, S. Examining Pareto optimality in analytic hierarchy process on real Data: An application in public transport service development. Expert Syst. Appl. 2019, 116, 21–30. [Google Scholar] [CrossRef]
  64. Saaty, T.L. Relative measurement and its generalization in decision making why pairwise comparisons are central in mathematics for the measurement of intangible factors the analytic hierarchy/network process. RACSAM 2008, 102, 251–318. [Google Scholar] [CrossRef]
  65. Ghorbanzadeh, O.; Feizizadeh, B.; Blaschke, T. An interval matrix method used to optimize the decision matrix in AHP technique for land subsidence susceptibility mapping. Environ. Earth Sci. 2018, 77, 584. [Google Scholar] [CrossRef]
  66. Tang, A.; Wen, A. An intelligent simulation system for earthquake disaster assessment. Comput. Geosci. 2009, 35, 871–879. [Google Scholar] [CrossRef]
  67. Asghar Pour, M.J. Multi-Criteria Decision Making; University of Tehran Publications: Tehran, Iran, 2008. [Google Scholar]
  68. Ghorbanzadeh, O.; Feizizadeh, B.; Blaschke, T. Multi-criteria risk evaluation by integrating an analytical network process approach into GIS-based sensitivity and uncertainty analyses. Geomat. Nat. Hazards Risk 2018, 9, 127–151. [Google Scholar] [CrossRef] [Green Version]
  69. Saaty, L. An analytical hierarchy and network processes approach for the measurement in tangible criteria and for decision making; Multiple Criteria Decision, Analysis: State of The Art Surveys, Edited by Jose Figueira et. al. State Art Surv. 2005, 345–406. [Google Scholar] [CrossRef]
  70. Saaty, T.L. Fundamentals of the analytic network process. In Proceedings of the 5th International Symposium on the Analytic Hierarchy Process, Kobe, Japan, 12–14 August 1999; pp. 12–14. [Google Scholar]
  71. Zebardast, E. Constructing a social vulnerability index to earthquake hazards using a hybrid factor analysis and analytic network process (F’ANP) model. Nat. Hazards 2013, 65, 1331–1359. [Google Scholar] [CrossRef]
  72. Yager, R.R. On ordered weighted averaging aggregation operators in multicriteria decisionmaking. IEEE Trans. Syst. Man Cybern. 1988, 18, 183–190. [Google Scholar] [CrossRef]
  73. Malczewski, J. GIS and Multicriteria Decision Analysis; John Wiley & Sons: Hoboken, NJ, USA, 1999. [Google Scholar]
  74. Liu, X.; Han, S. Orness and parameterized RIM quantifier aggregation with OWA operators: A summary. Int. J. Approx. Reason. 2008, 48, 77–97. [Google Scholar] [CrossRef] [Green Version]
  75. Shafapour Tehrany, M.; Shabani, F.; Neamah Jebur, M.; Hong, H.; Chen, W.; Xie, X. GIS-based spatial prediction of flood prone areas using standalone frequency ratio, logistic regression, weight of evidence and their ensemble techniques. Geomat. Nat. Hazards Risk 2017, 8, 1538–1561. [Google Scholar] [CrossRef]
  76. Ayalew, L.; Yamagishi, H. The application of GIS-based logistic regression for landslide susceptibility mapping in the Kakuda-Yahiko Mountains, Central Japan. Geomorphology 2005, 65, 15–31. [Google Scholar] [CrossRef]
  77. Wright, R.E. Logistic regression. In Reading and Understanding Multivariate Statistics; Grimm, L.G., Yarnold, P.R., Eds.; American Psychological Association: Washington, DC, USA, 1995; pp. 217–244. [Google Scholar]
  78. Avand, M.; Janizadeh, S.; Naghibi, S.A.; Pourghasemi, H.R.; Khosrobeigi Bozchaloei, S.; Blaschke, T. A comparative assessment of Random Forest and k-Nearest Neighbor classifiers for gully erosion susceptibility mapping. Water 2019, 11, 2076. [Google Scholar] [CrossRef] [Green Version]
  79. Shahabi, H.; Jarihani, B.; Tavakkoli Piralilou, S.; Chittleborough, D.; Avand, M.; Ghorbanzadeh, O. A Semi-Automated Object-Based Gully Networks Detection Using Different Machine Learning Models: A Case Study of Bowen Catchment, Queensland, Australia. Sensors 2019, 19, 4893. [Google Scholar] [CrossRef] [Green Version]
  80. Achour, Y.; Pourghasemi, H.R. How do machine learning techniques help in increasing accuracy of landslide susceptibility maps? Geosci. Front. 2019. [Google Scholar] [CrossRef]
  81. Jaafari, A.; Zenner, E.K.; Panahi, M.; Shahabi, H. Hybrid artificial intelligence models based on a neuro-fuzzy system and metaheuristic optimization algorithms for spatial prediction of wildfire probability. Agric. For. Meteorol. 2019, 266, 198–207. [Google Scholar] [CrossRef]
Figure 1. Location of the study area in Iran.
Symmetry 12 00405 g001
Figure 2. Layers standardized in this study. (a). Area of each piece, (b). Building with inappropriate materials, (c). Land use, (d). Distance from the hospital, (e). Distance from the fire station, (f). The number of floors, (g). Distance from the Street, (h). Altitude, (i). Lithology, (j). Distance from Fault, (k). Slope, (l). Distance from the stream, (m). Population density, (n). Percent of population under 4 years old and over 70 years old, (o). Family density.
Symmetry 12 00405 g002aSymmetry 12 00405 g002bSymmetry 12 00405 g002cSymmetry 12 00405 g002d
Figure 3. Geological units of the study area.
Symmetry 12 00405 g003
Figure 4. Flowchart of the method used in this study.
Symmetry 12 00405 g004
Figure 5. Training sites map extracted from A-ordered weight averaging (OWA) and A-fuzzy hybrid models.
Symmetry 12 00405 g005aSymmetry 12 00405 g005b
Figure 6. R-Index for susceptibility classes.
Symmetry 12 00405 g006
Figure 7. Resulting earthquake vulnerability maps based on hybrid models of (a) A-fuzzy, (b) A-OWA, (c) fuzzy-logistic regression (LR) and (d) OWA-LR.
Symmetry 12 00405 g007aSymmetry 12 00405 g007b
Figure 8. Area under the relative operating characteristic (ROC) curve (area under curve; AUC) for hybrid models.
Symmetry 12 00405 g008
Table 1. Characteristics of Faults in the Study Area.
RowFault NameFault TypeFault Length
(Km)
Minimum Distance from the Site (km)Maximum Distance from the Site (km)
1Morvaridstrike-slip fault232943
2Sartakhtstrike-slip fault753971
3Piranshahrstrike-slip fault14934150
4Dinoorstrike-slip fault5266111
5Sahnehstrike-slip fault47103150
6Nahavandstrike-slip fault16133150
7ZagrosRivers fault25091150
8Garunstrike-slip fault47133138
9Takht soleamanstrike-slip fault30130150
Table 2. Geological formations present in the Study Area.
UnitDescriptionPercent
k2avAndesite volcano1
kpefLimestone and conglomerate1
kuplLimestone8
kusshDark gray hose and Sandstone 68
peEfSandstone and calcareous ash2
Qft2Quaternary formation20
Table 3. Fuzzy Operators.
OperatorMathematical Expression
X AND YMin (X, Y)
X OR YMax (X, Y)
not X1-X
Table 4. The Fundamental Scale for Making Judgments [66].
DefinitionThe Intensity of Relative Importance
Extremely Preferred9
Very strongly Preferred7
Strongly Preferred5
Moderately Preferred3
Equally Preferred1
Intermediate Values Between2, 4, 6, 8
Table 5. The Normalized Weights for the Classes of the Factors Based on Multi-Criteria Decision Analysis (MCDA) Models.
GroupFactorsClassPixels in DomainPercentage of DomainWeight of
AHP-ANP
Eigenvalue AHP-ANP
PhysicalArea<10025490.600.059450.006
100–200341,10380.720.807
200–30095542.260.023
300–400273316.470.065
400<420519.950.100
Inappropriate materials<2025490.600.059440.006
20–40390,55492.420.924
40–60219475.190.052
60–8062811.490.015
80<12570.300.003
Land useGroup 126980.640.078250.006
Group 265321.550.015
Group 349091.160.012
Group 4314,58274.440.744
Group 59386722.210.222
Distance from hospital<100026130.620.068630.006
1000–2000115,24127.270.273
2000–3000154,42236.540.365
3000–400085,55320.250.202
4000<6475915.320.153
Distance from fire station<130026130.620.068890.006
1300–240088,34120.900.209
2500–360089,14121.090.211
3700–480097,46323.060.231
4800<145,03034.320.343
Number of floors1 Floor320,80975.920.068660.759
2 Floor32,5037.690.077
3 Floor46,25710.950.109
4 Floor16,5483.920.039
5 Floor64711.530.015
Distance from the Street<10025780.610.060540.006
100–20027,6496.540.065
200–30015,4733.660.037
300–40030,8917.310.073
400<345,99781.880.819
EnvironmentalAltitude<140025600.610.039290.006
1400–1500131243.110.031
1500–1600175,33441.490.415
1600–1700182,58243.210.432
1700<48,98811.590.116
LithologyK2av14840.350.079350.004
Kupl46011.090.011
Kussh33,5177.930.079
PeEf288,31568.230.682
Qft294,67122.400.224
Distance from Fault<130025490.600.087660.006
1300–240056,65513.410.134
2400–3500100,96723.890.239
3500–4600113,18426.780.268
4600<149,23335.310.353
Slope<1025600.610.046090.006
10–15328507.770.078
15–20149,96335.490.355
20–25118,41228.020.280
25 <118,80328.110.281
Distance from stream< 30025580.610.060540.006
300–600322,25676.260.763
600–90047,55311.250.113
900–120024,0515.690.057
1200<26,1706.190.062
SocialPopulation density<3525490.600.088100.006
35–92193,19445.720.457
93–15077,68018.380.184
160–23071,06116.820.168
240–44078,10418.480.185
Percent of population<39025490.600.078090.006
400–990160,63938.010.380
1000–1700107,76125.500.255
1800–270090,44421.400.214
2800–4300061,19514.480.145
Family density<1027080.640.048790.006
11–27212,08850.190.502
28–45107,09325.340.253
46–4863,09314.930.149
69–11037,6068.900.089
Table 6. Analysis of Earthquake Susceptibility Maps Based on R Index.
Hybrid ModelClassPixelpiSV (Occurrence)PiRI
A-OWAVery Low25530.6000.000
Low136,69332.35110.004
Moderate165,17639.09330.0010
High79,18718.7400.000
Very High389799.22660.0086
A-fuzzyVery Low25510.6000.000
Low125,17529.62110.005
Moderate165,38839.14330.0011
High84,12619.9100.000
Very High45,34810.73660.0084
Table 7. ROC Curve Validation Results.
Hybrid ModelAUCStd. ErrorConfidence Interval (95%)
LowerUpper
A-fuzzy0.8050.09660.5690.945
A-OWA0.8550.08300.6270.970
Fuzzy-LR0.8500.08720.6210.968
OWA-LR0.90.06670.6830.988
Table 8. Seismic Susceptibility of Models Based on Frequency Ratio Index.
Hybrid ModelClassNo. Pixels in DomainPercentage of DomainNo. of SVPercentage of SVFR
Fuzzy-LRVery Low20,0684.75000
Low113,84926.942102.20
Moderate75,27217.812103.32
High140,59933.27000.00
Very high72,80017.2363010.30
OWA-LRVery Low15,2543.61000.00
Low169,86140.20150.74
Moderate105,31024.922102.37
High59,44014.07000.00
Very high72,72317.2173512

