1. Introduction
Herding behavior in financial markets has been extensively documented [
1,
2,
3,
4,
5,
6,
7]. Due to information asymmetry and distortion [
8], an investor may make investment decisions independently or by following the observations of other investors [
9]. A contiguous investment trend may then emerge in the investor network and cause market volatilities. In recent years, digital innovation has propelled the rapid expansion of the internet investment market, and the investment trend of internet investment products has drawn increasing research interest.
An internet investment product (IIP) is a personal investment product that is launched by financial institutions and is displayed and sold on online platforms [
10]. By the end of 2017, China’s the value of transactions for internet financial products reached 15 trillion CNY, which was approximately 20% of the GDP for that year [
11]. When faced with information regarding an unfamiliar IIP, an individual is more likely to consider making investments when a large population is investing in it, especially when close friends have made investments.
Empirical and experimental research has been conducted to study herding behavior in the financial market. In [
3,
12], the authors identified a more significant herding propensity in groups of stocks than in individual stocks, and found that a greater genetic diversity of agents resulted in less herding [
12]. In [
13], the authors concluded that both amateur and professional investors show herding tendencies, while the former exhibit a greater propensity. In [
14], the authors investigated the herding behavior of fund managers, and discovered more evidence of herding under a fixed price than a flexible price. In addition, herding tends to exist under performance evaluation conditions with a fixed price, but nearly vanishes under performance evaluation conditions with an unfixed price. In [
15], the authors found that speculative signals in the oil market lead to less herding, and that evident herding exists in turbulent periods. In [
16], the authors discovered that both the quality of an opinion leader’s private information and the proportion of opinion leaders are positively correlated to the herding tendency of their followers, and different effects on market volatility have been identified. In [
17] the authors studied the awareness threshold of herding in networks. In [
18], the authors defined a network based on the correlation of mutual fund returns. The authors discovered a decline of herding in stressful market phases and that network structure plays an explanatory role in herding. In [
19], the authors proposed a three state herding model in financial markets, meaning that statistical features observed in high-frequency financial markets can be reproduced. In [
20], the authors found that the multi-level herding mechanism explains the generation of sector structure in financial systems. In [
21], the authors concluded that herding contributes to the leverage and anti-leverage effects in financial systems.
In summary, herding behavior has significant impacts on—and explains statistical features within—financial markets, and the extent of investors’ herding tendencies may vary for different reasons [
22]. However, few studies shed light on the influence of the shift between independent investment decisions and herding behavior. Our research aims to solve this problem in the context of investor social networks. In this paper, we introduce a model to investigate how the shift between independent judgment and herding behavior impacts the diffusion of investment decisions. In
Section 2, the theoretical model is constructed by considering the modular structure of the social network and the herding tendency. In
Section 3, the validity of our model is examined by comparing the numerical result with real data gathered from an IIP online platform, and numerical analyses are conducted to explore the phase transition of the diffusion process. Main conclusions and practical suggestions are summarized in
Section 4.
2. Theoretical Framework
Herding behavior can be formed via social ties [
16]. Based on the study in [
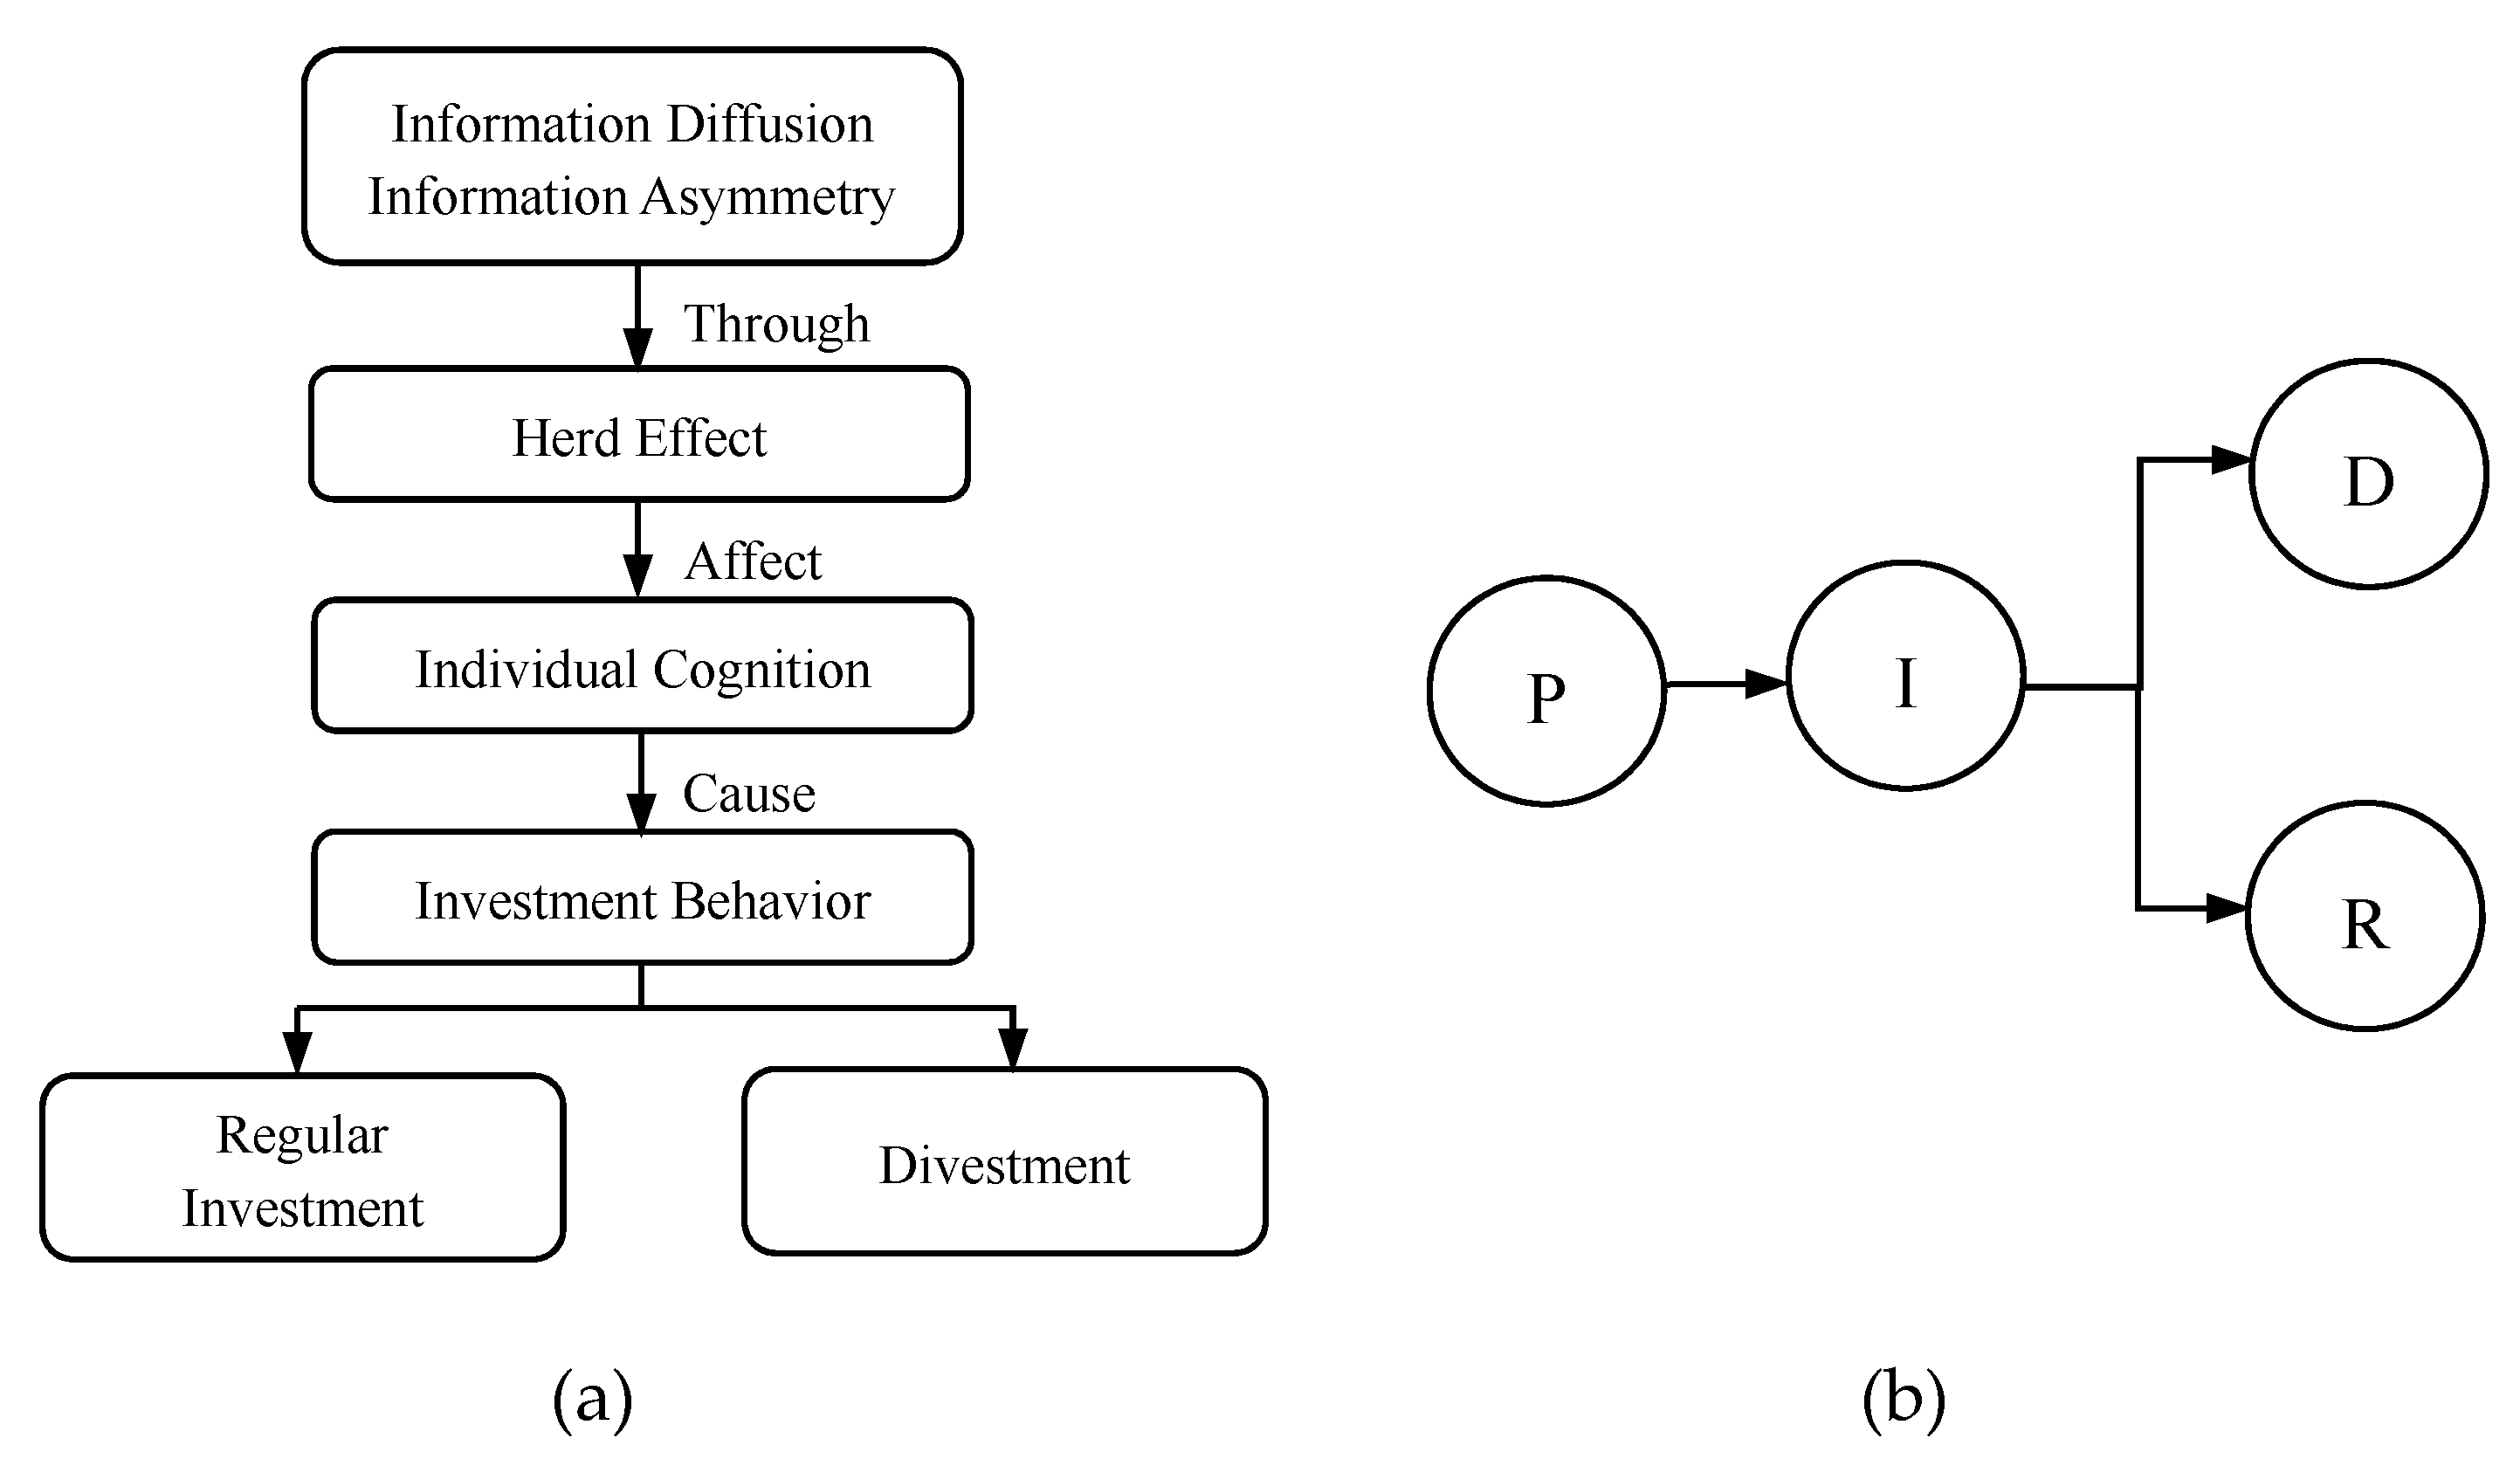
10], we propose a diffusion model of an IIP, considering the community structure of the social network and the herding tendency of the potential investors. The information cascade and investor decision process are outlined in
Figure 1a (modified from [
8]).
As shown in
Figure 1a, the information of an IIP disseminates in an investor social network, leading to diffusion of individual cognition via the herd effect and accordingly causing the diffusion of investment behavior. Next, we introduce a model to describe the above diffusion process. Epidemic models have been extensively applied in studying investment behavior [
23,
24,
25,
26]. Therefore, we apply an epidemic spreading mechanism in our model. The diffusion process is presented in
Figure 1b. There are four types of nodes, namely the potential investor (P), investor (I), divestor (D), and regular investor (RI), the interpretations of which are as follows.
P (potential investor): This node has not invested in an IIP and will be influenced to make an investment when contacting the investor nodes from the same or a different community, i.e., the nodes in states I and RI.
I (investor): This node is affected by existing investors and decides to make a temporary investment in the IIP. The investment decision is the result of both independent judgment and herding behavior. The I node will either withdraw all the investment and become a divestor, or make a regular investment and become an RI node.
RI (regular investor): This node makes regular investments in the IIP.
D (divestor): This node withdraws all of the principle and the interest, and will not make further investments.
We denote the numbers of P, I, RI, and D nodes at time t in community
as
,
,
, and
, respectively, and the total number of these four types of nodes as P(t), I(t), R(T), and D(T), respectively. Next, we demonstrate the transition process between these four types of entities. We denote indicator function
to imply whether a P node makes an investment and becomes an I node during
. Here,
suggests that the potential investor is transformed into a temporary investor; otherwise,
. Similarly,
indicates whether an I node quits the investment and becomes a D node during
. Here,
means the transition happens;
means otherwise. Additionally,
represents the migration event between state I and state RI during
. Here,
suggests that migration occurs;
means otherwise. Therefore, the number of temporary investors in community i, i.e.,
, can be described as Equation (1) as follows.
We denote the probability that a potential investor in community
transfers into a temporary investor as
. Because the diffusion of cognition precedes the diffusion of adoption [
27], we define
where
denotes the probability of receiving the information of an IIP, and
indicates the probability of adopting and investing on the IIP. We assume that
is drawn from an exponential distribution with parameter
An individual investment decision is comprised of the herding mentality and independent judgement, thus we assume that
where
measures the herding mentality and
describes the independent willingness of adoption [
28]. Assume that
~N(
,
), where
represents the individual acceptance level under one’s independent judgement. Here,
represents the weight of the herding mentality, and
implies the weight of the independent judgement. We assume that
. The herding behavior of an entity in community
is related to the percentage of temporary and regular investors in the same or different communities, and is correlated with the network structure. The network structure is characterized by clustering coefficient
and modularity Q.
measures the density of edges between nodes inside a community. For an individual in community
, the influence of R and I nodes in community i is positively correlated with
. Q outlines the density of edges between two communities, and is negatively related to the affection possibility between communities [
29]. Therefore, we set
where N is the total number of all entities and K is the number of communities.
[
29]. Thereby, the probability of
is
We denote
, thus
Similarly, we assume that the probability of an I node transferring into a D node is drawn from the exponential probability with parameter
, and the probability of the transition from I to RI is drawn from the exponential probability with parameter
[
10], then we have
Taking expectations on both sides of Equation (1), we have the following
Then, taking limitations on both sides, we have
Now we have obtained all the partial equations for our model, the solutions of which describe the dynamics of P, I, R, and D nodes.
3. Results and Discussion
In this section, we explore the phase transition of the number of R nodes under different parameter settings. To have an intuitive outline of the diffusion pattern, we assume that there are 3000 individuals evenly dispersed in 5 communities. Without a loss of generality, at the beginning, only one entity in one community carries the information of the IIP. The information is then disseminated when it contacts individuals inside or outside its community. Here, the information spreading rate
, divestment rate
, regular investment rate
, the mean value of clustering coefficient b = 0.7, clustering coefficient
, modularity Q = 0.9, the mean value of herding propensity
, the mean of independent acceptance willingness
, independent adoption willingness
~N(
,
), herding propensity
~N(
,
), and the diffusion lifetime T = 200,000. These parameter settings are default settings hereafter.
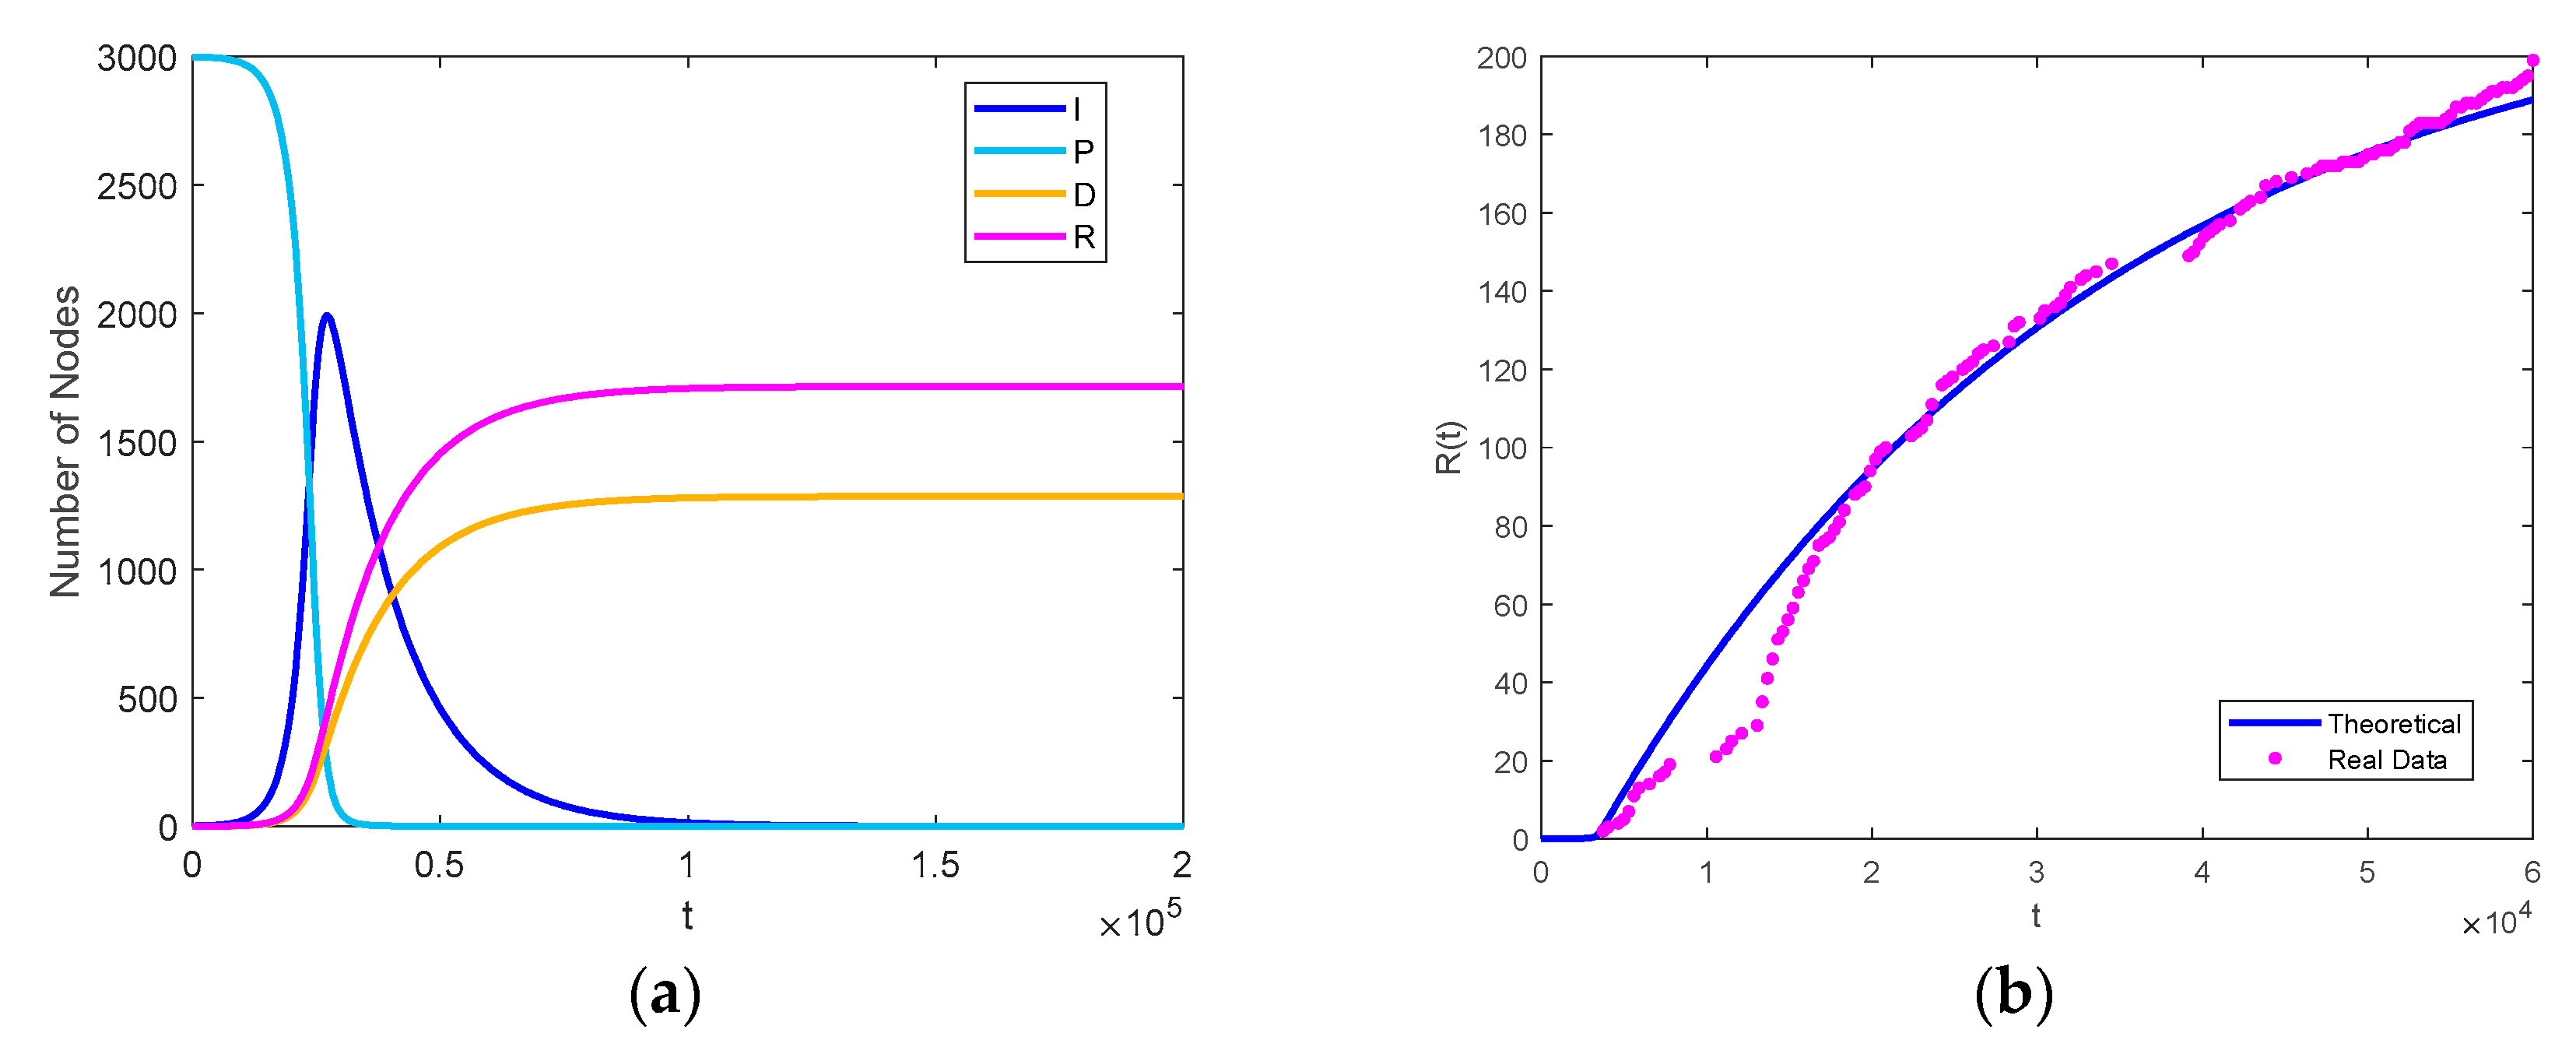
Figure 2 shows how the numbers of all types of nodes change over time. In
Figure 2a, the number of potential investors shows a sharp drop at the explosive stage of the diffusion. The number of temporary investors increases rapidly to a peak and then slowly decreases to zero. The numbers of regular investors and divestors undergo explosive growth and then remain unchanged in the end.
To examine the validity of our model, we collected real data from the Daily Mutual Fund website [
30], where each IIP represented on this website has its own forum. One can follow other users or the IIP forum they are interested in and make posts on the forum about their thoughts on the relevant IIP. When an IIP has an option for regular investment, the user will automatically make a post stating, “I started a regular investment plan.” The IIP we select is called South Daily Money Market Fund B (mutual fund code 003474). It is a money market fund product issued by China Southern Asset Management Co., Ltd., and is one of the most popular mutual funds on the Daily Mutual Fund website. We reviewed all 6237 posts on its forum. To gain a better view of the diffusion scope, we eliminated all repeated posts (i.e., where one user posted several posts, only the first post or the post that started a regular investment plan was retained). Finally, we singled out 2456 posts up until 11 July 2019, among which 193 users started regular investment plans. The first regular investor claimed a regular investment plan on 30 December 2018, suggesting 193 days duration of the diffusion of adoption. According to [
31], risk averse investors are prone to follow the crowd. A money market fund is a low risk investment product, so we assume that the average risk aversion level of its investors is relatively low, and thus we set the herding coefficient as
. Since there is no clustered following relationship among these users, they are regarded as residing in one community. The growth pattern of the number of regular investors is depicted in
Figure 2b. Red dots represent the real data generated from the stated forum, and the full line implies the theoretical result. The overall mean error is 9.29%, and after t = 20,000; that is, 64.3 days after the beginning of the diffusion, the mean relative error becomes 1.82%, indicating that our model is valid in explaining the diffusion trend, especially after the initial stage of the diffusion.
3.1. The Effect of the Herding Coefficient
In this section, we study how the independent acceptance willingness interferes with the impact of the herding tendency. In our model, herding tendency is measured by
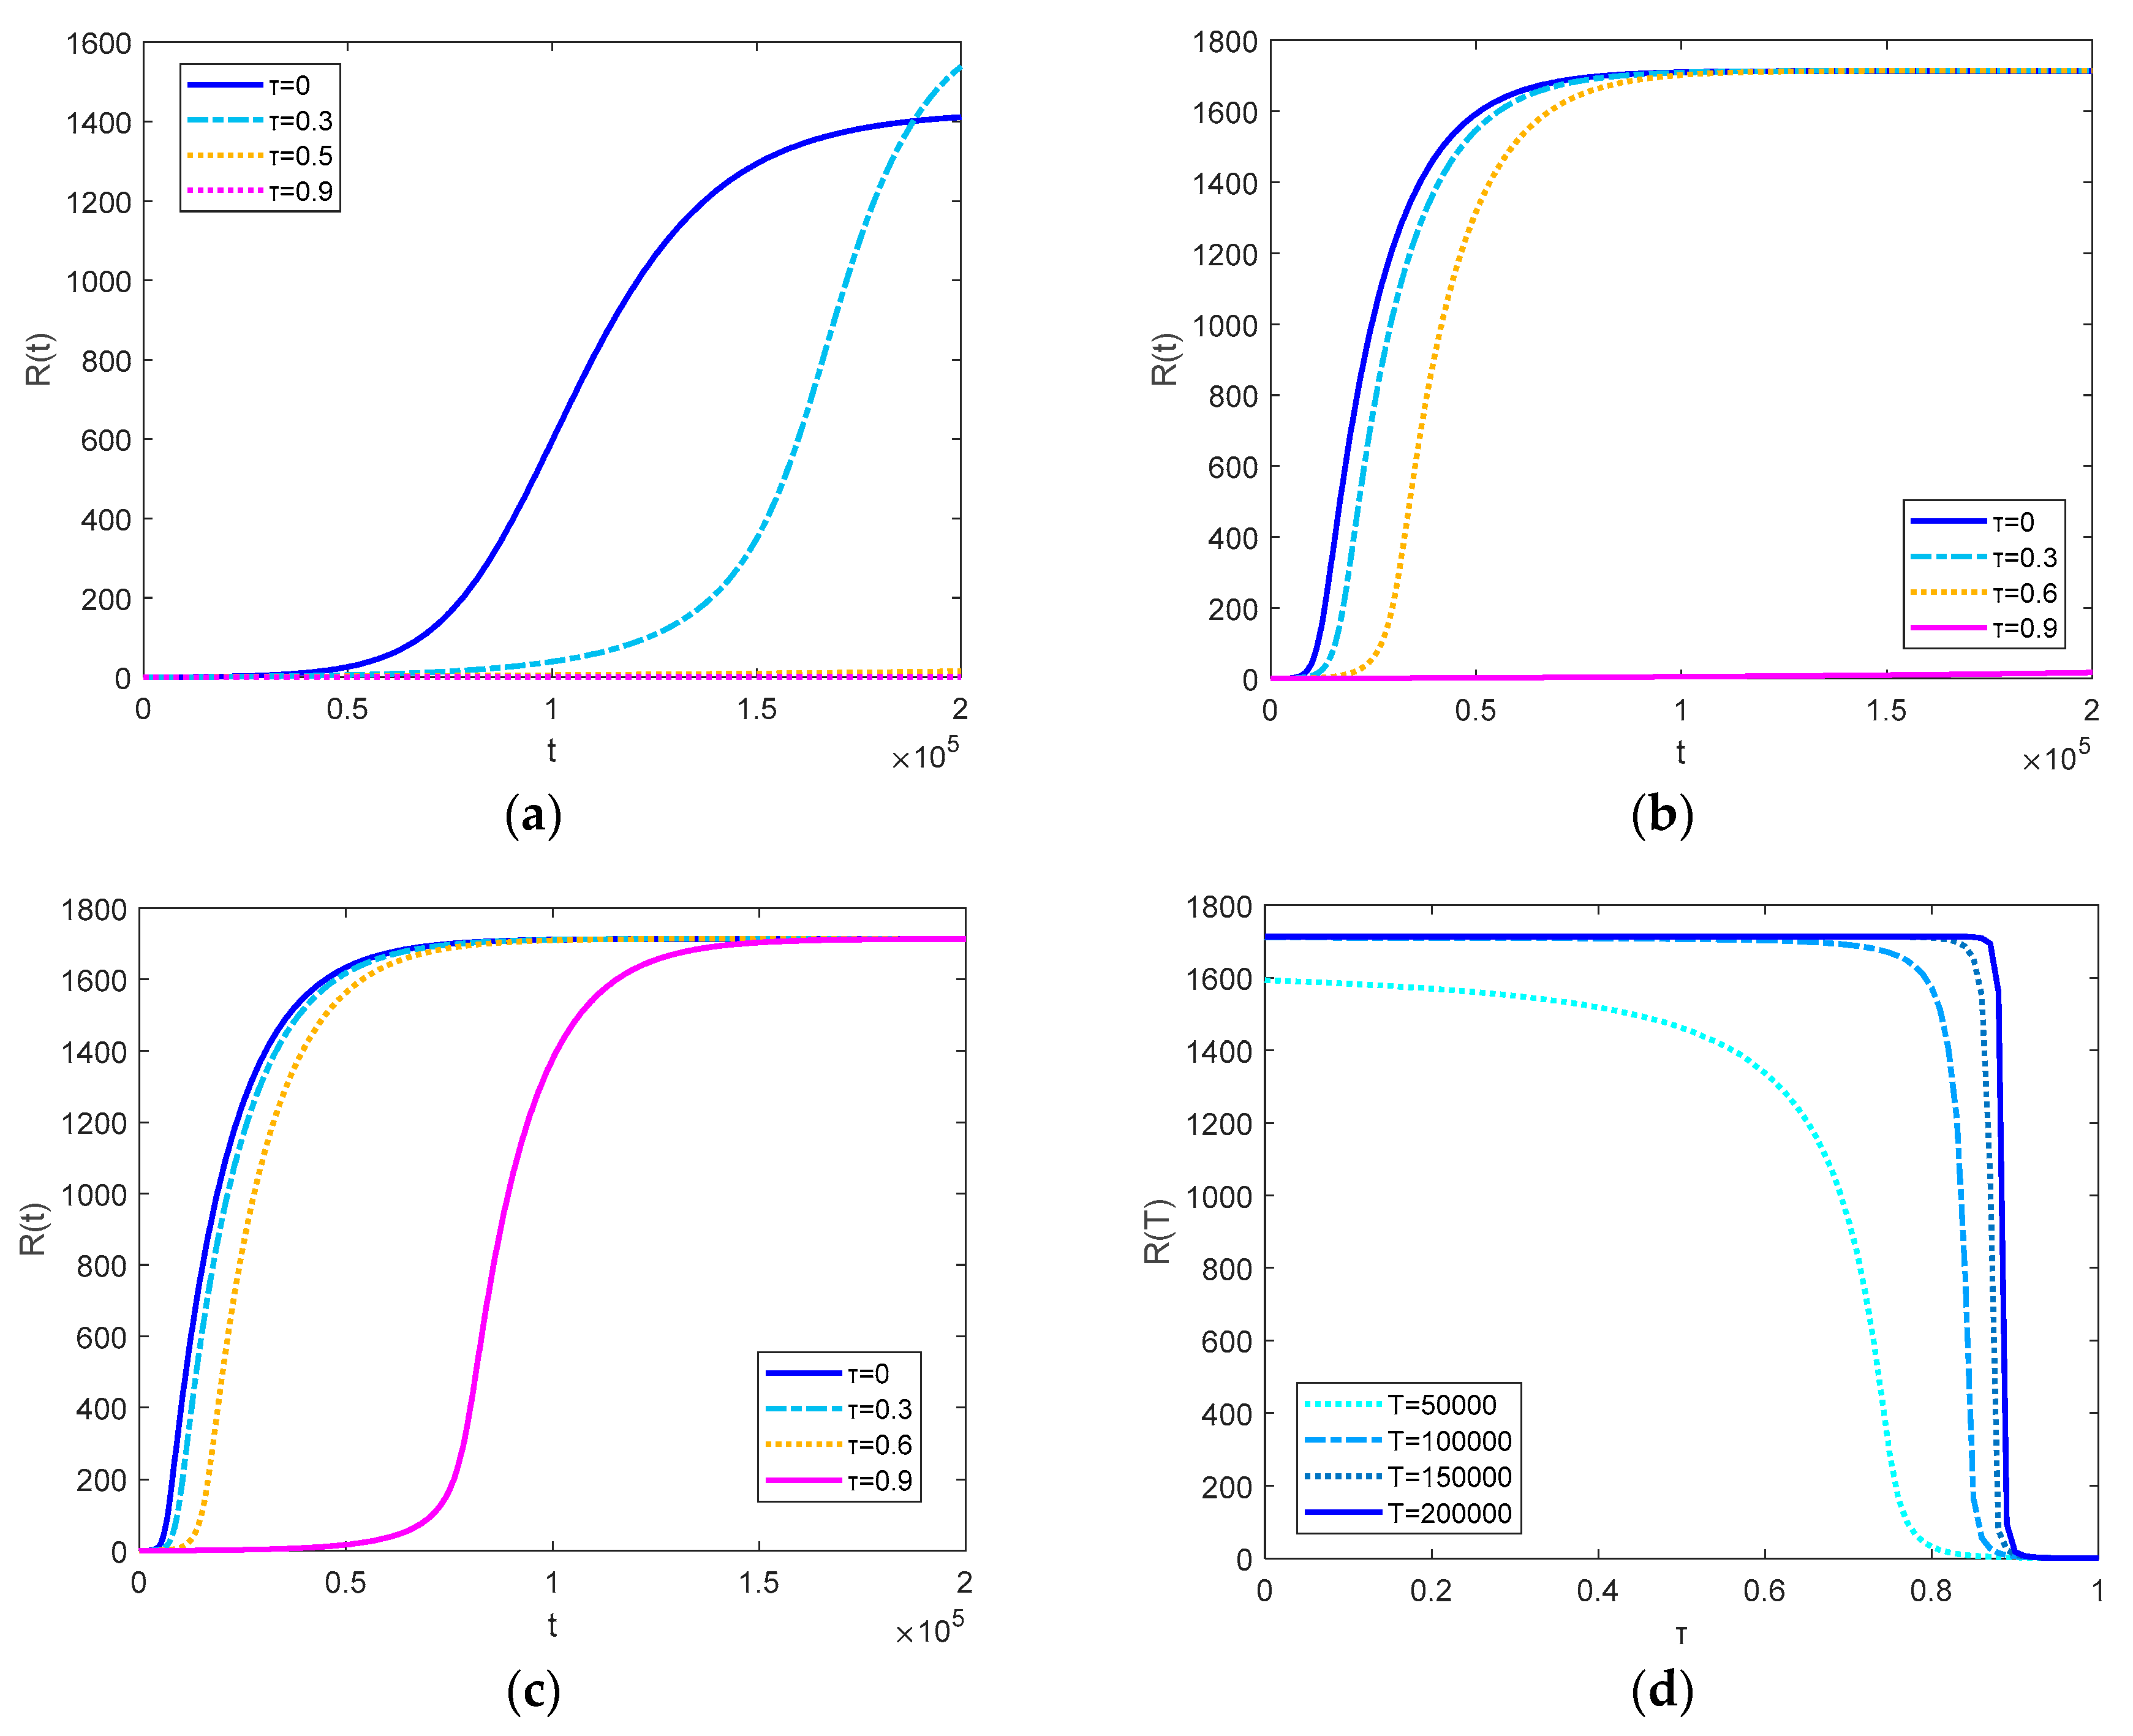
, the weight of herding mentality, and it is positively correlated to the tendency to follow the decision of the crowd. The changes of the numbers of R nodes with different herding tendencies are plotted in
Figure 3.
In general, we can see that the increase in herding coefficient causes a delay in the outbreak time of the diffusion of an IIP. In
Figure 3a, we find that when
= 0.3, the diffusion speed is firstly slower then faster than the diffusion speed with
= 0, and there is an increase in the final diffusion scope. The reason behind this phenomenon is that independent adoption willingness is low and the probability of being affected is highly dependent on the number of affected nodes. Compared with the situation where herding tendency does not exist, the low proportion of the total number of investors suppresses the dissemination at the beginning stage of the diffusion process; however, as the diffusion proceeds and the proportion of investors grows, the probability that a potential investor will be affected increases, hence increasing the dissemination speed and enlarging the outbreak size. As
continues to increase, there is no outbreak in the diffusion. Comparing
Figure 3a–c, we find that that the increase in individual acceptance level tends to reduce this negative effect. When the individual acceptance level is rather high, the increase in herding coefficient only changes the diffusion velocity and does not affect the final diffusion size within the given time period. This is also not hard to explain. When an individual is willing to adopt the IIP, the lag caused by waiting for the trend of the crowd is compromised.
Figure 3d shows the effect of a different propagation lifetime T with τ changing from 0 to 1. In general, the increase of T narrows down the effective range (i.e., in this interval, τ is able to generate an effect on R(T)) of the herding tendency. When the total information lifetime is short (in our case, T = 50,000), the rise of the herding tendency brings about a decrease in the final diffusion scope when τ is small. When T increases to 100,000, 15,000, and 200,000, the small herding tendency does not change the outbreak size, and with the increase of T, the threshold for τ to have an impact is increased and the decrease caused by τ is sharper. Such findings suggest that when the propagation time is long enough, in a rather wide range the herding tendency will not jeopardize the outbreak size, but when the propagation lifespan is short, any increase in herding tendency will cause a drop in the diffusion size until it decreases to 0.
In summary, the results show that when the overall independent acceptance willingness is low, a small extent of herding tendency promotes the diffusion of the outbreak size, however when independent acceptance willingness is relatively high, herding suppresses the diffusion speed and causes a delay in outbreak time. Further, when the propagation lifetime is long enough, a small increase in herding tendency may lead to a steep drop in the outbreak size.
3.2. Effect of the Clustering Coefficient Considering Herding Tendency
Now, we focus on the influence of the clustering coefficient, which is represented by parameter b, with a different herding tendency τ. The numerical results are plotted in
Figure 4.
By comparing
Figure 4a–c, the results show that the increase in herding coefficient inclines to postpone the outbreak time of the diffusion. In addition, it magnifies the positive effect of the clustering coefficient on both propagation scope and velocity. It slows down the diffusion process, but highlights the influence of the network structure. One possible explanation is that when people tend to imitate others’ behaviors, a higher clustered network suggests a higher probability of being influenced. Accordingly, when the propagation lifespan is long enough and the herding coefficient is relatively high, the promotion strategy of increasing the connection density inside a community profits from the imitation behavior.
3.3. Effect of Modularity with Changing Herding Tendency
Next, we explore the effect of modularity Q with a different herding tendency. The results are demonstrated in
Figure 5. When τ = 0.6 and τ = 0.7, the reduction of Q has a descending positive impact on the diffusion speed and presents no influence on the dissemination scope. When τ = 0.8, the reduction of Q leads to an evident acceleration in the propagation velocity and a remarkable increase in the diffusion scope.
Comparing
Figure 5a–c, conclusions similar to those made in
Section 3.2 can be obtained. The increase in herding coefficient amplifies the negative effect of the modularity. In other words, the increase in Q causes more severe reductions in both diffusion speed and diffusion scope when a larger herding coefficient is involved.
3.4. Mutual Effect of Herding Tendency and Network Structure
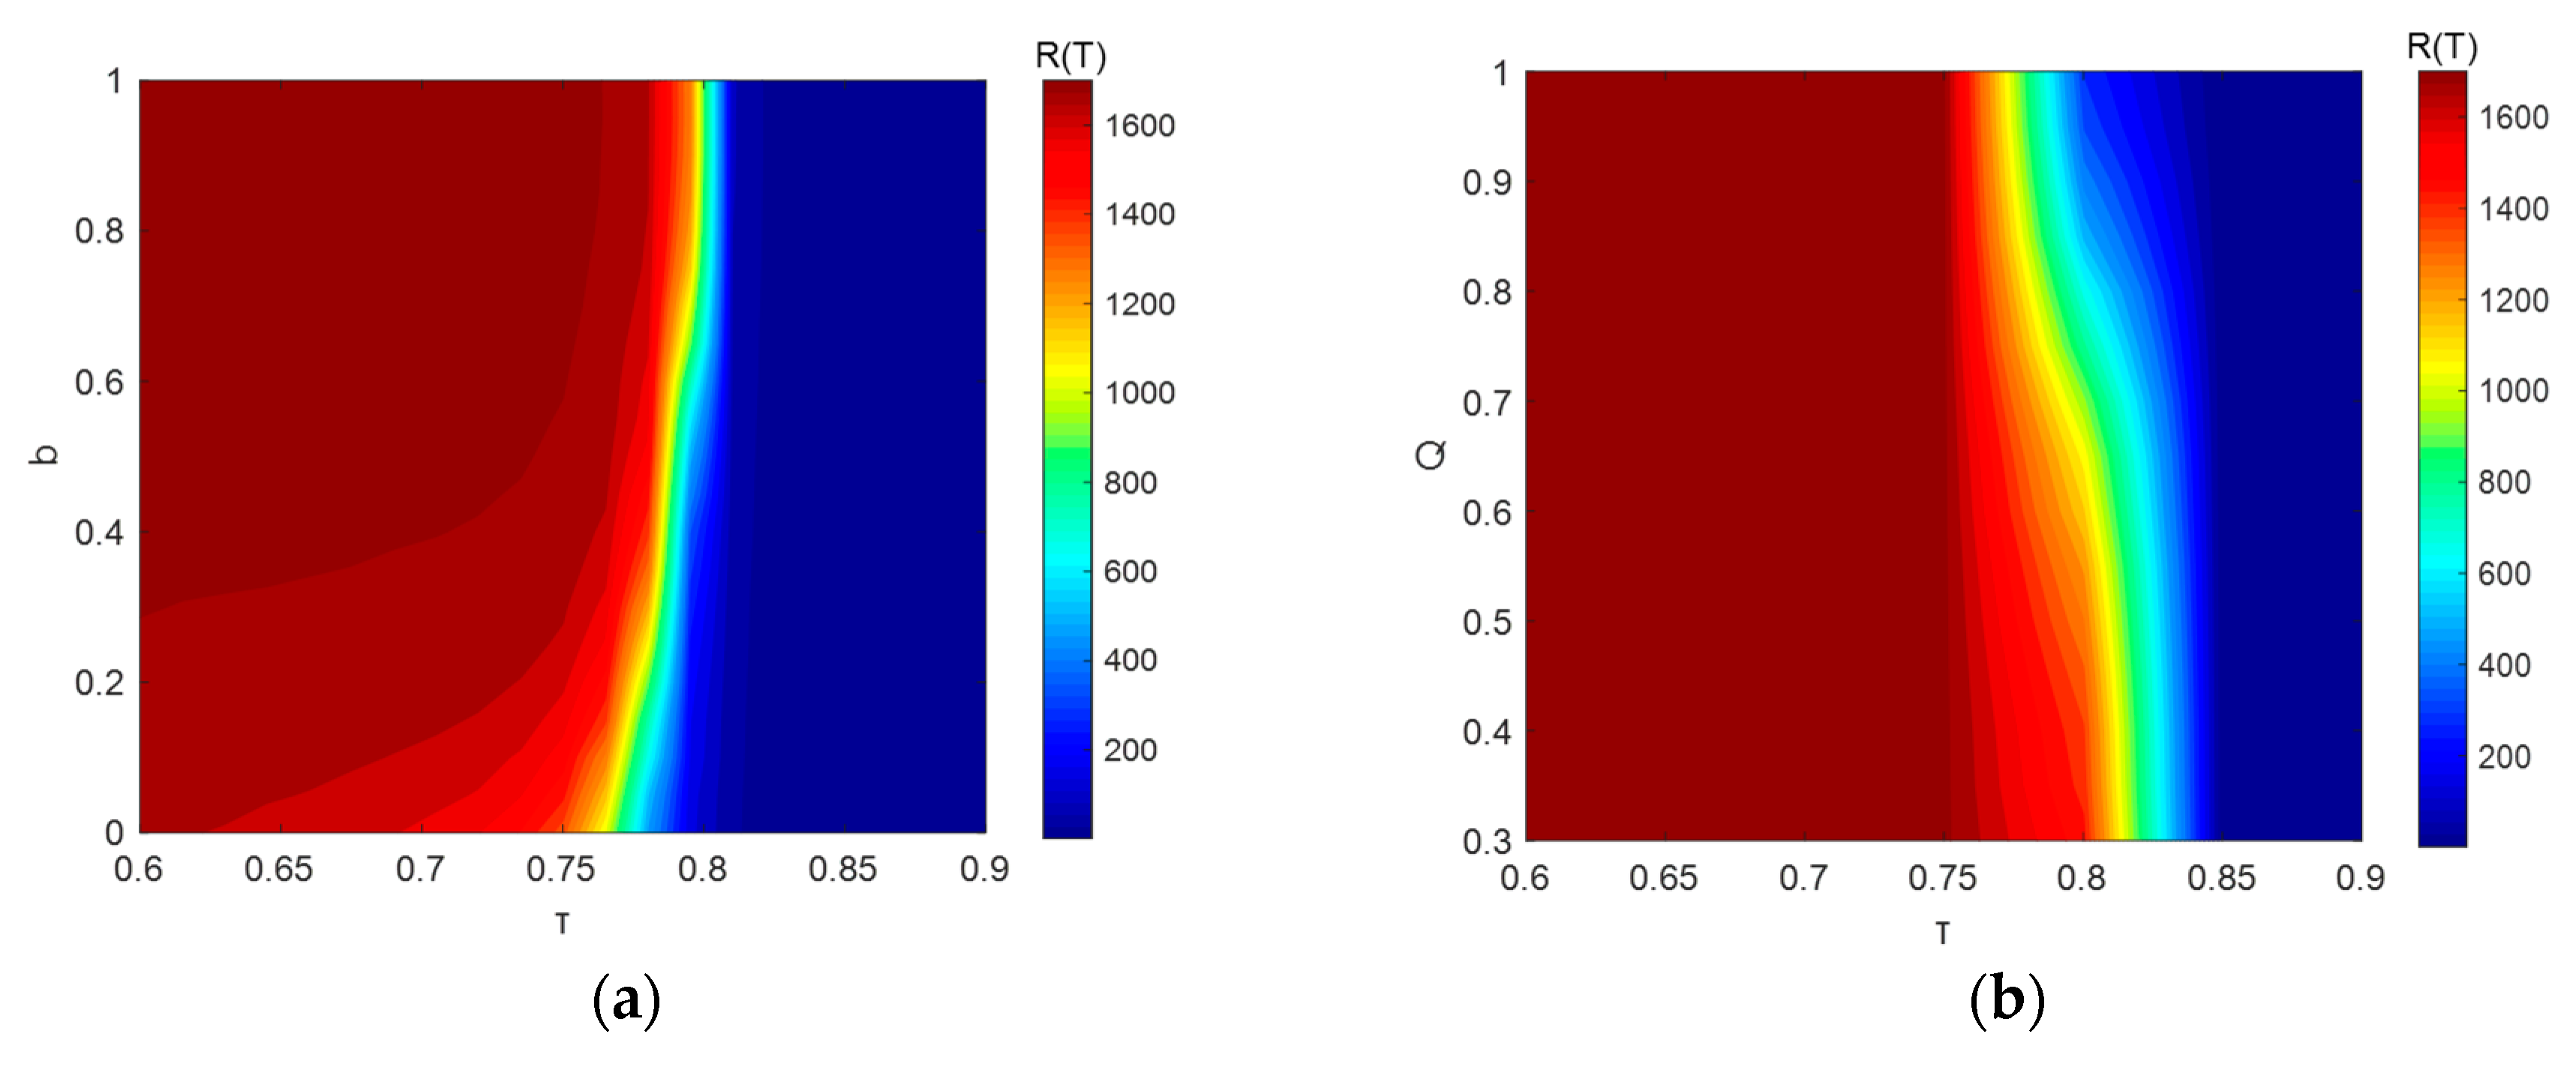
In this section, we investigate the mutual effect of the herd effect and network structure on the final diffusion scope. Firstly, the contour plot of R(T) with changing τ and the clustering coefficient is depicted in
Figure 6a. The results show that with the increase of the clustering coefficient, the effective range of τ shrinks, and the threshold of the herding tendency having an effect on the outbreak size increases. Such findings suggest that networks with high clustering coefficients have more tolerance towards the herding tendency of the crowd. The increase in herding propensity has a more severe negative impact on networks with lower clustering coefficients.
Next, we studied the mutual effect of herding propensity and the modularity Q in
Figure 6b. When τ reaches the threshold, a small increment of τ leads to a significant reduction in R(T). Regardless of which value Q takes, when τ is smaller than 0.75 or larger than 0.85, the dissemination scope cannot be manipulated by modifying the value of τ. In addition, comparing
Figure 6a and
Figure 6b, we find that the effect threshold of τ is more sensitive to the clustering coefficient than modularity, implying that with an unstable herding propensity, managing the connection density inside communities can be more efficient than managing the connection density between communities.
4. Conclusions
In this paper, we introduce a model to study the diffusion of investment decisions of an IIP by considering the investor social network structure and herding tendency. The validity of the theoretical model is verified by real data generated from a financial forum. The main findings can be summarized as follows.
Firstly, our findings suggest that when independent acceptance willingness is low, the limited extent of the herding tendency increases the diffusion scope. With the improvement of independent adoption willingness, the increase in herding tendency presents a negative effect on the diffusion of an IIP. This slows down the diffusion velocity and detains the outbreak time of the dissemination. In addition, the increase in the individual acceptance level under independent judgement would cripple such a negative influence.
Secondly, the expansion of the propagation timespan narrows down the effective range of the herding tendency and raises its effective threshold. Further, in regard to the diffusion speed, the increment in herding propensity strengthens the positive effect of the clustering coefficient and the negative impact of the modularity, implying that when there are signs of a rising herding tendency, increasing the clustering coefficient or reducing the modularity may achieve additional outcomes.
Finally, with respect to the outbreak size, the effective threshold of the herding tendency is positive correlated to the clustering coefficient, and it is more sensitive to the clustering coefficient. These results suggest that with an unstable herding propensity, improving connections inside communities would be more efficient.
Our study fills a research gap in the existing literature by investigating the impact of the shift between independent judgement and herding tendency. Theoretically, our work enriches the literature that addresses investor herding behavior and information diffusion in social networks. Practically, with the knowledge that herding tendency varies under different conditions, this work provides insights into predicting investor group behavior when the trend of the herding propensity of the crowd is known. In future works, further impacts on market volatility, systematic risk, or asset prices can be explored.


