Abstract
Sustainable products and their marketing have played a crucial role in developing more sustainable consumption patterns and solutions for socio-ecological problems. They have been demonstrated to significantly decrease social consumption problems. Neuromarketing has recently gained considerable popularity and helped companies generate deeper insights into consumer behavior. It has provided new ways of conceptualizing consumer behavior and decision making. Thus, this research aims to investigate the factors influencing managers’ decisions to adopt neuromarketing techniques in sustainable product marketing using the fuzzy analytic hierarchy process (AHP) approach. Symmetric triangular fuzzy numbers were used to indicate the relative strength of the elements in the hierarchy. Data were collected from the marketing managers of several companies who have experience with sustainable product marketing through online shopping platforms. The results revealed that the accuracy and bias of neuromarketing techniques have been the main critical factors for managers to select neuromarketing in their business for advertising and branding purposes. This research provides important results on the use of neuromarketing techniques for sustainable product marketing, as well as their limitations and implications, and it also presents useful information on the factors impacting business managers’ decision making in adopting neuroscience techniques for sustainable product development and marketing.
1. Introduction
Given the growing competitiveness of today’s economy, innovation in products helps economic growth [1,2], encourages differentiation, and creates sustainable competitive advantages for companies [2]. Marketing for sustainability, also known as green marketing, is a marketing technique in which a business targets social and environmental resources [3]. Sustainable products and their marketing have played a crucial role for developing more sustainable consumption patterns and solutions to socio-ecological problems [4]. They have demonstrated to be significantly important in decreasing the societies’ consumption problems [2]. Studies in marketing have demonstrated that nowadays, consumers are more interested in buying sustainable products [2] and willing to pay for sustainable products because of their benefits in alleviating socio-ecological problems [5].
Consumer neuroscience is a newly developed burgeoning area consisting of academic studies at the intersection of marketing, neuroscience, economics, decision theory, and psychology [6]. As an interdisciplinary and broad field of research, neuromarketing is defined as an innovative tool that combines neuroscience and physiological techniques in order to gain insights in customer behavior for the effective prediction of customer preferences in the decision-making process [7]. Neuroscience can be used in marketing and consumer behavior research to refine existing marketing theories [8,9]. Neuromarketing is one of the new fields of marketing that uses brain-imaging techniques to study brain responses to marketing stimuli. Researchers employ brain imaging to reveal why and how customers decide on triggers and what parts of their brains stimulate them to take action. According to Chavaglia, Filipe [10], neuromarketing is explained by the union of neuroscience and marketing to find how consumers really make their buying decisions in online shopping.
Neuromarketing is seen as a new innovation in marketing as it involves the use of neuroscience in marketing research, in a way that examines which stimuli lead to a specific type of performance among customers. Neuromarketing tries to take the decision-making information from triggers to achieve the desired result for the marketing aims. Neuromarketing helps business to facilitate product development and marketing/advertising by understanding more about the mind of customers by the use of advances in neuroscience. Accordingly, nowadays, many companies have started around the world to provide some form of commercial neuromarketing service [11].
Neuromarketing techniques have been effective in marketing research; however, fully understating the complex cognitive processes at the individual neuronal level needs robust and advanced methods of investigation. In the last few years, many projects have been conducted to fill current gaps in methodological aspects of data analysis in fundamental and consumer neuroscience research. Although neuromarketing has added value to the current consumer research in many ways, still, marketers are not using neuroscience in sustainable product marketing to fully take advantage of the neuromarketing techniques. Neuromarketing can contribute significantly to sustainability in different ways, such as sustainable use, awareness of the solutions for environmental management, green technology adoption, and green product marketing [12]. According to [12], the development/improvement of more sustainable products, awareness regarding sustainable consumption, and effective marketing strategies for sustainable products can be the main contributions of the neuromarketing techniques in sustainability. However, few studies have investigated these issues in marketing and identified the aims of using neuromarketing techniques from the perspectives of sustainable product suppliers.
This study fills this gap by investigating the role of neuromarketing in sustainable product marketing. In addition, this paper investigates the adoption of neuromarketing techniques in sustainable product marketing from business managers’ perspectives. In this regard, firstly, a review of the existing research on neuromarketing is conducted in order to identify the neuromarketing advantages that can significantly influence the adoption of this technique in marketing. Meanwhile, the contributions of neuromarketing in marketing research are classified based on the available literature. In addition, a new decision-making approach through several adoption factors is developed. To find the importance level of these neuromarketing adoption factors for sustainable product marketing, a questionnaire survey is conducted according to the employed method procedure. The data collection is performed from the sustainable product suppliers who are involved in such product marketing through online shopping websites. Fuzzy analytic hierarchy process (AHP) is performed on collected data to develop a new decision-making model for neuromarketing in a marketing context.
The rest of the paper is organized as follows. In Section 2, neuromarketing in marketing is discussed. In Section 3, we provide the proposed decision-making model. In Section 4, we provide the data collection and analysis. In Section 5, we provide our discussion on the findings of this research. Finally, the conclusion and future work are presented in Section 6.
2. Neuroscience in Marketing
At present, enormous pressure is applied on the managers for uncovering the parameters motivating the attitudes and behaviors of customers. Sad to say, conventional techniques possess popular restrictions and have been fixed significantly since their introduction decades ago. Consequently, researchers have been greatly considered brain-based approaches, which can empower managers through the direct measurement of the customers’ basic ideas, emotions, and intentions [13]. There are different definitions of neuromarketing, but all of them are about the study of the operation of the brain in making decisions about a product/service or how the brain reacts to incentives. The appearance of neuromarketing has meaningfully advanced predictable marketing research, revealing in what way unconscious answers and feelings influence customers’ perceptions and decision-making procedures [14]. Neuromarketing practices a mixture of marketing and neuroscience methods with the aim of observing the nervous and mental procedures that control a person’s choices and actions. Therefore, examining these procedures would be helpful to clarify customers’ reactions to marketing incentives. Adding neuroscientific approaches can help the scholars detect stronger understandings of marketing, including customer behavior [15]. Neuromarketing can involve various detectable subjects. Daugherty and Hoffman [16] introduced a reorganized and updated taxonomy, including six different classifications to frame the current studies about the intended marketing results. The categories are consumer attention/arousal, brand extensions, product/brand appraisals, purchase behaviors, memory, and product/brand preferences. Table 1 provides the introduced taxonomy.

Table 1.
Neuromarketing Taxonomy [16].
There are two major reasons for the marketers’ enthusiasm. Firstly, marketers expect that neuroimaging would present an interaction with higher efficiency between cost and benefit. The basis of the expectation is the assumptions that individuals are not capable of completely articulating their priorities as they are demanded for expressing those preferences in an explicit manner, and that the brain of consumers contains invisible information regarding their real priorities. This concealed information might theoretically be applied for influencing their buying behaviors, so that the costs of doing research on the neuroimaging might be outweighed by the benefits of the promoted product design and enhanced sale. Theoretically, not less than brain imaging might highlight what people want and what they would purchase.
The second reason for the marketers’ enthusiasm for the brain imaging is that they expect that such an imaging provides a precise marketing research technique, which could be performed even prior to the existence of a product. It is assumed that neuroimaging information would provide a more precise indicator of the basic priorities compared to the information obtained from standard market research studies and would be insensitive to types of bias, which are frequently a criterion of subjective strategies to valuation. If the above case is true, the product concepts might be experimented quickly, and unhopeful concepts would be removed at the initial processes. Such a situation would lead to a more effective assignment of resources for developing potential products.
Moreover, it is possible to illustrate numerous benefits of neuroimaging due to its clear attractions for utilization in consumer studies. Notably, neuroscientific techniques may be able to detect basic procedures involved in the intended behaviors, because the same behaviors may be caused by various psychological procedures. Particularly, neuroscience can assist in the understanding of the contribution of internal emotional responses that can contribute importantly to the economic decision-making procedure [17]. Therefore, neuroscientific methods present objective physiological information because topics cannot affect or have a very little effect on such measurements [15], which is contrary to the self-reporting respondents who cannot precisely evaluate their decisions and priorities [18], as these may be caused, for instance, by the orientation for providing socially admitted responses [19]. Additionally, neuroimaging empowers the simultaneous tracking of the consumers’ neural responses when the desired marketing stimuli are processed. Hence, it eliminates the danger of recall bias, which is usually related to the self-reporting measure.
The customers’ decisions that are affected by the unconscious mind include mental procedures that are unreachable, but they influence decisions, emotional states, or human behavior [20]. On the other hand, usually, the customers do not prefer or do not know how to explain their selections and decision-making process. The majority of thoughts and emotions occur “below the level of awareness”. Therefore, the study of the mind can disclose a person’s state of mind through this method more than from vocal communication. The initial arrival of the term “neuromarketing” in the academic journals can be found in the middle of 2007 [21]. Neuromarketing is developing as a part of neuroscience research and has an application in marketing that endeavors to better understand the customers’ behavior through the cognitive process.
Neuromarketing involves observing the customers’ mind in purchasing decisions to discover the marketing strategies that are facilitators and energizers to attract potential customers. This novel tendency has had an excessive influence on the improvement of businesses and brands worldwide, not only facilitating the exploration of the different market segments. Furthermore, neuromarketing can help develop a suitable marketing strategy, including a marketing mix and four comprehensive stages of a marketing plan including price, product, promotion, and place to satisfy different groups of customers. Deductively, it is possible to state that in the minds of the customers, the emotions act as an entity motivator and activator of memorable experiences (positive and negative) around the brand and all the points of contact that surround it. By the use of neuromarketing, businesses could have a deeper and evidence-based knowledge of different behavior measurements and/or stimuli, which will allow in a certain way obtaining behavior patterns versus different contexts of purchase or consumption established by customers.
Understanding customers’ decision-making procedures is one of the most significant objectives of scholars and experts in marketing. Today, marketplaces are overloaded by many similar and different products/services, so it is essential for businesses to continually modernize and distinguish products/services that satisfy customers requests as much as probable [22]. This result delivered by neuromarketing investigation seems very encouraging because of the significance of meeting clients’ requirements. Furthermore, earlier, it was not attainable to examine the hidden psychological procedures that occur while customers’ choices are made [9,23]. The old-style approaches (e.g., questionnaires and interviews) used in market research are often insufficient to accurately observe and determine customers’ behavior. In addition, these approaches only investigate the insincere or mindful features of customers’ insights that can result in a product being unsuccessful up to 80% of the time within its first years on the marketplace, which specifies that there is a need for a comprehensive arrangement among new goods and real customer requests. In fact, the high disappointment rate displays an inadequacy of data or information offered by the old-style customer behavior approaches for proficient marketing plans [13,24]. On the other hand, neuromarketing studies provide extra understanding into customers’ thoughts and behavior rather than old-style data collection alone. Neuromarketing can help managers understand and predict consumer responses to marketing materials and have consistently identified brain areas related to the processing of marketing-related stimuli [6,25,26]
In addition, neuromarketing techniques are widely used in product development. For example, neuromarketing applications of functional magnetic resonance imaging (fMRI) can be used in two parts of the product development process [27]. At the first stage, fMRI can be employed as a section of the design procedure. At this point, neural replies could be applied to improve the product earlier than when it is released. Indeed, the most favorable application of fMRI to neuromarketing comes before a product is even released. At the second stage, fMRI can be applied when the product is completely formed, at which point it is usually used to assess neural replies as a section of an advertising operation to boost sales [27].
Extracting the knowledge from the human brain is one of the important tasks in conducting company-specific market research. Several neuromarketing data collection tools are available to get the behavioral information from the customers, which are Facial Recognition/Facial Coding System (FACS), Heart Rate (HR), electroencephalography (EEG), Galvanic Skin Response (GSR), Eye Tracking (ET), Positron Emission Tomography (PET), magnetoencephalography (MEG), and fMRI. According to Kable [28], 60%–70% of empirical neuroscience research have applied only one technique, fMRI, to collect the data from the customers. Neuromarketing techniques are currently used effectively to improve marketing activities.
3. Proposed Decision-Making Model
Several advantages for neuromarketing techniques have been cited in the literature. Table 2 summarizes the most important and repeated advantages and their explanations. Meanwhile, employing neuromarketing methods resulted in different advancements in marketing [22,29]. These marketing advancements can be divided into six general themes according to the literature (see Table 3).
Table 2.
Neuromarketing research advantages.
Table 3.
The contributions of neuromarketing in marketing research.
This research aims to develop a new decision-making model for neuromarketing in a business context. As shown in Figure 1, the decision-making model is presented in three main stages: A goal level, criteria level, and alternative level. At the goal level, the decision to adopt the neuromarketing option is located. At the second level, the hierarchical structure includes neuromarketing advantages such as the cost, accuracy, usefulness, time saving, quality of information, biasness, and deep probing of memory and emotions. At the third level, the alternative level, the hierarchical structure includes neuromarketing contributions in marketing research such as advertising, product development, pricing, branding, product design, and decision making, which are evaluated through the criteria presented in the second level. We use fuzzy AHP to evaluate the decision-making model. In fact, the priority weights of criteria and alternatives are obtained through fuzzy AHP.
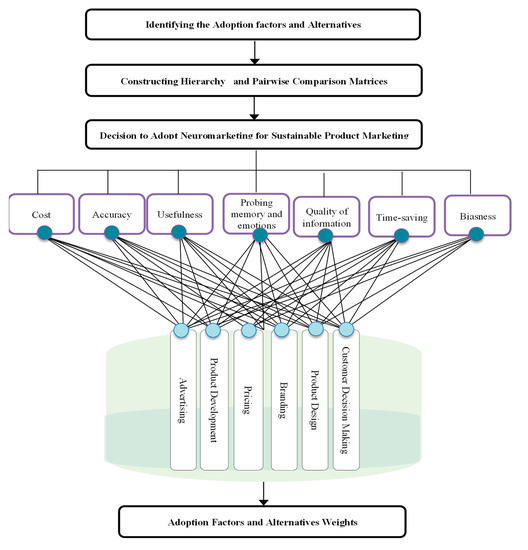
Figure 1.
The proposed model for adoption of neuromarketing for sustainable product marketing.
Fuzzy AHP
Multi-Criteria Decision Making (MCDM) techniques have been widely used in the previous literature for decision-making problems [79,80,81,82,83]. Fuzzy AHP is one of the most well-known MCDM methods that manages uncertainty and vagueness in criteria and decision-making problems, and it can be flexible and easy to utilize [84,85]. Fuzzy AHP is extremely efficient and applicable in real-world conditions where uneven pairwise comparison is quite common [86,87]. Using fuzzy AHP, any complex problem is decomposed into dissimilar hierarchical levels of criteria, and a sequence of pairwise judgments are performed to uncover the rank of criteria [88]. This method is able to utilize qualitative parameters in assessing and ranking diverse decisional alternatives, and for this reason, it has been widely used in the literature of sustainability decision-making [89]. Govindan, Kaliyan [90] used Fuzzy AHP to identify and rank the barriers of green supply chain management in Indian industries. In the same study, Mathiyazhagan, Govindan [91] focused on pressure analysis using AHP in green supply chain management in Indian industries. By using AHP, Srdjevic, Kolarov [92] developed a new group decision-making framework for sustainability appraisal in development projects in Serbia. Larimian, Zarabadi [93] proposed a model based on fuzzy AHP to explore environmental sustainability from a Secured by Design (SBD) point of view. Kumar, Rahman [94] used a model of fuzzy multi-objective linear programming and fuzzy AHP for the purpose of allocating orders in a sustainable supply chain. Fuzzy AHP is useful in the condition in which decision makers face problems to rank factors and alternatives with respect to an upper-level goal (as in our case). Therefore, this study performed Fuzzy AHP to investigate the factors influencing the managers’ decision to adopt neuromarketing technique in the sustainable product marketing. The procedure of the Fuzzy AHP technique includes following steps.
- Step 1:
- In this step, factors for the adoption of digital forensic by MEA were identified from the literature.
- Step 2:
- In this step, the hierarchical tree, which includes the criteria and goal of the decision making, is designed.
- Step 3:
- The data are collected from the experts, and pairwise comparison matrices are constructed with the aid of triangular fuzzy numbers, .
- Step 4:
- In this step, the arithmetic mean of all pairwise comparisons are calculated.
- Step 5:
- The sum of the elements in each row is calculated.
- Step 6:
- In this step, the sum of each row is normalized by the following equation as:In this step, considering as (li, mi, ui), the above equation for normalization is presented as:
- Step 7:
- In this step, the degree of possibility of is defined as:which also can be defined as:where indicates the ordinate of the highest intersection point between and . For comparing and , it is needed to calculate both ( ≥ ) and ( ≥ ). The degree of possibility for a convex fuzzy number to be greater than convex fuzzy numbers are defined by:
- Step 8:
- To normalize the weight vectors, the following equation is used to obtain the normalized weights. These values obtained by this equation are non-fuzzy weights.
- Step 9:
- We obtain the final weights by combing the weights of criteria.
4. Data Collection and Results
Using purposive sampling, a list of sustainable product suppliers who were involved in such product marketing was obtained through the Internet and websites. In purposive sampling, researchers depend on their own judgment and purposefully choose participants. A set of 28 emails was sent to the suppliers with more than five years’ experience in product marketing through online shopping websites. We focused on Amazon.com, which is a comprehensive online shopping website for product marketing. This study was conducted between March and June 2019. An introduction to the research, its aim, and scope along with the questionnaire were provided for participants in the emails. The questionnaire was based on pairwise comparisons of criteria on a nine-point scale (Appendix A). In order to enhance the participation rate, two reminders in four weeks were sent to the participants. Finally, 18 complete responses were received, and 15 of them were suitable for analysis. It is worth noting that there are no specific rules for deciding on the number of respondents in MCDM methods. AHP is not an exception. A small number of participants is required to make a decision in AHP, as it is not a statistically based technique [95,96]. Meanwhile, AHP is technically effective and valid and does not require a large number of participants [97]. Additionally, many studies considered a small sample size for implementing MCDM techniques such as AHP [98,99]. Therefore, a sample size of 15 valid respondents is adequate for data collection in this study.
The fuzzy AHP technique was performed to obtain the weights of the criteria and alternatives through pairwise comparisons based on experts’ opinions using symmetric triangular fuzzy numbers. Then, the fuzzy numbers in the group judgment matrix were obtained. The results are shown in Table 4, Table 5, Table 6, Table 7, Table 8, Table 9, Table 10 and Table 11. Note that the inconsistency ratio of fuzzy pairwise comparisons was obtained by [100]. The final weights for the criteria and alternatives are provided in Figure 2 and Figure 3. The results show that the most important factors from the experts’ point of view were accuracy and biasness. In addition, the assessment of alternatives shows that advertising (weight = 0.61000) and branding (weight = 0.27100) are ranked as two neuromarketing contributions that make business managers more motivated to use neuromarketing techniques.
Table 4.
Pairwise comparison with respect to goal.
Table 5.
Alternative pairwise comparisons with respect to probing memory and emotions.
Table 6.
Alternative pairwise comparisons with respect to cost.
Table 7.
Alternative pairwise comparisons with respect to accuracy.
Table 8.
Alternative pairwise comparisons with respect to usefulness.
Table 9.
Alternative pairwise comparisons with respect to information quality.
Table 10.
Alternative pairwise comparisons with respect to time-saving.
Table 11.
Alternative pairwise comparisons with respect to biasness.
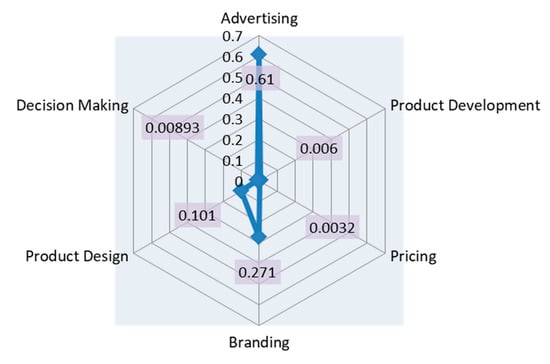
Figure 2.
Final weights of alternatives for sustainable product marketing using neuromarketing.
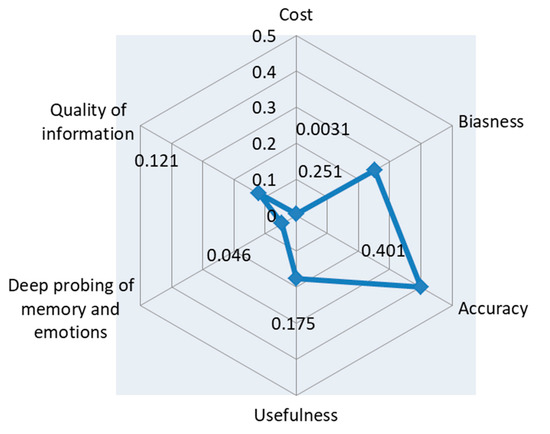
Figure 3.
Final weights of criteria for sustainable product marketing using neuromarketing.
5. Discussion
According to the results, accuracy and bias are two important factors that have a significant influence on sustainable product marketers in utilizing neuromarketing more specifically for advertising and branding purposes. The goal of commercial advertising is to affect the customers’ behavior in a way that one product/service is preferred over another [39]. As a result of the proliferation of new media and extensive competition in market places, advertising has been increasingly recognized as an essential tool for raising the awareness of customers for products/services [101]. Therefore, the power of gaining the attention of consumers is one of the main factors of advertising effectiveness. Neuroimaging techniques show different levels of potential for exploring how the brain responds to advertisements [102]. By the use of neuromarketing techniques, marketers are able to discover which parts of the brain are involved when case products from specific brands are presented as well as predict the impacts of brands on the decision-making process in general. From the managers’ view point, consumer neuroscience causes a significant influence on the way brands are introduced, conceptualized, and marketed [103]. Therefore, Roth [22] recommended increasing the utilization of neuromarketing techniques for branding purposes to enhance the brands‘ representation. So far, many studies have highlighted the significant role of neuromarketing in improving the effectiveness of advertising messages [38,39,104] and branding [43,59,60,61] around the world. It is believed that advertising pretesting is flawed by the cognitive processes of respondents activated during the usage of traditional techniques. It means that respondents’ preferences and most of the critical insights that may assist the decision makers are normally not accessible through using traditional techniques. Meanwhile, it may be difficult for many of the customers to properly express their feelings and emotions about a product/service. Meanwhile, users normally cannot report the reason for their certain reactions. Even sometimes respondents are not interested in giving true information, as they are looking for social acceptance [105]. Moreover, traditional research techniques have been shown to have a great negative impact on what the customers remember and on the subjective experience of it [38]. Neuromarketing offers the opportunity to manage these limitations as customers do not have control over the collection of information [106]. Hence, it is not surprising that this study ranked accuracy and biasness as two important characteristics of neuromarketing techniques for advertising and branding purposes for sustainable product marketing.
6. Conclusions
Considering the rapid advancement in neuromarketing techniques, there has been a rising interest in exposing the responses of brain to marketing stimuli caused by the introduction of consumer neuroscience in the neuroeconomics fields. However, marketing professionals are still doubtful about the adoption of neuroscience techniques as they are not sure about the ability of collected data to offer meaningful findings related to consumer behavior and psychology [35]. In addition, according to previous research on neuromarketing in sustainability development, neuromarketing techniques can contribute to the increased accuracy in sustainable product development, as well as improved ergonomics, decision-making, and sustainability processes. However, these issues are rarely investigated from the suppliers’ perspectives regarding why they intended to adopt neuromarketing techniques in their business. Therefore, this research investigated the adoption of neuromarketing techniques in sustainable product marketing from the suppliers’ point on view. In this regard, firstly, a review on the existing research on neuromarketing is conducted and the cost, accuracy, usefulness, time-saving, quality of information, bias, and deep probing of memory and emotions are identified as neuromarketing advantages that can significantly influence the adoption of this technique in business. Meanwhile, the contributions of neuromarketing in marketing research are classified into advertising, product development, pricing, branding, product design, and decision making. Next, a set of questionnaires is designed, and data were collected from green product suppliers who do the marketing of such products through online shopping websites. Fuzzy AHP is performed on the collected data to develop a new decision-making model for neuromarketing in the business context. The results show that accuracy and bias are two important factors that have a significant influence on green product suppliers in utilizing neuromarketing more specifically for advertising and branding purposes.
It is hoped that this research provides useful information about the neuromarketing techniques and their applications in sustainable product marketing. These findings can assist companies that provide eco-friendly products to select their advertisements or modify them to consider factors that help the brand be more clearly remembered or keep the attention of consumers. Meanwhile, the findings of this research can also be intensely used to regulate the most effective branding strategies for green products.
This study can be used as a starting point for increasing advertising effectiveness in green products marketing. For example, the existence of individuals considered physically attractive or celebrities in advertisements activates a part of the brain that is involved in the process of creation and recognition of trust. So, attractive or famous people impact the preferences of green consumers, which affects the decision to purchase [105]. However, it is recommended that the purpose of advertising campaigns be carefully considered. If the aim is to form an attitude, choosing a celebrity as the advertising spokesperson is suggested; however, if the aim is to raise the brand awareness, choosing a non-celebrity spokesperson is more beneficial [104].
Limitations and Future Research Directions
Since fMRI, EEG, and MEG are known as most attracted neuromarketing techniques, future similar studies are recommended to explore the relation between these techniques, neuromarketing factors, and neuromarketing contributions in the adoption of neuromarketing techniques in green product marketing. Accuracy and bias have been recognized as “triggers” for utilizing neuromarketing techniques among the green products suppliers; however, more in-depth studies are recommended to be conduct on how to improve these factors in certain situations. This study employed fuzzy AHP to analyze the data, while future similar studies can use other MCDM methods in order to make a comparison between the outcomes of different techniques. This study was conducted among suppliers with more than five years’ experience in product marketing through online shopping websites. Further investigations are recommended to extend the research by selecting a larger number of respondents. Meanwhile, future studies are recommended to select participants from other groups such as neurologists or business professionals.
Author Contributions
Conceptualization, M.N. and E.Y.; formal analysis, M.N.; investigation, M.N., A.M., S.S., A.A., E.Y., N.S.R. and N.A., T.T.; methodology, M.N.; writing-original draft, M.N. and E.Y.; writing-review and editing, M.N., E.Y., S.S., A.M., A.A., N.S.R. and N.A., T.T., supervision, A.M.; funding acquisition, S.S. All authors have read and agreed to the published version of the manuscript.
Funding
This research was funded by the Deanship of Scientific Research at Princess Nourah bint Abdulrahman University through the Fast-track Research Funding Program.
Conflicts of Interest
The authors declare no conflict of interest.
Appendix A. An Example of an AHP Questionnaire
In this survey, each section includes number of questions. Each question in a question set requires you to make comparison between two factors simultaneously considering a third factor.
Read the provided questions and put check marks where applicable in the related cells. If a factor on the left is more important than the one on the right, put your check mark to the left of the importance “Equally important” by selecting your preferred importance level. If an attribute on the left is less important than the one on the right, put your check mark to the right of the importance “Equally important” by selecting your preferred importance level.
Section 1: Pairwise comparison with respect to Goal
- Q1: How important is cost when it is compared with accuracy?
- Q2: How important is advertising when it is compared with usefulness?
- Q3: How important is advertising when it is compared with probing memory and emotions?
- Q4: How important is advertising when it is compared with quality of information?
- Q5: How important is advertising when it is compared with time-saving?
- Q6: How important is advertising when it is compared with biasness?
| Absolutely more important | Very strongly more important | Strongly more important | Weakly more important | Equally important | Weakly more important | Strongly more important | Very strongly more important | Absolutely more important | |
| Q1 | |||||||||
| Q2 | |||||||||
| Q3 | |||||||||
| Q4 | |||||||||
| Q5 | |||||||||
| Q6 |
Section 2: Alternative pairwise comparisons with respect to Probing Memory and Emotions
- Q7: How important is advertising when it is compared with product development?
- Q8: How important is advertising when it is compared with pricing?
- Q9: How important is advertising when it is compared with branding?
- Q10: How important is advertising when it is compared with product design?
- Q11: How important is advertising when it is compared with customer decision making?
- Q12: How important is product development when it is compared with pricing?
- Q13: How important is product development when it is compared with branding?
- Q14: How important is product development when it is compared with product design?
- Q15: How important is product development when it is compared with customer decision making?
- Q16: How important is pricing when it is compared with branding?
- Q17: How important is pricing when it is compared with product design?
- Q18: How important is pricing when it is compared with customer decision making?
- Q19: How important is branding when it is compared with product design?
- Q20: How important is branding when it is compared with customer decision making?
- Q21: How important is product design when it is compared with customer decision making?
| Absolutely more important | Very strongly more important | Strongly more important | Weakly more important | Equally important | Weakly more important | Strongly more important | Very strongly more important | Absolutely more important | |
| Q7 | |||||||||
| Q8 | |||||||||
| Q9 | |||||||||
| Q10 | |||||||||
| Q11 | |||||||||
| Q12 | |||||||||
| Q13 | |||||||||
| Q14 | |||||||||
| Q15 | |||||||||
| Q16 | |||||||||
| Q17 | |||||||||
| Q18 | |||||||||
| Q19 | |||||||||
| Q20 | |||||||||
| Q21 |
Section 3: Alternative pairwise comparisons with respect to Cost
- Q22: How important is advertising when it is compared with product development?
- Q23: How important is advertising when it is compared with pricing?
- Q24: How important is advertising when it is compared with branding?
- Q25: How important is advertising when it is compared with product design?
- Q26: How important is advertising when it is compared with customer decision making?
- Q27: How important is product development when it is compared with pricing?
- Q28: How important is product development when it is compared with branding?
- Q29: How important is product development when it is compared with product design?
- Q30: How important is product development when it is compared with customer decision making?
- Q31: How important is pricing when it is compared with branding?
- Q32: How important is pricing when it is compared with product design?
- Q33: How important is pricing when it is compared with customer decision making?
- Q34: How important is branding when it is compared with product design?
- Q35: How important is branding when it is compared with customer decision making?
- Q36: How important is product design when it is compared with customer decision making?
| Absolutely more important | Very strongly more important | Strongly more important | Weakly more important | Equally important | Weakly more important | Strongly more important | Very strongly more important | Absolutely more important | |
| Q22 | |||||||||
| Q23 | |||||||||
| Q24 | |||||||||
| Q25 | |||||||||
| Q26 | |||||||||
| Q27 | |||||||||
| Q28 | |||||||||
| Q29 | |||||||||
| Q30 | |||||||||
| Q31 | |||||||||
| Q32 | |||||||||
| Q33 | |||||||||
| Q34 | |||||||||
| Q35 | |||||||||
| Q36 |
References
- Clark, G.; Kosoris, J.; Hong, L.; Crul, M. Design for sustainability: Current trends in sustainable product design and development. Sustainability 2009, 1, 409–424. [Google Scholar] [CrossRef]
- De Medeiros, J.F.; Ribeiro, J.L.D.; Cortimiglia, M.N. Success factors for environmentally sustainable product innovation: A systematic literature review. J. Clean. Prod. 2014, 65, 76–86. [Google Scholar] [CrossRef]
- Belz, F.-M.; Peattie, K.J. Sustainability Marketing: A Global Perspective; Wiley: Hoboken, NJ, USA, 2009. [Google Scholar]
- Kaebernick, H.; Kara, S.; Sun, M. Sustainable product development and manufacturing by considering environmental requirements. Robot. Comput. Integr. Manuf. 2003, 19, 461–468. [Google Scholar] [CrossRef]
- Averdung, A.; Wagenfuehrer, D. Consumers acceptance, adoption and behavioural intentions regarding environmentally sustainable innovations. J. Bus. Manag. Econ. 2011, 2, 98–106. [Google Scholar]
- Morin, C. Neuromarketing: The new science of consumer behavior. Society 2011, 48, 131–135. [Google Scholar] [CrossRef]
- Yoon, C.; Gutchess, A.H.; Feinberg, F.; Polk, T.A. A functional magnetic resonance imaging study of neural dissociations between brand and person judgments. J. Consum. Res. 2006, 33, 31–40. [Google Scholar] [CrossRef]
- Kenning, P.; Linzmajer, M. Consumer neuroscience: An overview of an emerging discipline with implications for consumer policy. J. Verbrauch. Lebensm. 2011, 6, 111–125. [Google Scholar] [CrossRef]
- Plassmann, H.; Venkatraman, V.; Huettel, S.; Yoon, C. Consumer neuroscience: Applications, challenges, and possible solutions. J. Mark. Res. 2015, 52, 427–435. [Google Scholar] [CrossRef]
- Chavaglia, J.N.; Filipe, J.A.; Ramalheiro, B. Neuromarketing: Consumers and the Anchoring Effect. In International Journal of Latest Trends in Finance and Economics Sciences; ExcellingTech Publisher: London, UK, 2011; pp. 183–189. [Google Scholar]
- Plassmann, H.; Ramsøy, T.Z.; Milosavljevic, M. Branding the brain: A critical review and outlook. J. Consum. Psychol. 2012, 22, 18–36. [Google Scholar] [CrossRef]
- De Oliveira, J.H.C. Neuromarketing and sustainability: Challenges and opportunities for Latin America. Lat. Am. J. Manag. Sustain. Dev. 2014, 1, 35–42. [Google Scholar] [CrossRef]
- Hsu, M.Y.-T.; Cheng, J.M.-S. fMRI neuromarketing and consumer learning theory: Word-of-mouth effectiveness after product harm crisis. Eur. J. Mark. 2018, 52, 199–223. [Google Scholar] [CrossRef]
- Mileti, A.; Guido, G.; Prete, M.I. Nanomarketing: A new frontier for neuromarketing. Psychol. Mark. 2016, 33, 664–674. [Google Scholar] [CrossRef]
- Camerer, C.; Yoon, C. Introduction to the journal of marketing research special issue on neuroscience and marketing. J. Mark. Res. 2015, 52, 423–426. [Google Scholar] [CrossRef]
- Daugherty, T.; Hoffman, E. Neuromarketing: Understanding the Application of Neuroscientific Methods within Marketing Research. In Ethics and Neuromarketing; Springer: Berlin/Heidelberg, Germany, 2017; pp. 5–30. [Google Scholar]
- Sanfey, A.G.; Rilling, J.K.; Aronson, J.A.; Nystrom, L.E.; Cohen, J.D. The neural basis of economic decision-making in the ultimatum game. Science 2003, 300, 1755–1758. [Google Scholar] [CrossRef] [PubMed]
- Petty, R.E.; Cacioppo, J.T. Central and peripheral routes to persuasion: Application to advertising. Advert. Consum. Psychol. 1983, 1, 3–23. [Google Scholar]
- Nighswonger, N.J.; Martin, C.R., Jr. On using voice analysis in marketing research. J. Mark. Res. 1981, 18, 350–355. [Google Scholar] [CrossRef]
- Bargh, J.A.; Morsella, E. The unconscious mind. Perspect. Psychol. Sci. 2008, 3, 73–79. [Google Scholar] [CrossRef]
- Lee, N.; Chamberlain, L.; Brandes, L. Welcome to the jungle! The neuromarketing literature through the eyes of a newcomer. Eur. J. Mark. 2018, 52, 4–38. [Google Scholar] [CrossRef]
- Roth, V.A. The Potential of Neuromarketing as a Marketing Tool. In Proceedings of the Bachelor Thesis Conference, Enschede, The Netherlands, 27 June 2013; pp. 1–16. [Google Scholar]
- Lemon, K.N.; Verhoef, P.C. Understanding customer experience throughout the customer journey. J. Mark. 2016, 80, 69–96. [Google Scholar] [CrossRef]
- Calvert, G.A.; Brammer, M.J. Predicting consumer behavior: Using novel mind-reading approaches. IEEE Pulse 2012, 3, 38–41. [Google Scholar] [CrossRef]
- Barnett, S.B.; Cerf, M. A ticket for your thoughts: Method for predicting content recall and sales using neural similarity of moviegoers. J. Consum. Res. 2017, 44, 160–181. [Google Scholar]
- Falk, E.B.; Berkman, E.T.; Lieberman, M.D. From neural responses to population behavior: Neural focus group predicts population-level media effects. Psychol. Sci. 2012, 23, 439–445. [Google Scholar] [CrossRef] [PubMed]
- Ariely, D.; Berns, G.S. Neuromarketing: The hope and hype of neuroimaging in business. Nat. Rev. Neurosci. 2010, 11, 284. [Google Scholar] [CrossRef]
- Kable, J.W. The cognitive neuroscience toolkit for the neuroeconomist: A functional overview. J. Neurosci. Psychol. Econ. 2011, 4, 63. [Google Scholar] [CrossRef] [PubMed]
- Lim, W.M. Demystifying neuromarketing. J. Bus. Res. 2018, 91, 205–220. [Google Scholar] [CrossRef]
- Malhotra, N.K.; Birks, D.F.; Palmer, A.; Koenig-Lewis, N. Market research: An applied approach. J. Mark. Manag. 2003, 27, 1208–1213. [Google Scholar]
- Fortunato, V.C.R.; Giraldi, J.d.M.E.; de Oliveira, J.H.C. A review of studies on neuromarketing: Practical results, techniques, contributions and limitations. J. Manag. Res. 2014, 6, 201. [Google Scholar] [CrossRef]
- Yadegaridehkordi, E.; Noor, N.F.B.M.; Ayub, M.N.B.; Affal, H.B.; Hussin, N.B. Affective computing in education: A systematic review and future research. Comput. Educ. 2019, 142, 103649. [Google Scholar] [CrossRef]
- Bercea, M.D. Anatomy of Methodologies for Measuring Consumer Behavior in Neuromarketing Research. In Proceedings of the LCBR European Marketing Conference, Munich, Germany, 9–10 August 2012; pp. 1–14. [Google Scholar]
- Eser, Z.; Isin, F.B.; Tolon, M. Perceptions of marketing academics, neurologists, and marketing professionals about neuromarketing. J. Mark. Manag. 2011, 27, 854–868. [Google Scholar] [CrossRef]
- Solnais, C.; Andreu-Perez, J.; Sánchez-Fernández, J.; Andréu-Abela, J. The contribution of neuroscience to consumer research: A conceptual framework and empirical review. J. Econ. Psychol. 2013, 36, 68–81. [Google Scholar] [CrossRef]
- Stasi, A.; Songa, G.; Mauri, M.; Ciceri, A.; Diotallevi, F.; Nardone, G.; Russo, V. Neuromarketing empirical approaches and food choice: A systematic review. Food Res. Int. 2018, 108, 650–664. [Google Scholar] [CrossRef] [PubMed]
- Ćosić, D. Neuromarketing in market research. Interdiscip. Descr. Complex Syst. Indecs 2016, 14, 139–147. [Google Scholar] [CrossRef]
- Astolfi, L.; Fallani, F.D.V.; Cincotti, F.; Mattia, D.; Bianchi, L.; Marciani, M.; Salinari, S.; Colosimo, A.; Tocci, A.; Soranzo, R. Neural basis for brain responses to TV commercials: A high-resolution EEG study. IEEE Trans. Neural Syst. Rehabil. Eng. 2008, 16, 522–531. [Google Scholar] [CrossRef] [PubMed]
- Cook, I.A.; Warren, C.; Pajot, S.K.; Schairer, D.; Leuchter, A.F. Regional brain activation with advertising images. J. Neurosci. Psychol. Econ. 2011, 4, 147. [Google Scholar] [CrossRef]
- Ohme, R.; Reykowska, D.; Wiener, D.; Choromanska, A. Analysis of neurophysiological reactions to advertising stimuli by means of EEG and galvanic skin response measures. J. Neurosci. Psychol. Econ. 2009, 2, 21. [Google Scholar] [CrossRef]
- Klucharev, V.; Smidts, A.; Fernández, G. Brain mechanisms of persuasion: How ‘expert power’modulates memory and attitudes. Soc. Cogn. Affect. Neurosci. 2008, 3, 353–366. [Google Scholar] [CrossRef]
- Young, C. Brain waves, picture sorts®, and branding moments. J. Advert. Res. 2002, 42, 42–53. [Google Scholar] [CrossRef]
- Deppe, M.; Schwindt, W.; Pieper, A.; Kugel, H.; Plassmann, H.; Kenning, P.; Deppe, K.; Ringelstein, E.B. Anterior cingulate reflects susceptibility to framing during attractiveness evaluation. Neuroreport 2007, 18, 1119–1123. [Google Scholar] [CrossRef]
- Rossiter, J.R.; Silberstein, R.B.; Harris, P.G.; Nield, G. Brain-imaging detection of visual scene encoding in long-term memory for TV commercials. J. Advert. Res. 2001, 41, 13–21. [Google Scholar] [CrossRef]
- Morris, J.D.; Klahr, N.J.; Shen, F.; Villegas, J.; Wright, P.; He, G.; Liu, Y. Mapping a multidimensional emotion in response to television commercials. Hum. Brain Mapp. 2009, 30, 789–796. [Google Scholar] [CrossRef]
- Vecchiato, G.; Astolfi, L.; Fallani, F.D.V.; Cincotti, F.; Mattia, D.; Salinari, S.; Soranzo, R.; Babiloni, F. Changes in brain activity during the observation of TV commercials by using EEG, GSR and HR measurements. Brain Topogr. 2010, 23, 165–179. [Google Scholar] [CrossRef] [PubMed]
- Vecchiato, G.; Toppi, J.; Astolfi, L.; Fallani, F.D.V.; Cincotti, F.; Mattia, D.; Bez, F.; Babiloni, F. Spectral EEG frontal asymmetries correlate with the experienced pleasantness of TV commercial advertisements. Med. Biol. Eng. Comput. 2011, 49, 579–583. [Google Scholar] [CrossRef]
- Stallen, M.; Smidts, A.; Rijpkema, M.; Smit, G.; Klucharev, V.; Fernández, G. Celebrities and shoes on the female brain: The neural correlates of product evaluation in the context of fame. J. Econ. Psychol. 2010, 31, 802–811. [Google Scholar] [CrossRef]
- Vecchiato, G.; Toppi, J.; Astolfi, L.; Cincotti, F.; Fallani, F.D.V.; Maglione, A.; Borghini, G.; Cherubino, P.; Mattia, D.; Babiloni, F. The added value of the electrical neuroimaging for the evaluation of marketing stimuli. Bull. Pol. Acad. Sci. Tech. Sci. 2012, 60, 419–426. [Google Scholar] [CrossRef]
- Erk, S.; Spitzer, M.; Wunderlich, A.P.; Galley, L.; Walter, H. Cultural objects modulate reward circuitry. Neuroreport 2002, 13, 2499–2503. [Google Scholar] [CrossRef] [PubMed]
- Levy, I.; Lazzaro, S.C.; Rutledge, R.B.; Glimcher, P.W. Choice from non-choice: Predicting consumer preferences from blood oxygenation level-dependent signals obtained during passive viewing. J. Neurosci. 2011, 31, 118–125. [Google Scholar] [CrossRef] [PubMed]
- Plassmann, H.; O’Doherty, J.; Rangel, A. Orbitofrontal cortex encodes willingness to pay in everyday economic transactions. J. Neurosci. 2007, 27, 9984–9988. [Google Scholar] [CrossRef] [PubMed]
- Yadava, M.; Kumar, P.; Saini, R.; Roy, P.P.; Dogra, D.P. Analysis of EEG signals and its application to neuromarketing. Multimed. Tools Appl. 2017, 76, 19087–19111. [Google Scholar] [CrossRef]
- Ma, Q.; Wang, X.; Dai, S.; Shu, L. Event-related potential N270 correlates of brand extension. Neuroreport 2007, 18, 1031–1034. [Google Scholar] [CrossRef] [PubMed]
- Bastiaansen, M.; Straatman, S.; Driessen, E.; Mitas, O.; Stekelenburg, J.; Wang, L. My destination in your brain: A novel neuromarketing approach for evaluating the effectiveness of destination marketing. J. Destin. Mark. Manag. 2018, 7, 76–88. [Google Scholar] [CrossRef]
- Knutson, B.; Adams, C.M.; Fong, G.W.; Hommer, D. Anticipation of increasing monetary reward selectively recruits nucleus accumbens. J. Neurosci. 2001, 21, RC159. [Google Scholar] [CrossRef] [PubMed]
- Plassmann, H.; O’Doherty, J.; Shiv, B.; Rangel, A. Marketing actions can modulate neural representations of experienced pleasantness. Proc. Natl. Acad. Sci. USA 2008, 105, 1050–1054. [Google Scholar] [CrossRef] [PubMed]
- Raab, G.; Elger, C.E.; Neuner, M.; Weber, B. A neurological study of compulsive buying behaviour. J. Consum. Policy 2011, 34, 401. [Google Scholar] [CrossRef]
- Ambler, T.; Braeutigam, S.; Stins, J.; Rose, S.; Swithenby, S. Salience and choice: Neural correlates of shopping decisions. Psychol. Mark. 2004, 21, 247–261. [Google Scholar] [CrossRef]
- Santos, J.P.; Seixas, D.; Brandão, S.; Moutinho, L. Neuroscience in branding: A functional magnetic resonance imaging study on brands’ implicit and explicit impressions. J. Brand Manag. 2012, 19, 735–757. [Google Scholar] [CrossRef]
- Braeutigam, S.; Rose, S.P.; Swithenby, S.J.; Ambler, T. The distributed neuronal systems supporting choice-making in real-life situations: Differences between men and women when choosing groceries detected using magnetoencephalography. Eur. J. Neurosci. 2004, 20, 293–302. [Google Scholar] [CrossRef]
- Deppe, M.; Schwindt, W.; Kraemer, J.; Kugel, H.; Plassmann, H.; Kenning, P.; Ringelstein, E.B. Evidence for a neural correlate of a framing effect: Bias-specific activity in the ventromedial prefrontal cortex during credibility judgments. Brain Res. Bull. 2005, 67, 413–421. [Google Scholar] [CrossRef]
- Deppe, M.; Schwindt, W.; Kugel, H.; Plassmann, H.; Kenning, P. Nonlinear responses within the medial prefrontal cortex reveal when specific implicit information influences economic decision making. J. Neuroimaging 2005, 15, 171–182. [Google Scholar] [CrossRef]
- Paulus, M.P.; Frank, L.R. Ventromedial prefrontal cortex activation is critical for preference judgments. Neuroreport 2003, 14, 1311–1315. [Google Scholar] [CrossRef]
- McClure, S.M.; Li, J.; Tomlin, D.; Cypert, K.S.; Montague, L.M.; Montague, P.R. Neural correlates of behavioral preference for culturally familiar drinks. Neuron 2004, 44, 379–387. [Google Scholar] [CrossRef]
- Plassmann, H.; Kenning, P.; Deppe, M.; Kugel, H.; Schwindt, W. How choice ambiguity modulates activity in brain areas representing brand preference: Evidence from consumer neuroscience. J. Consum. Behav. Int. Res. Rev. 2008, 7, 360–367. [Google Scholar] [CrossRef]
- Reimann, M.; Castaño, R.; Zaichkowsky, J.; Bechara, A. Novel versus familiar brands: An analysis of neurophysiology, response latency, and choice. Mark. Lett. 2012, 23, 745–759. [Google Scholar] [CrossRef]
- Schaefer, M.; Rotte, M. Favorite brands as cultural objects modulate reward circuit. Neuroreport 2007, 18, 141–145. [Google Scholar] [CrossRef] [PubMed]
- Schaefer, M.; Rotte, M. Thinking on luxury or pragmatic brand products: Brain responses to different categories of culturally based brands. Brain Res. 2007, 1165, 98–104. [Google Scholar] [CrossRef] [PubMed]
- Schaefer, M.; Berens, H.; Heinze, H.-J.; Rotte, M. Neural correlates of culturally familiar brands of car manufacturers. Neuroimage 2006, 31, 861–865. [Google Scholar] [CrossRef]
- Reimann, M.; Zaichkowsky, J.; Neuhaus, C.; Bender, T.; Weber, B. Aesthetic package design: A behavioral, neural, and psychological investigation. J. Consum. Psychol. 2010, 20, 431–441. [Google Scholar] [CrossRef]
- Stoll, M.; Baecke, S.; Kenning, P. What they see is what they get? An fMRI-study on neural correlates of attractive packaging. J. Consum. Behav. Int. Res. Rev. 2008, 7, 342–359. [Google Scholar] [CrossRef]
- Hubert, M.; Hubert, M.; Florack, A.; Linzmajer, M.; Kenning, P. Neural correlates of impulsive buying tendencies during perception of product packaging. Psychol. Mark. 2013, 30, 861–873. [Google Scholar] [CrossRef]
- Jai, T.M.; O’Boyle, M.W.; Fang, D. Neural correlates of sensory-enabling presentation: An fMRI study of image zooming and rotation video effects on online apparel shopping. J. Consum. Behav. 2014, 13, 342–350. [Google Scholar] [CrossRef]
- Cascio, C.N.; O’Donnell, M.B.; Bayer, J.; Tinney, F.J., Jr.; Falk, E.B. Neural correlates of susceptibility to group opinions in online word-of-mouth recommendations. J. Mark. Res. 2015, 52, 559–575. [Google Scholar] [CrossRef]
- Hedgcock, W.M.; Vohs, K.D.; Rao, A.R. Reducing self-control depletion effects through enhanced sensitivity to implementation: Evidence from fMRI and behavioral studies. J. Consum. Psychol. 2012, 22, 486–495. [Google Scholar] [CrossRef]
- Mesly, O. Prey positions as consumers’ behavioural patterns: Exploratory evidence from an fMRI study. J. Consum. Behav. 2017, 16, 51–62. [Google Scholar] [CrossRef]
- Telpaz, A.; Webb, R.; Levy, D.J. Using EEG to predict consumers’ future choices. J. Mark. Res. 2015, 52, 511–529. [Google Scholar] [CrossRef]
- Yadegaridehkordi, E.; Nilashi, M.; Shuib, L.; Asadi, S.; Ibrahim, O. Development of a SaaS adoption decision-making model using a new hybrid MCDM approach. Int. J. Inf. Technol. Decis. Mak. 2019, 18, 1845–1874. [Google Scholar] [CrossRef]
- Ahani, A.; Nilashi, M.; Yadegaridehkordi, E.; Sanzogni, L.; Tarik, A.R.; Knox, K.; Samad, S.; Ibrahim, O. Revealing customers’ satisfaction and preferences through online review analysis: The case of Canary Islands hotels. J. Retail. Consum. Serv. 2019, 51, 331–343. [Google Scholar] [CrossRef]
- Nilashi, M.; Samad, S.; Manaf, A.A.; Ahmadi, H.; Rashid, T.A.; Munshi, A.; Almukadi, W.; Ibrahim, O.; Ahmed, O.H. Factors influencing medical tourism adoption in Malaysia: A DEMATEL-Fuzzy TOPSIS approach. Comput. Ind. Eng. 2019, 137, 106005. [Google Scholar] [CrossRef]
- Tsaur, S.-H.; Chang, T.-Y.; Yen, C.-H. The evaluation of airline service quality by fuzzy MCDM. Tour. Manag. 2002, 23, 107–115. [Google Scholar] [CrossRef]
- Nilashi, M.; Mardani, A.; Liao, H.; Ahmadi, H.; Manaf, A.A.; Almukadi, W. A hybrid method with TOPSIS and machine learning techniques for sustainable development of green hotels considering online reviews. Sustainability 2019, 11, 6013. [Google Scholar] [CrossRef]
- Chen, J.-F.; Hsieh, H.-N.; Do, Q.H. Evaluating teaching performance based on fuzzy AHP and comprehensive evaluation approach. Appl. Soft Comput. 2015, 28, 100–108. [Google Scholar] [CrossRef]
- Nilashi, M.; Ahmadi, H.; Ahani, A.; Ravangard, R.; bin Ibrahim, O. Determining the importance of hospital information system adoption factors using fuzzy analytic network process (ANP). Technol. Forecast. Soc. Chang. 2016, 111, 244–264. [Google Scholar] [CrossRef]
- Yadegaridehkordi, E.; Nizam, M.H.N.B.M.; Noor, N.F.B.M.; Shuib, L.; Badie, N. Predicting the adoption of cloud-based technology using fuzzy analytic hierarchy process and structural equation modelling approaches. Appl. Soft Comput. 2018, 66, 77–89. [Google Scholar] [CrossRef]
- Badie, N.; Hussin, A.R.C.; Lashkari, A.H. Cloud Computing Data Center Adoption Factors Validity By Fuzzy AHP. Int. J. Comput. Intell. Syst. 2015, 8, 854–873. [Google Scholar] [CrossRef]
- Chou, Y.-C.; Yen, H.-Y.; Dang, V.T.; Sun, C.-C. Assessing the human resource in science and technology for Asian countries: Application of fuzzy AHP and fuzzy TOPSIS. Symmetry 2019, 11, 251. [Google Scholar] [CrossRef]
- Calabrese, A.; Costa, R.; Levialdi, N.; Menichini, T. Integrating sustainability into strategic decision-making: A fuzzy AHP method for the selection of relevant sustainability issues. Technol. Forecast. Soc. Chang. 2019, 139, 155–168. [Google Scholar] [CrossRef]
- Govindan, K.; Kaliyan, M.; Kannan, D.; Haq, A.N. Barriers analysis for green supply chain management implementation in Indian industries using analytic hierarchy process. Int. J. Prod. Econ. 2014, 147, 555–568. [Google Scholar] [CrossRef]
- Mathiyazhagan, K.; Govindan, K.; Noorul Haq, A. Pressure analysis for green supply chain management implementation in Indian industries using analytic hierarchy process. Int. J. Prod. Res. 2014, 52, 188–202. [Google Scholar] [CrossRef]
- Srdjevic, Z.; Kolarov, V.; Srdjevic, B. Finding the best location for pumping stations in the Galovica drainage area of Serbia: The AHP approach for sustainable development. Bus. Strategy Environ. 2007, 16, 502–511. [Google Scholar] [CrossRef]
- Larimian, T.; Zarabadi, Z.S.S.; Sadeghi, A. Developing a fuzzy AHP model to evaluate environmental sustainability from the perspective of Secured by Design scheme—A case study. Sustain. Cities Soc. 2013, 7, 25–36. [Google Scholar] [CrossRef]
- Kumar, D.; Rahman, Z.; Chan, F.T. A fuzzy AHP and fuzzy multi-objective linear programming model for order allocation in a sustainable supply chain: A case study. Int. J. Comput. Integr. Manuf. 2017, 30, 535–551. [Google Scholar] [CrossRef]
- Herath, G.; Prato, T. Using Multi-Criteria Decision Analysis in Natural Resource Management; Ashgate Publishing, Ltd.: Farnham, UK, 2006. [Google Scholar]
- Duke, J.M.; Aull-Hyde, R. Identifying public preferences for land preservation using the analytic hierarchy process. Ecol. Econ. 2002, 42, 131–145. [Google Scholar] [CrossRef]
- Lam, K.; Zhao, X. An application of quality function deployment to improve the quality of teaching. Int. J. Qual. Reliab. Manag. 1998, 15, 389–413. [Google Scholar] [CrossRef]
- Ahmadi, H.; Nilashi, M.; Ibrahim, O. Organizational decision to adopt hospital information system: An empirical investigation in the case of Malaysian public hospitals. Int. J. Med. Inform. 2015, 84, 166–188. [Google Scholar] [CrossRef]
- Chou, Y.-C.; Sun, C.-C.; Yen, H.-Y. Evaluating the criteria for human resource for science and technology (HRST) based on an integrated fuzzy AHP and fuzzy DEMATEL approach. Appl. Soft Comput. 2012, 12, 64–71. [Google Scholar] [CrossRef]
- Gogus, O.; Boucher, T.O. Strong transitivity, rationality and weak monotonicity in fuzzy pairwise comparisons. Fuzzy Sets Syst. 1998, 94, 133–144. [Google Scholar] [CrossRef]
- Pi-Fang, H. Evaluation of Advertising Spokespersons via the ANP-GRA Selection Model. J. Grey Syst. 2009, 21, 35–48. [Google Scholar]
- Raichle, M.E.; Mintun, M.A. Brain work and brain imaging. Annu. Rev. Neurosci. 2006, 29, 449–476. [Google Scholar] [CrossRef]
- Agarwal, S.; Xavier, M. Innovations in consumer science: Applications of neuro-scientific research tools. In Adoption of Innovation; Springer: Berlin/Heidelberg, Germany, 2015; pp. 25–42. [Google Scholar]
- Pileliene, L.; Grigaliunaite, V. The effect of female celebrity spokesperson in FMCG advertising: Neuromarketing approach. J. Consum. Mark. 2017, 34, 202–213. [Google Scholar] [CrossRef]
- Hubert, M.; Kenning, P. A current overview of consumer neuroscience. J. Consum. Behav. Int. Res. Rev. 2008, 7, 272–292. [Google Scholar] [CrossRef]
- Butler, M.J. Neuromarketing and the perception of knowledge. J. Consum. Behav. Int. Res. Rev. 2008, 7, 415–419. [Google Scholar] [CrossRef]


© 2020 by the authors. Licensee MDPI, Basel, Switzerland. This article is an open access article distributed under the terms and conditions of the Creative Commons Attribution (CC BY) license (http://creativecommons.org/licenses/by/4.0/).