Binomial Regression Models with a Flexible Generalized Logit Link Function
Abstract
1. Introduction
2. Binomial Regression Model
3. Flexible Generalized Logit Link
3.1. Exponentiated-Exponential Logistic Distribution
3.2. Binomial Regression Model with Glogit Link Function
| model { |
| for (i in 1:n) { |
| y[i]~dbin(p[i], 1) |
| omega[i] < -beta0 + beta1*x1[i] + beta2*x2[i] |
| p[i] < -pow((1-pow((1+exp(omega[i])),-lambda)),alpha) |
| } |
| #Prior |
| beta0~dnorm(0, 0.001) |
| beta1~dnorm(0, 0.001) |
| beta2~dnorm(0, 0.001) |
| alpha~dlnorm(0, 1) |
| lambda~dlnorm(0, 1) |
| } |
4. Simulation
- Step 1: Specify a binomial regression model with one predictor variable and set a vector of the regression coefficients ;
- Step 2: Generate , then we create ;
- Step 3: Compute from a given link, so that );
- Step 4: Generate with = 100, and , which is the binomial distribution with as the probability of success and is the sample size for the repeated Bernoulli trials.
- Scenario 1: , same with ;
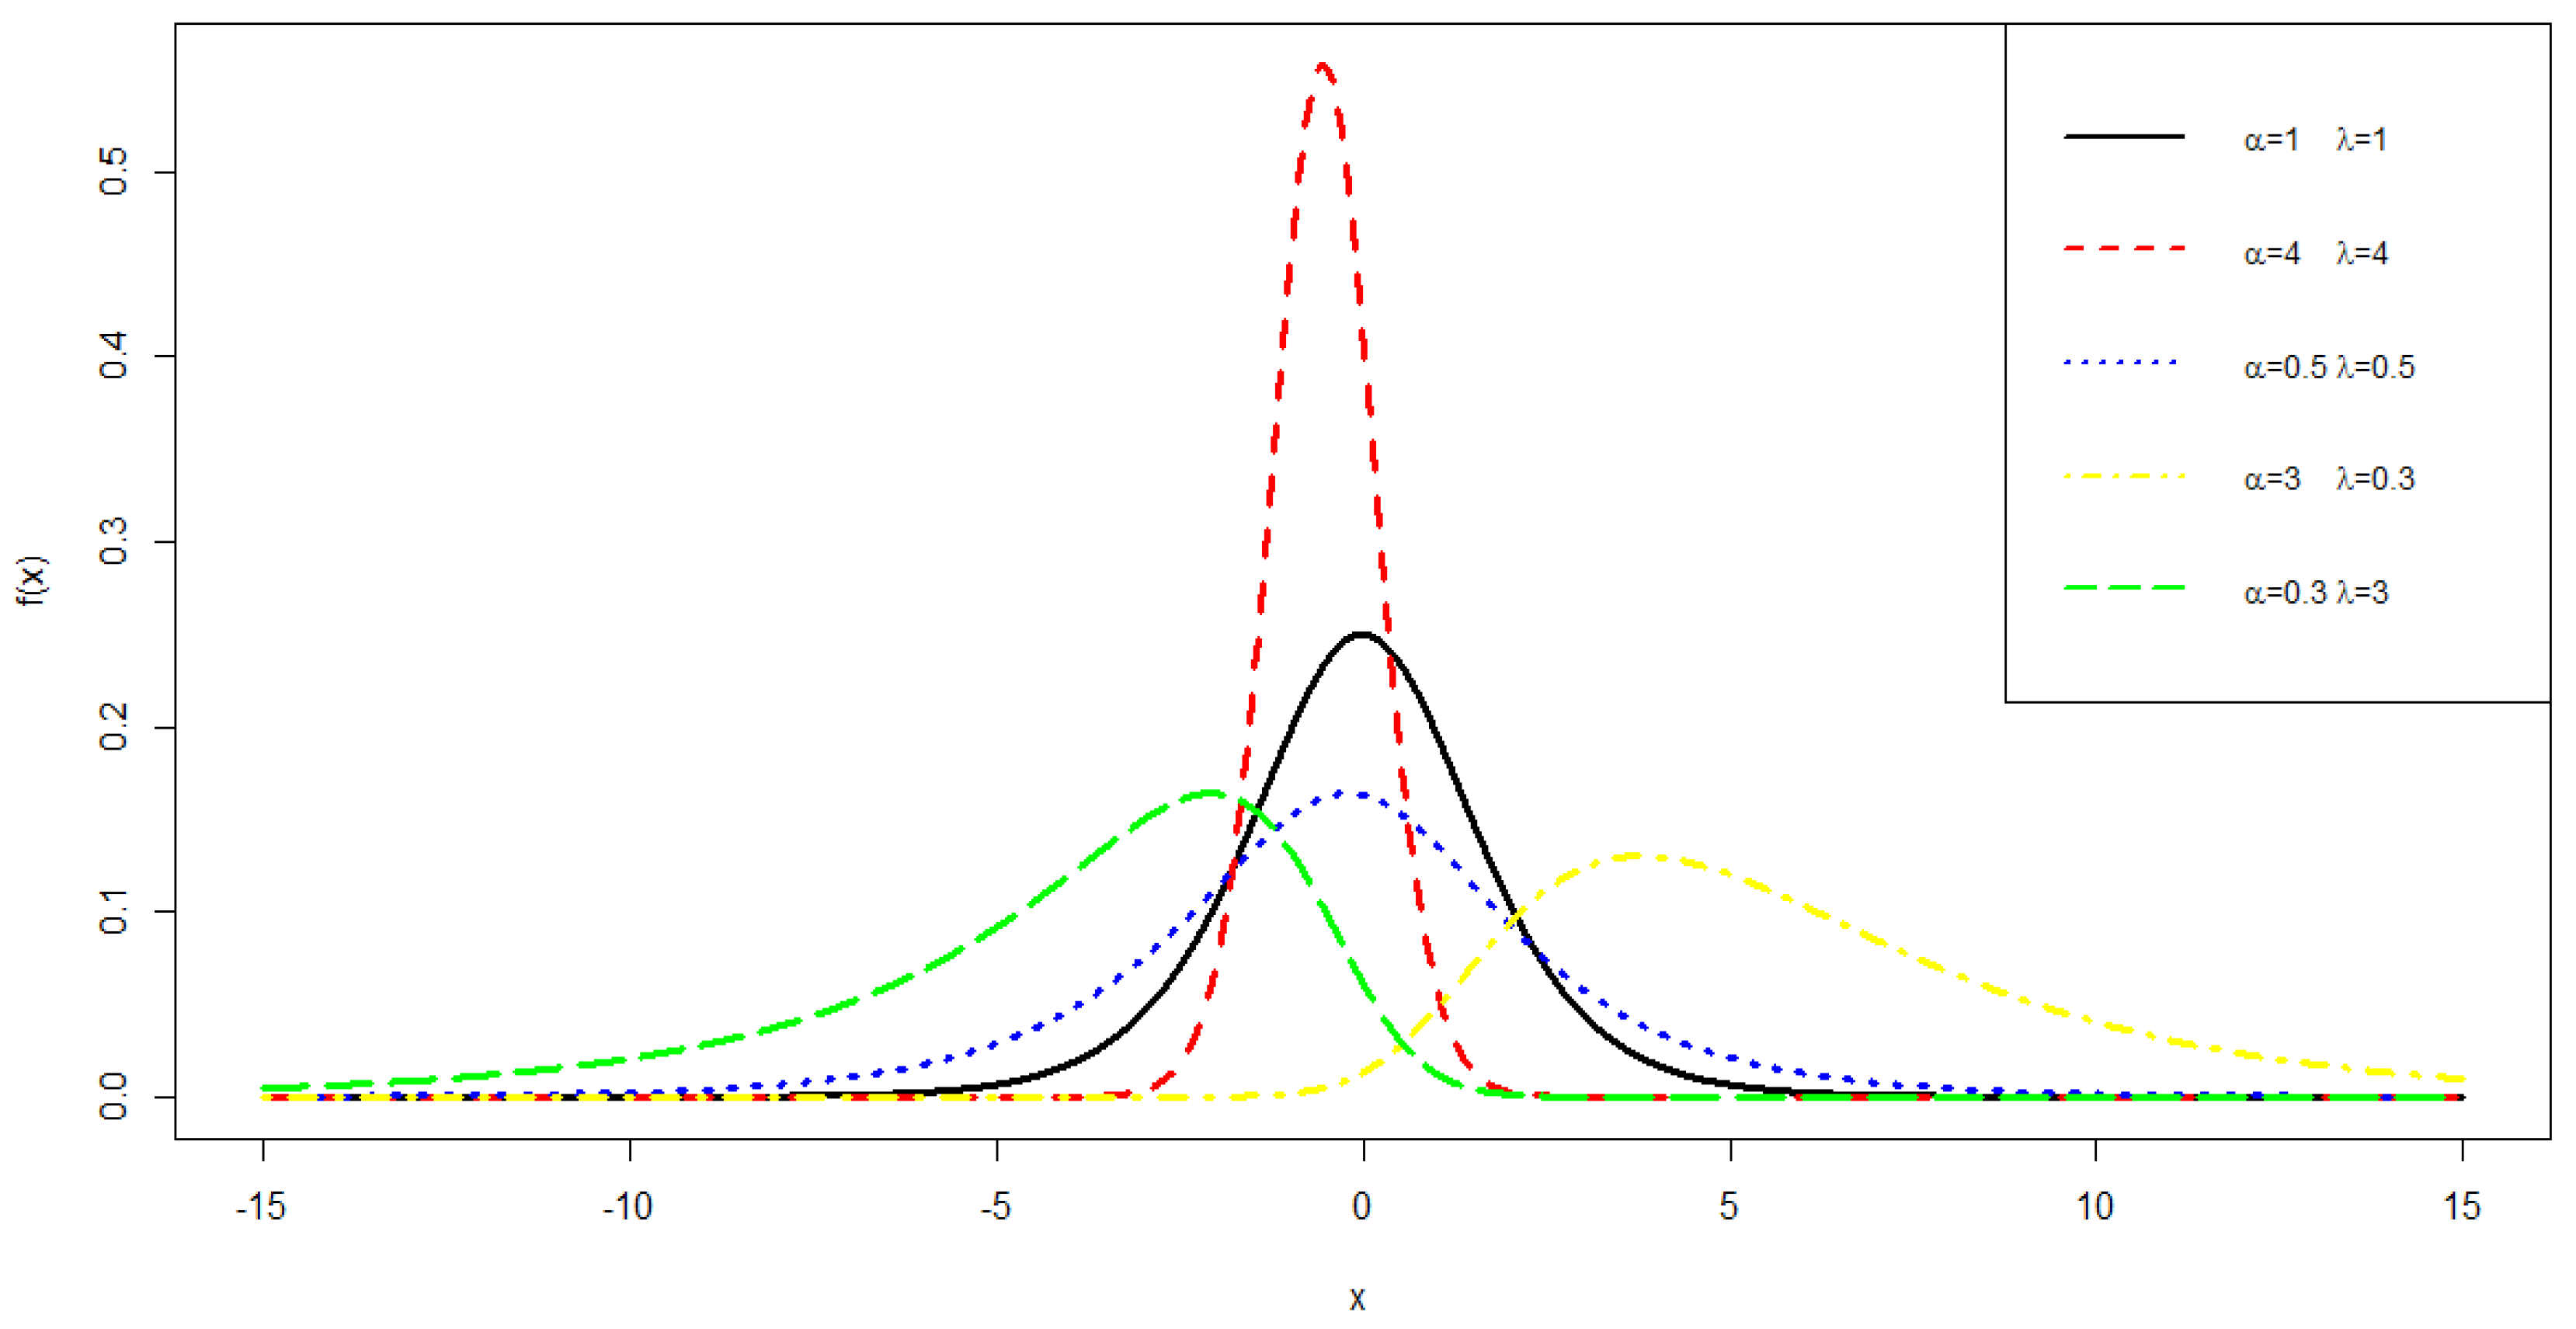
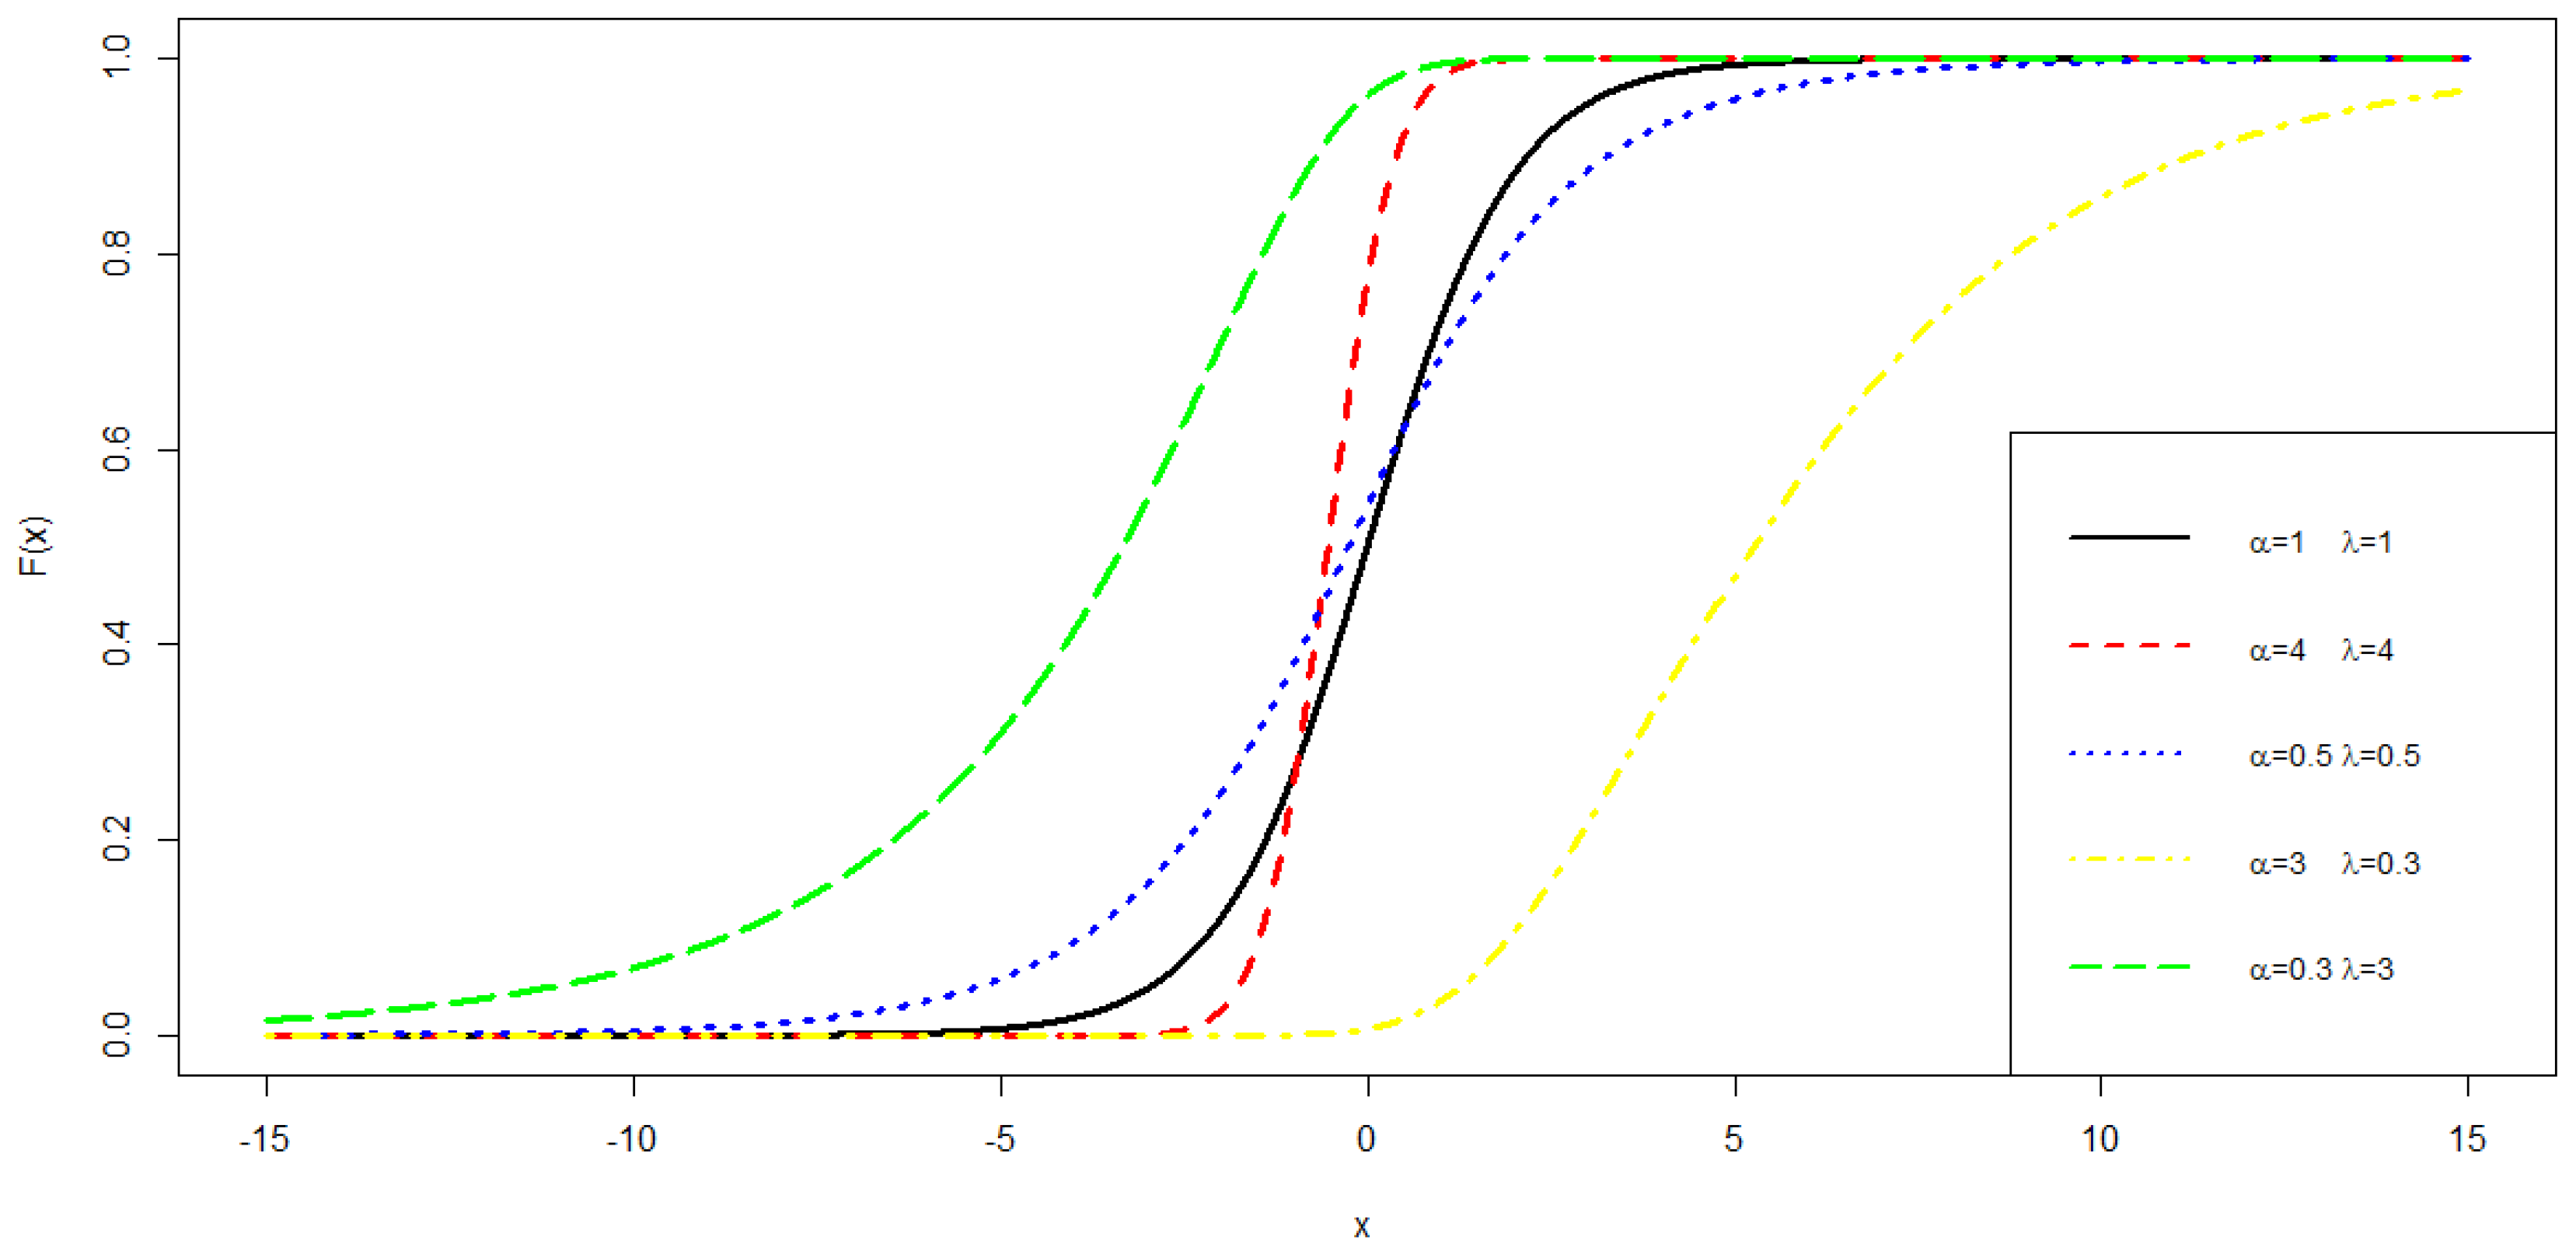
- Scenario 2: , represent the lighter tails compared to the logit;
- Scenario 3: , represent the heavier tails compared to the logit;
- Scenario 4: , represent the positive skewness;
- Scenario 5: , represent the negative skewness;
- Scenario 6: ;
- Scenario 7: .
5. Application
5.1. Beetle Mortality Dataset
5.2. The Potency of Three Different Poisons Dataset
6. Conclusions
Author Contributions
Funding
Acknowledgments
Conflicts of Interest
References
- McCullagh, P.; Nelder, J.A. Generalized Linear Models, 2nd ed.; Chapman and Hall: London, UK, 1989. [Google Scholar]
- Agresti, A. Categorical Data Analysis, 3rd ed.; John Wiley and Sons Inc.: New York, NY, USA, 2013. [Google Scholar]
- Pérez–Sánchez, J.M.; Gómez–Déniz, E.; Dávila–Cárdenes, N. A comparative study of logistic models using an asymmetric link: Modelling the away victories in football. Symmetry 2018, 10, 224. [Google Scholar] [CrossRef]
- Li, J. Choosing the Proper Link Function for Binary Data. Ph.D. Thesis, The University of Texas, Austin, TX, USA, 2014. [Google Scholar]
- Czado, C.; Santner, T.J. The effect of link misspecification on binary regression inference. J. Stat. Plan. Inference 1992, 33, 213–231. [Google Scholar] [CrossRef]
- Tiku, M.L.; Vaughan, D.C. Logistic and Nonlogistic Density Funcitons in Binary Regression with Nonstochastic Covariates. Biom. J. 1997, 39, 883–898. [Google Scholar] [CrossRef]
- Dobson, A.J.; Barnett, A.G. An Introduction to Generalized Linear Models, 3rd ed.; CRC Press: Boca Raton, FL, USA, 2008. [Google Scholar]
- Nagler, J. Scobit: An alternative estimator to logit and probit. Am. J. Political Sci. 1994, 38, 230–255. [Google Scholar] [CrossRef]
- Chen, M.H.; Dey, D.K.; Shao, Q.M. A new skewed link model for dichotomous quantal response data. J. Am. Stat. Assoc. 1999, 94, 1172–1186. [Google Scholar] [CrossRef]
- Collet, D. Modelling Binary Data, 2nd ed.; Chapman & Hall/CRC: Boca Raton, FL, USA, 2003. [Google Scholar]
- Jiang, X.; Dey, D.K.; Prunier, R.; Wilson, A.M.; Holsinger, K.E. A new class of flexible link functions with application to species co-occurrence in cape floristic region. Ann. Appl. Stat. 2013, 7, 2180–2204. [Google Scholar] [CrossRef]
- Stukel, T. Generalized logistic models. J. Am. Stat. Assoc. 1988, 83, 426–431. [Google Scholar] [CrossRef]
- Albert, J.; Chib, S. Bayesian analysis of binary and polychotomous response data. J. Am. Stat. Assoc. 1993, 88, 669–679. [Google Scholar] [CrossRef]
- Kim, S.; Chen, M.H.; Dey, D.K. Flexible generalized t-link models for binary response data. Biometrika 2008, 95, 93–106. [Google Scholar] [CrossRef]
- Bazán, J.L.; Bolfarine, H.; Branco, M.D. A framework for skew-probit links in binary regression. Commun. Stat. Theory Methods 2010, 39, 678–697. [Google Scholar] [CrossRef]
- Naranjo, L.; Pérez, C.J.; Martín, J. Bayesian analysis of some models that use the asymmetric exponential power distribution. Stat. Comput. 2015, 25, 497–514. [Google Scholar] [CrossRef]
- Caron, R.; Sinha, D.; Dey, D.K.; Polpo, A. Categorical data analysis using a skewed weibull regression model. Entropy 2018, 20, 176. [Google Scholar] [CrossRef]
- Ghosh, I.; Alzaatreh, A. A new class of generalized logistic distribution. Commun. Stat. 2018, 47, 2043–2055. [Google Scholar] [CrossRef]
- Oral, E. Binary Regression with Stochastic Covariates. Commun. Stat. Theory Methods 2006, 35, 1429–1447. [Google Scholar] [CrossRef]
- Valle, L.D.; Leisen, F.; Rossini, L.; Zhu, W. Bayesian analysis of immigration in Europe with generalized logistic regression. J. Appl. Stat. 2019, 1–15. [Google Scholar] [CrossRef]
- Prentice, R.L. A Generalization of the Probit and Logit Methods for Dose Response Curves. Biometrics 1976, 32, 761–768. [Google Scholar] [CrossRef]
- Bliss, C. The calculation of the dosage-mortality curve. Ann. Appl. Biol. 1935, 22, 134–167. [Google Scholar] [CrossRef]
- Finney, D.J. Probit Analysis; University Press: Cambridge, UK, 1947. [Google Scholar]
- Alzaatreh, A.; Lee, C.; Famoye, F. A new method for generating families of continuous distribution. Metron 2013, 71, 63–79. [Google Scholar] [CrossRef]
- Gupta, R.D.; Kundu, D. Exponentiated exponential family: An alternative to gamma and weibull distributions. Biom. J. 2001, 43, 117–130. [Google Scholar] [CrossRef]
- Plummer, M. JAGS: A program for analysis of Bayesian graphical models using Gibbs sampling. In Proceedings of the 3rd International Workshop on Distributed Statistical Computing (DSC 2003), Vienna, Austria, 20–22 March 2003. [Google Scholar]
- Kellner, K. jagsUI: A Wrapper around rjags to Streamline JAGS Analyses. Available online: https://cran.r-project.org/web/packages/jagsUI (accessed on 2 December 2019).
- Gelman, A.; Rubin, D.B. Inference from iterative simulation using multiple sequences. Stat. Sci. 1992, 7, 457–472. [Google Scholar] [CrossRef]
- Brooks, S.; Gelman, A. General methods for monitoring convergence of iterative simulations. J. Comput. Graph. Stat. 1998, 7, 434–455. [Google Scholar]
- Raftery, A.E.; Lewis, S.M. How many iterations in the Gibbs sampler. In Bayesian Statistics 4; Bernardo, J.M., Smith, A.F.M., Dawid, A.P., Berger, J.O., Eds.; Oxford University Press: New York, NY, USA, 1992; pp. 763–774. [Google Scholar]
- Spiegelhalter, D.J.; Best, N.G.; Carlin, B.P.; Van der Linde, A. Bayesian measures of model complexity and fit (with discussion). J. R. Stat. Soc. Ser. B: Stat. Methodol. 2002, 64, 583–640. [Google Scholar] [CrossRef]


| Scenarios | Glogit Link | Logit Link | Cloglog Link | Probit Link | ||||
|---|---|---|---|---|---|---|---|---|
| DIC | AE | DIC | AE | DIC | AE | DIC | AE | |
| 1 | 815.21 ** | 0.1903 ** | 813.74 * | 0.1589 * | 1116.61 | 1.7661 | 824.27 | 0.3413 |
| 2 | 697.04 * | 0.1409 * | 746.97 | 0.5093 | 1903.64 | 2.5617 | 712.61 ** | 0.2909 ** |
| 3 | 826.91 * | 0.1980 * | 827.74 ** | 0.2021 ** | 916.40 | 0.9986 | 833.12 | 0.2904 |
| 4 | 462.63 * | 0.0545 * | 539.94 | 0.2971 | 557.11 | 0.3286 | 477.06 ** | 0.1396 ** |
| 5 | 597.04 * | 0.0895 * | 822.00 | 0.8047 | 599.08 ** | 0.1038 ** | 655.23 | 0.4173 |
| 6 | 745.41 ** | 0.1934 ** | 1613.28 | 2.4169 | 742.98 * | 0.1369 * | 1378.13 | 2.0713 |
| 7 | 776.19 ** | 0.2139 ** | 825.32 | 0.6017 | 1611.83 | 2.4673 | 771.02 * | 0.1249 * |
| log(dose) | n | ndead | p |
|---|---|---|---|
| 49.1 | 59 | 6 | 0.102 |
| 53.0 | 60 | 13 | 0.217 |
| 56.9 | 62 | 18 | 0.290 |
| 60.8 | 56 | 28 | 0.500 |
| 64.8 | 63 | 52 | 0.825 |
| 68.7 | 59 | 53 | 0.898 |
| 72.6 | 62 | 61 | 0.984 |
| 76.5 | 60 | 60 | 1 |
| Parameters | Model [Posterior Mean (Standard Deviation)] | |||||
|---|---|---|---|---|---|---|
| Probit | T(8) | SP | SGT | AEP | Glogit | |
| −33.88 (1.91) | −35.17 (2.03) | −34.45 (2.06) | −8.3 (1.73) | −35.16 (0.36) | −16.56 (5.08) | |
| 19.14 (1.04) | 19.86 (1.14) | 19.43 (1.14) | 4.69 (0.98) | 19.69 (0.21) | 0.25 (0.08) | |
| - | ||||||
| - | ||||||
| DIC | 39.26 | 41.22 | 40.22 | 36.72 | 36.43 ** | 35.09 * |
| AE | 0.35 | 0.37 | 0.35 | 0.25 | 0.15 * | 0.18 ** |
| Rotenone | Deguelin | Mixture | ||||||
|---|---|---|---|---|---|---|---|---|
| log(dose) | dead | n | log(dose) | dead | n | log(dose) | dead | n |
| 1.01 | 44 | 50 | 1.7 | 48 | 48 | 1.4 | 48 | 50 |
| 0.89 | 42 | 49 | 1.61 | 47 | 50 | 1.31 | 43 | 46 |
| 0.71 | 24 | 46 | 1.48 | 47 | 49 | 1.18 | 38 | 48 |
| 0.58 | 16 | 48 | 1.31 | 34 | 48 | 1 | 27 | 46 |
| 0.41 | 6 | 50 | 1 | 18 | 48 | 0.71 | 22 | 46 |
| 0.71 | 16 | 49 | 0.4 | 7 | 47 | |||
| Parameters | Model [Posterior Mean (Standard Deviation)] | |||
|---|---|---|---|---|
| SP | AEP | SW | glogit | |
| −2.19 (0.40) | −4.98 (1.51) | 0.27 (0.20) | −10.78 (0.81) | |
| 2.65 (0.22) | 5.27 (1.48) | 0.78 (0.23) | 9.08 (0.74) | |
| 0.38 (0.13) | 1.23 (0.46) | 0.12 (0.04) | 1.89 (0.37) | |
| −0.50 (0.13) | −1.01 (0.38) | −0.15 (0.06) | −1.74 (0.40) | |
| - | ||||
| - | ||||
| DIC | 751.92 | 749.01 ** | 751.38 | 747.75 * |
| MAE | 0.0662 | 0.0564 ** | 0.0644 | 0.0497 * |
© 2020 by the authors. Licensee MDPI, Basel, Switzerland. This article is an open access article distributed under the terms and conditions of the Creative Commons Attribution (CC BY) license (http://creativecommons.org/licenses/by/4.0/).
Share and Cite
Prasetyo, R.B.; Kuswanto, H.; Iriawan, N.; Ulama, B.S.S. Binomial Regression Models with a Flexible Generalized Logit Link Function. Symmetry 2020, 12, 221. https://doi.org/10.3390/sym12020221
Prasetyo RB, Kuswanto H, Iriawan N, Ulama BSS. Binomial Regression Models with a Flexible Generalized Logit Link Function. Symmetry. 2020; 12(2):221. https://doi.org/10.3390/sym12020221
Chicago/Turabian StylePrasetyo, Rindang Bangun, Heri Kuswanto, Nur Iriawan, and Brodjol Sutijo Suprih Ulama. 2020. "Binomial Regression Models with a Flexible Generalized Logit Link Function" Symmetry 12, no. 2: 221. https://doi.org/10.3390/sym12020221
APA StylePrasetyo, R. B., Kuswanto, H., Iriawan, N., & Ulama, B. S. S. (2020). Binomial Regression Models with a Flexible Generalized Logit Link Function. Symmetry, 12(2), 221. https://doi.org/10.3390/sym12020221


