Photovoltaic Modules Selection from Shading Effects on Different Materials


 , and
, and 
Abstract
:1. Introduction
2. Literature Review
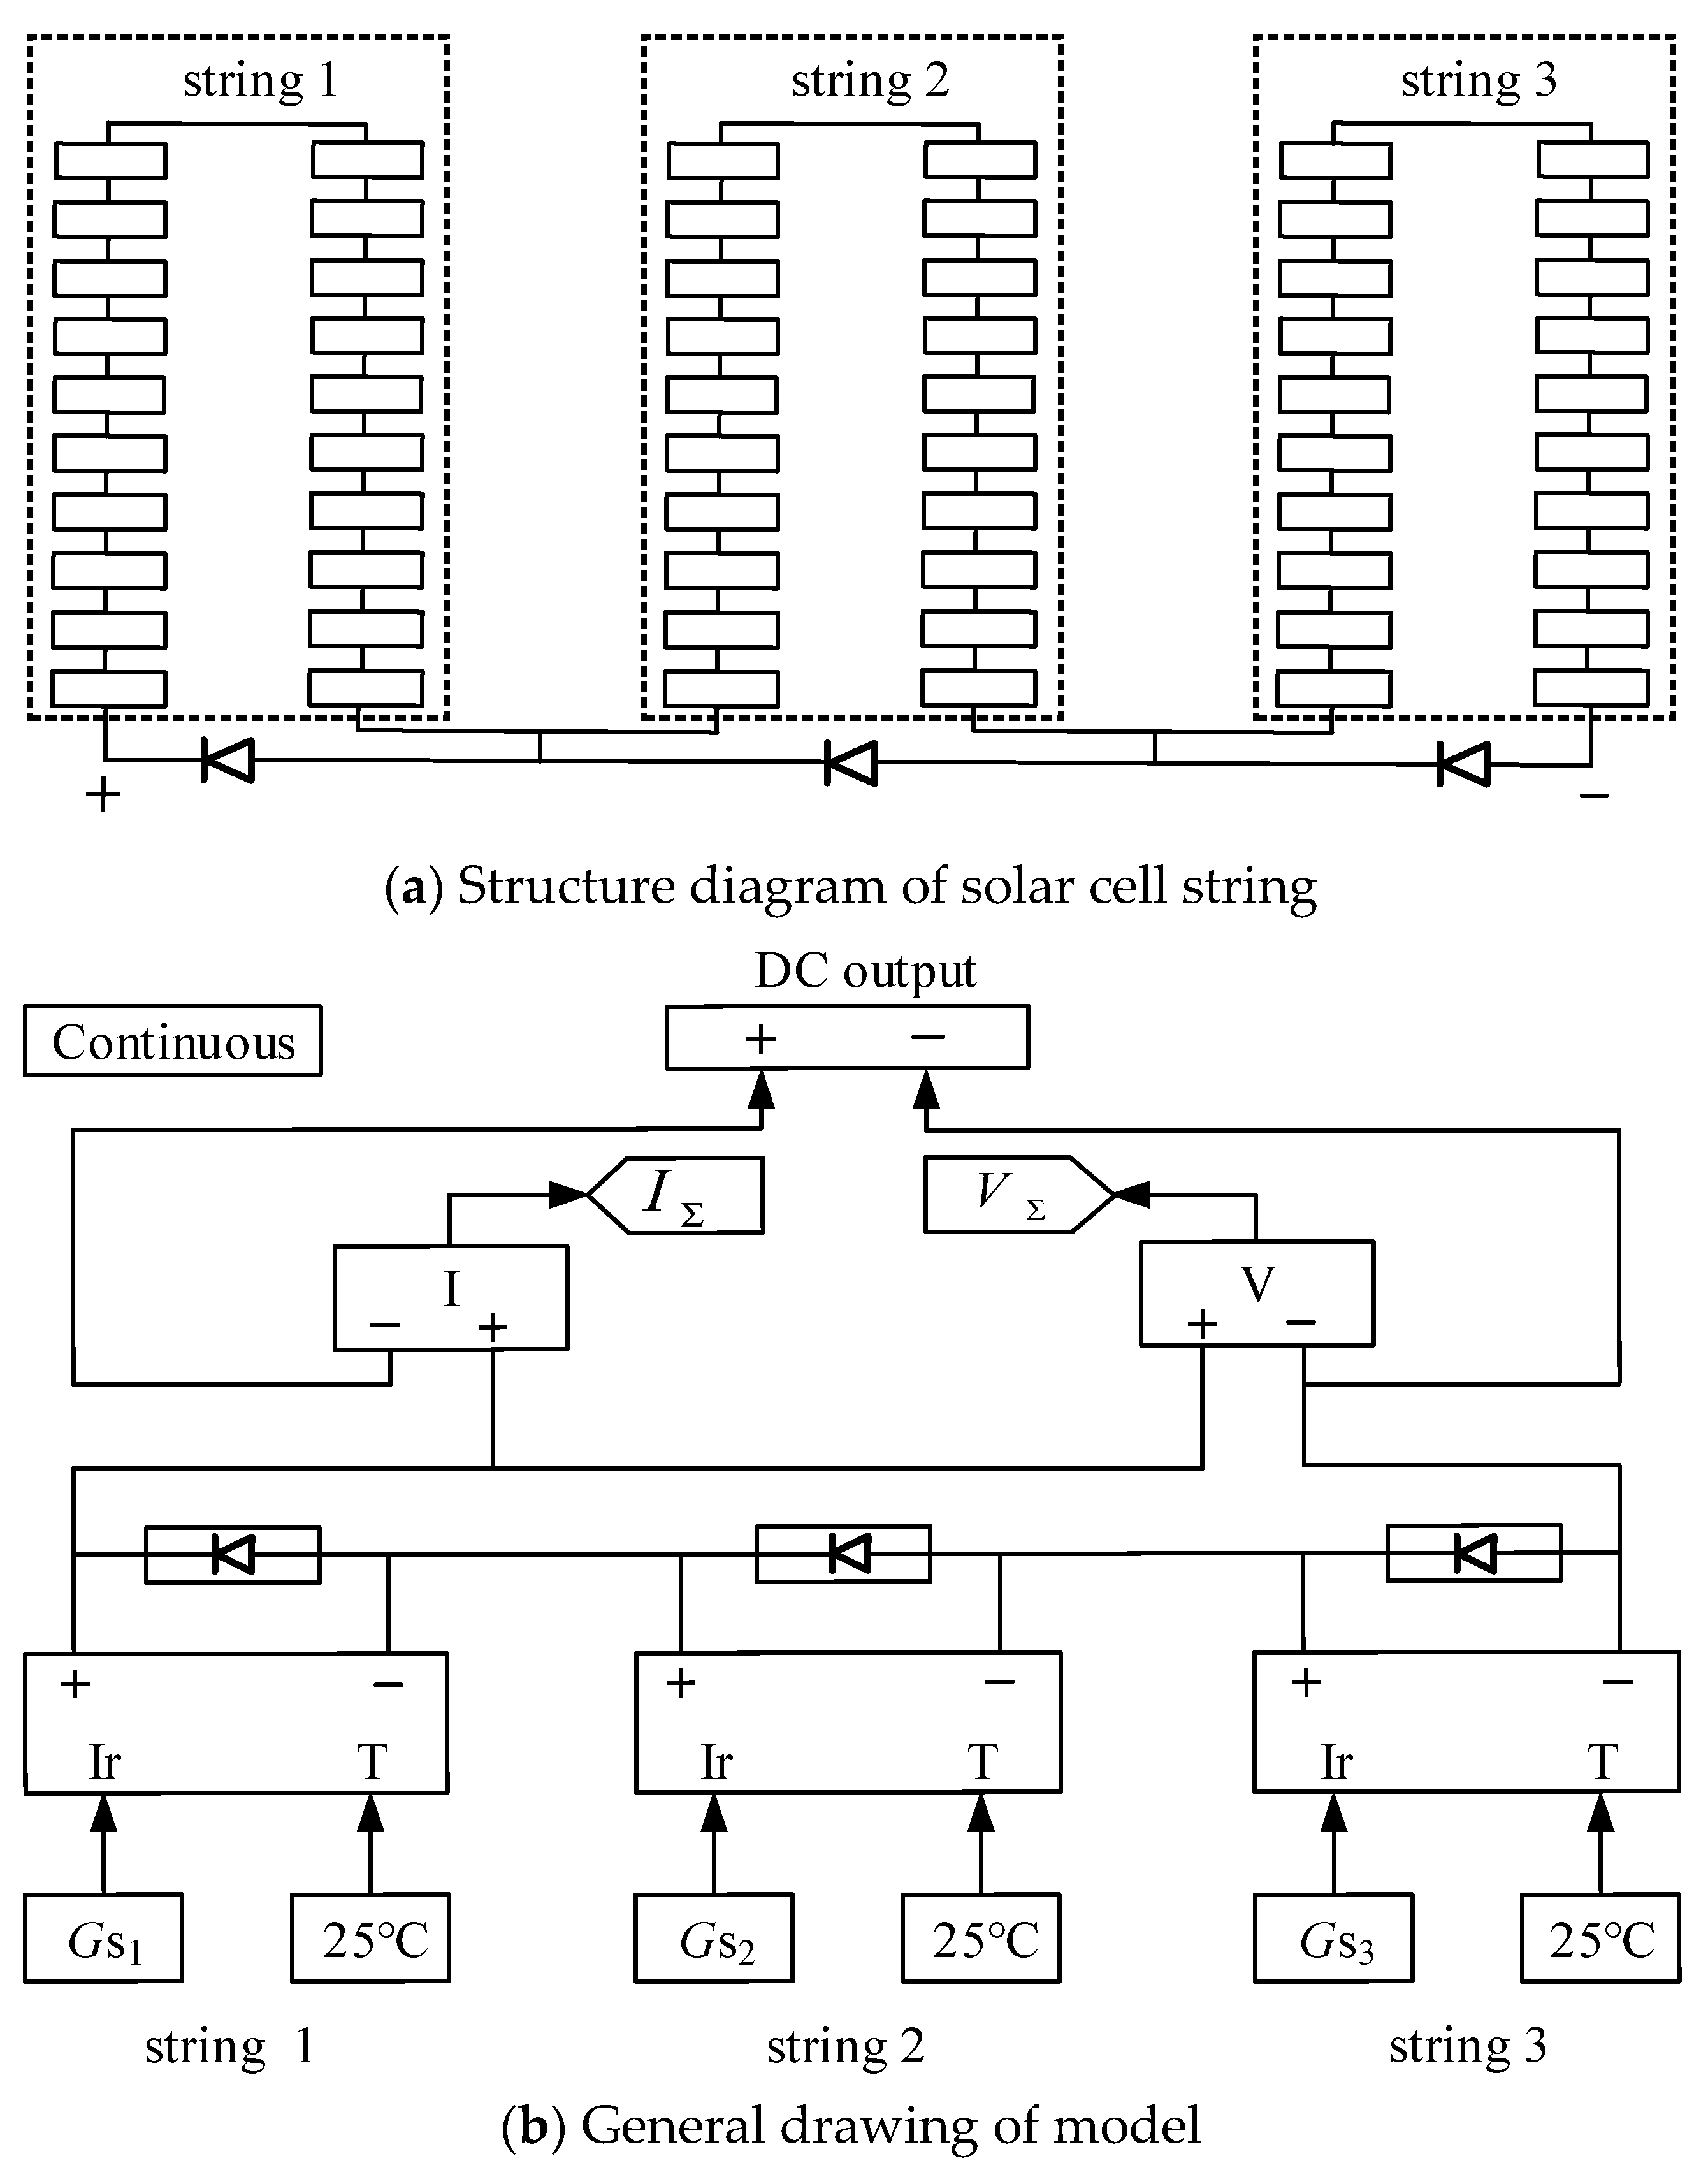
3. Mathematical Modeling
4. Results
5. Concluding Remarks
- The output power of the photovoltaic module is directly proportional to the irradiance of the applied light level.
- The output voltage of the photovoltaic module slightly increases and the output current greatly decreases from no shading (the irradiance of light shining on the photovoltaic panel is 1000 W/m2) to shading (light with irradiance of 1000, 300 and 540 W/m2 shines on different parts of the photovoltaic panel at the same time).
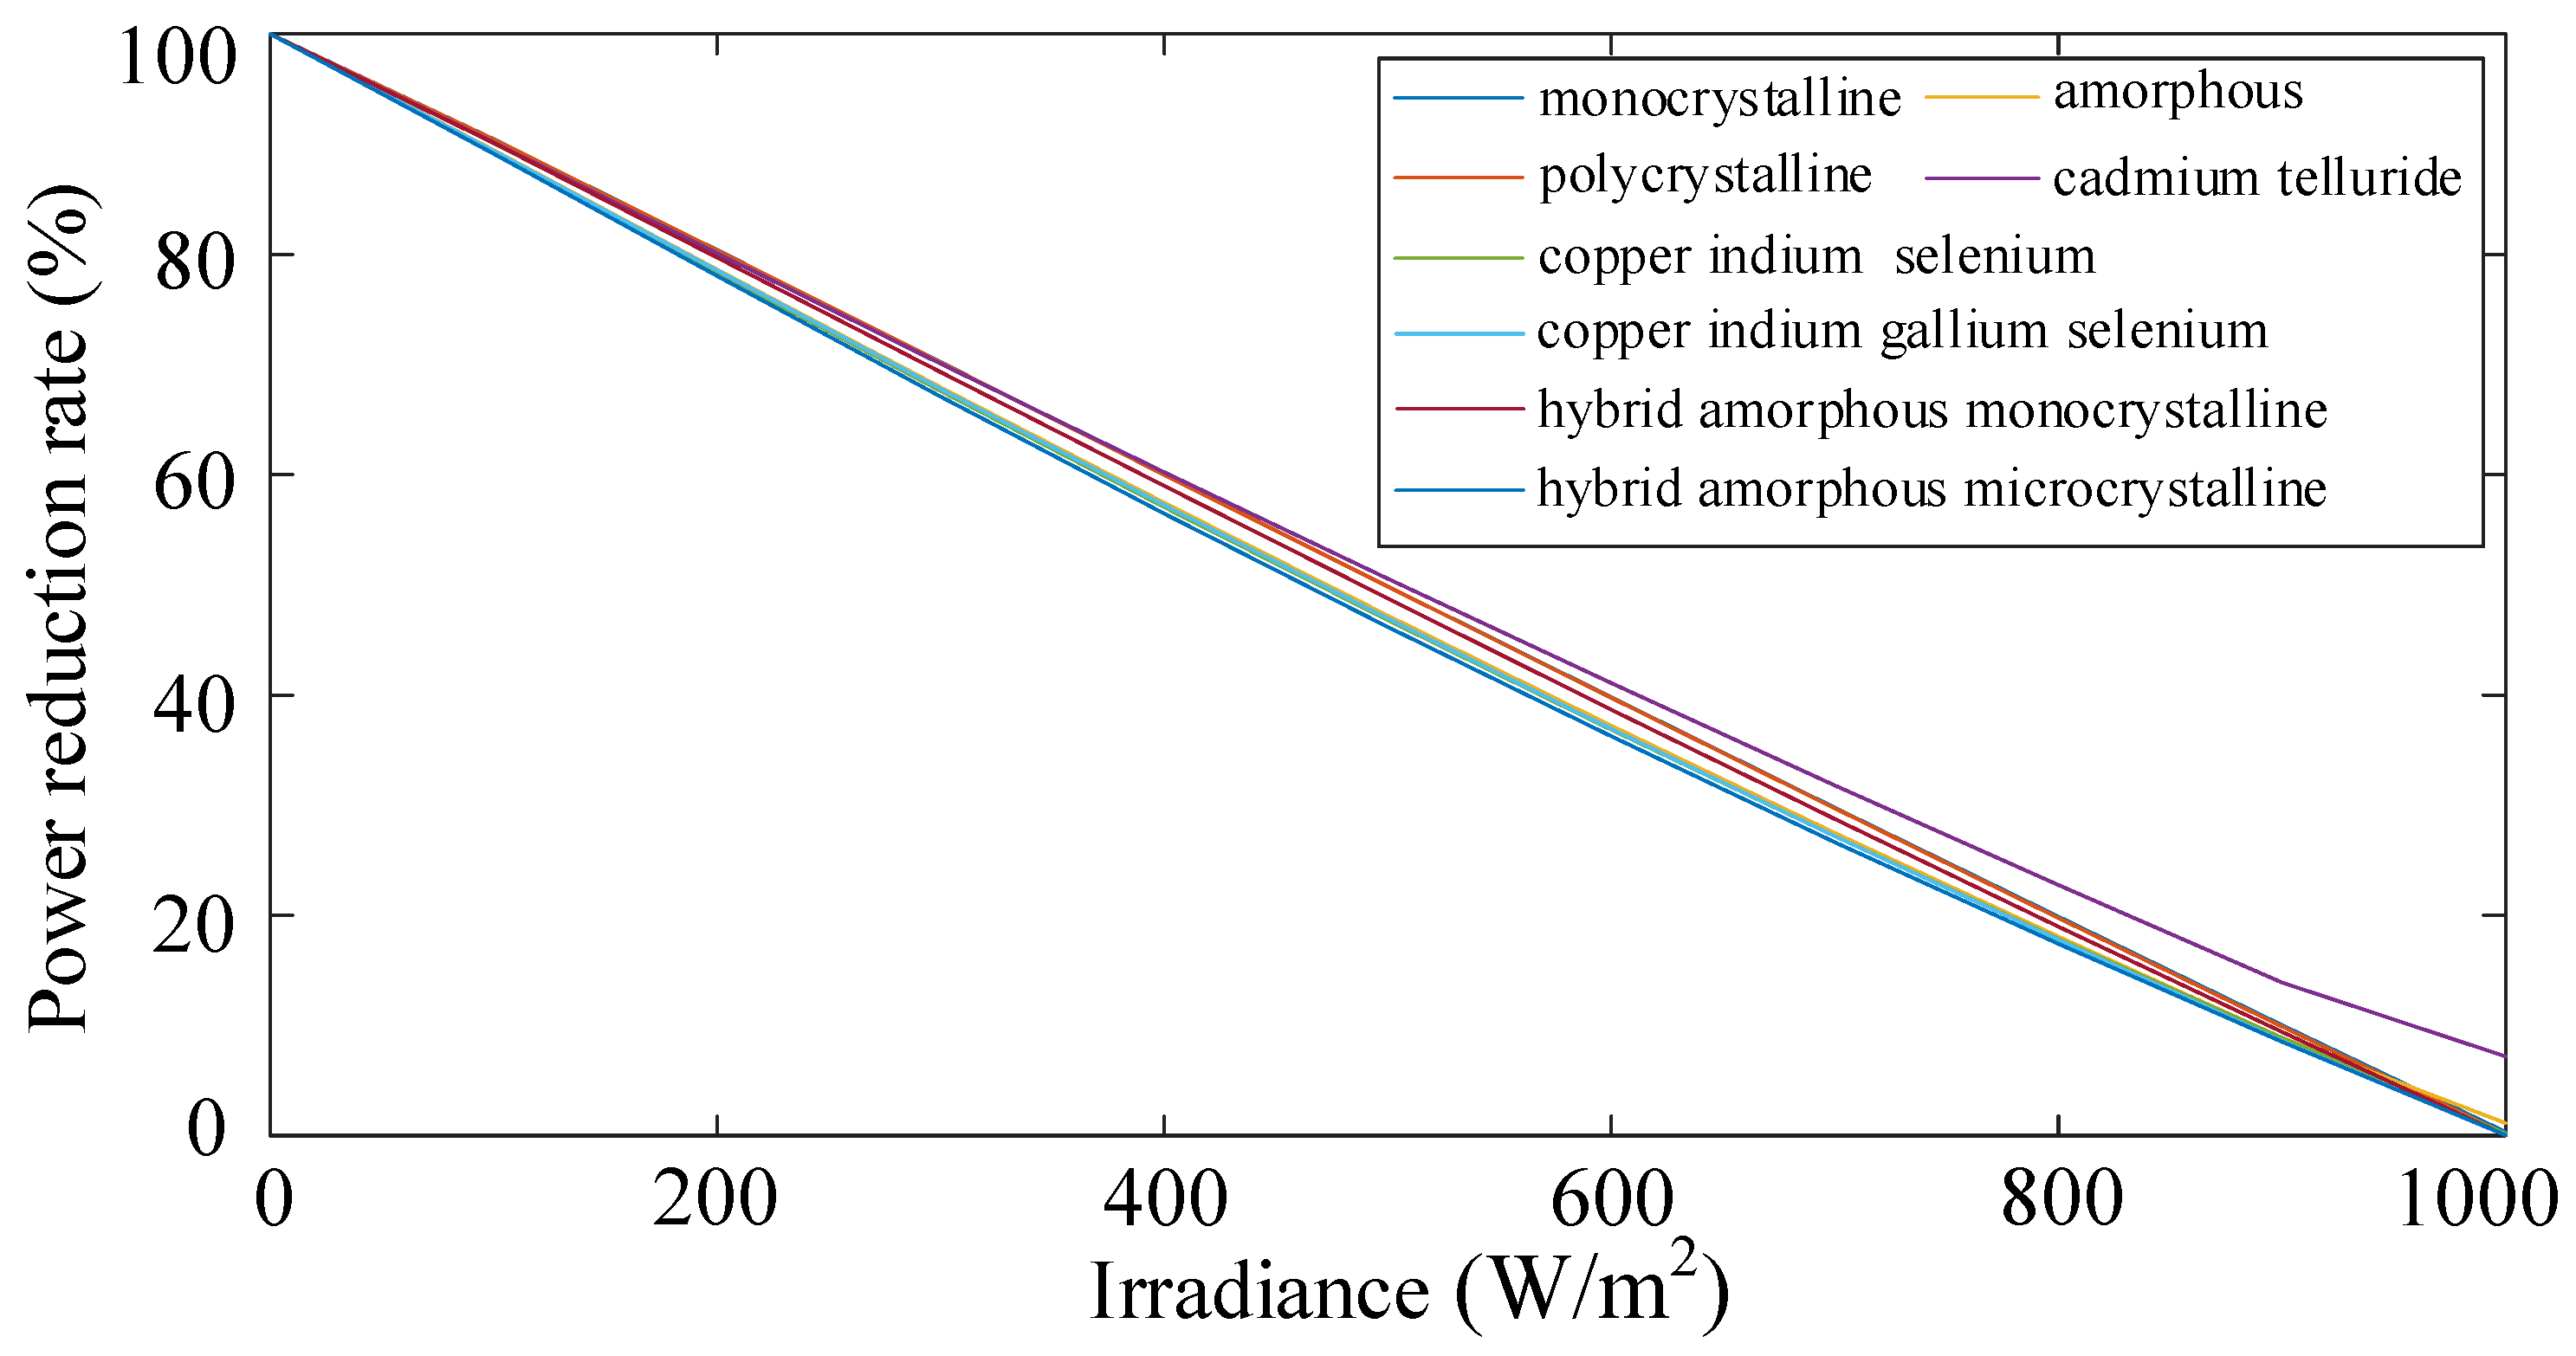
- The output power reduction rate of different photovoltaic modules is different when the irradiance changes. Specifically, from no shading to shading, the output power of monocrystalline photovoltaic modules and polycrystalline photovoltaic modules, which belong to crystalline photovoltaic modules, reduced within the ranges of 27.2–28.1% and 27.1–27.8%, respectively. The output power of amorphous photovoltaic modules, cadmium telluride photovoltaic modules, copper indium selenium photovoltaic modules, copper indium gallium selenium photovoltaic modules, hybrid amorphous monocrystalline photovoltaic modules and hybrid amorphous microcrystalline photovoltaic modules, which belong to thin film photovoltaic modules, reduced within the ranges of 19.9–23.6%, 24.7–25.2%, 21.1–23.0%, 21.6–24.2%, 25.0–26.3% and 16.9–23.0%, respectively.
- The power reduction rate of thin film photovoltaic modules is lower than that of crystalline photovoltaic modules when they are shaded; therefore, it is confirmed to use thin film photovoltaic modules in photovoltaic power generation environments where shading cannot be avoided. The findings in this study are helpful to improve the power production efficiency, reduce the investment cost of renewable energy generation systems and promote the development and utilization of renewable energy.
Author Contributions
Funding
Conflicts of Interest
References
- Taylor, T.G.; Tainter, J.A. The nexus of population, energy, innovation, and complexity. Am. J. Econ. Sociol. 2016, 75, 1005–1043. [Google Scholar] [CrossRef]
- Papadopoulou, S.D.; Kalaitzoglou, N.; Psarra, M.; Lefkeli, S. Addressing energy poverty through transitioning to a carbon-free environment. Sustainability 2019, 11, 2634. [Google Scholar] [CrossRef] [Green Version]
- Li, L.L.; Liu, Y.W.; Tseng, M.L. Reducing environmental pollution and fuel consumption using optimization algorithm to develop combined cooling heating and power system operation strategies. J. Clean. Prod. 2019, 247, 119082. [Google Scholar] [CrossRef]
- Gielen, D.; Boshell, F.; Saygin, D. The role of renewable energy in the global energy transformation. Energy Strategy Rev. 2019, 24, 38–50. [Google Scholar] [CrossRef]
- Liu, Z.F.; Li, L.L.; Tseng, M.L.; Lim, M.K. Prediction short-term photovoltaic power using improved chicken swarm optimizer-Extreme learning machine model. J. Clean. Prod. 2020, 248, 119272. [Google Scholar] [CrossRef]
- Wang, J.D. A Short-Term Photovoltaic Power prediction model based on the gradient boost decision tree. Appl. Sci. 2018, 8, 689. [Google Scholar] [CrossRef] [Green Version]
- Wang, Z.; Zhang, Z.M.; Quan, X. A perfect absorber design using a natural hyperbolic material for harvesting solar energy. Sol. Energy 2018, 159, 329–336. [Google Scholar] [CrossRef]
- Abedinia, O.; Amjady, N.; Ghadimi, N. Solar energy forecasting based on hybrid neural network and improved metaheuristic algorithm. Comput. Intell. 2018, 34, 241–260. [Google Scholar] [CrossRef]
- Li, L.L.; Wen, S.Y.; Tseng, M.L.; Chiu, A.S.F. Photovoltaic array prediction on short-term output power method in centralized power generation system. Ann. Oper. Res. 2020, 290, 243–263. [Google Scholar] [CrossRef]
- Li, L.L.; Li, H.Y.; Tseng, M.L.; Feng, H.; Chiu, A.S.F. Renewable energy system on frequency stability control strategy using virtual synchronous generator. Symmetry 2020, 12, 1697. [Google Scholar] [CrossRef]
- Yuan, F.; Li, M.J.; Qiu, Y. Specific heat capacity improvement of molten salt for solar energy applications using charged single-walled carbon nanotubes. Appl. Energy 2019, 250, 1481–1490. [Google Scholar] [CrossRef]
- Pannebakker, B.B.; De Waal, A.C. Photovoltaics in the shade: One bypass diode per solar cell revisited. Prog. Photovolt. Res. Appl. 2017, 25, 836–849. [Google Scholar] [CrossRef] [Green Version]
- Bi, Z.; Ma, J.; Pan, X.; Wang, J.; Chi, Y. ANFIS-Based modeling for photovoltaic characteristics estimation. Symmetry 2016, 8, 96. [Google Scholar] [CrossRef] [Green Version]
- Yang, W.S.; Noh, J.H.; Jeon, N.J. High-performance photovoltaic perovskite layers fabricated through intramolecular exchange. Science 2015, 348, 1234–1237. [Google Scholar] [CrossRef] [PubMed]
- Ye, Q.; Xu, Y.; Chen, W. Enhanced photovoltaic performance of Sb_2S_3-sensitized solar cells through surface treatments. Appl. Surf. Sci. 2018, 440, 294–299. [Google Scholar] [CrossRef]
- Alfadhili, F.K.; Phillips, A.B.; Liyanage, G.K.; Gibbs, J.M.; Jamarkattel, M.K.; Heben, M.J. Controlling band alignment at the back interface of cadmium telluride solar cells using ZnTe and Te buffer layers. MRS Adv. 2019, 4, 1–7. [Google Scholar] [CrossRef]
- Doroody, C.; Rahman, K.S.; Rosly, H.N. Impact of high resistivity transparent (HRT) layer in cadmium telluride solar cells from numerical simulation. J. Renew. Sustain. Energy 2020, 12, 23702. [Google Scholar] [CrossRef]
- Montoya, O.D.; Grisales-Noreña, L.F.; Gil-González, W.; Alcalá, G.; Hernandez-Escobedo, G. Optimal location and sizing of PV sources in DC networks for minimizing greenhouse emissions in diesel generators. Symmetry 2020, 12, 322. [Google Scholar] [CrossRef] [Green Version]
- Saini, R.P. Feasibility and sensitivity analysis of an off-grid micro hydro-photovoltaic-biomass and biogas-diesel-battery hybrid energy system for a remote area in Uttarakhand state, India. Renew. Sustain. Energy Rev. 2016, 61, 53–69. [Google Scholar]
- Aramesh, M.; Kasaeian, A.; Pourfayaz, F. A detailed investigation of the walls shading effect on the performance of solar ponds. Environ. Prog. Sustain. Energy 2018, 38, e13014. [Google Scholar] [CrossRef]
- Teo, J.; Tan, R.; Mok, V.; Ramachandaramurthy, V.K.; Tan, C. Impact of partial shading on the PV characteristics and the maximum power of a photovoltaic string. Energies 2018, 11, 1860. [Google Scholar] [CrossRef] [Green Version]
- Green, M.A. Crystalline and thin-film silicon solar cells: State of the art and future potential. Sol. Energy 2003, 74, 181–192. [Google Scholar] [CrossRef]
- Niazi, K.A.; Yang, Y.; Nasir, M.; Sera, D. Evaluation of interconnection configuration schemes for PV modules with switched-inductor converters under partial shading conditions. Energies 2019, 12, 2802. [Google Scholar] [CrossRef] [Green Version]
- Cai, L.; Dai, N.; Tan, Z. Research on mathematical model and calculation simulation of wireless sensor solar cells in internet of things. EURASIP J. Wirel. Commun. Netw. 2018, 116. [Google Scholar] [CrossRef] [Green Version]
- Kreft, W.; Filipowicz, M.; Odek, M. Reduction of electrical power loss in a photovoltaic chain in conditions of partial shading. Opt. Int. J. Light Electron. Opt. 2019, 202, 163559. [Google Scholar] [CrossRef]
- Polman, A.; Knight, M.; Garnett, E.C. Photovoltaic materials: Present efficiencies and future challenges. Science 2016, 352, aad4424. [Google Scholar] [CrossRef] [Green Version]
- Vulkan, A.; Kloog, I.; Dorman, M. Modeling the potential for PV installation in residential buildings in dense urban area. Energy Build. 2018, 169, 97–109. [Google Scholar] [CrossRef]
- Hamakawa, Y. Thin-film solar cells: Next generation photovoltaics and its applications. Springer 2004, 26, 894–897. [Google Scholar]
- Chu, T.L.; Chu, S.S. Recent progress in thin-film cadmium telluride solar cells. Prostate 2010, 1, 31–42. [Google Scholar] [CrossRef]
- Luceño-Sánchez, J.A.; Díez-Pascual, A.M.; Peña, C.R. Materials for photovoltaics: State of art and recent developments. Int. J. Mol. Sci. 2019, 20, 976. [Google Scholar] [CrossRef] [Green Version]
- Hegedus, S. Thin film solar modules: The low cost, high throughput and versatile alternative to Si wafers. Prog. Photovolt. Res. Appl. 2006, 14, 393–411. [Google Scholar] [CrossRef]
- Wu, W.W.; Lee, Y.T.; Tseng, M.L.; Chiang, Y.H. Data mining for exploring hidden patterns between KM and its performance. Knowl. Based Syst. 2010, 23, 397–401. [Google Scholar] [CrossRef]
- Zhou, D.L.; Gan, Z.K.; Liao, D. Research Progress of a-Si: H Thin Film Solar Cells. Chin. J. Power Sources 2018, 744–746. Available online: http://en.cnki.com.cn/Article_en/CJFDTotal-DYJS201805046.htm (accessed on 15 December 2020).
- Sharma, S.; Jain, K.K.; Sharma, A. Solar cells: In research and applications—A review. Mater. Sci. Appl. 2015, 6, 1145–1155. [Google Scholar] [CrossRef] [Green Version]
- Sarti, D.; Einhaus, R. Silicon feedstock for the multi-crystalline photovoltaic industry. Sol. Energy Mater. Sol. Cells 2002, 72, 27–40. [Google Scholar] [CrossRef]
- Chrzan, D.C. MATERIALS SCIENCE: Metallurgy in the age of silicon. Science 2005, 310, 1623–1624. [Google Scholar] [CrossRef]
- Magdi, S.; El, R.J.; Swillam, M. Litho-free fabrication of crystalline silicon nanowires using amorphous silicon substrate for wide-angle energy absorption applications. ACS Appl. Nano Mater. 2018, 1, 2990–2996. [Google Scholar] [CrossRef]
- Choi, S.; Ishii, T.; Sato, R. Performance degradation due to outdoor exposure and seasonal variation in amorphous silicon photovoltaic modules. Thin Solid Films 2018, 661, 116–121. [Google Scholar] [CrossRef]
- Patel, H.; Agarwal, V. Matlab-based modeling to study the effects of partial shading on PV array characteristics. IEEE Trans. Energy Convers. 2008, 23, 302–310. [Google Scholar] [CrossRef]
- Liu, X.; Qi, X.; Zheng, S. Model and analysis of photovoltaic array under partial shading. Power Syst. Technol. 2010, 324, 192–197. [Google Scholar]
- Zhao, H.; Li, H.P.; Wang, H.J. Model and analytical investigation of PV module under partial shading. Chin. J. Power Source 2015, 71–74. Available online: http://en.cnki.com.cn/Article_en/CJFDTotal-DYJS201501030.htm (accessed on 15 December 2020).


| Types | Materials | Characteristic Parameters | |||
|---|---|---|---|---|---|
| Pmax (W) | Vmp (V) | ISC (A) | Imp (A) | ||
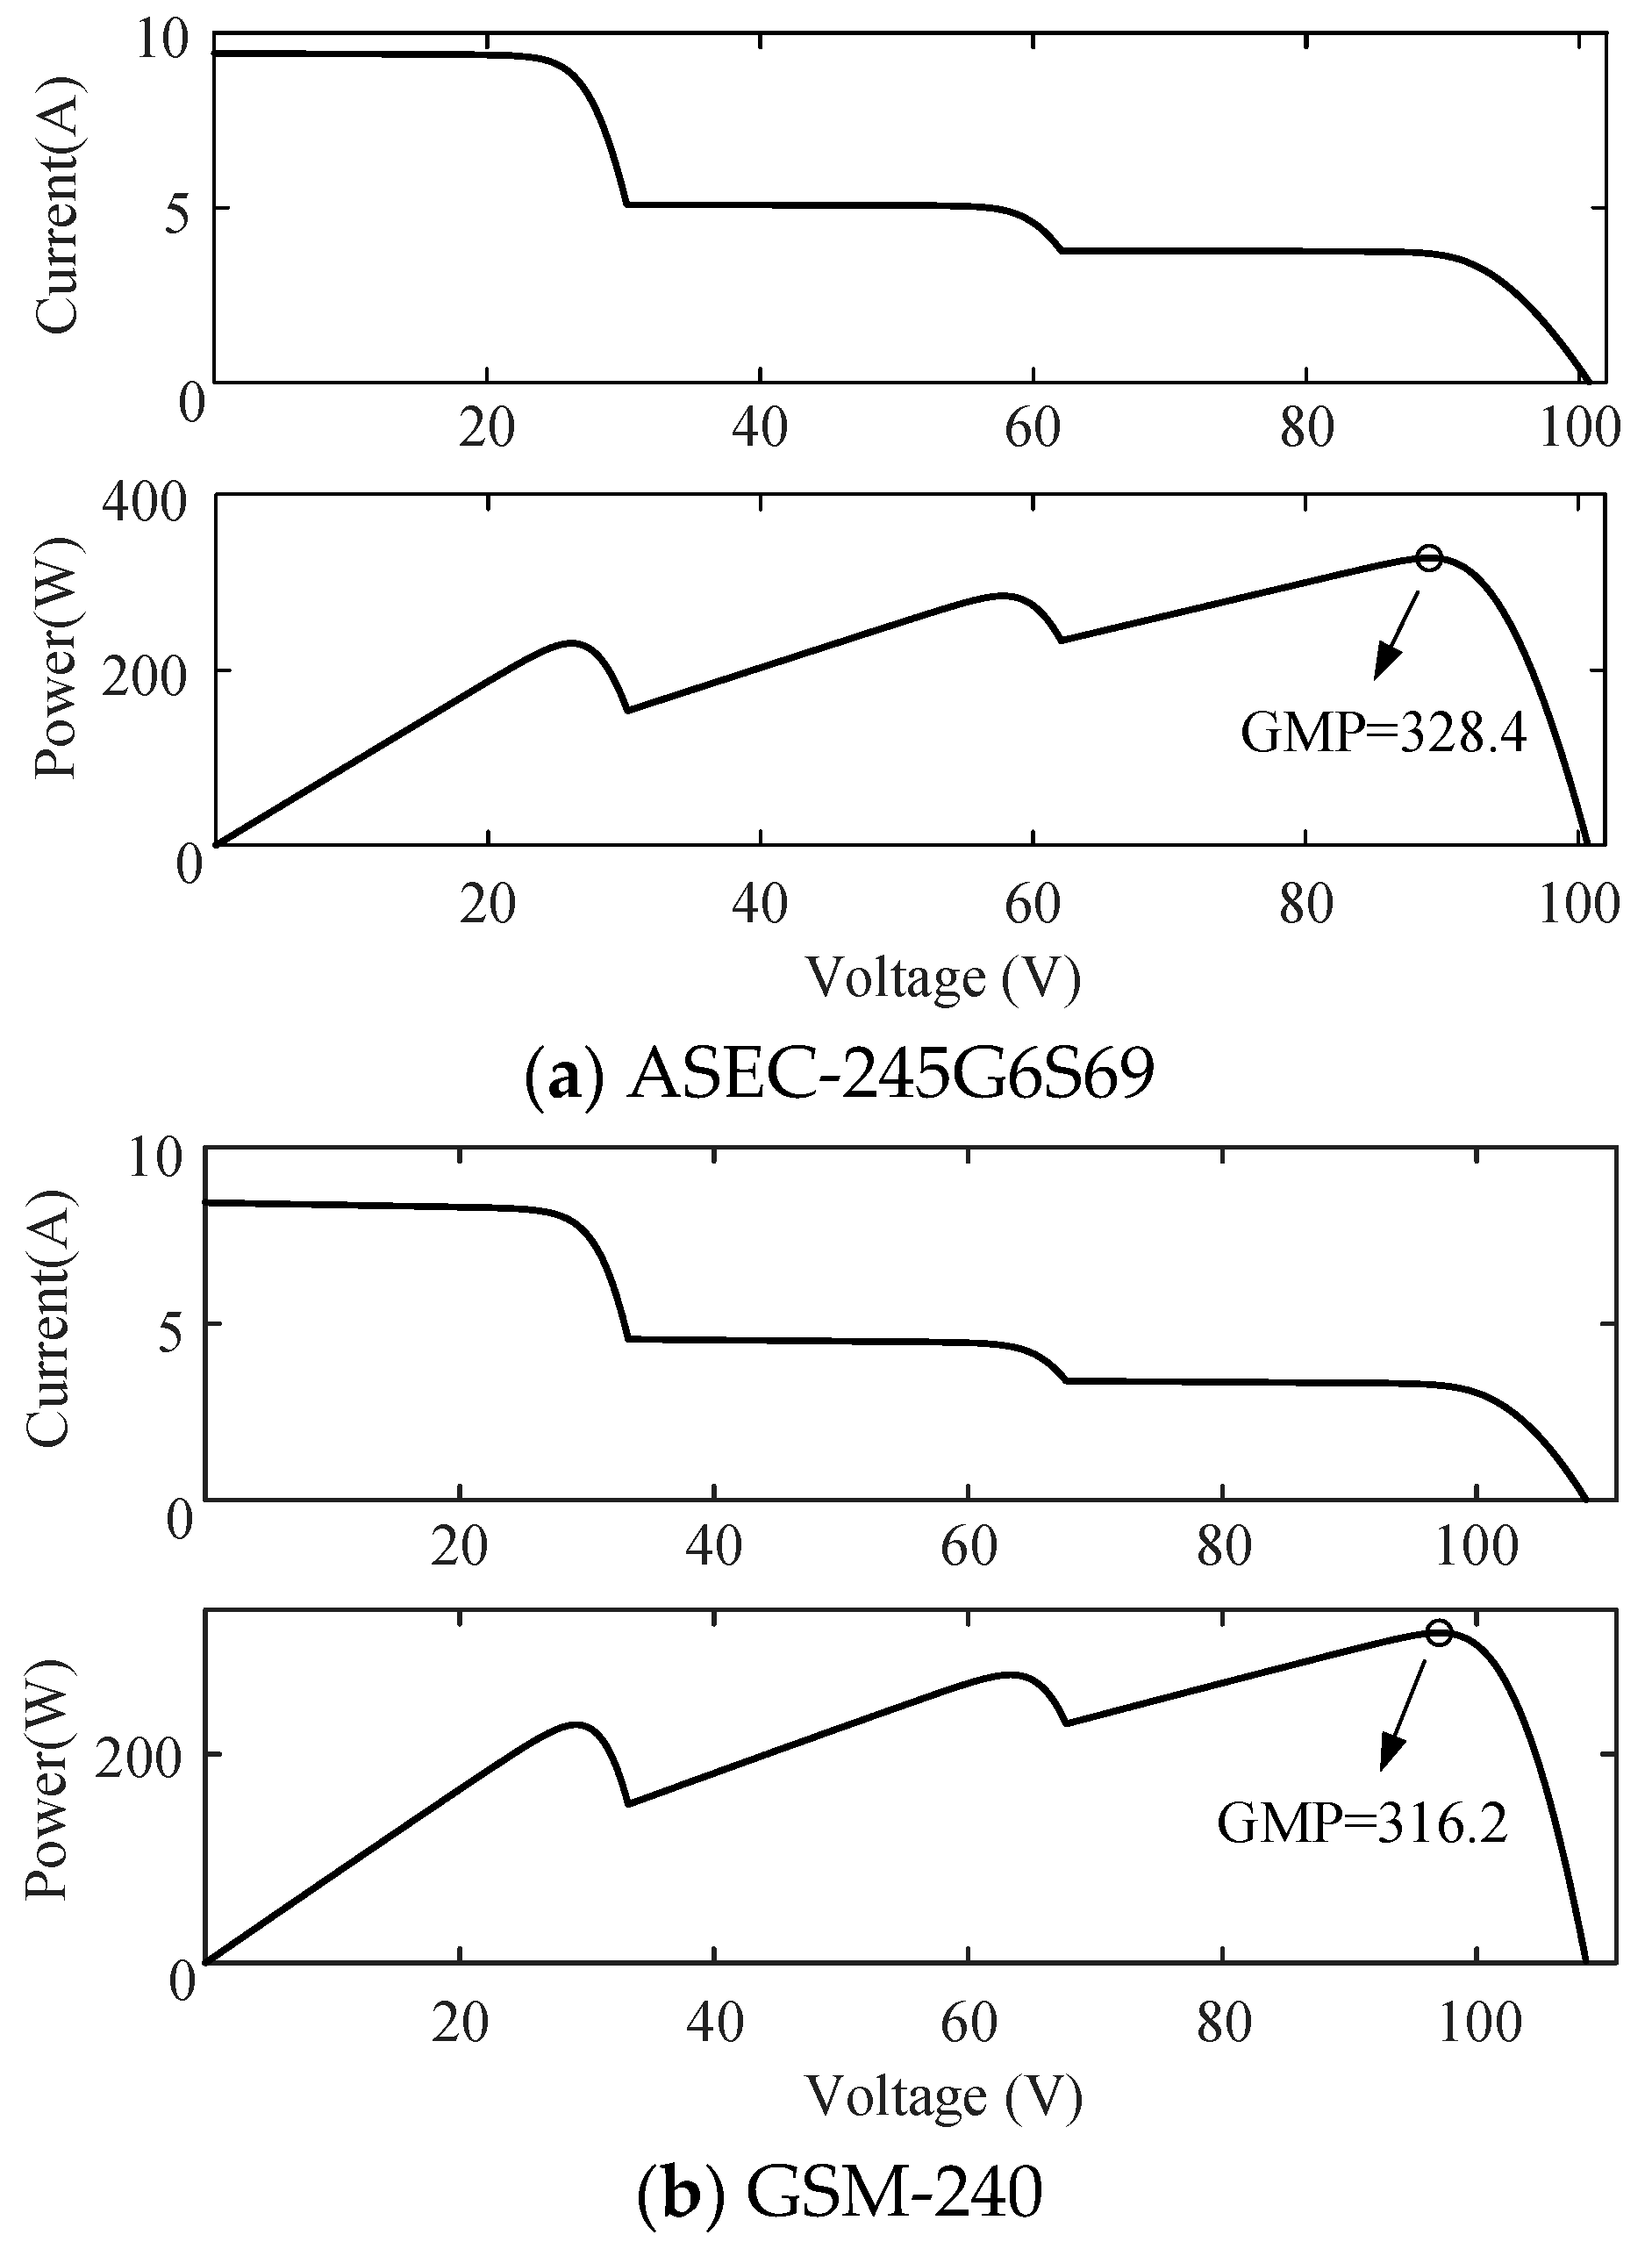
| GSM-240 | monocrystalline | 239.12 | 30.50 | 8.44 | 7.84 |
| ASEC-245G6S69 | monocrystalline | 245.04 | 27.44 | 9.28 | 8.93 |
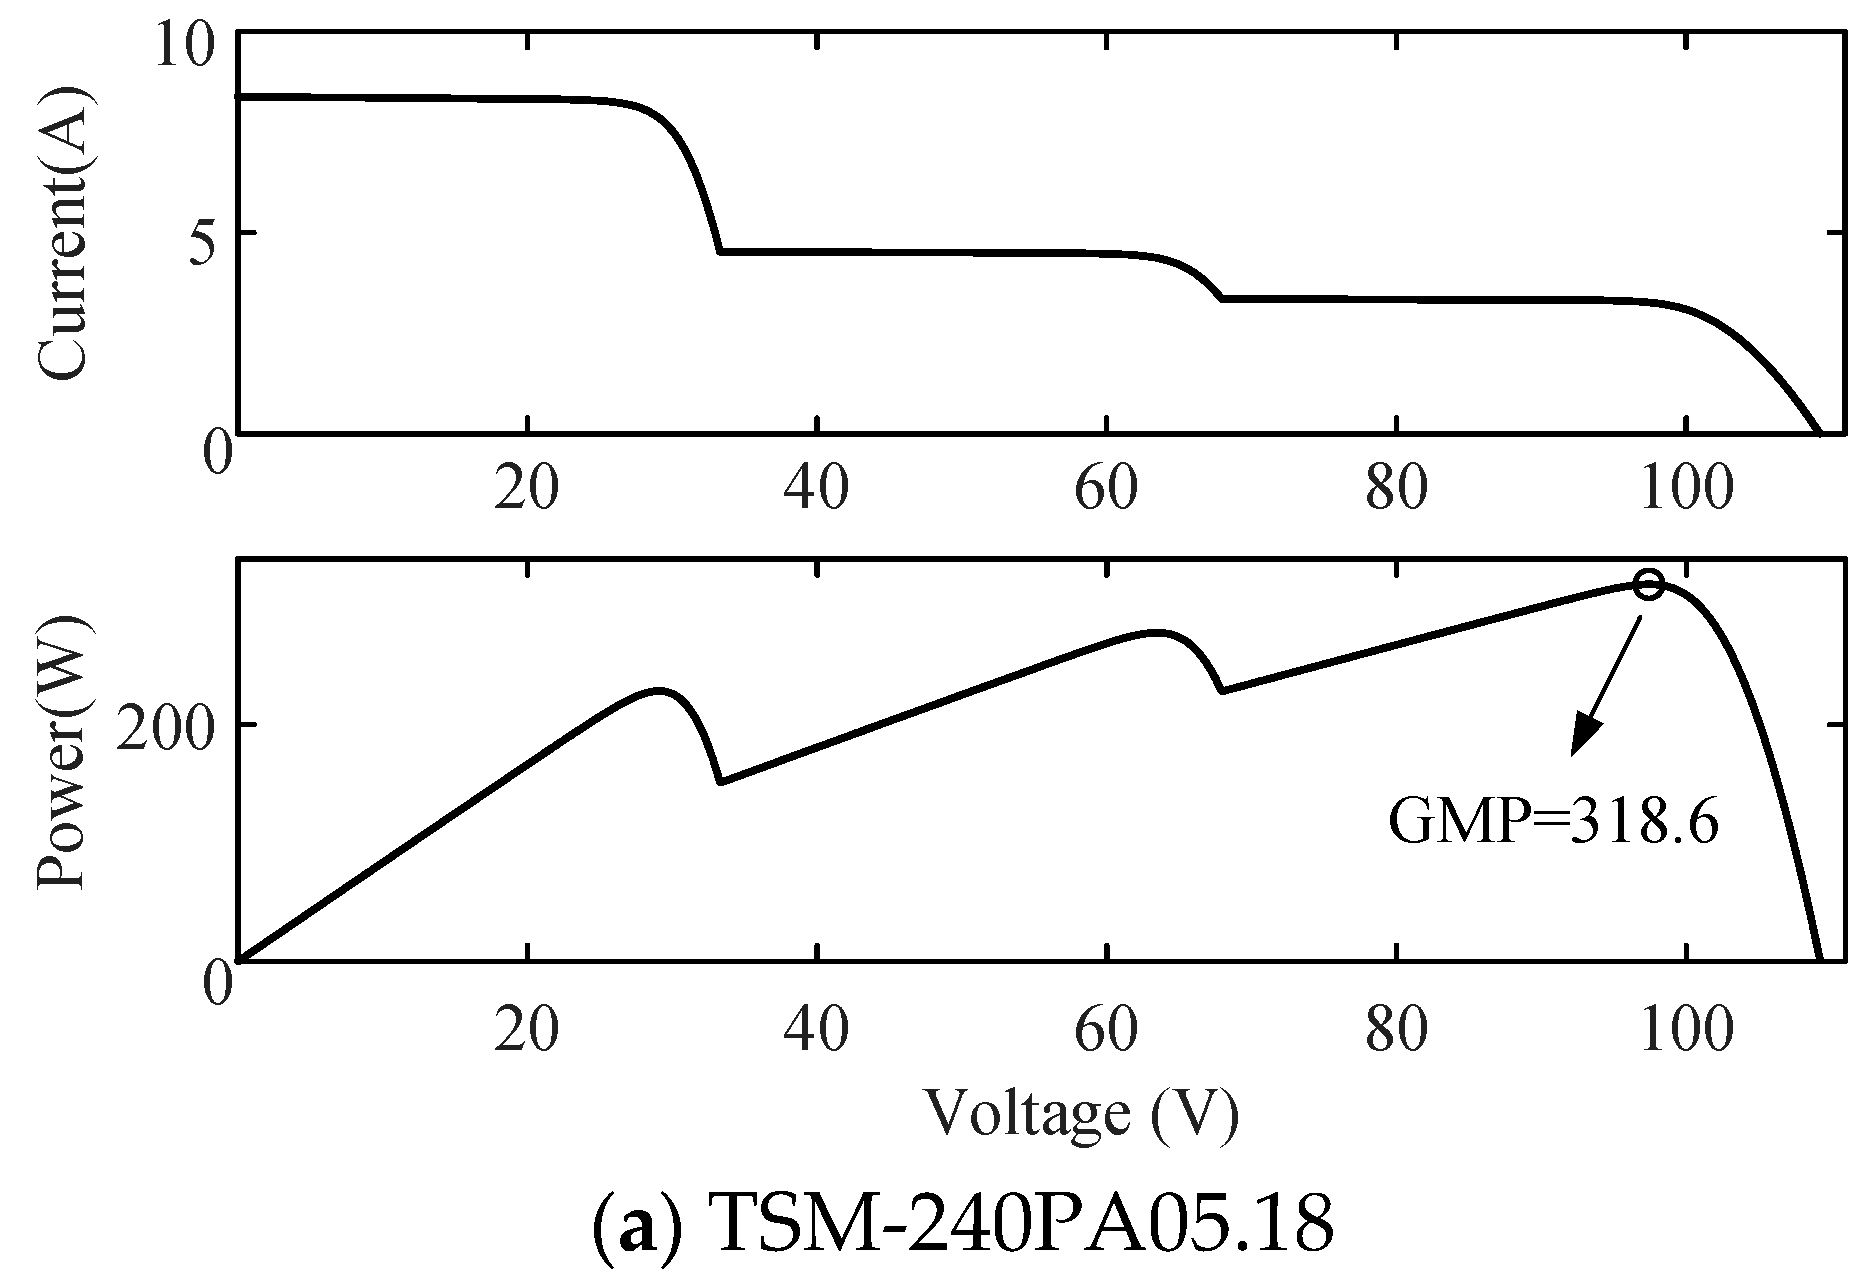
| TSM-240PA05.18 | polycrystalline | 239.86 | 30.40 | 8.37 | 7.89 |
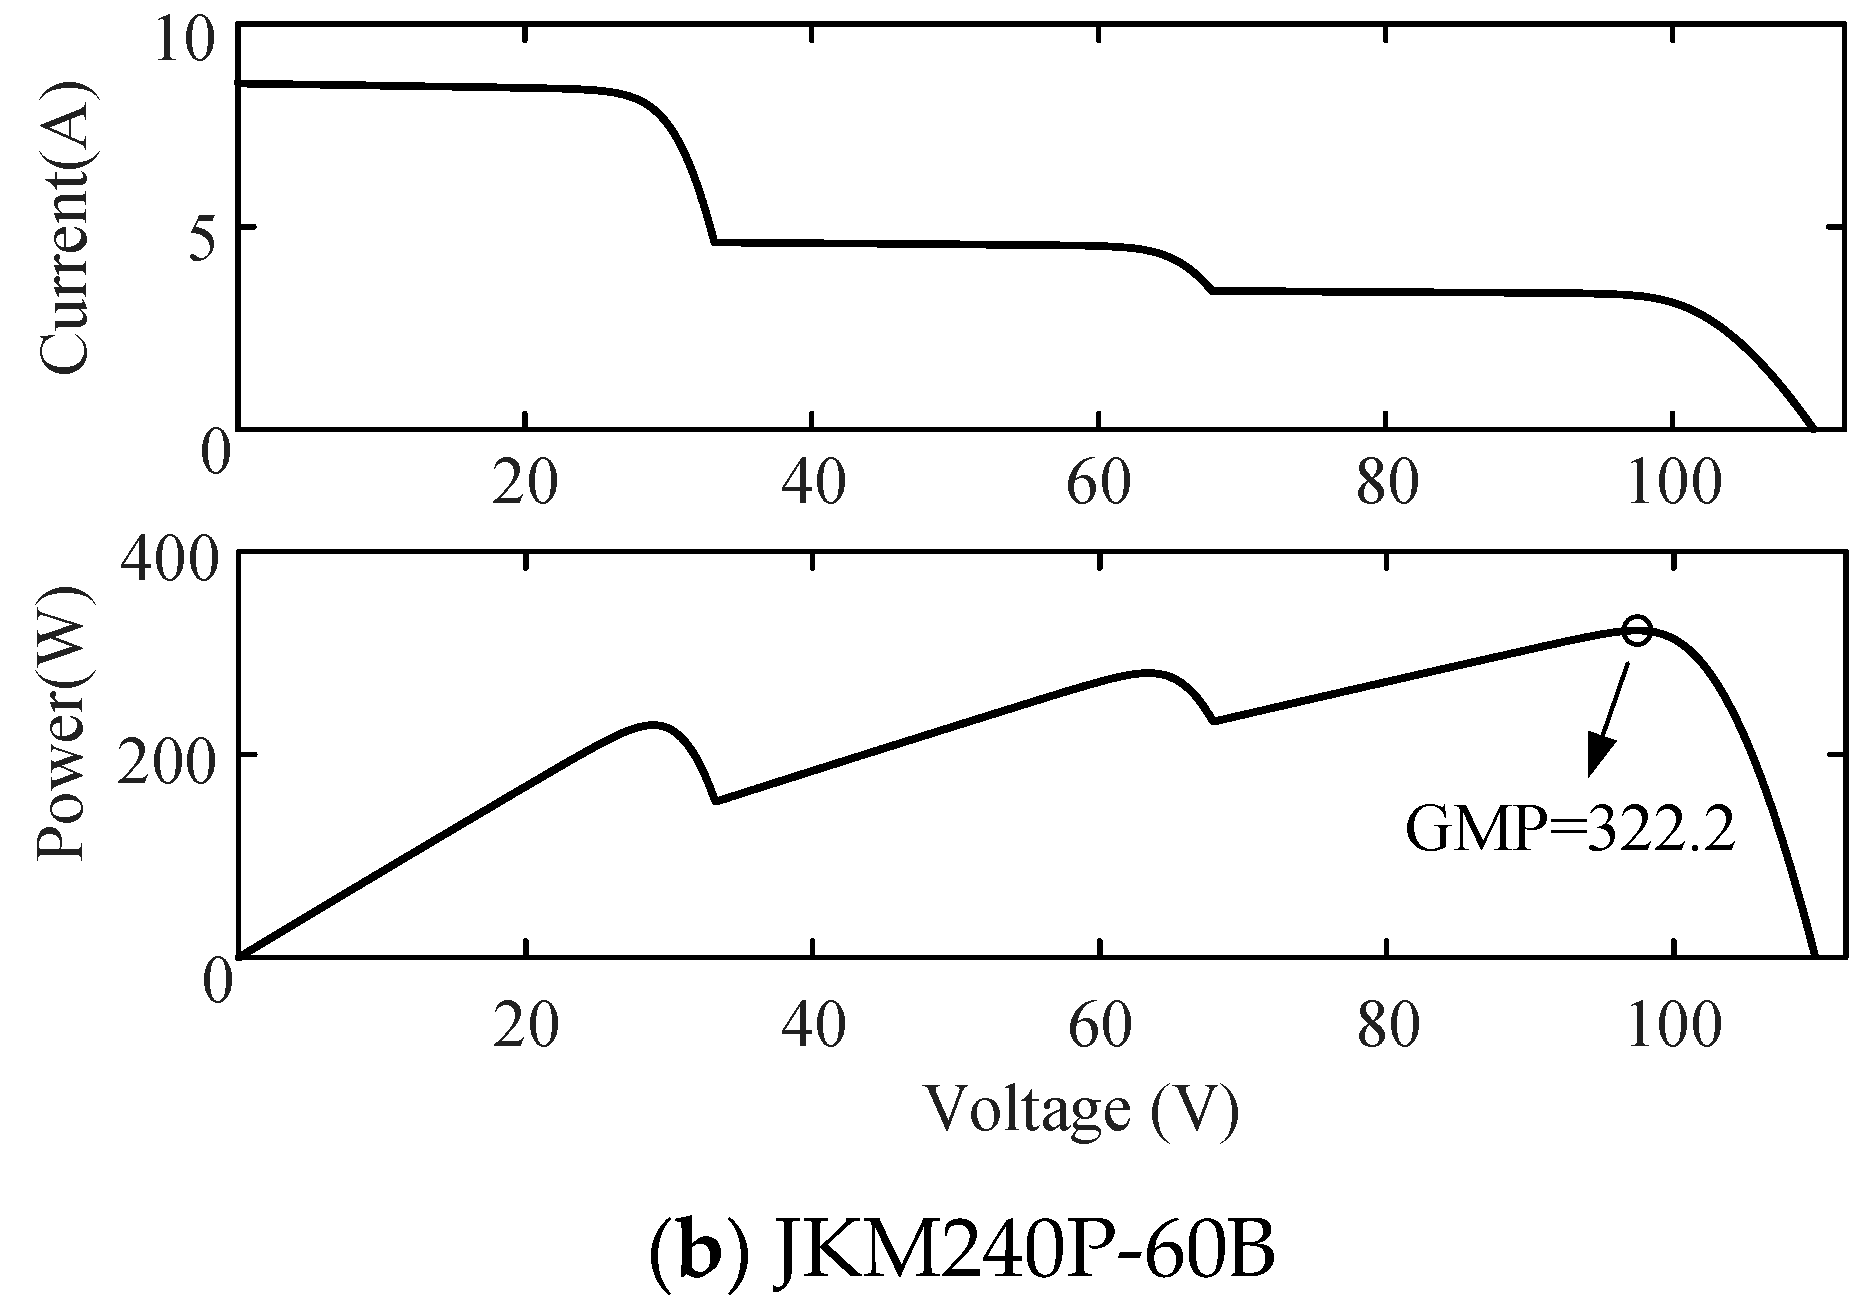
| JKM240P-60B | polycrystalline | 240.09 | 30.20 | 8.54 | 7.95 |
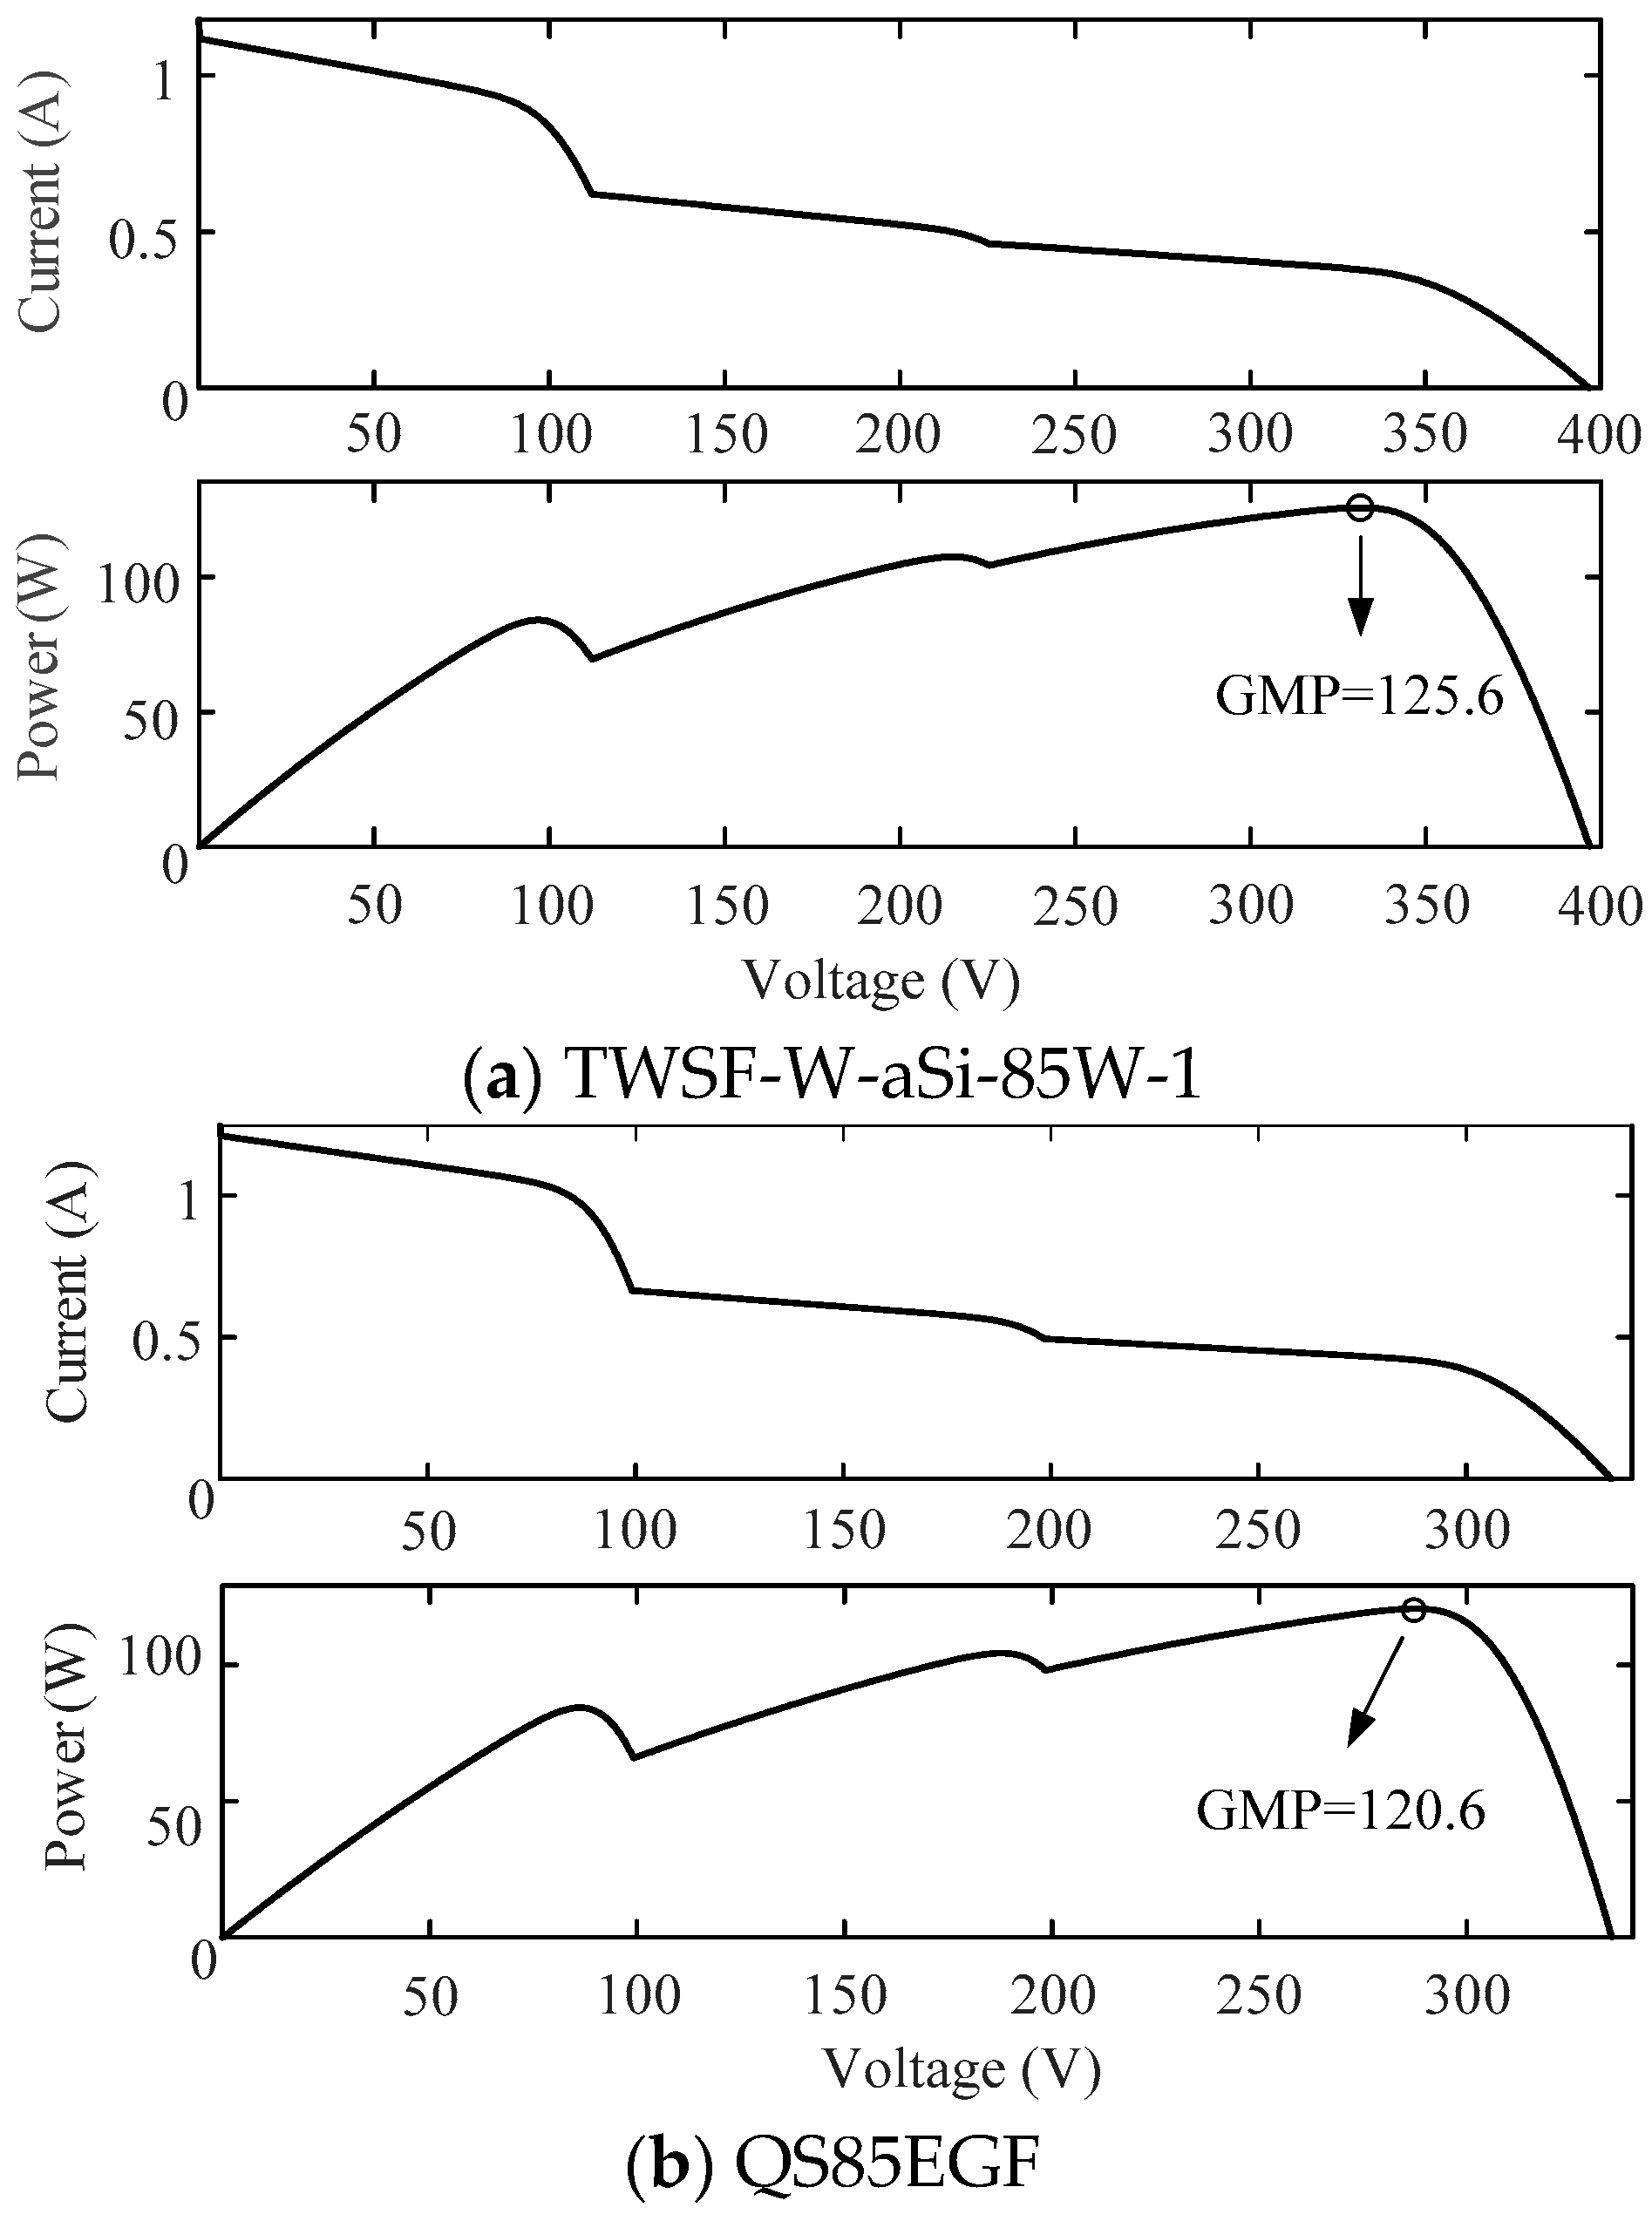
| TWSF-W-aSi-85W-1 | amorphous | 85.26 | 98.00 | 1.12 | 0.87 |
| QS85EGF | amorphous | 85.75 | 87.50 | 1.19 | 0.98 |
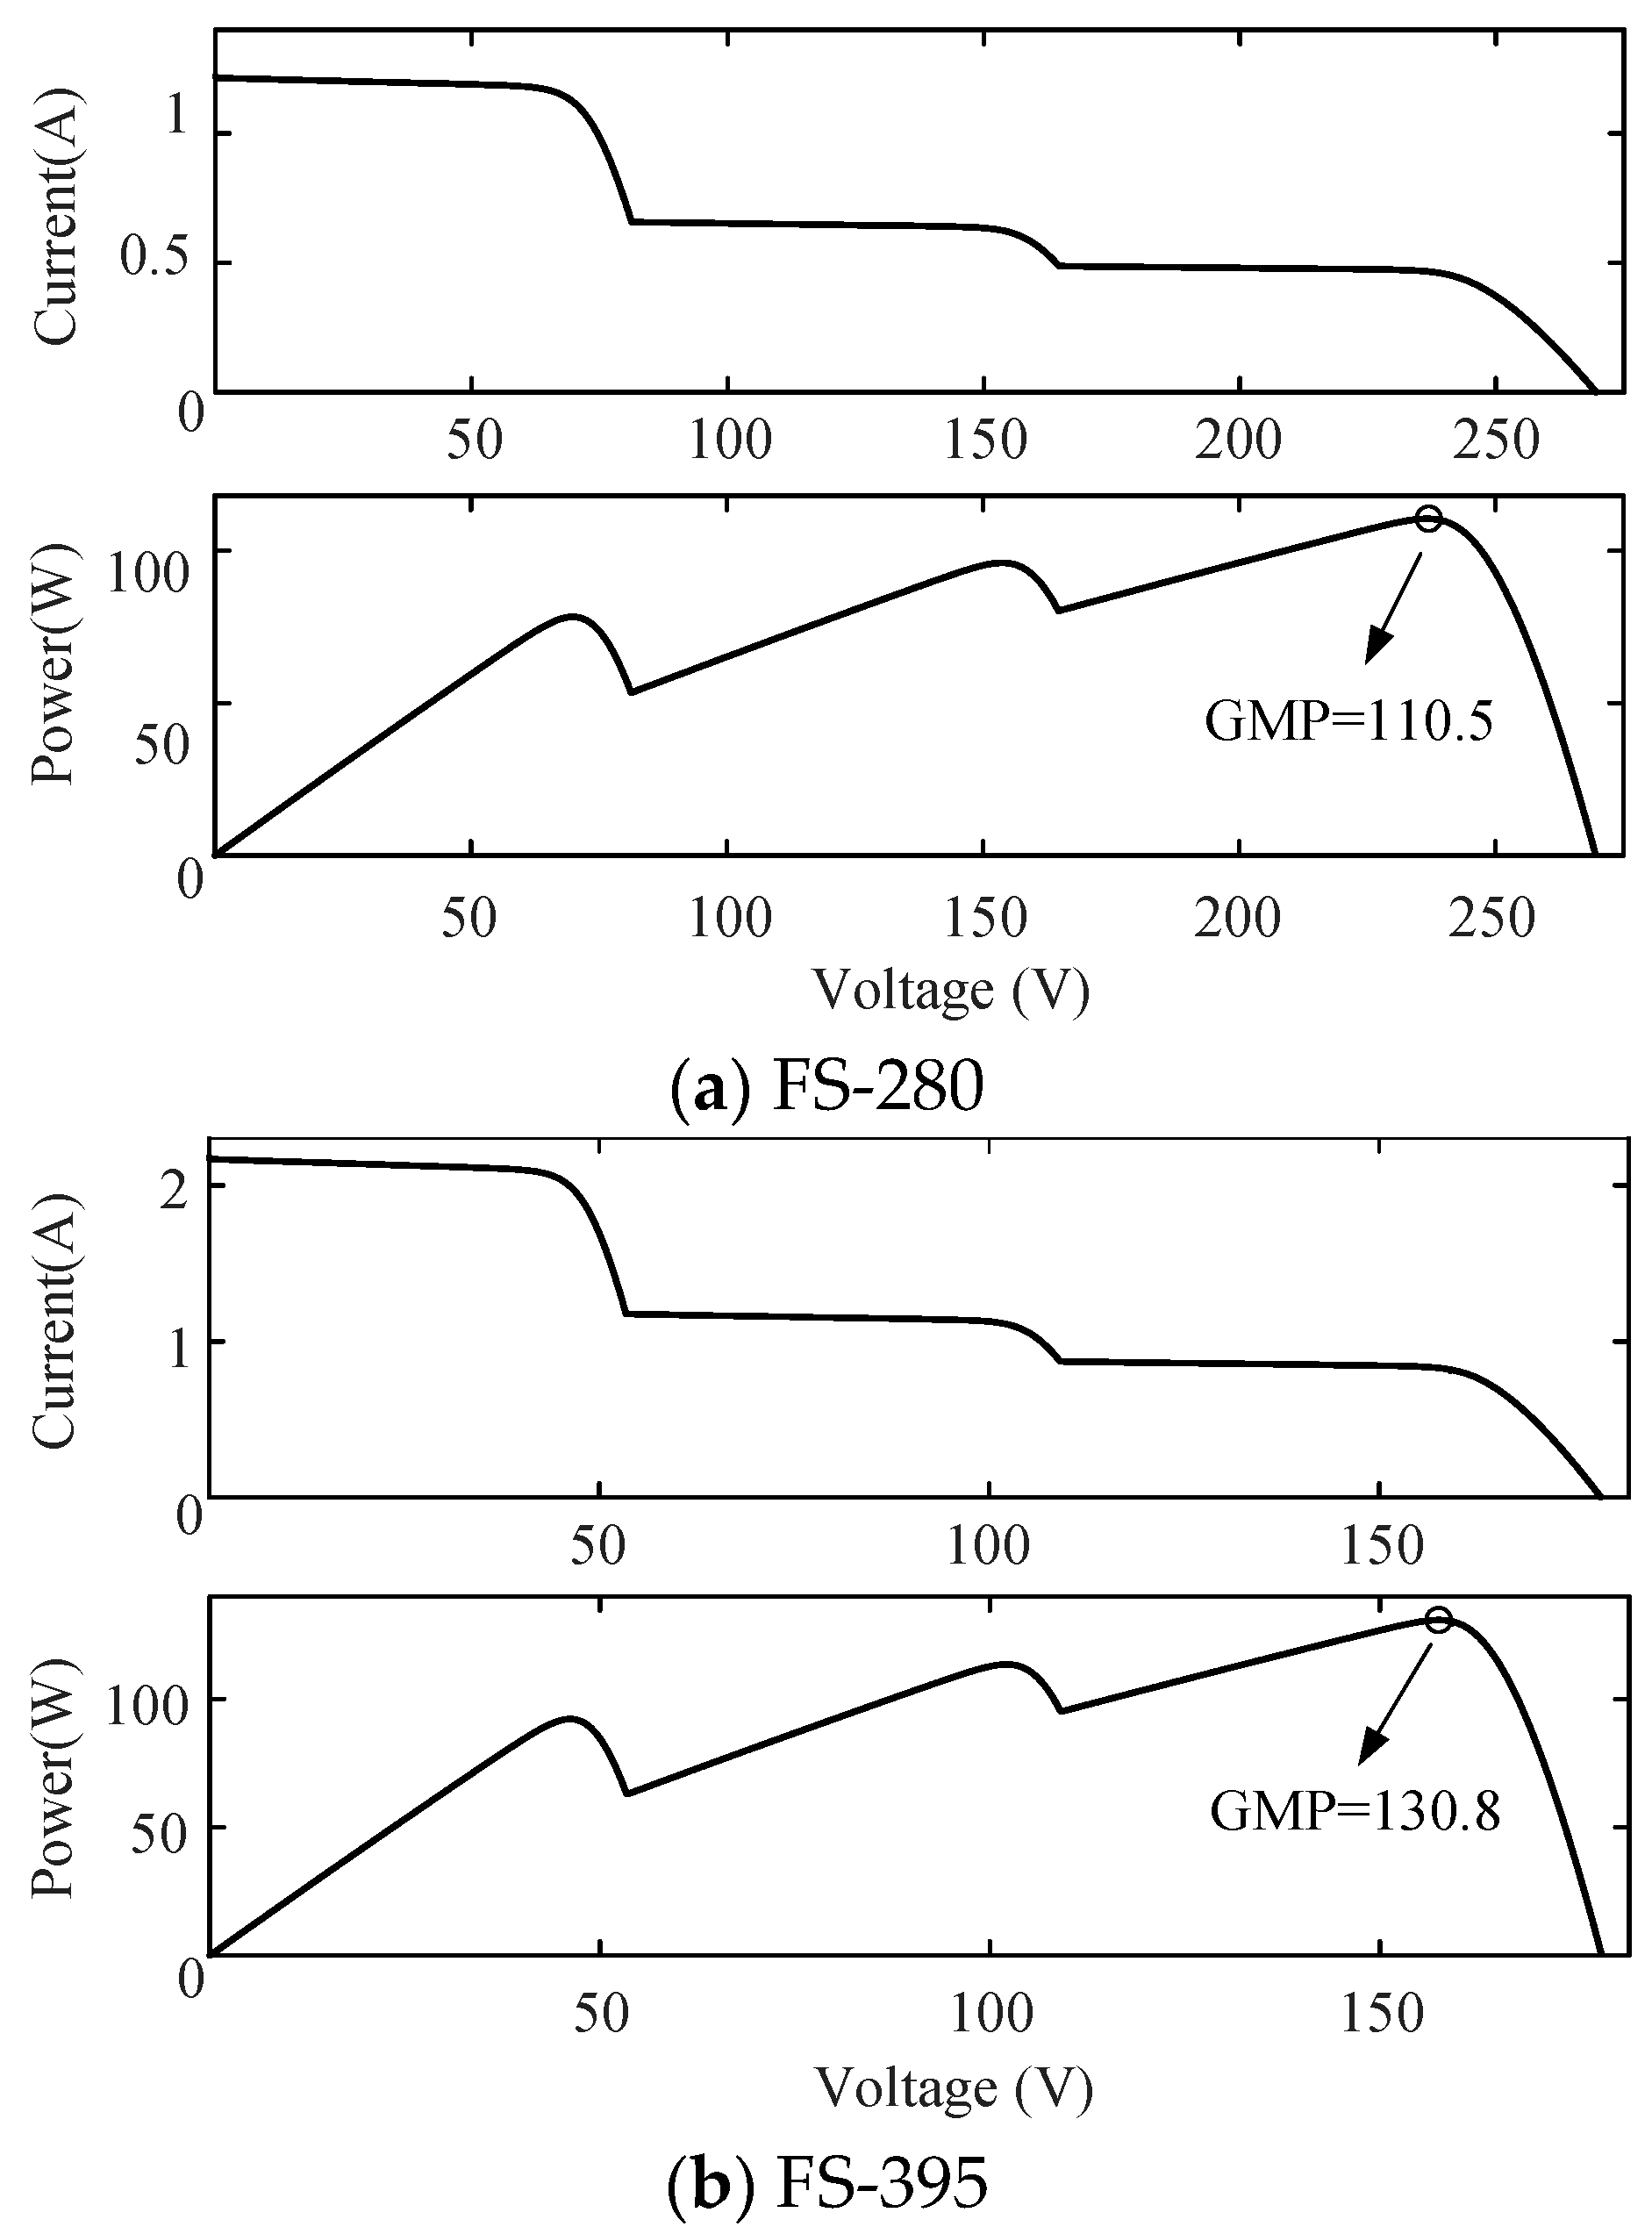
| FS-280 | cadmium telluride | 79.74 | 71.20 | 1.22 | 1.12 |
| FS-395 | cadmium telluride | 95.00 | 47.50 | 2.17 | 2.00 |
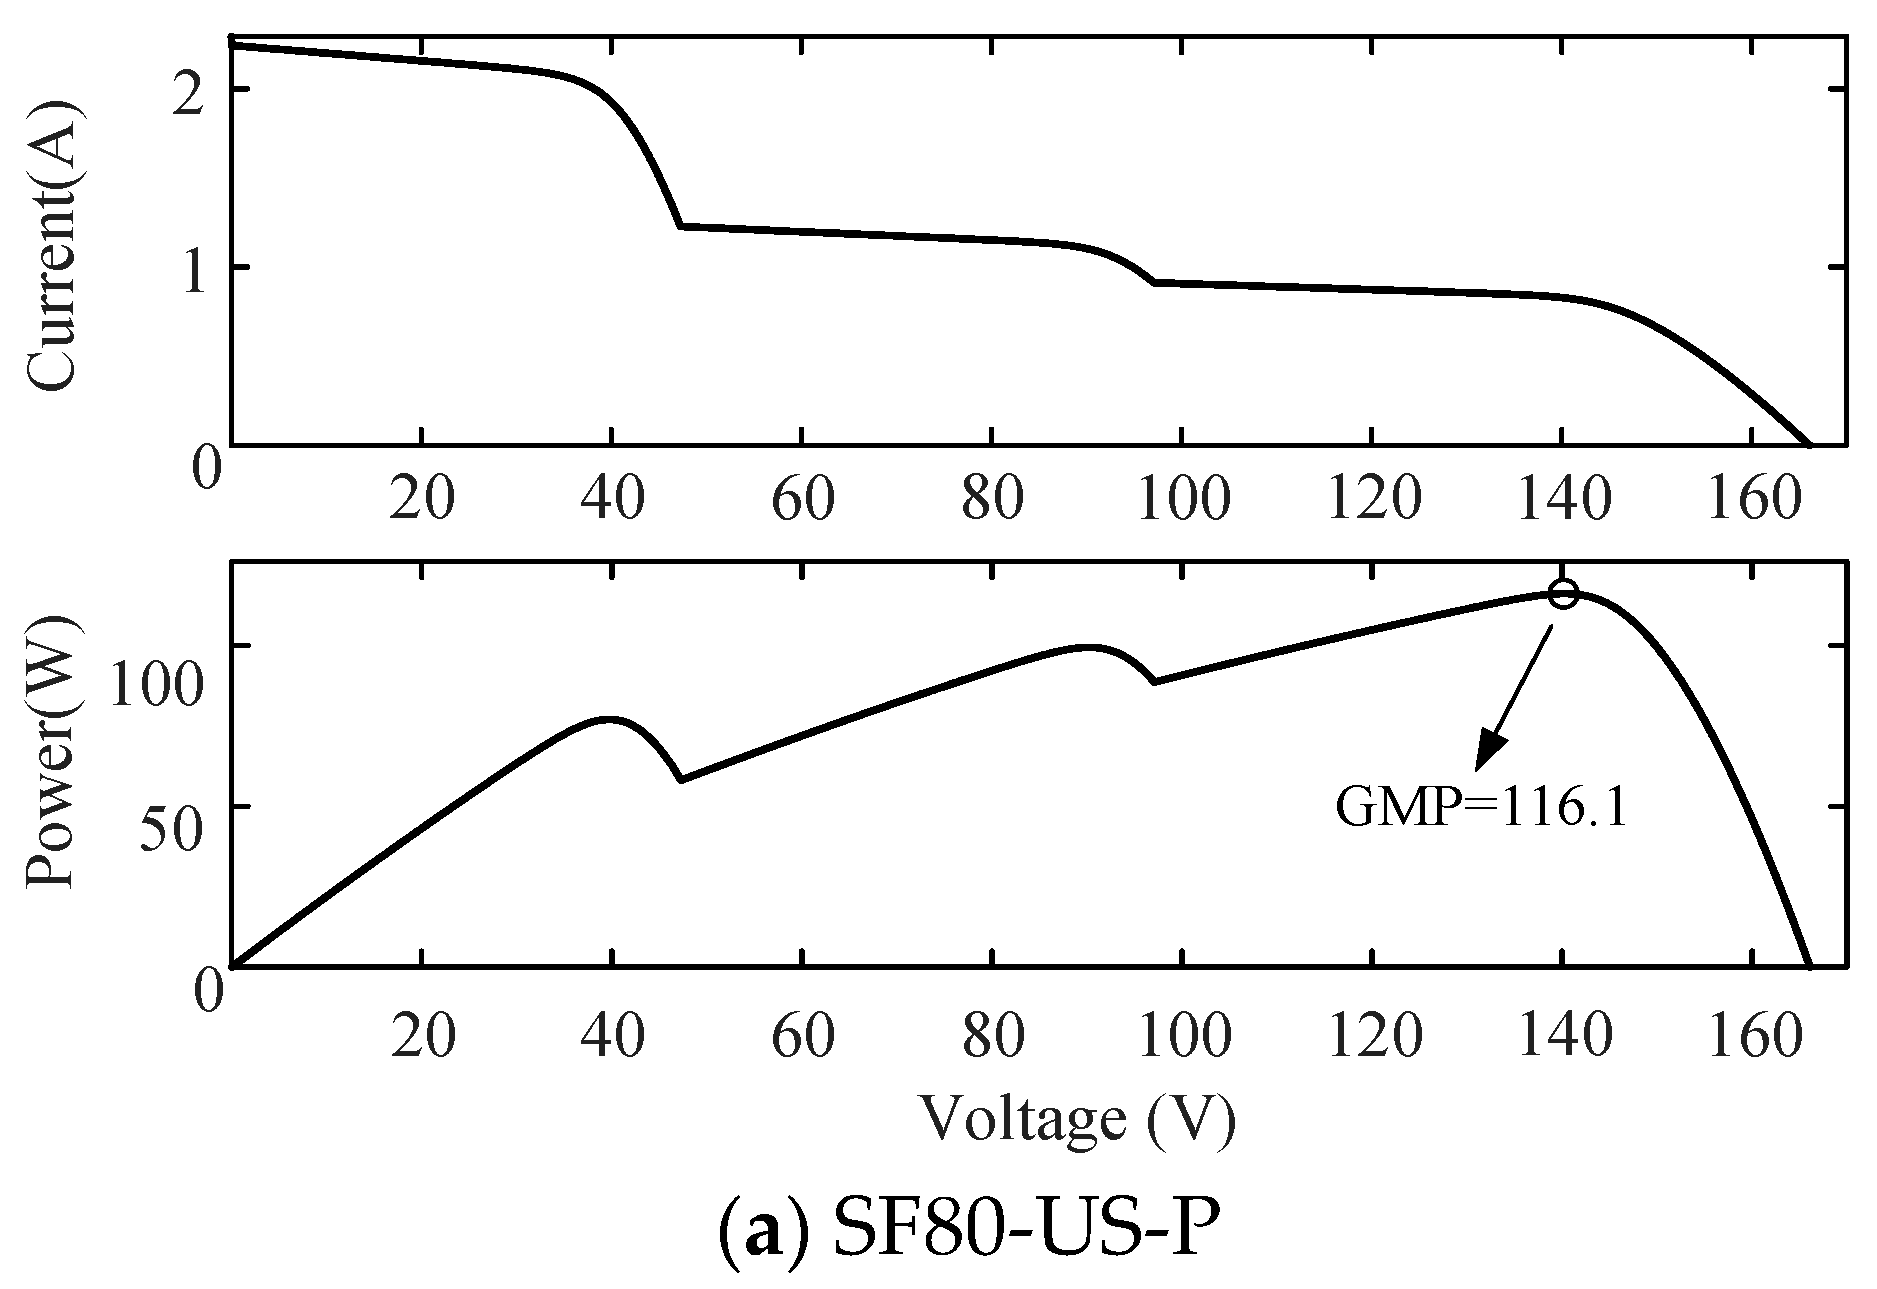
| SF80-US-P | copper indium selenium | 79.95 | 41.00 | 2.26 | 1.95 |
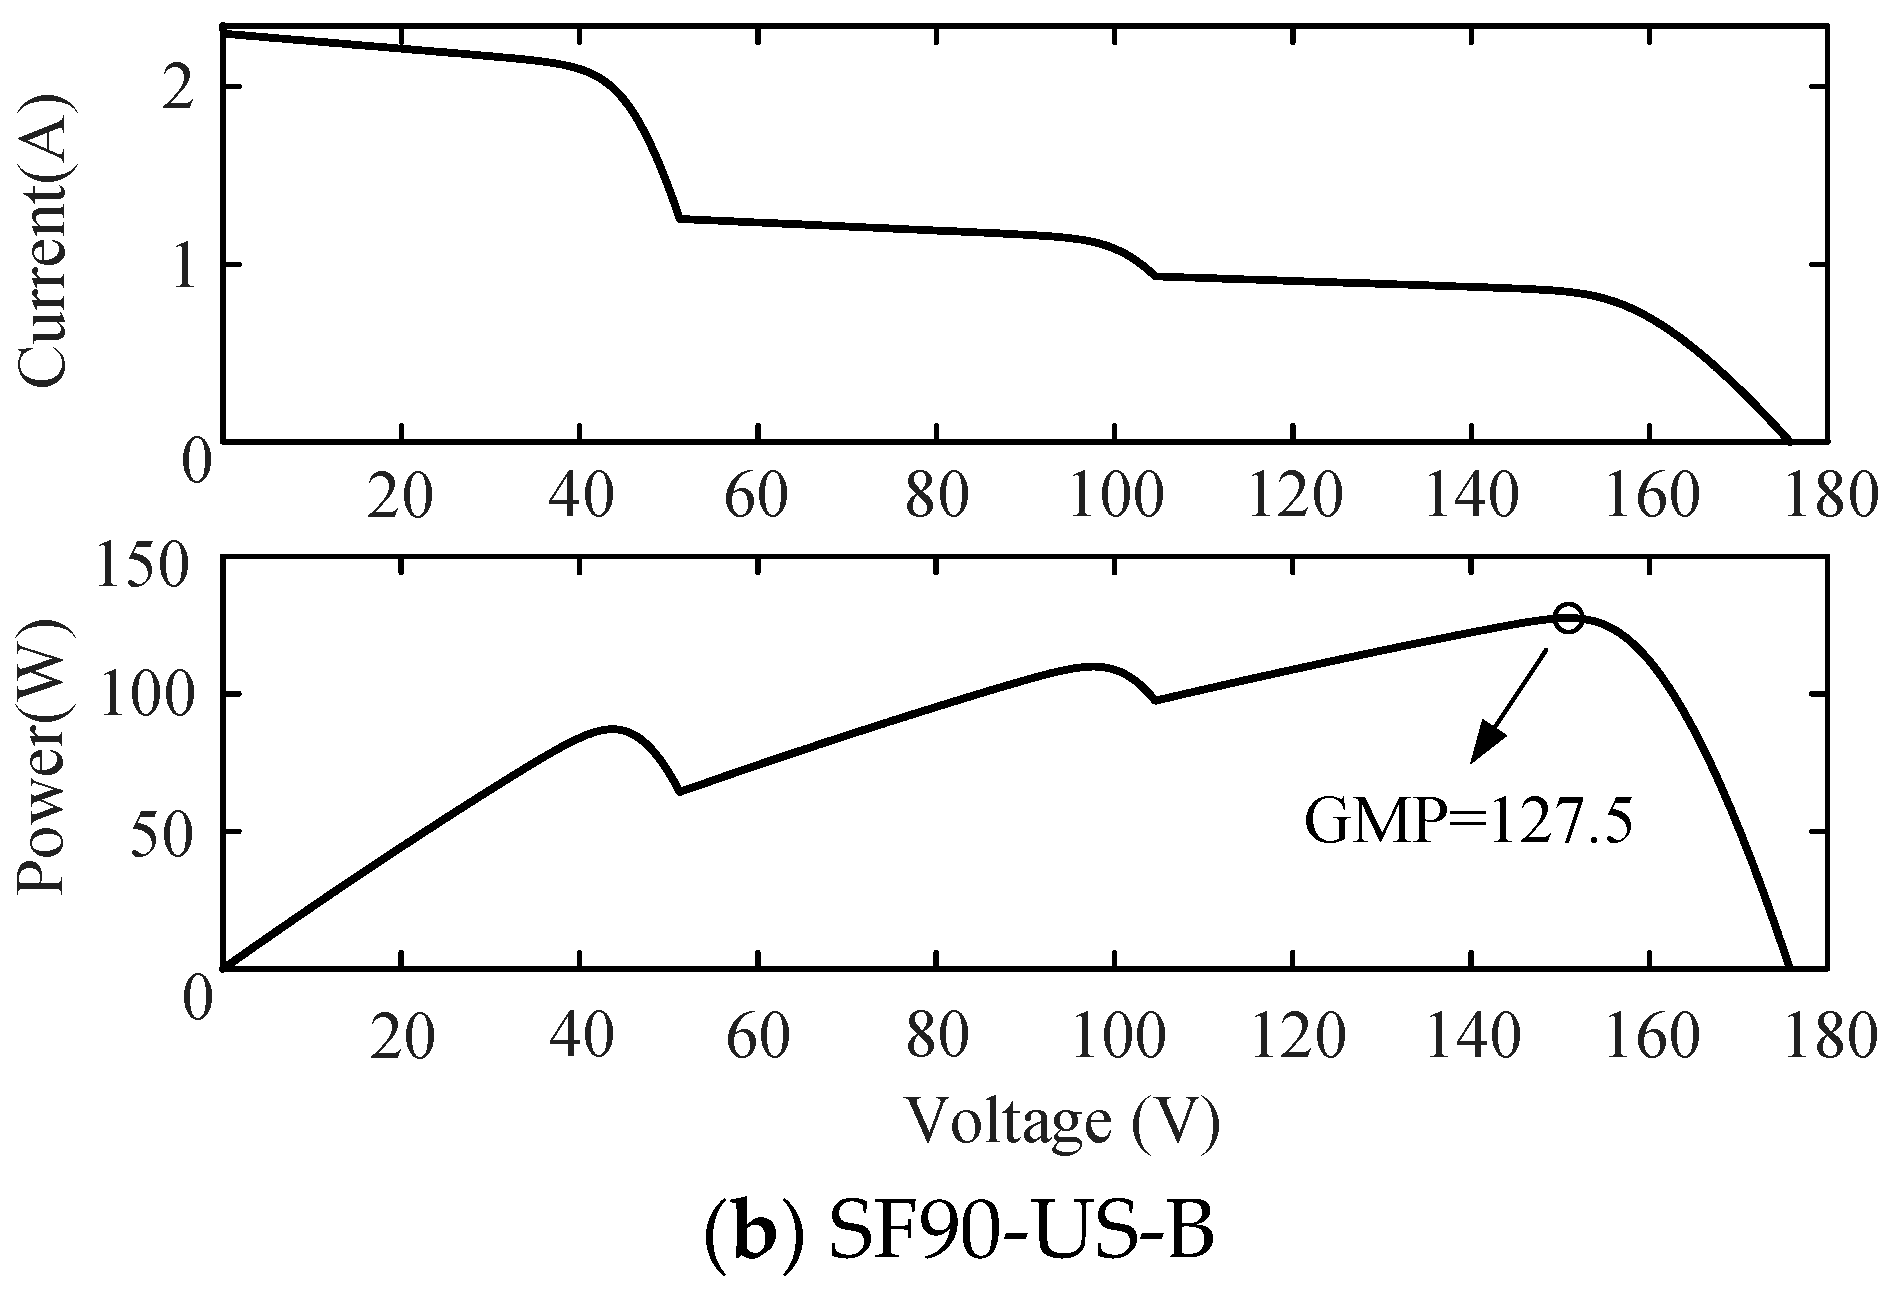
| SF90-US-B | copper indium selenium | 90.00 | 45.00 | 2.30 | 2.00 |
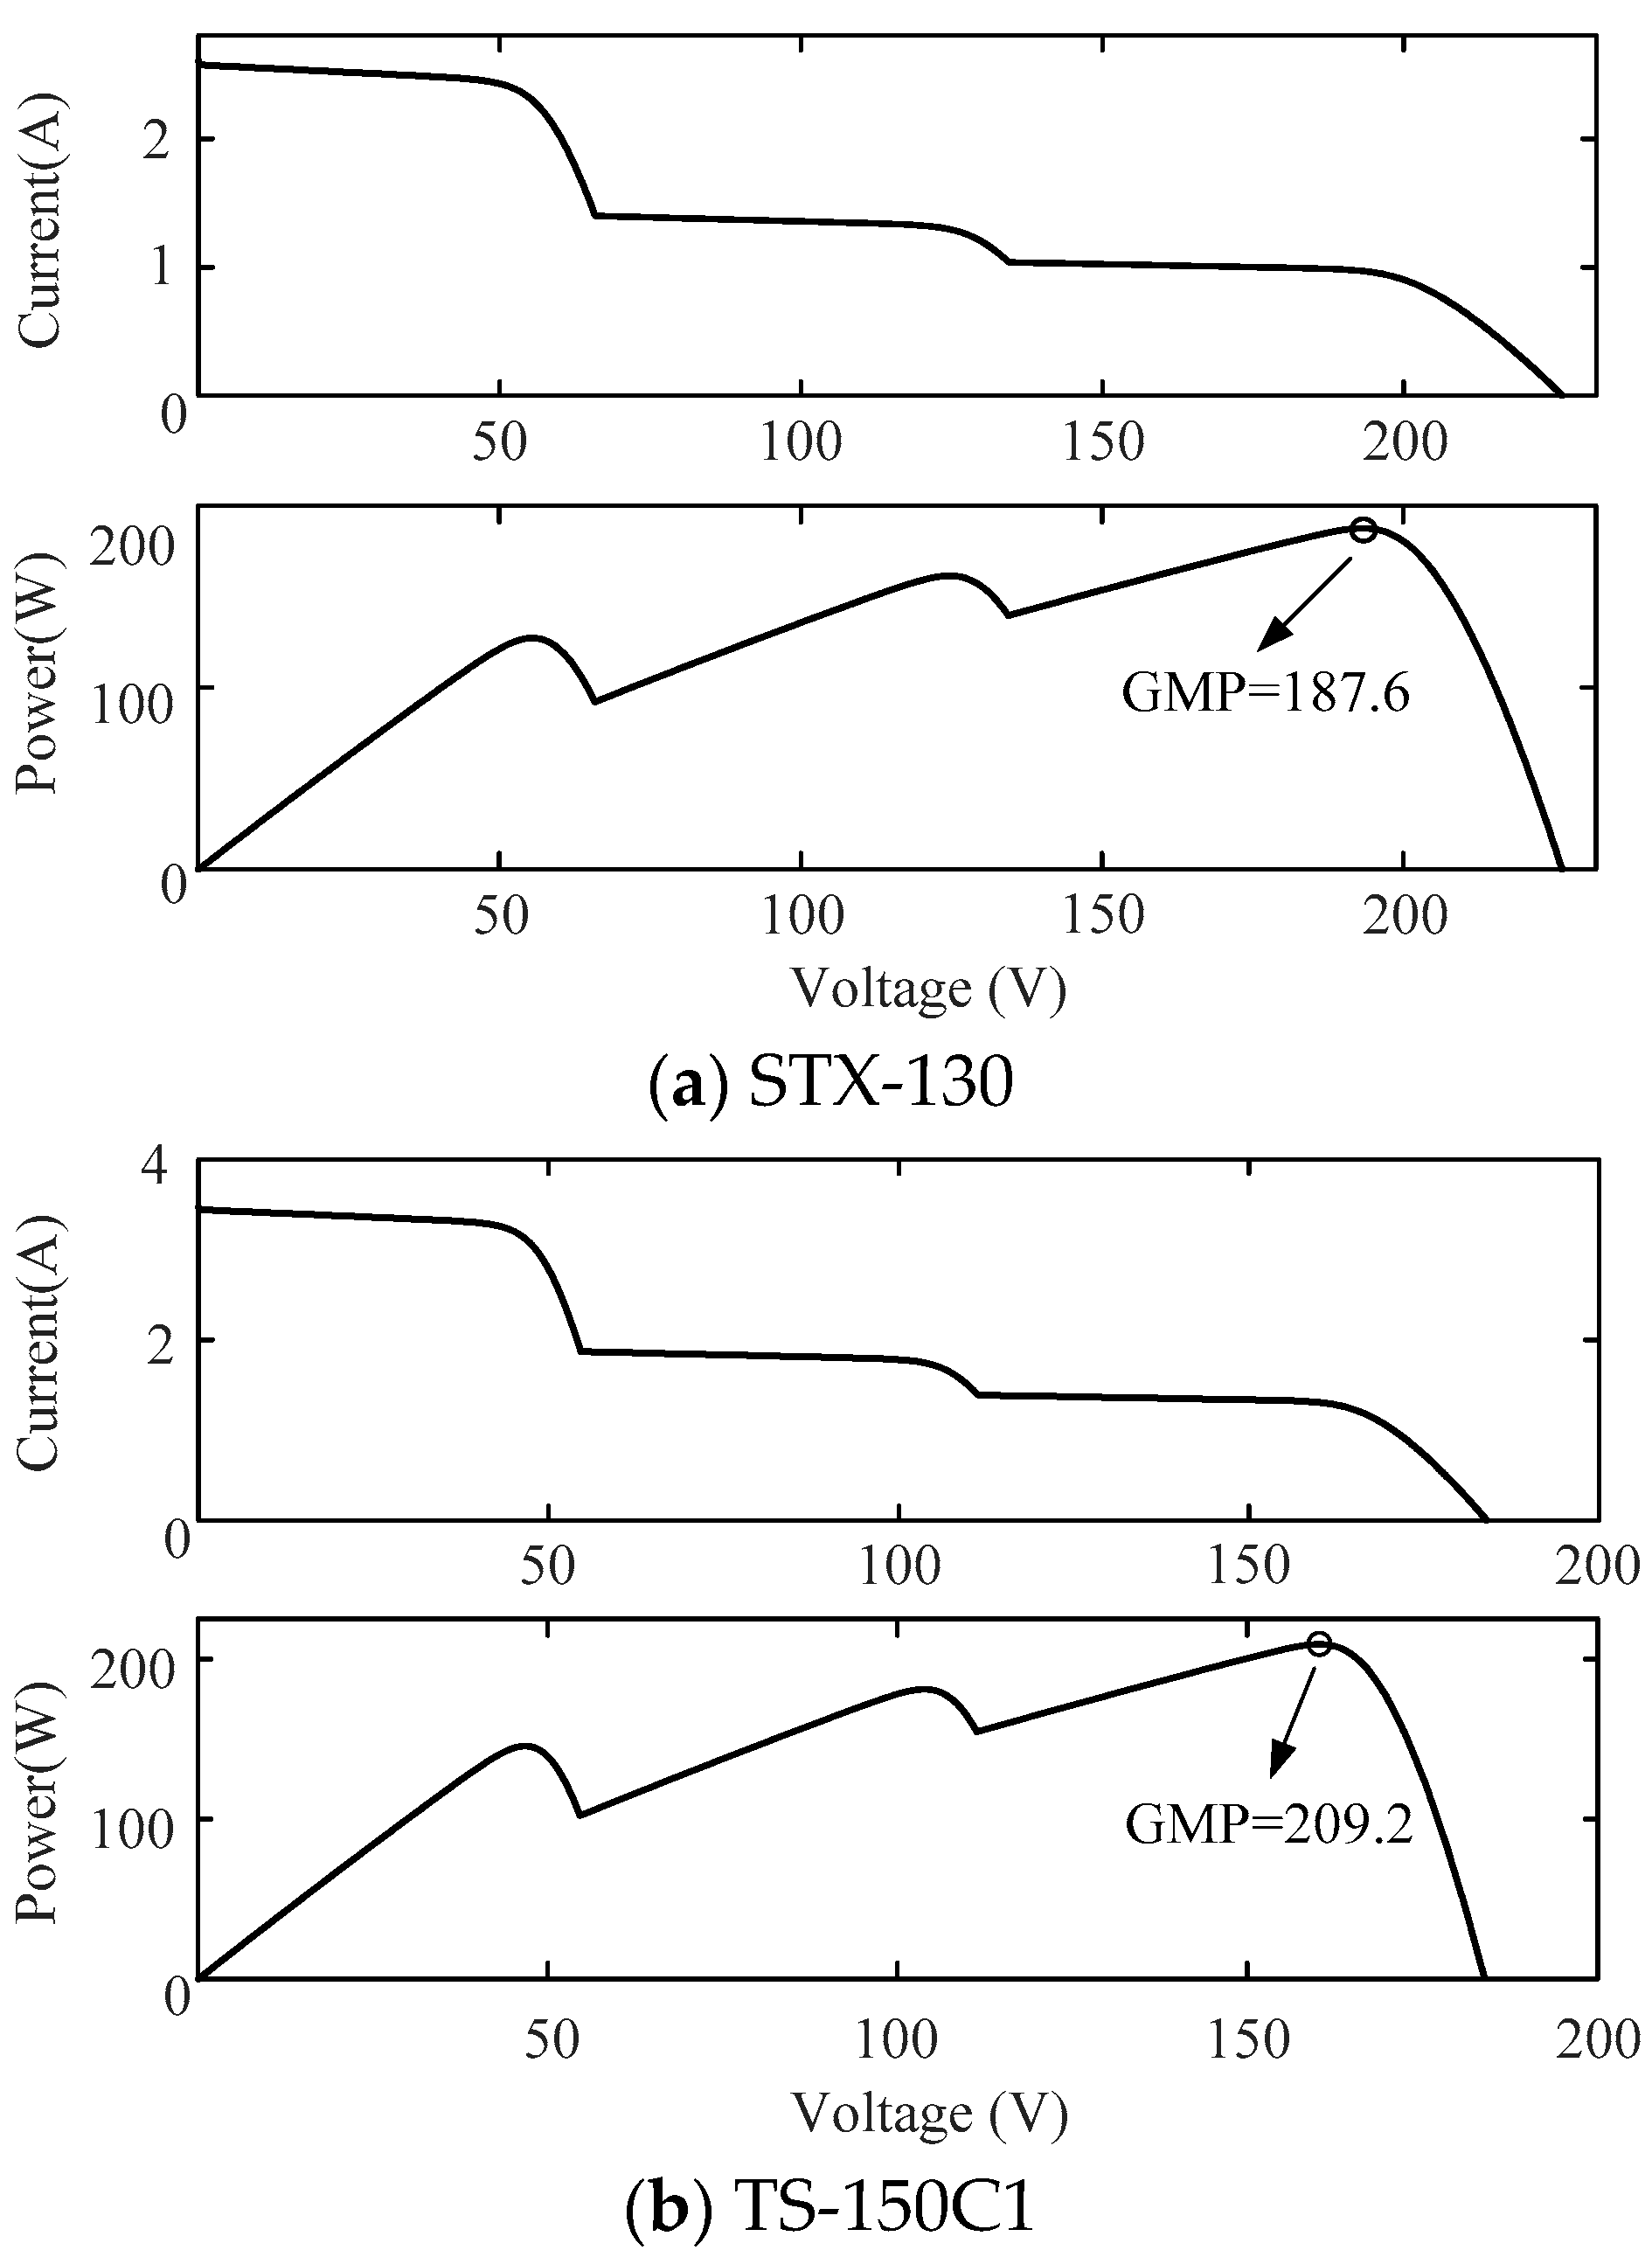
| STX-130 | copper indium gallium selenium | 130.00 | 56.80 | 2.60 | 2.29 |
| TS-150C1 | copper indium gallium selenium | 150.07 | 48.10 | 3.45 | 3.12 |
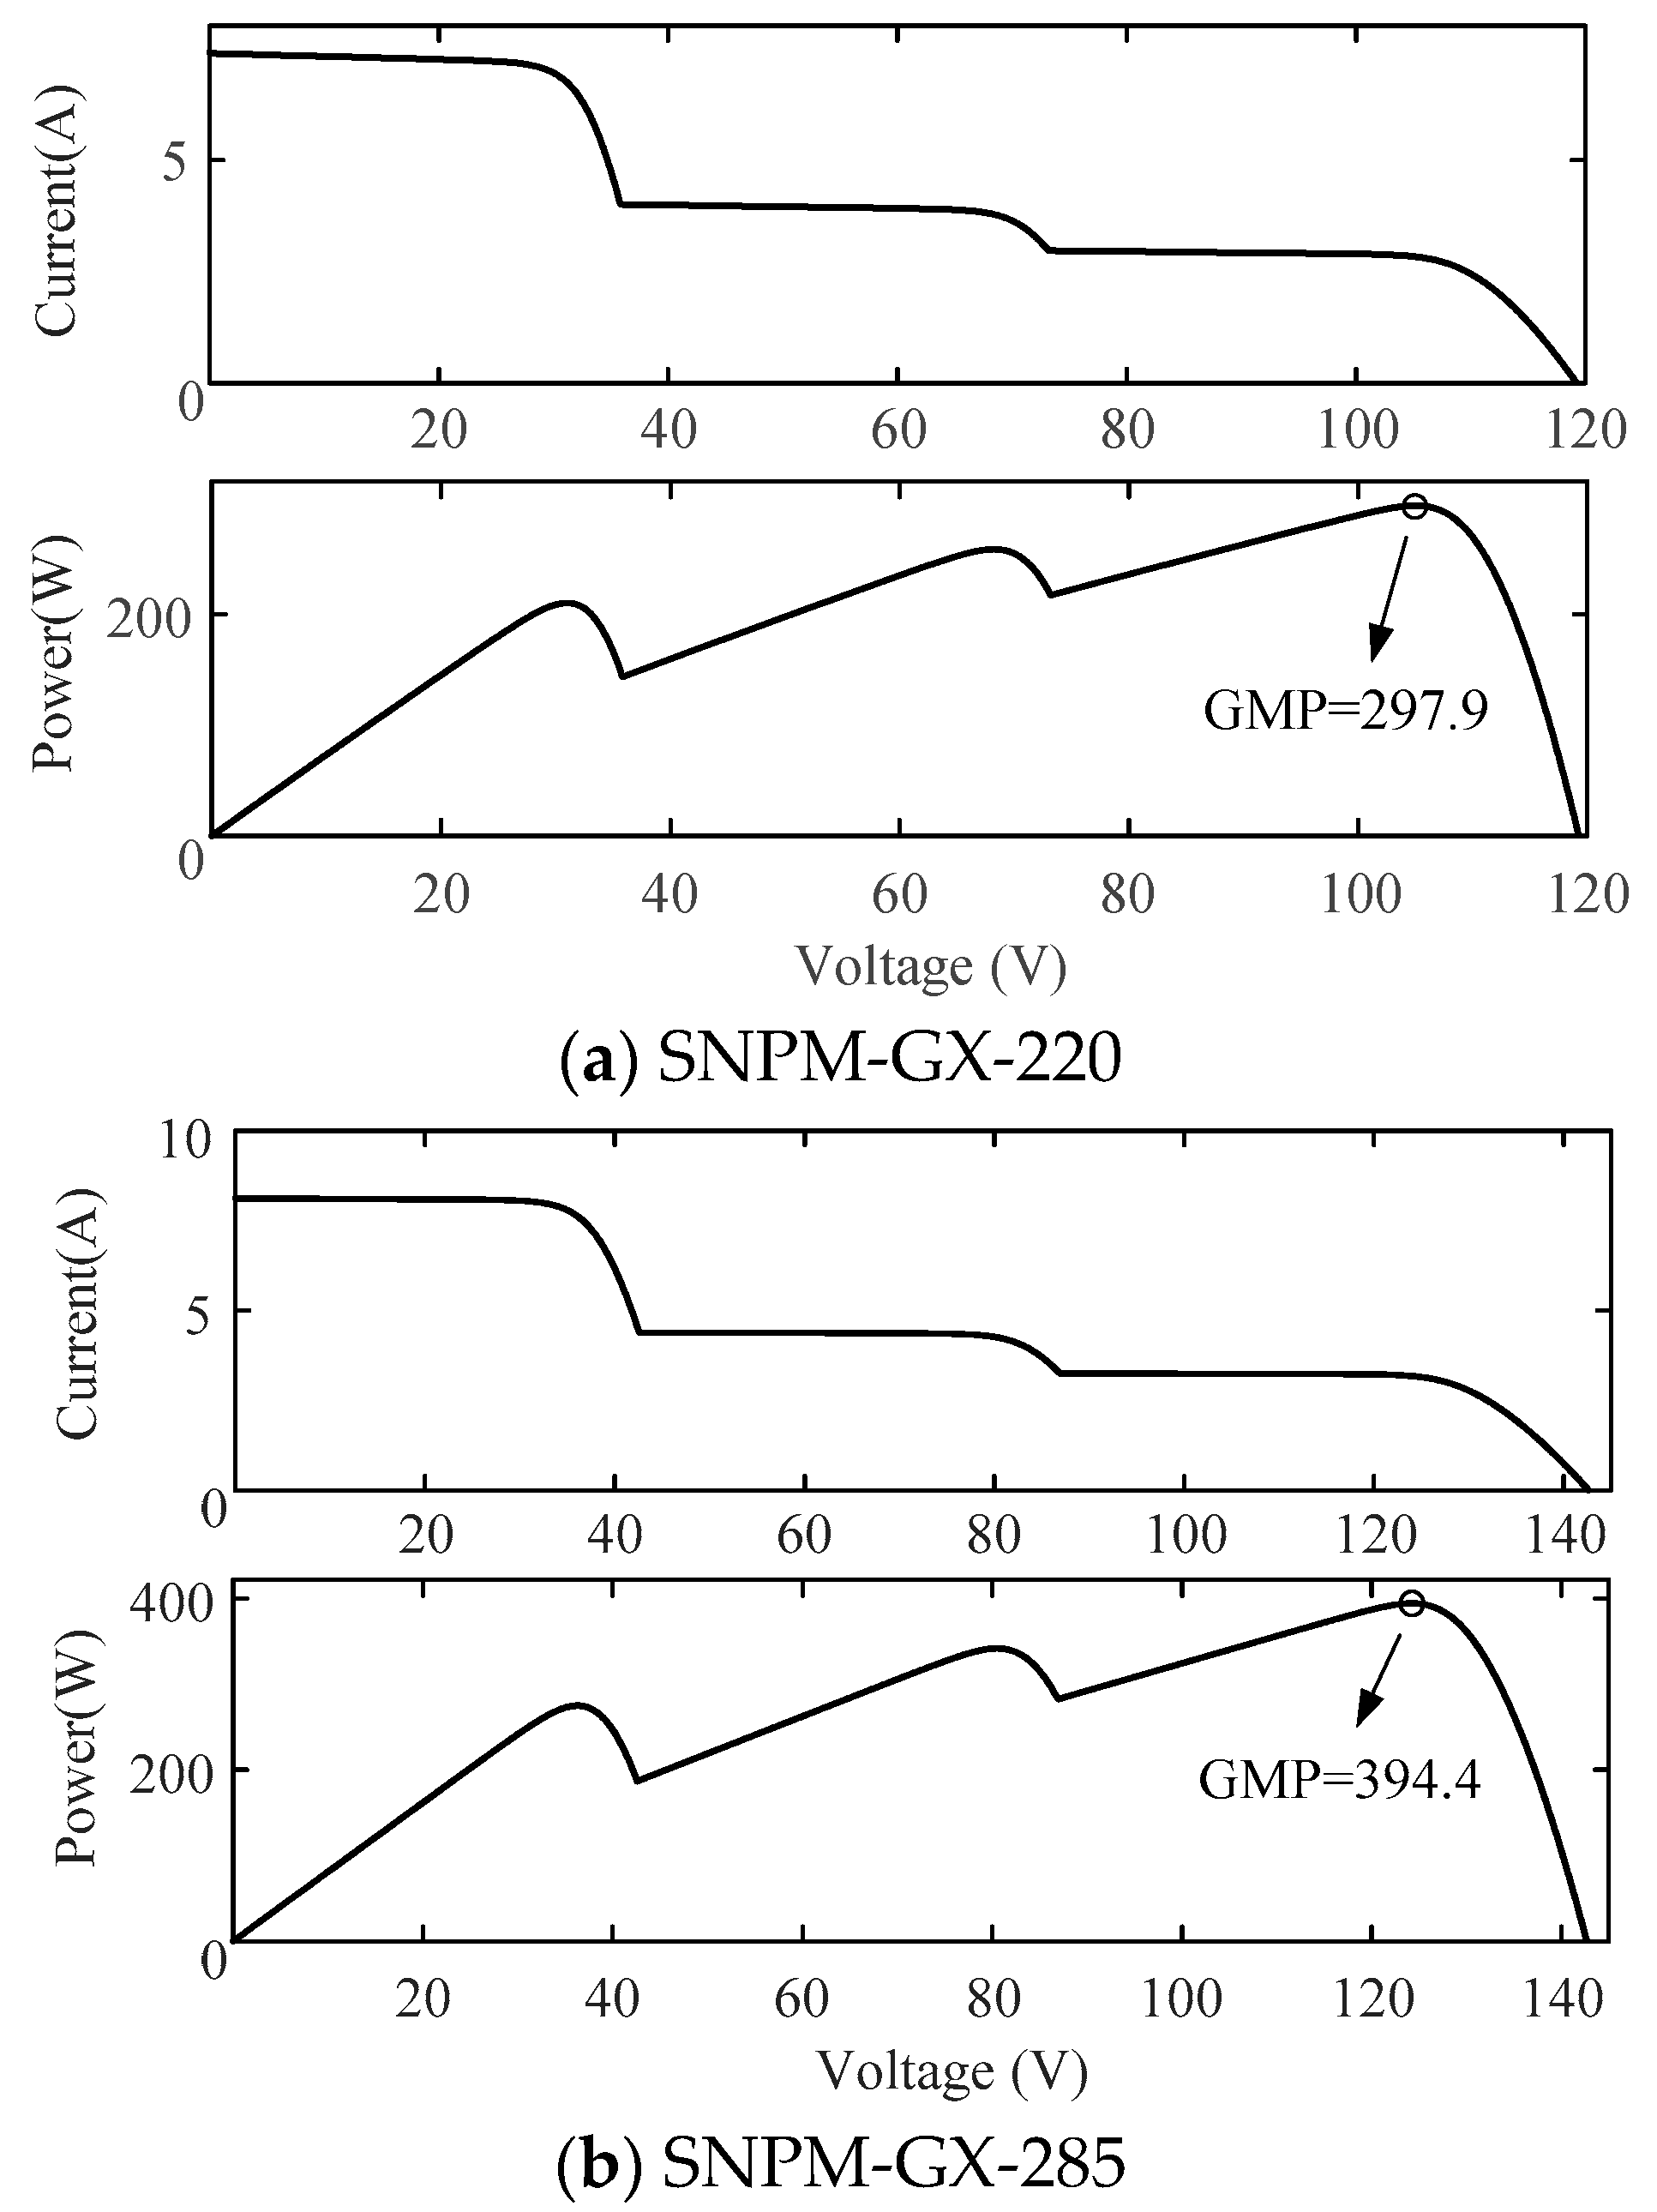
| SNPM-GX-220 | hybrid amorphous monocrystalline | 219.64 | 32.30 | 7.40 | 6.80 |
| SNPM-GX-285 | hybrid amorphous monocrystalline | 285.76 | 37.60 | 8.10 | 7.60 |
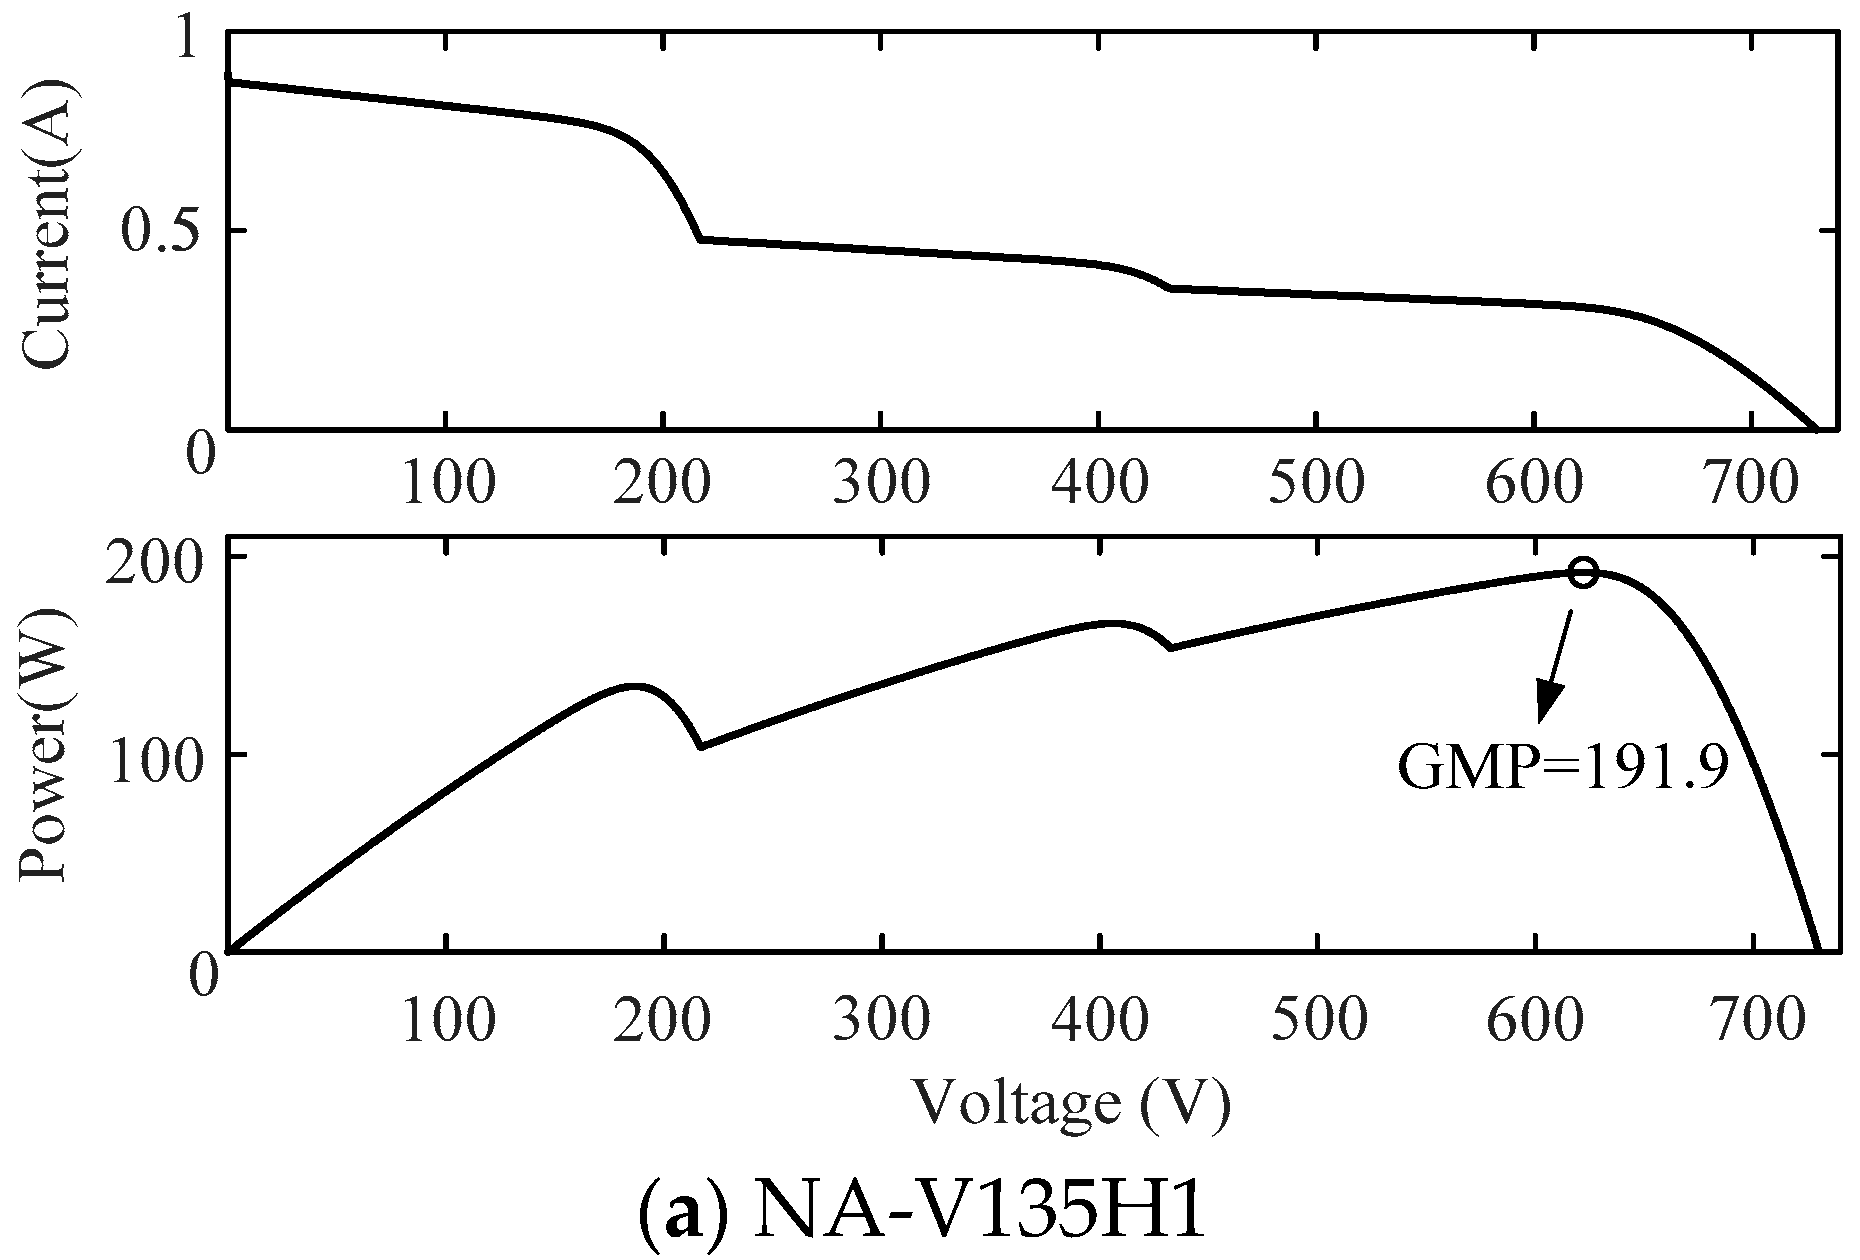
| NA-V135H1 | hybrid amorphous microcrystalline | 135.36 | 188.00 | 0.87 | 0.72 |
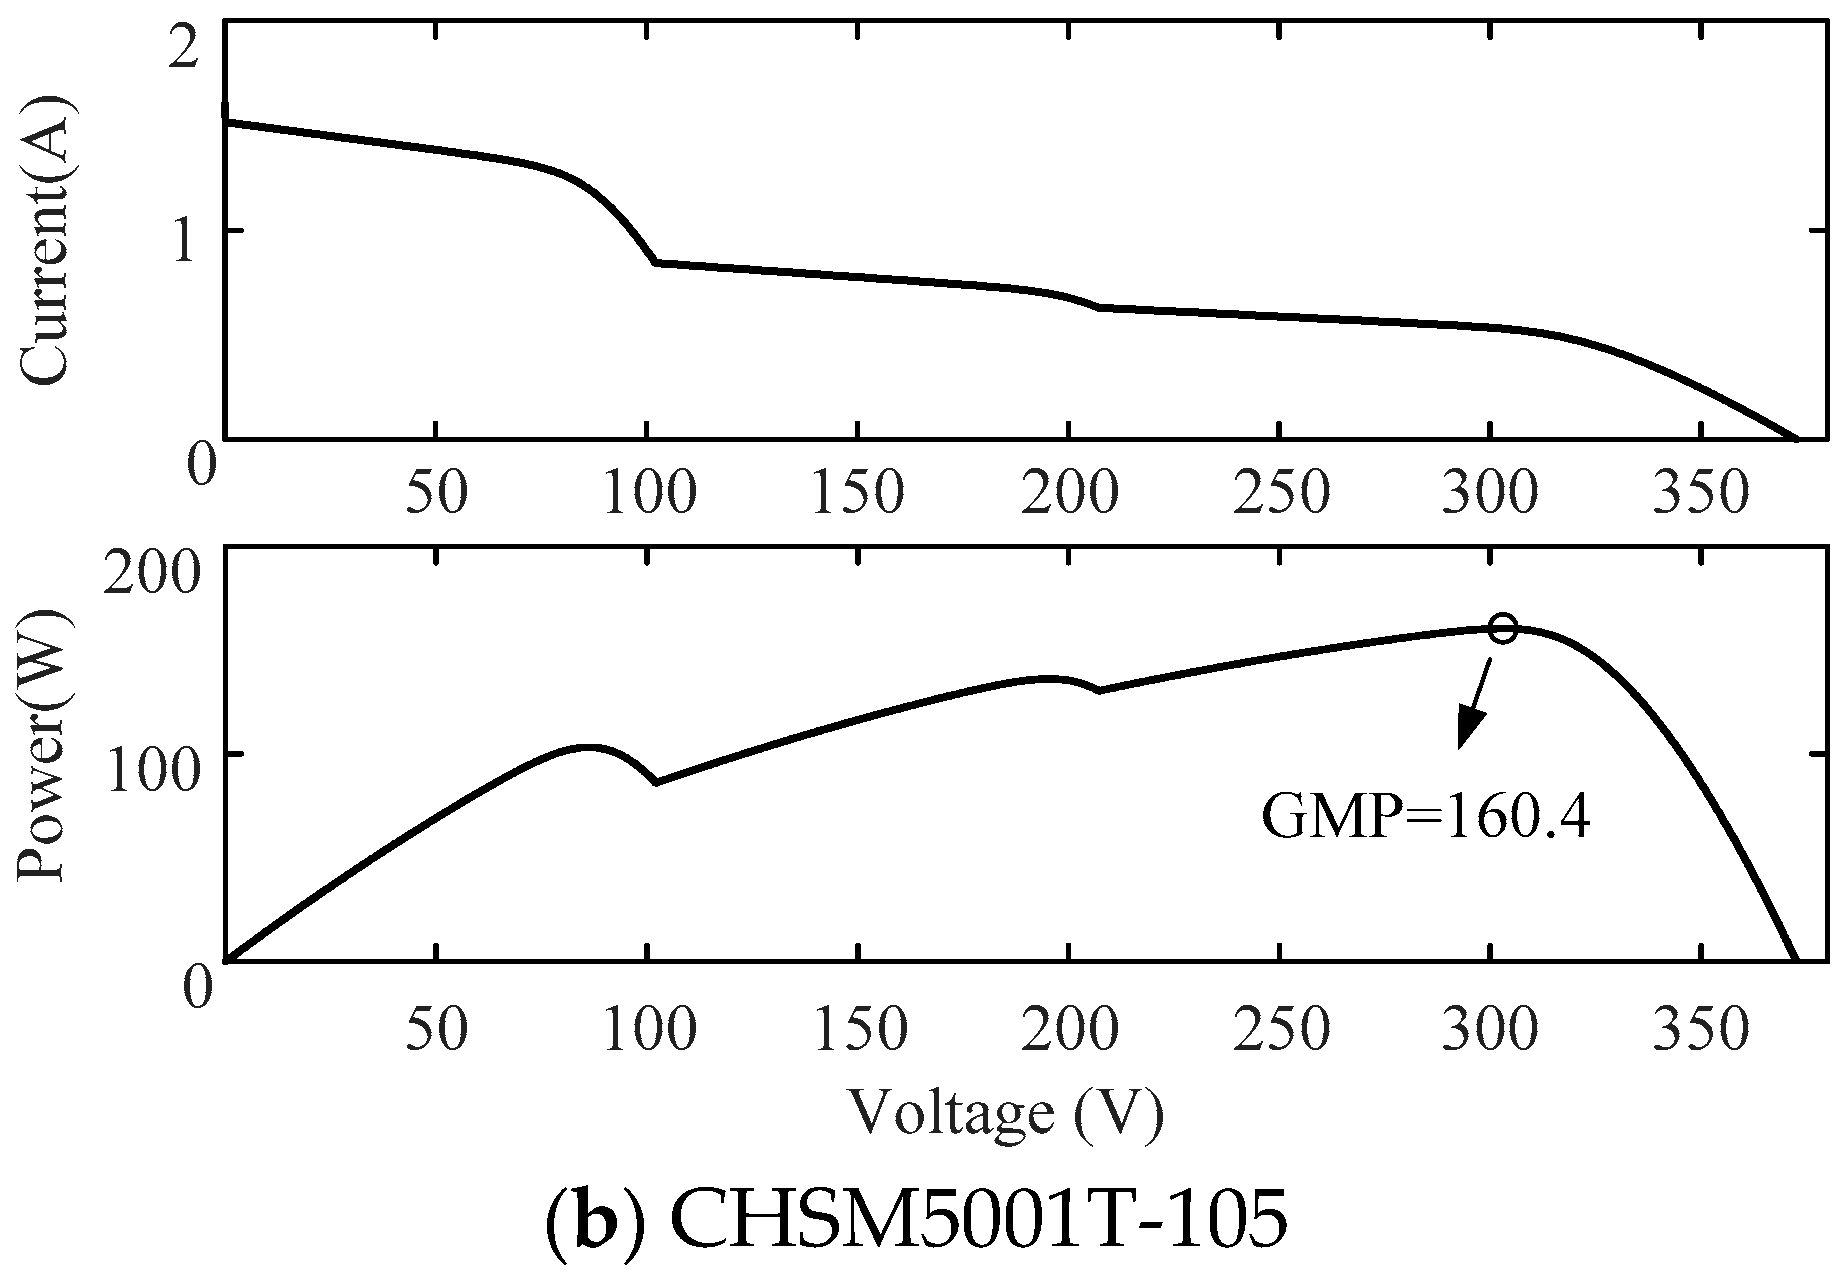
| CHSM5001T-105 | hybrid amorphous microcrystalline | 104.94 | 87.45 | 1.52 | 1.20 |
| Types | Materials | Performance Parameters | |||||
|---|---|---|---|---|---|---|---|
| IGMP (A) | VGMP (V) | GMP (W) | Current Variation (%) | Voltage Variation (%) | Power Variation (%) | ||
| ASEC-245G6S69 | monocrystalline | 3.69 | 89.09 | 328.4 | −58.7 | 8.2 | −27.2 |
| GSM-240 | monocrystalline | 3.26 | 97.05 | 316.2 | −58.4 | 6.0 | −28.1 |
| TSM-240PA05.18 | polycrystalline | 3.27 | 97.43 | 318.6 | −58.2 | 6.8 | −27.8 |
| JKM240P-60B | polycrystalline | 3.31 | 97.46 | 322.2 | −58.4 | 7.5 | −27.1 |
| TWSF-W-aSi-85W-1 | amorphous | 0.38 | 331.30 | 125.6 | −56.4 | 12.6 | −19.9 |
| QS85EGF | amorphous | 0.42 | 287.60 | 120.6 | −57.2 | 9.5 | −23.6 |
| FS-280 | cadmium telluride | 0.47 | 237.00 | 110.5 | −58.3 | 10.9 | −24.7 |
| FS-395 | cadmium telluride | 0.83 | 157.50 | 130.8 | −58.5 | 10.5 | −25.2 |
| SF80-US-P | copper indium selenium | 0.83 | 140.20 | 116.1 | −57.5 | 13.9 | −21.1 |
| SF90-US-B | copper indium selenium | 0.85 | 150.90 | 127.5 | −57.7 | 11.7 | −23.0 |
| STX-130 | copper indium gallium selenium | 0.97 | 193.40 | 187.6 | −57.6 | 13.4 | −21.6 |
| TS-150C1 | copper indium gallium selenium | 1.31 | 160.30 | 209.2 | −58.1 | 11.0 | −24.2 |
| SNPM-GX-220 | hybrid amorphous monocrystalline | 2.84 | 105.00 | 297.9 | −58.2 | 8.3 | −26.3 |
| SNPM-GX-285 | hybrid amorphous monocrystalline | 3.16 | 124.20 | 394.4 | −58.4 | 10.1 | −25.0 |
| NA-V135H1 | hybrid amorphous microcrystalline | 0.31 | 622.00 | 191.9 | −57.2 | 10.3 | −23.0 |
| CHSM5001T-105 | hybrid amorphous microcrystalline | 0.53 | 303.00 | 160.4 | −55.9 | 15.4 | −16.9 |
Publisher’s Note: MDPI stays neutral with regard to jurisdictional claims in published maps and institutional affiliations. |
© 2020 by the authors. Licensee MDPI, Basel, Switzerland. This article is an open access article distributed under the terms and conditions of the Creative Commons Attribution (CC BY) license (http://creativecommons.org/licenses/by/4.0/).
Share and Cite
Lin, G.; Bimenyimana, S.; Tseng, M.-L.; Wang, C.-H.; Liu, Y.; Li, L. Photovoltaic Modules Selection from Shading Effects on Different Materials. Symmetry 2020, 12, 2082. https://doi.org/10.3390/sym12122082
Lin G, Bimenyimana S, Tseng M-L, Wang C-H, Liu Y, Li L. Photovoltaic Modules Selection from Shading Effects on Different Materials. Symmetry. 2020; 12(12):2082. https://doi.org/10.3390/sym12122082
Chicago/Turabian StyleLin, Guoqian, Samuel Bimenyimana, Ming-Lang Tseng, Ching-Hsin Wang, Yuwei Liu, and Lingling Li. 2020. "Photovoltaic Modules Selection from Shading Effects on Different Materials" Symmetry 12, no. 12: 2082. https://doi.org/10.3390/sym12122082
APA StyleLin, G., Bimenyimana, S., Tseng, M.-L., Wang, C.-H., Liu, Y., & Li, L. (2020). Photovoltaic Modules Selection from Shading Effects on Different Materials. Symmetry, 12(12), 2082. https://doi.org/10.3390/sym12122082