Article

Classification of Congestive Heart Failure from ECG Segments with a Multi-Scale Residual Network

1
College of Data Science, Taiyuan University of Technology, Jinzhong 030024, China
2
Technology Research Center of Spatial Information Network Engineering of Shanxi, Jinzhong 030024, China
3
College of Information and Computer, Taiyuan University of Technology, Jinzhong 030024, China
*
Author to whom correspondence should be addressed.
Symmetry 2020, 12(12), 2019; https://doi.org/10.3390/sym12122019
Submission received: 20 November 2020 / Revised: 2 December 2020 / Accepted: 3 December 2020 / Published: 7 December 2020
(This article belongs to the Section Computer)

Abstract

:
Congestive heart failure (CHF) poses a serious threat to human health. Once the diagnosis of CHF is established, clinical experts need to assess the severity of CHF in a timely manner. It is proved that electrocardiogram (ECG) signals are useful for assessing the severity of CHF. However, since the ECG perturbations are subtle, it is difficult for doctors to detect the differences of ECGs. In order to help doctors to make an accurate diagnosis, we proposed a novel multi-scale residual network (ResNet) to automatically classify CHF into four classifications according to the New York Heart Association (NYHA) functional classification system. Furthermore, in order to make the reported results more realistic, we used an inter-patient paradigm to divide the dataset, and segmented the ECG signals into two different intervals. The experimental results show that the proposed multi-scale ResNet-34 has achieved an average positive predictive value, sensitivity and accuracy of 93.49%, 93.44% and 93.60% respectively for two seconds of ECG segments. We have also obtained an average positive predictive value, sensitivity and accuracy of 94.16%, 93.79% and 94.29% respectively for five seconds of ECG segments. The proposed method can be used as an auxiliary tool to help doctors to classify CHF.

1. Introduction

Congestive heart failure (CHF) is a complex clinical syndrome. Some advanced heart diseases can potentially lead to abnormal changes in cardiac structure or function, which makes ventricular systolic or diastolic dysfunction, and can eventually lead to CHF. The main manifestations of CHF are breathlessness, ankle swelling, fatigue and peripheral edema [1]. CHF is an important part of the global chronic cardiovascular diseases, and is the final stage of the development of various heart diseases. CHF has high morbidity and high mortality. In 2016, the European Society of Cardiology (ESC) indicated that there were 26 million patients suffering from CHF worldwide, while 3.6 million patients were newly diagnosed annually. Seventeen to forty five percent of CHF patients die within the first year and the remaining die within five years [2]. CHF poses a serious threat to human health and is a major social problem. Prompt diagnosis and treatment can improve survival in patients with CHF. Therefore, it is important to detect CHF early and accurately assess the severity of CHF.
Once the diagnosis of CHF is established, clinical experts need to assess the severity of CHF in a timely manner, since this assessment allows them to determine the most appropriate treatment to be followed. Nowadays, there are various guidelines in the world for doctors to assess the severity of CHF, and the most widely used one is the New York Heart Association (NYHA) functional classification system [
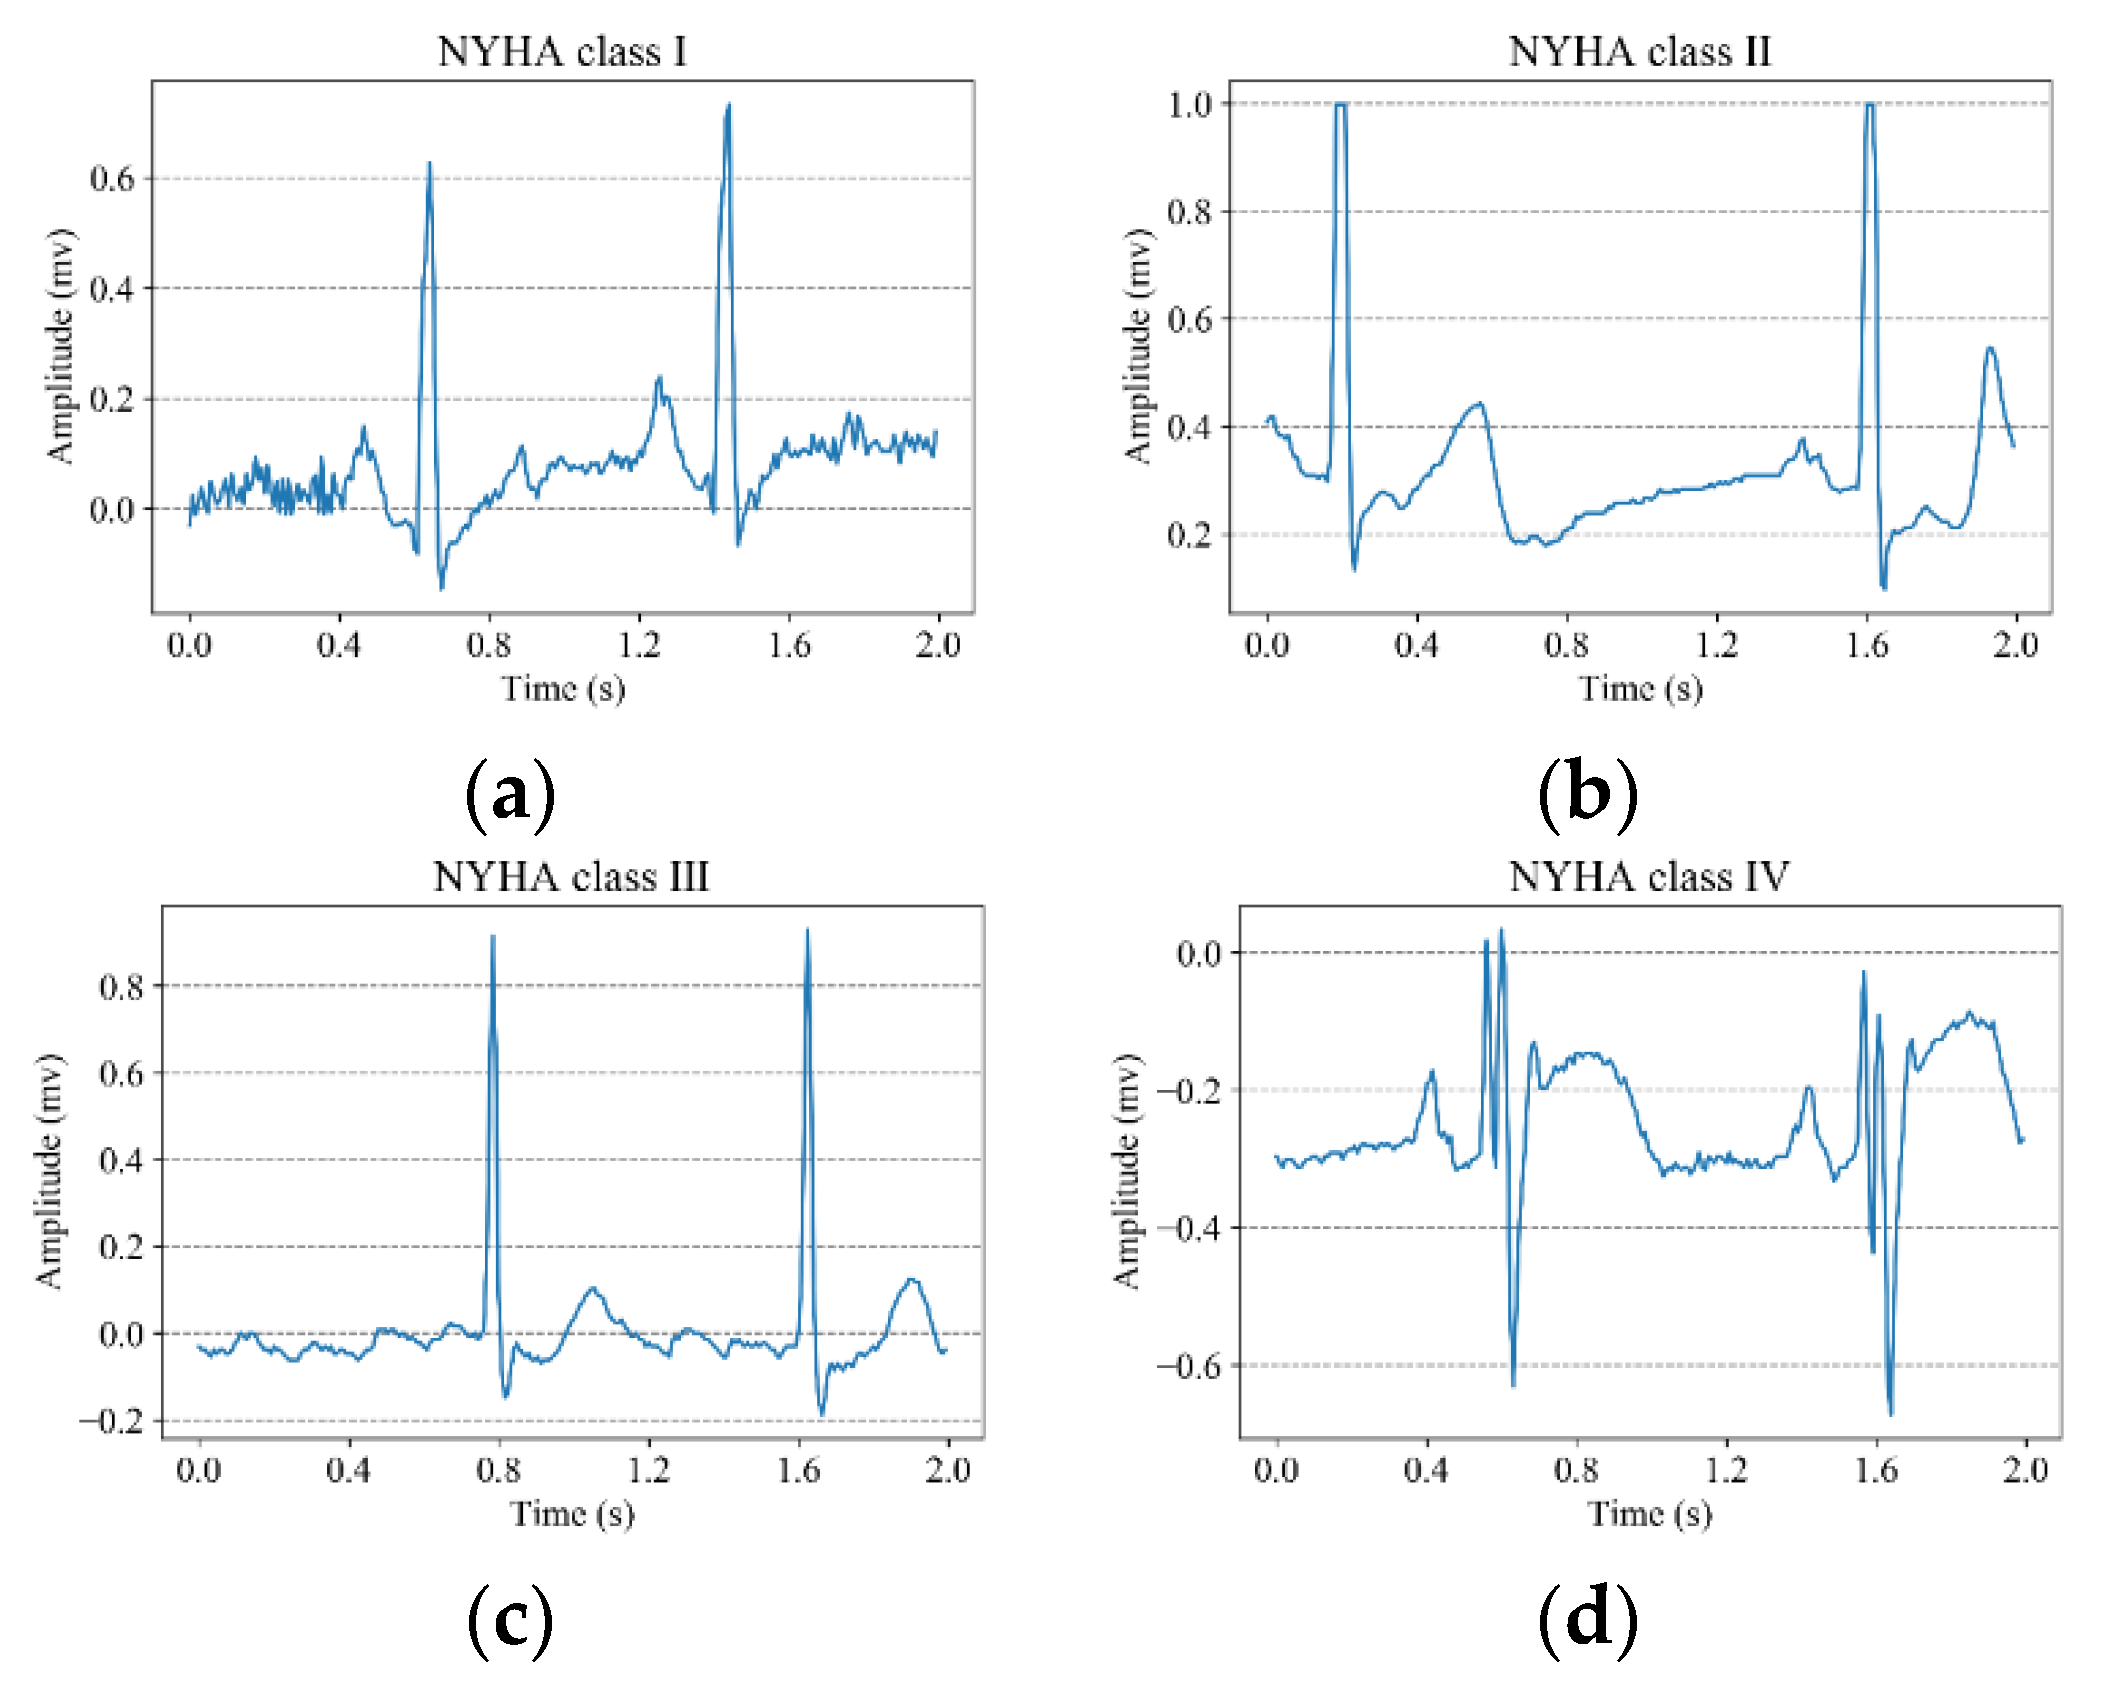
3]. According to exercise capacity of the patient and the symptomatic status of the disease, the NYHA functional classification system classifies CHF into four classifications: NYHA class I, NYHA class II, NYHA class III and NYHA class IV. The severity of CHF increases from class I to class IV. However, the NYHA functional classification system mainly relies on the statements of patients and the experience of doctors. The diagnostic results are susceptible to the subjectivity and thus inter-observer variability can be introduced. Therefore, it is important to find a convenient, effective and objective solution to help doctors to assess the severity of CHF.
The electrocardiogram (ECG) is a non-invasive examination method, which has the advantages of low cost, good examination effect and fast examination speed. Although the morphology of the ECG signals is different in the four classifications of CHF, it is difficult for doctors to identify the subtle differences with the naked eyes. Furthermore, it is time-consuming for physicians to visually examine the recorded ECG signals. With the development of computer science, many researchers began to use computer methods to analyze ECG signals to classify CHF. Bhurane et al. [4] extracted five different features from short ECG segments and employed the quadratic support vector machine (SVM) to detect CHF subjects from normal people. They evaluated their algorithm using 10-fold cross-validation, and obtained the accuracy of 99.66%, sensitivity of 99.82% and a specificity of 99.28% across four datasets. Acharya et al. [5] developed an 11-layer deep convolutional neural network (CNN) to detect CHF using two second ECG segments. The accuracy, sensitivity and specificity are 98.97%, 98.87% and 99.01%, respectively. Heart rate variability (HRV) refers to the variations in the heartbeat intervals. The variations of HRV show indicators of current disease, or warn about impending cardiac disease [6]. By analyzing HRV signals, researchers can obtain much useful information for the classification of CHF. Melillo et al. [7] extracted 13 features from long-term HRV signals, and they used the classification and regression tree (CART) to divide CHF into mild CHF (NYHA class I and II) and severe CHF (NYHA class III and IV). Their methods achieved the accuracy of 85.4%, the sensitivity of 93.3% and the specificity of 63.6%. Shahbazi et al. [8] applied the generalized discriminant analysis to reduce the number of features extracted from long-term HRV signals, and used the k-nearest-neighbor (KNN) classifier to discriminate between mild CHF (NYHA class I and II) and severe CHF (NYHA class III and IV). Qu et al. [9] extracted HRV features, and used two classifiers to classify CHF into three classes. The SVM achieved an accuracy, sensitivity and specificity of 84.0%, 71.2% and 83.4%, respectively. The CART achieved an accuracy, sensitivity and specificity of 81.4%, 66.5% and 81.6%, respectively. Hua et al. [10] extracted 34 features from long-term HRV signals, and implemented the sequence forward selection algorithm to reduce the feature dimension. They applied the SVM to distinguish between CHF and normal subjects using the selected five features. Furthermore, they applied the KNN to classify CHF into four levels using the selected four features. Chen et al. [11] extracted 54 classical measures and 126 dynamic indices from short-term HRV. In addition, they applied the backward elimination to select features. Finally, they applied a multi-stage classification approach to classify CHF into four levels: no risk (normal people), mild risk (NYHA class I and II), moderate risk (NYHA class III) and severe risk (NYHA class III–IV).
The above studies show that computer-aided diagnosis systems play important roles in classifying CHF. Although they all attain good results, there is much work to be addressed. Most of the above studies classify CHF into two or three classes, whereas few studies classify CHF into four classes. Except for Acharya et al. [5], other researchers all extracted features manually from ECG signals or HRV signals, then used different machine learning approaches to classify the features. Their methods are time-consuming, and the experimental results are susceptible to the extracted features. Since deep learning [12] models can automatically extract and select features from data and automatically classify the features, they can obtain better classification results than traditional machine learning approaches. Furthermore, it takes less time for deep learning models to obtain the classification results. Hence, in this work, we propose a novel deep learning model called multi-scale residual network (ResNet), which can automatically classify CHF into four classifications according to the NYHA functional classification system.
The rest of this paper is organized as follows. The dataset and methods, including data pre-processing, the architecture of the proposed multi-scale ResNet, the training and testing methods of the deep learning models are described in Section 2. In Section 3, the experimental results are presented, and we compare our methods to others. We discuss our work in Section 4. Finally, we summarize our work and the future work is highlighted in Section 5.

2. Material and Methods

2.1. Data Used

The data used in this work were obtained from Shanxi Bethune Hospital. We have collected a dataset of 764 ECG records from 764 patients suffering from CHF. The collected data are all fully deidentified. The ECG signals are sampled at a frequency of 250 Hz, and are collected from lead II. Each ECG signal is 5 min long. Moreover, according to the NYHA functional classification system, clinical experts have annotated each patient as a different classification of CHF. Figure 1 shows the typical ECG segments of the four different NYHA classifications. Table 1 shows an overview of the data used in this work.

2.2. Pre-Processing

Normally, there are two paradigms to divide the dataset. One is called intra-patient paradigm and the other is called inter-patient paradigm [13]. If using the intra-patient paradigm to divide the dataset, training and test set may contain ECG segments from the same patient. During the training process, the classification model has learned the specialties of particular patient. If the test set also contains the ECG segments from the same patient, the reported results will be biased. In contrast, using an inter-patient paradigm to divide the dataset means that all ECG segments from one subject are either in training or are a test set. Hence, the reported results are more realistic in clinical practice. In this work, we use an inter-patient paradigm to divide the dataset.
First, we randomly select 20% of the CHF patients as the test set according to the distribution of patients. Then, we use 80% of the remaining data as the training set and 20% of the remaining data as the validation set. Figure 2 details the data distribution for the training set, validation set and test set.
We use the training set to train the deep learning models. According to the validation set results, we save the model with the highest validation accuracy. The model performance is evaluated using the test set.
After dividing the patients, we segment the ECG signal of each patient into 2 s (Set I) and 5 s (Set II) without R-peak detection and denoising. Dividing the dataset according to the distribution of patients ensures that the ECG segments in the training and test set come from different patients. Table 2 details the distribution of the ECG segments used in this work. There are a total of 114,600 ECG segments in Set I and 45,840 ECG segments in Set II.
Finally, in order to facilitate the subsequent data processing and to speed up training convergence, we apply min-max normalization (Equation (1)) to normalize the raw ECG segments. The amplitude of each ECG segment is normalized to the range of [0,1].
x = x min ( x ) max ( x ) m i n ( x ) + ε
where x represents the normalized ECG segments, min ( x ) and max ( x ) are the minimum and maximum amplitudes of the raw ECG segments, respectively. ε is set to 0.0001 to prevent having a denominator equal to 0.

2.3. Multi-Scale ResNet

2.3.1. ResNet

The depth of the CNN affects the model performance. Therefore, various CNN architectures such as AlexNet [14] and VGGNet [15], improve their performance by making the architectures as deep as possible. However, with the increase in the depth of CNN, the model performance tends to be saturated, and even degrades rapidly. As a result, it is more difficult to train the deep networks. In order to solve the problem, He et al. [16] proposed the ResNet architecture.
Figure 3 shows the architecture of the ResNet. Firstly, the data are directly input into a convolutional layer. After the convolutional layer, there is a max pooling layer to reduce the size of the feature map. The main body of the ResNet consists of four blocks, and each block consists of several repeating residual blocks. Except for the number of filters in the convolutional layers, the architecture of the four blocks is similar. In particular, the convolutional layers have the same number of filters in the same block. In addition, each block will halve the feature map of the inputs while the number of filters in the convolutional layers is doubled. After the last block, there is a global average pooling layer and a fully connected layer. The outputs of the ResNet can be obtained by the fully connected layer.
Figure 4a shows the architecture of the residual block proposed by He et al [16]. The output of the residual block can be expressed as Equation (2).
y = R e L U ( f ( x ) + x )
where y represents the output of the residual block, R e L U represents the rectified linear unit activation [14] and x represents the input of the residual block. The function f ( ) contains two convolutional layers, two batch normalization layers [17] and a ReLU activation. The residual block uses the shortcut connection to add the input of the residual block to the output of the second batch normalization layer, which allows information to propagate well. Benefiting from the architecture of the residual block, the ResNet can optimize training in very deep neural networks.

2.3.2. Multi-Scale Residual Block

Based on the residual block, we propose a novel multi-scale residual block (MSRB). Unlike the original residual block (Figure 4a), the input of our proposed MSRB is sent to two channels with different convolution kernel sizes for feature extraction. The architecture of each channel is the same as the original residual block. Different scale features can be extracted from the two channels. The output of the proposed architecture is a combination of the two channels with their output filter banks concatenated into a single output vector. Additionally, in the proposed architecture, zero-padding is necessary to maintain the size of the feature map. Figure 4b shows the architecture of our proposed MSRB. The output of the MSRB can be expressed as Equation (3).
y = [ R e L U ( f 1 ( x ) + x ) R e L U ( f 2 ( x ) + x ) ]
where function f 1 ( ) and f 2 ( ) represent the architectures of the two channels, respectively. Other parameters of Equation (3) are the same as those of Equation (2).

2.3.3. Multi-Scale ResNet-34

Figure 5 illustrates the architecture of our proposed multi-scale ResNet-34. The input of our proposed model is the ECG segments. After the input layer, there is a convolutional layer, a batch normalization layer, a ReLU activation and a max pooling layer. The main body of our proposed model consists of eight MSRBs. Except for the convolution kernel size and the number of filters in the convolutional layers, all the architectures of the MSRBs are the same. After every two MSRBs, there is a max pooling layer to halve the length of the feature map. After the last MSRB, we apply a global average pooling layer, a dropout layer [18] and a fully connected layer. Finally, there is a Softmax layer to classify CHF into four classifications according to the NYHA functional classification system. Table 3 details the parameter of the proposed model.

2.4. Training and Testing

Since there is not a pre-trained dataset as large as the ImageNet dataset [19], we have to train the proposed model from scratch. He initialization [20] is used to initialize the weights of each convolutional layer. A total of 64 ECG segments are input into the proposed model at a time. We use cross-entropy loss function to evaluate the model loss. We apply Adam [21] optimizer to optimize parameters and set the learning rate to 0.001. The learning rate will multiply 0.1 if the validation loss does not present any improvement for five consecutive epochs. The model will stop training if the validation loss does not present any improvement for ten consecutive epochs.
After training an epoch, the validation results are evaluated using the trained model. According to the validation results, we saved the model with the highest validation accuracy. Finally, the model performance is evaluated using the saved model.

3. Results

The deep learning models were trained on a personal computer with an Intel Core i5-5200 (2.2 GHz) processor, a NVIDA GeForce 920M Graphics Processing Unit (GPU) and an 8 GB RAM. The deep learning models were developed on the deep learning framework of Keras with Tensorflow as the backend. All the code was written in Python.
To find out the best architecture of the proposed multi-scale RseNet, we designed a multi-scale ResNet-18 with the first four MSRBs and a multi-scale ResNet-26 with the first six MSRBs. Except for the number of convolutional layers, other parameters are the same as those of the multi-scale ResNet-34. We trained and tested all the multi-scale ResNets using our collected dataset. Figure 6 shows the validation results of the three proposed multi-scale ResNets.
It can be observed from Figure 6 that starting from the 17th epoch, the validation results of the three models tend to be stable. In addition, the multi-scale ResNet-34 achieves the highest validation accuracy for both sets. During the training process, we have saved the models with the highest validation accuracy. Then, we used the test set to evaluate the performance of the saved models. The evaluation metrics are positive predictive value (PPV), sensitivity (Sen) and accuracy (Acc), which are separately defined in Equations (4)–(6).
p o s i t i v e   p r e d i c t i v e   v a l u e = T P T P + F P
S e n s i t i v i t y = T P T P + F N
A c c u r a c y = T P + T N T P + F P + F N + T N
where for NYHA class I, we view it as a positive case and other NYHA classes as a negative case. TP represents the number of the patients with NYHA class I that are correctly classified as NYHA class I. TN represents the number of patients without NYHA class I that are correctly classified as other classes. FP represents the number of the patients without NYHA class I that are falsely classified as NYHA class I. FN represents the number of the patients with NYHA class I that are falsely classified to other classes. Other classes are the same as NYHA class I. Table 4 and Table 5 separately show the test results of our proposed multi-scale ResNet-34.
It can be seen from Table 4 and Table 5 that the highest positive predictive values recorded for both sets are attributed to the detection of NYHA class III and are respectively 94.86% and 94.72%. The highest sensitivities recorded for both sets are attributed to the classification of NYHA class IV and are respectively 94.94% and 95.47%.
The proposed multi-scale ResNet-34 achieves the highest average positive predictive value of 94.16%, average sensitivity of 93.79% and accuracy of 94.29% for Set II. Furthermore, an average positive predictive value of 93.49%, an average sensitivity of 93.44% and an accuracy of 93.60% are obtained for Set I.
We also compared our proposed models to other deep learning models using our collected dataset. The same methods were used to train and test the 11-layer CNN model [5] and the ResNet-34 model [22], respectively. The overall average performance of the models is tabulated in Table 6.
It can be noted from Table 6 that all the deep learning models can obtain a good model performance in classifying CHF. The highest average positive predictive value, average sensitivity and accuracy for both sets are obtained by our proposed multi-scale ResNet-34. Moreover, for the five deep learning models, Set II (two seconds long ECG segment) achieves better model performance than Set I (five seconds long ECG segment).
We also assessed the doctor performance on the test set. We asked two doctors with three years of clinical experience to classify the heart failure patients based on the patients’ ECG signals and the clinical records. The average performance of the two doctors is shown in Table 7. It can be noted that our proposed method can outperforms the doctors considering the PPV and accuracy.

4. Discussion

Traditional methods [7,8,9,10,11] for classifying CHF have to firstly filter the noise, then manually extract and select features, and finally use different classifiers to classify the selected features. It takes much time for researchers to design handcrafted pre-processing and feature extraction. Furthermore, the experimental results are susceptible to the selected features. Deep learning models can automatically learn from the raw data and merge the feature extraction and the feature classification processes into one step. Therefore, it takes less time for deep learning models to classify CHF, and the classification results are improved. In this work, we proposed a novel deep learning model called multi-scale ResNet-34, which can automatically classify CHF into four classifications according to the NYHA functional classification system. It is unnecessary for the proposed model to manually extract features and select features. Furthermore, the raw ECG segments can be directly input into the proposed model for classification after simple pre-processing. Compared to the ResNet-34, our proposed model can extract multi scale features so that the model can learn more information from data. Hence, the proposed model achieves better performance.
Normally, clinical experts have to analyze a short-duration ECG record instead of an ECG beat to classify CHF. Therefore, in this work, we segmented ECG signals into two different intervals to analyze the effect of ECG length on the classification of CHF. The experimental results demonstrate that the classification of CHF from five second ECG segments can achieve better model performance. Since the long-duration ECG segments contain more information, deep learning models can extract more features from the long-duration ECG segments. Therefore, the model performance is improved.
In addition, in clinical practice, the computer-aided diagnosis systems are developed on the confirmed cases, and are used to diagnose the probable cases. Hence, we use an inter-patient paradigm to divide the dataset in this work so that the data in the training set, validation set and test set come from different patients. The reported results are more realistic in clinical practice.
The main highlights of our work are as follows:
(1)
We creatively propose a multi-scale ResNet-34 to automatically classify CHF into four classifications according to the NYHA functional classification system.
(2)
The proposed method can automatically extract different scale features from data and requires little pre-processing.
(3)
The effect of ECG length on the classification of CHF is analyzed in this work.
(4)
An inter-patient paradigm is used to divide the dataset. Hence, the reported results are realistic in the clinical environment.
The drawbacks of our work are as follows:
(1)
Our methods require a lot of data for training.
(2)
In order to attain better model performance, hyperparameter optimization takes a long time.

5. Conclusions

In this work, we have proposed a novel multi-scale ResNet-34 to classify CHF using ECG segments. The proposed model can automatically extract different scale features from data and requires little pre-processing. In addition, we analyzed the effects of two different intervals of ECG segments on the classification of CHF. Our proposed model achieved an average positive predictive value of 93.49%, an average sensitivity of 93.44% and an accuracy of 93.60% for two seconds of ECG segments. Moreover, we achieved an average positive predictive value of 94.16%, an average sensitivity of 93.79% and an accuracy of 94.29% for five seconds of ECG segments. Furthermore, we compared our proposed models with other deep learning models using our collected dataset. The experimental results showed that our proposed multi-scale ResNet-34 achieved the highest model performance for both sets. We also compared our methods to methods doctors used in hospital. Considering the PPV and accuracy, our proposed method outperforms the doctors. Since this work used an inter-patient paradigm to divide the dataset, the reported results were realistic in the clinical environment. Hence, the proposed method can be used as an auxiliary tool to help doctors classify CHF in clinical practice. Furthermore, the proposed method can be extended to analyze other time-series signals. Our work only used ECG signals to classify CHF. However, in clinical practice, doctors also need to analyze additional physiological indicators to classify CHF. In future, we will combine some physiological indicators with ECG signals to develop a more efficient method to classify CHF.

Author Contributions

Conceptualization, D.L. and Y.T.; methodology, Y.T.; software, Y.T.; validation, Y.T.; formal analysis, D.L and Y.T.; resources, D.L.; writing—original draft preparation, Y.T.; writing—review and editing, H.W.; supervision, J.Z.; funding acquisition, D.L. and J.Z. All authors have read and agreed to the published version of the manuscript.

Funding

This research was funded by The General Object of National Natural Science Foundation grant number 62076177 and 61772358; Shanxi Province key core technology and generic technology research and development special project grant number 2020XXX007.

Acknowledgments

The work is supported by The General Object of National Natural Science Foundation (62076177) Study on the risk Assessment Model of heart failure by integrating multi-modal big data; The General Object of National Natural Science Foundation (61772358) Research on the key technology of BDS precision positioning in complex landform; Shanxi Province key core technology and generic technology research and development special (project No. 2020XXX007) Energy Internet Integrated Intelligent Data Management and Decision Support Platform.

Conflicts of Interest

The authors declare no conflict of interest.

References

  1. Tripoliti, E.E.; Papadopoulos, T.G.; Karanasiou, G.S.; Naka, K.K.; Fotiadis, D.I. Heart failure: Diagnosis, severity estimation and prediction of adverse events through machine learning techniques. Comput. Struct. Biotechnol. J. 2017, 15, 26–47. [Google Scholar] [CrossRef] [PubMed] [Green Version]
  2. Ponikowski, P.; Voors, A.A.; Anker, S.D.; Bueno, H.; Cleland, J.G.F.; Coats, A.J.S.; Falk, V.; González-Juanatey, J.R.; Harjola, V.-P.; Jankowska, E.A.; et al. 2016 ESC guidelines for the diagnosis and treatment of acute and chronic heart failure. Eur. Heart J. 2016, 37, 2129–2200. [Google Scholar] [CrossRef] [PubMed]
  3. Bennett, J.A.; Riegel, B.; Bittner, V.; Nichols, J. Validity and reliability of the NYHA classes for measuring research outcomes in patients with cardiac disease. Heart Lung 2002, 31, 262–270. [Google Scholar] [CrossRef] [PubMed]
  4. Bhurane, A.A.; Sharma, M.; Tan, R.-S.; Acharya, U.R. An efficient detection of congestive heart failure using frequency localized filter banks for the diagnosis with ECG signals. Cogn. Syst. Res. 2019, 55, 82–94. [Google Scholar] [CrossRef]
  5. Acharya, U.R.; Fujita, H.; Oh, S.L.; Hagiwara, Y.; Tan, J.H.; Adam, M.; Tan, R.S. Deep convolutional neural network for the automated diagnosis of congestive heart failure using ECG signals. Appl. Intell. 2019, 49, 16–27. [Google Scholar] [CrossRef]
  6. Acharya, U.R.; Joseph, K.P.; Kannathal, N.; Lim, C.M.; Suri, J.S. Heart rate variability: A review. Med. Biol. Eng. Comput. 2006, 44, 1031–1051. [Google Scholar] [CrossRef] [PubMed]
  7. Melillo, P.; De Luca, N.; Bracale, M.; Pecchia, L. Classification tree for risk assessment in patients suffering from congestive heart failure via long-term heart rate variability. IEEE J. Biomed. Health 2013, 17, 727–733. [Google Scholar] [CrossRef] [PubMed]
  8. Shahbazi, F.; Asl, B.M. Generalized discriminant analysis for congestive heart failure risk assessment based on long-term heart rate variability. Comput. Meth. Prog. Biomed. 2015, 122, 191–198. [Google Scholar] [CrossRef] [PubMed]
  9. Qu, Z.; Liu, Q.; Liu, C. Classification of congestive heart failure with different New York Heart Association functional classes based on heart rate variability indices and machine learning. Expert Syst. 2019, 36, e12396. [Google Scholar] [CrossRef]
  10. Hua, Z.; Chen, C.; Zhang, R.; Liu, G.; Wen, W.-H. Diagnosing various severity levels of congestive heart failure based on long-term HRV signal. Appl. Sci. 2019, 9, 2544. [Google Scholar] [CrossRef] [Green Version]
  11. Chen, W.; Zheng, L.; Li, K.; Wang, Q.; Liu, G.; Jiang, Q. A novel and effective method for congestive heart failure detection and quantification using dynamic heart rate variability measurement. PLoS ONE 2016, 11, e0165304. [Google Scholar] [CrossRef] [PubMed]
  12. Lecun, Y.; Bengio, Y.; Hinton, G. Deep learning. Nature 2015, 521, 436–444. [Google Scholar] [CrossRef] [PubMed]
  13. Takalo-Mattila, J.; Kiljander, J.; Soininen, J.-P. Inter-patient ECG classification using deep convolutional neural networks. In Proceedings of the 21st Euromicro Conference on Digital System Design (DSD 2018), Prague, Czech Republic, 29 August 2018; pp. 421–425. [Google Scholar]
  14. Krizhevsky, A.; Sutskever, I.; Hinton, G. ImageNet classification with deep convolutional neural networks. In Proceedings of the Neural Information Processing Systems (NIPS 2012), Lake Tahoe, NV, USA, 3–6 December 2012; pp. 1097–1105. [Google Scholar]
  15. Simonyan, K.; Zisserman, A. Very deep convolutional networks for large-scale image recognition. In Proceedings of the International Conference on Learning Representations (ICLR 2015), San Diego, CA, USA, 7 May 2015. [Google Scholar]
  16. He, K.; Zhang, X.; Ren, S.; Sun, J. Deep residual learning for image recognition. In Proceedings of the Conference on Computer Vision and Pattern Recognition (CVPR 2016), Las Vegas, NV, USA, 27 June 2016; pp. 770–778. [Google Scholar]
  17. Ioffe, S.; Szegedy, C. Batch normalization: Accelerating deep network training by reducing internal covariate shift. In Proceedings of the 32nd International Conference on Machine Learning (ICML 2015), Lille, France, 6 July 2015; pp. 448–456. [Google Scholar]
  18. Srivastava, N.; Hinton, G.; Krizhevsky, A.; Sutskever, I.; Salakhutdinov, R. Dropout: A simple way to prevent neural networks from overfitting. J. Mach. Learn. Res. 2014, 15, 1929–1958. [Google Scholar]
  19. Russakovsky, O.; Deng, J.; Su, H.; Krause, J.; Satheesh, S.; Ma, S.; Huang, Z.; Karpathy, A.; Khosla, A.; Bernstein, M.; et al. ImageNet large scale visual recognition challenge. Int. J. Comput. Vis. 2015, 115, 211–252. [Google Scholar] [CrossRef] [Green Version]
  20. He, K.; Zhang, X.; Ren, S.; Sun, J. Delving deep into rectifiers: Surpassing human-level performance on ImageNet classification. In Proceedings of the International Conference on Computer Vision (ICCV 2015), Santiago, Chile, 7 December 2015; pp. 1026–1034. [Google Scholar]
  21. Kingma, D.P.; Ba, J. Adam: A method for stochastic optimization. In Proceedings of the International Conference on Learning Representations (ICLR 2015), San Diego, CA, USA, 7–9 May 2015. [Google Scholar]
  22. Hannun, A.Y.; Rajpurkar, P.; Haghpanahi, M.; Tison, G.H.; Bourn, C.; Turakhia, M.P.; Ng, A.Y. Cardiologist-level arrhythmia detection and classification in ambulatory electrocardiograms using a deep neural network. Nat. Med. 2019, 25, 65–69. [Google Scholar] [CrossRef] [PubMed]
Figure 1. Example ECG segments with different NYHA classifications. (a) ECG segment with NYHA class I, (b) ECG segment with NYHA class II, (c) ECG segment with NYHA class III, (d) ECG segment with NYHA class IV.
Symmetry 12 02019 g001
Figure 2. The data distribution details for the training set, validation set and test set.
Symmetry 12 02019 g002
Figure 3. The architecture of the ResNet.
Symmetry 12 02019 g003
Figure 4. The architectures of the residual block. (a) The residual block proposed by He et al. [16], (b) The architecture of our proposed multi-scale residual block.
Symmetry 12 02019 g004
Figure 5. The architecture of the proposed multi-scale ResNet-34.
Symmetry 12 02019 g005
Figure 6. The validation results of our proposed multi-scale ResNets. (a) The validation results for Set I, (b) The validation results for Set II.
Symmetry 12 02019 g006
Table 1. Overview of the data used in this work.
TypeNo. of PatientsProportion
NYHA Class I9712.70%
NYHA Class II19325.26%
NYHA Class III31140.70%
NYHA Class IV16321.34%
Total764100%
NYHA: New York Heart Association.
Table 2. Distribution of the ECG segments used in this work.
Segment LengthDatasetNo. of ECG Segments with Different NYHA ClassificationsTotal
NYHA Class INYHA Class IINYHA Class IIINYHA Class IV
Two seconds (Set I)Training set930018,60029,85015,60073,350
Validation set240046507500405018,600
Test set285057009300480022,650
Five seconds (Set II)Training set3720744011,940624029,340
Validation set9601860300016207440
Test set11402280372019209060
NYHA: New York Heart Association.
Table 3. Parameter details of our proposed multi-scale ResNet-34.
TypeNo. of FiltersKernel SizeStrideOutput Shapes
Set ISet II
Input---500 × 11250 × 1
Convolution416 × 11485 × 41235 × 1
Batch Normalization---485 × 41235 × 1
Max Pooling-2 × 12242 × 4617 × 4
MSRB 1Left Channel 416 × 11242 × 4617 × 4
Right Channel48 × 11242 × 4617 × 4
Filter Concatenation---242 × 8617 × 8
MSRB 2Left Channel 816 × 11242 × 8617 × 8
Right Channel88 × 11242 × 8617 × 8
Filter Concatenation---242 × 16617 × 16
Max Pooling-2 × 12121 × 16308 × 16
MSRB 3Left Channel 1616 × 11121 × 16308 × 16
Right Channel168 × 11121 × 16308 × 16
Filter Concatenation---121 × 32308 × 32
MSRB 4Left Channel 3216 × 11121 × 32308 × 32
Right Channel328 × 11121 × 32308 × 32
Filter Concatenation---121 × 64308 × 64
Max Pooling-2 × 1260 × 64154 × 64
MSRB 5Left Channel 648 × 1160 × 64154 × 64
Right Channel644 × 1160 × 64154 × 64
Filter Concatenation---60 × 128154 × 128
MSRB 6Left Channel 1288 × 1160 × 128154 × 128
Right Channel1284 × 1160 × 128154 × 128
Filter Concatenation---60 × 256154 × 256
Max Pooling-2 × 1230 × 25677 × 256
MSRB 7Left Channel 2568 × 1130 × 25677 × 256
Right Channel2564 × 1130 × 25677 × 256
Filter Concatenation---30 × 51277 × 512
MSRB 8Left Channel 5128 × 1130 × 51277 × 512
Right Channel5124 × 1130 × 51277 × 512
Filter Concatenation---30 × 102477 × 1024
Average Pooling---1024 × 11024 × 1
Fully Connected Layer---44
MSRB: multi-scale residual block.
Table 4. The test results of multi-scale ResNet-34 for Set I.
Predicted LabelPPV (%)Sen (%)Acc (%)
NYHA Class INYHA Class IINYHA Class IIINYHA Class IV
True labelNYHA Class I264292754194.4692.7093.60
NYHA Class II39523825217193.2991.89
NYHA Class III87219876323194.8694.23
NYHA Class IV2966148455791.1494.94
NYHA: New York Heart Association, PPV: positive predictive value, Sen: sensitivity, Acc: accuracy.
Table 5. The test results of multi-scale ResNet-34 for Set II.
Predicted LabelPPV (%)Sen (%)Acc (%)
NYHA Class INYHA Class IINYHA Class IIINYHA Class IV
True labelNYHA Class I102933572193.9790.2694.29
NYHA Class II172163841694.3794.87
NYHA Class III466735188994.7294.57
NYHA Class IV32955183393.5995.47
NYHA: New York Heart Association, PPV: positive predictive value, Sen: sensitivity, Acc: accuracy.
Table 6. The overall average performance of the models.
ModelSegment LengthPPV (%)Sen (%)Acc (%)
11-layer CNN [5]2 s87.4786.2987.81
5 s88.9489.4189.72
ResNet-34 [22]2 s91.6491.1991.77
5 s92.0092.9392.50
Multi-scale ResNet-182 s90.4690.1490.65
5 s91.1792.0391.88
Multi-scale ResNet-262 s91.1991.0591.40
5 s91.4292.3392.19
Multi-scale ResNet-342 s93.4993.4493.60
5 s94.1693.7994.29
PPV: positive predictive value, Sen: sensitivity, Acc: accuracy.
Table 7. The average performance of the two doctors and our proposed method.
PPV (%)Sen (%)Acc (%)
Doctors92.2494.8393.38
Our methods94.1693.7994.29
PPV: positive predictive value, Sen: sensitivity, Acc: accuracy.
Publisher’s Note: MDPI stays neutral with regard to jurisdictional claims in published maps and institutional affiliations.

