Figure 1.
Polylactic acid (PLA) granules and Filament.
Figure 1.
Polylactic acid (PLA) granules and Filament.
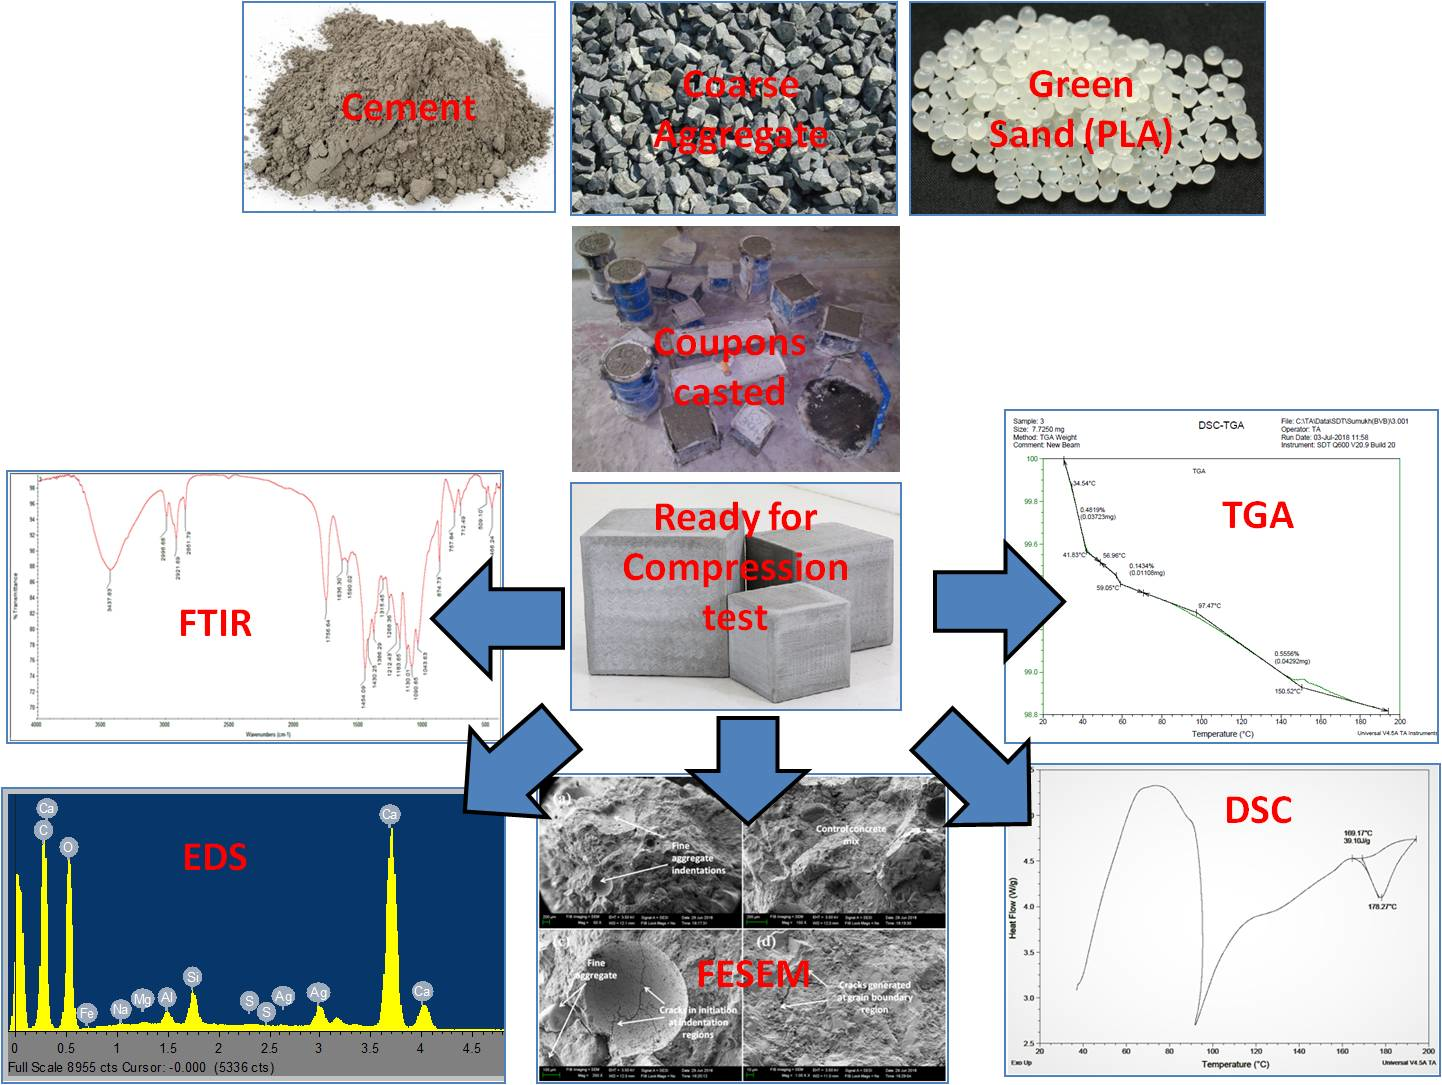
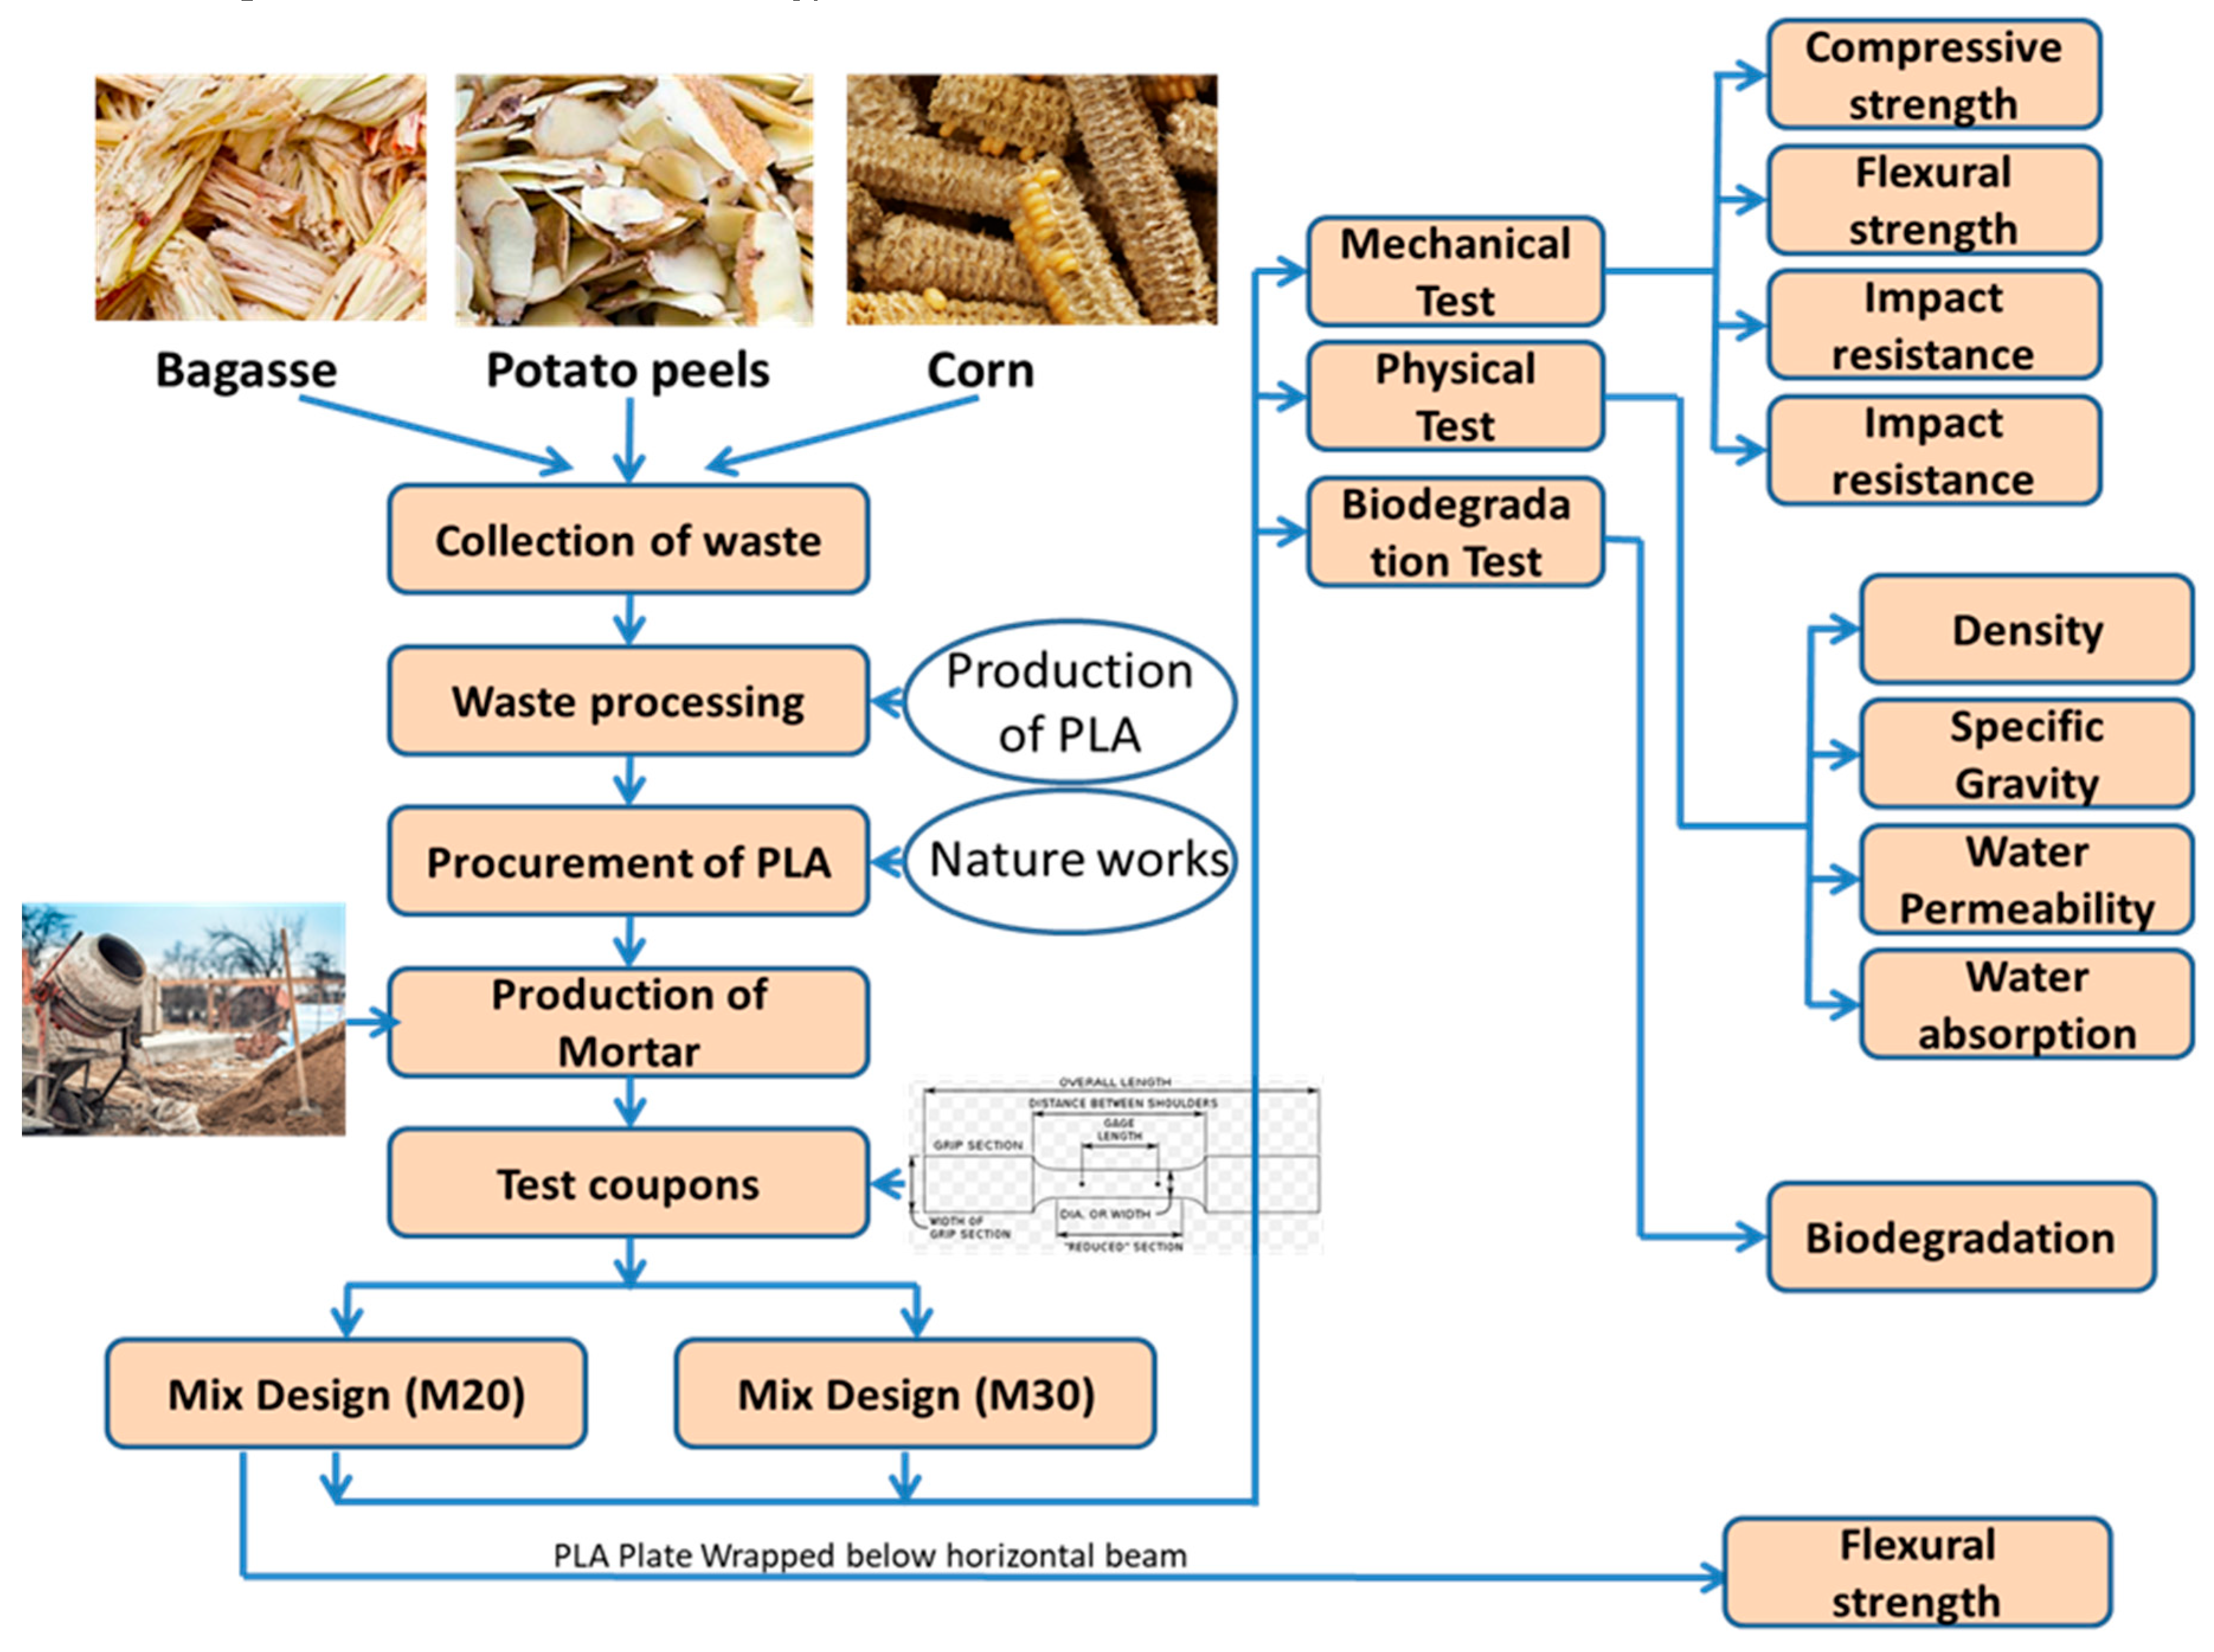
Figure 2.
Process mapping of entire work with Scheme of Methodology.
Figure 2.
Process mapping of entire work with Scheme of Methodology.
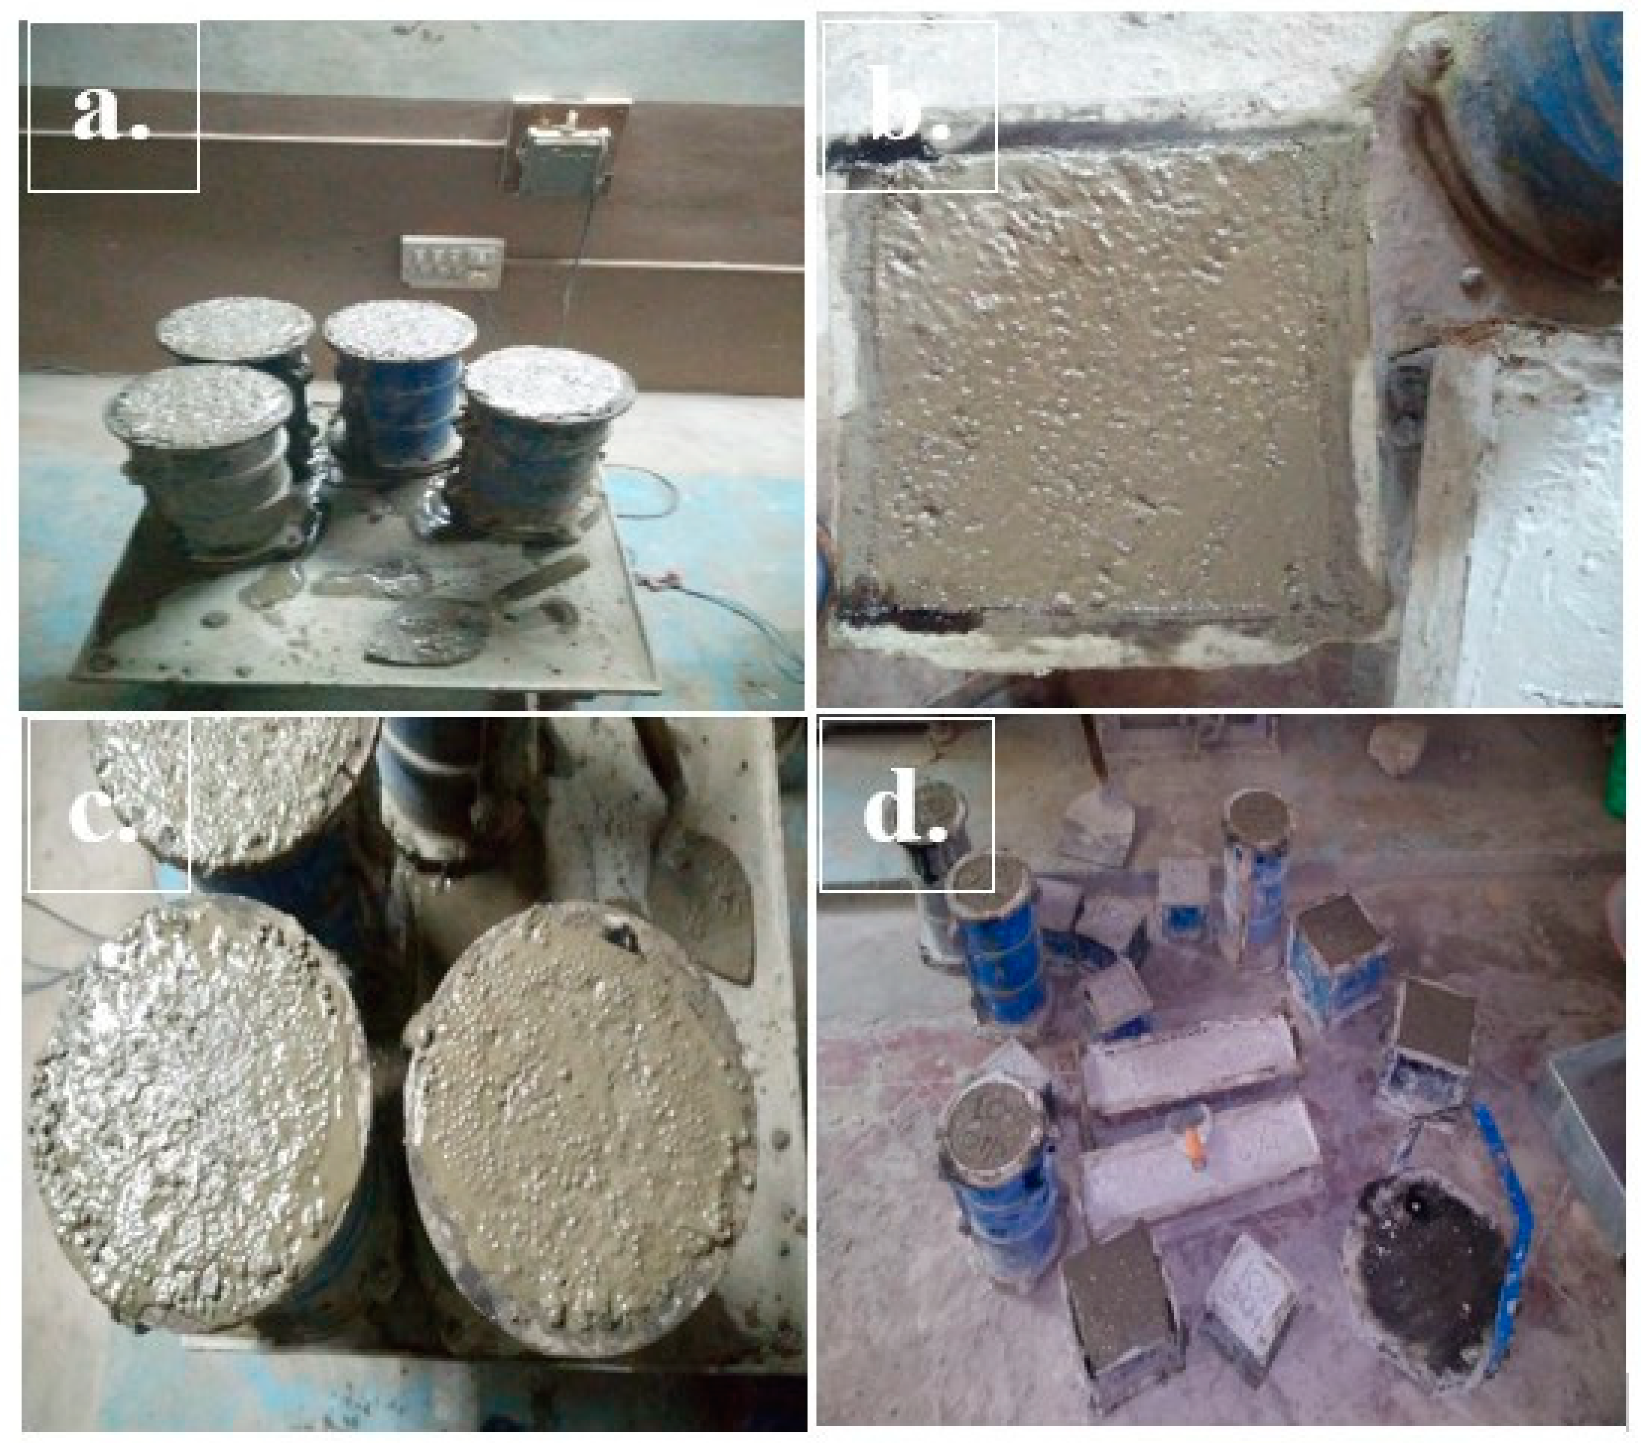
Figure 3.
(a) Specimen compaction, (b). casted cube, (c) PLA used coupons, (d) casted coupons.
Figure 3.
(a) Specimen compaction, (b). casted cube, (c) PLA used coupons, (d) casted coupons.
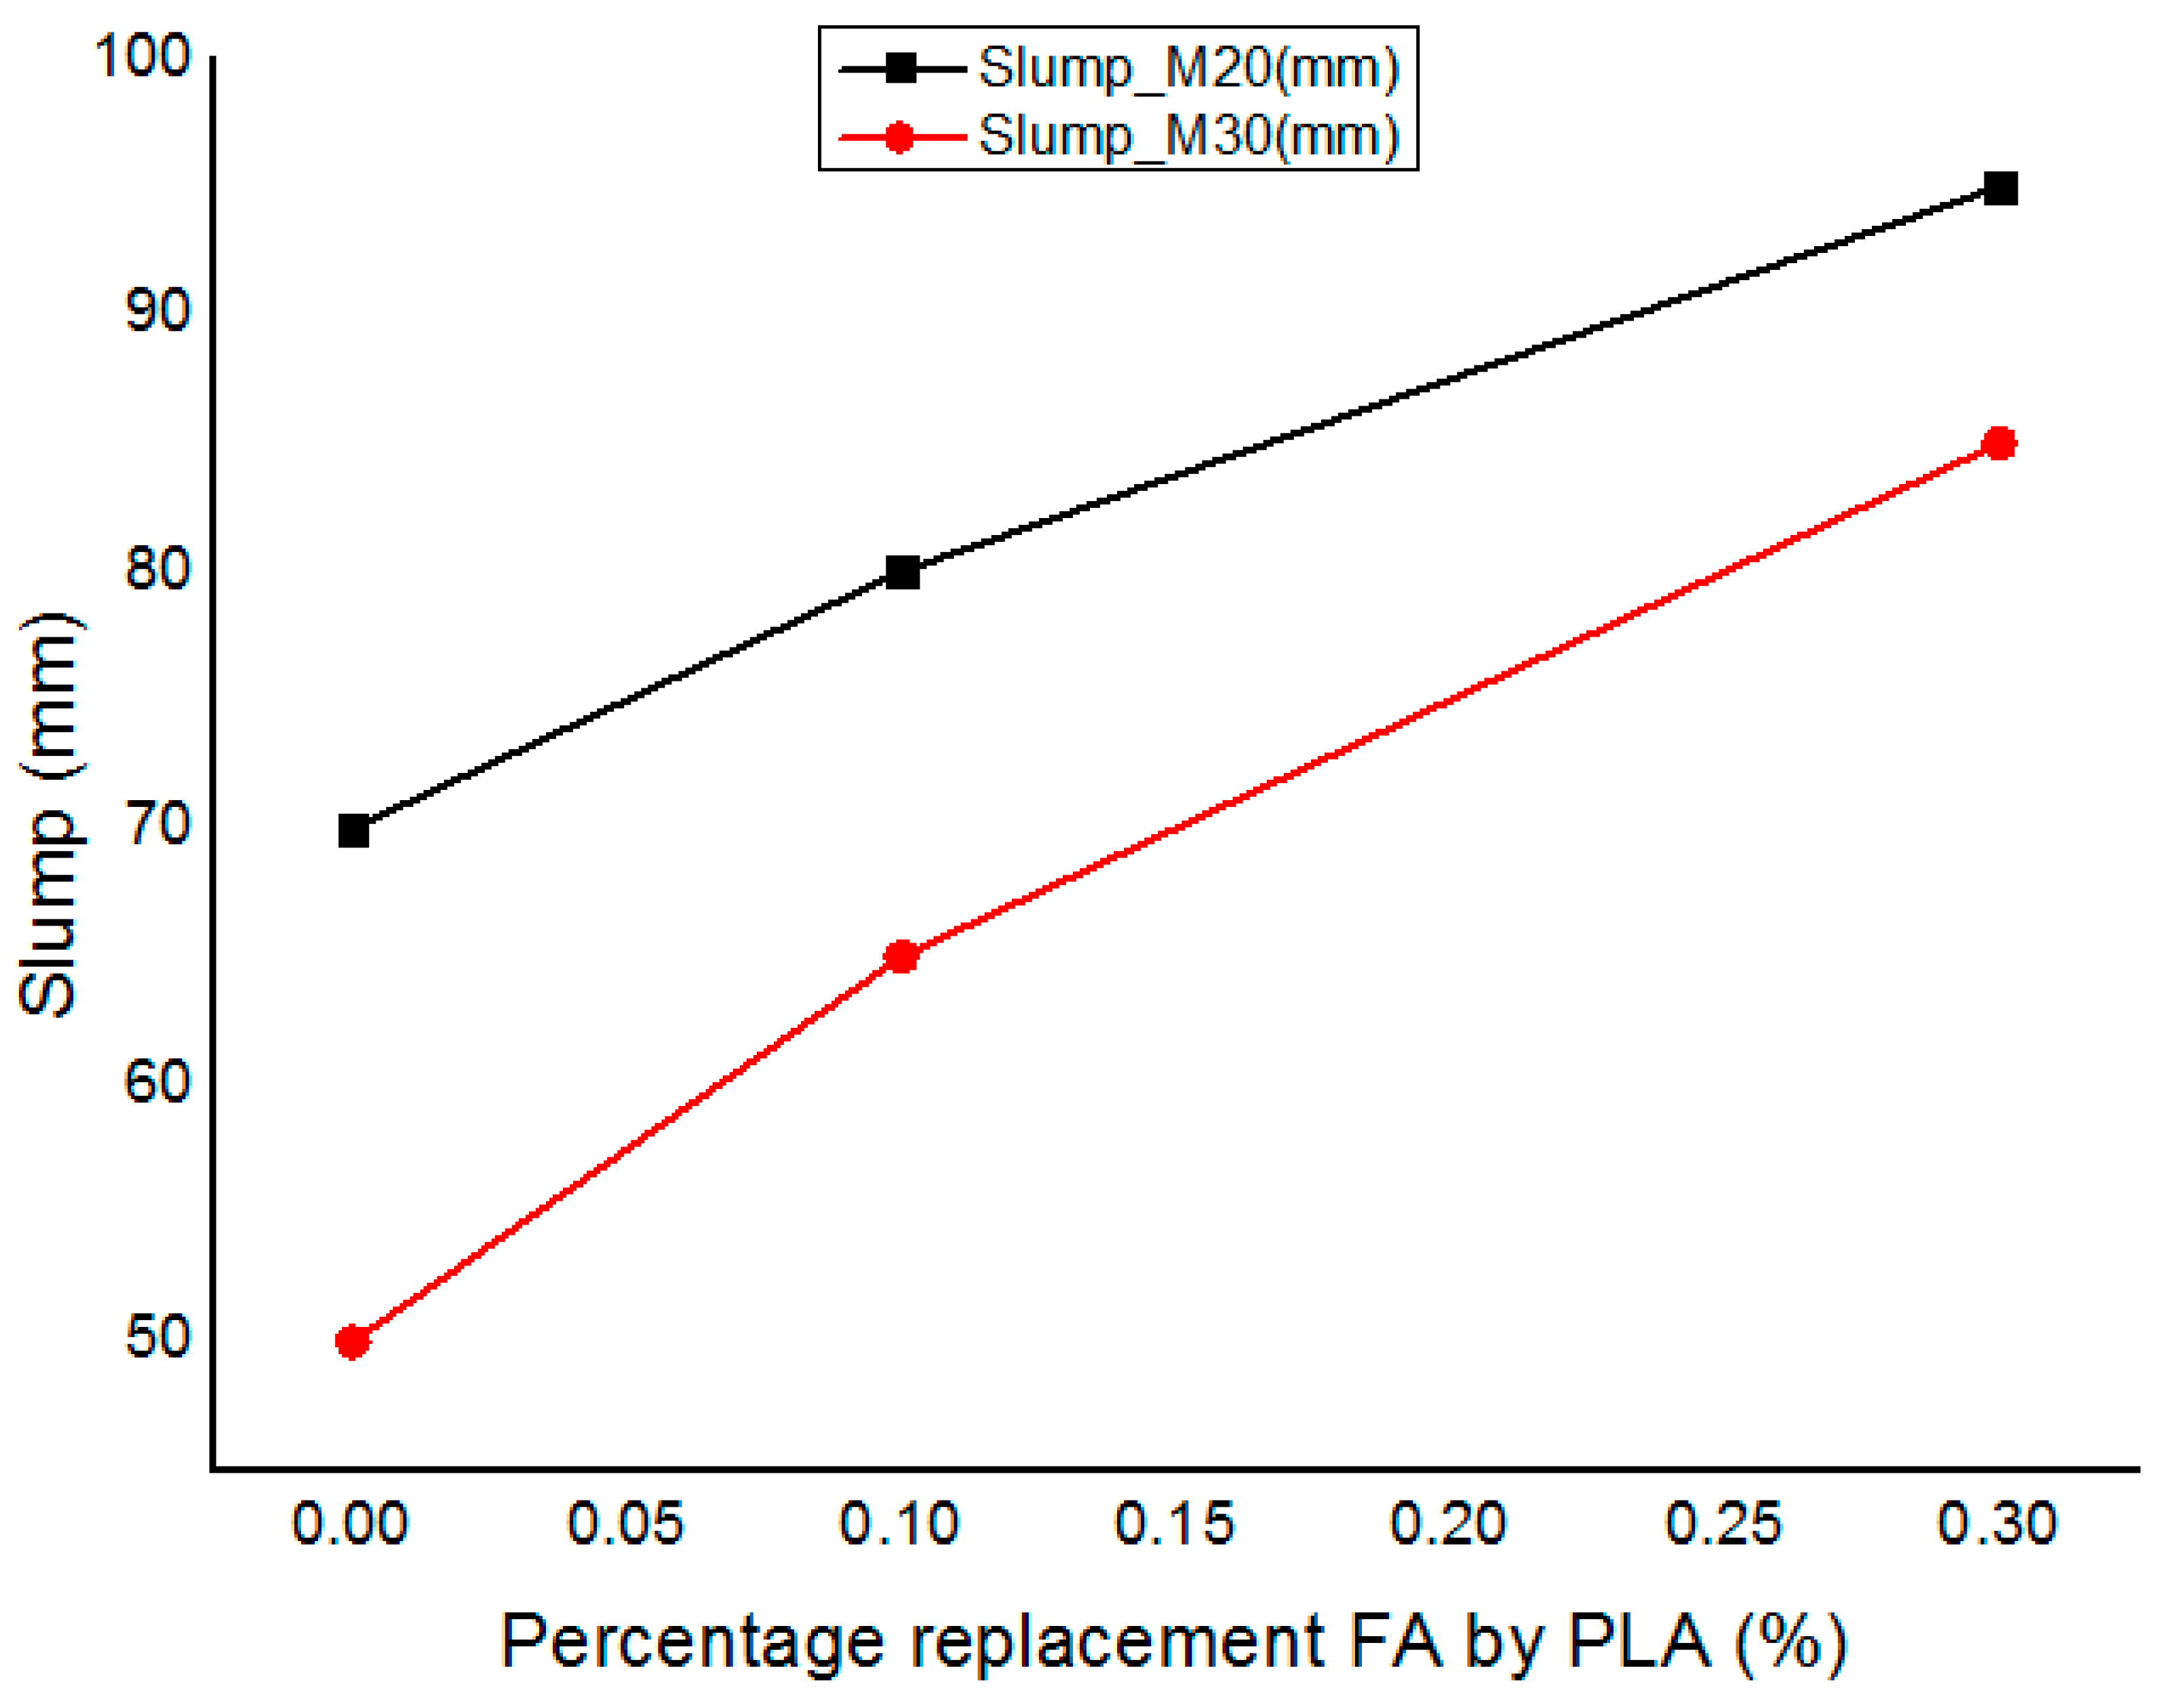
Figure 4.
Slump test for M20 and M30 grade.
Figure 4.
Slump test for M20 and M30 grade.
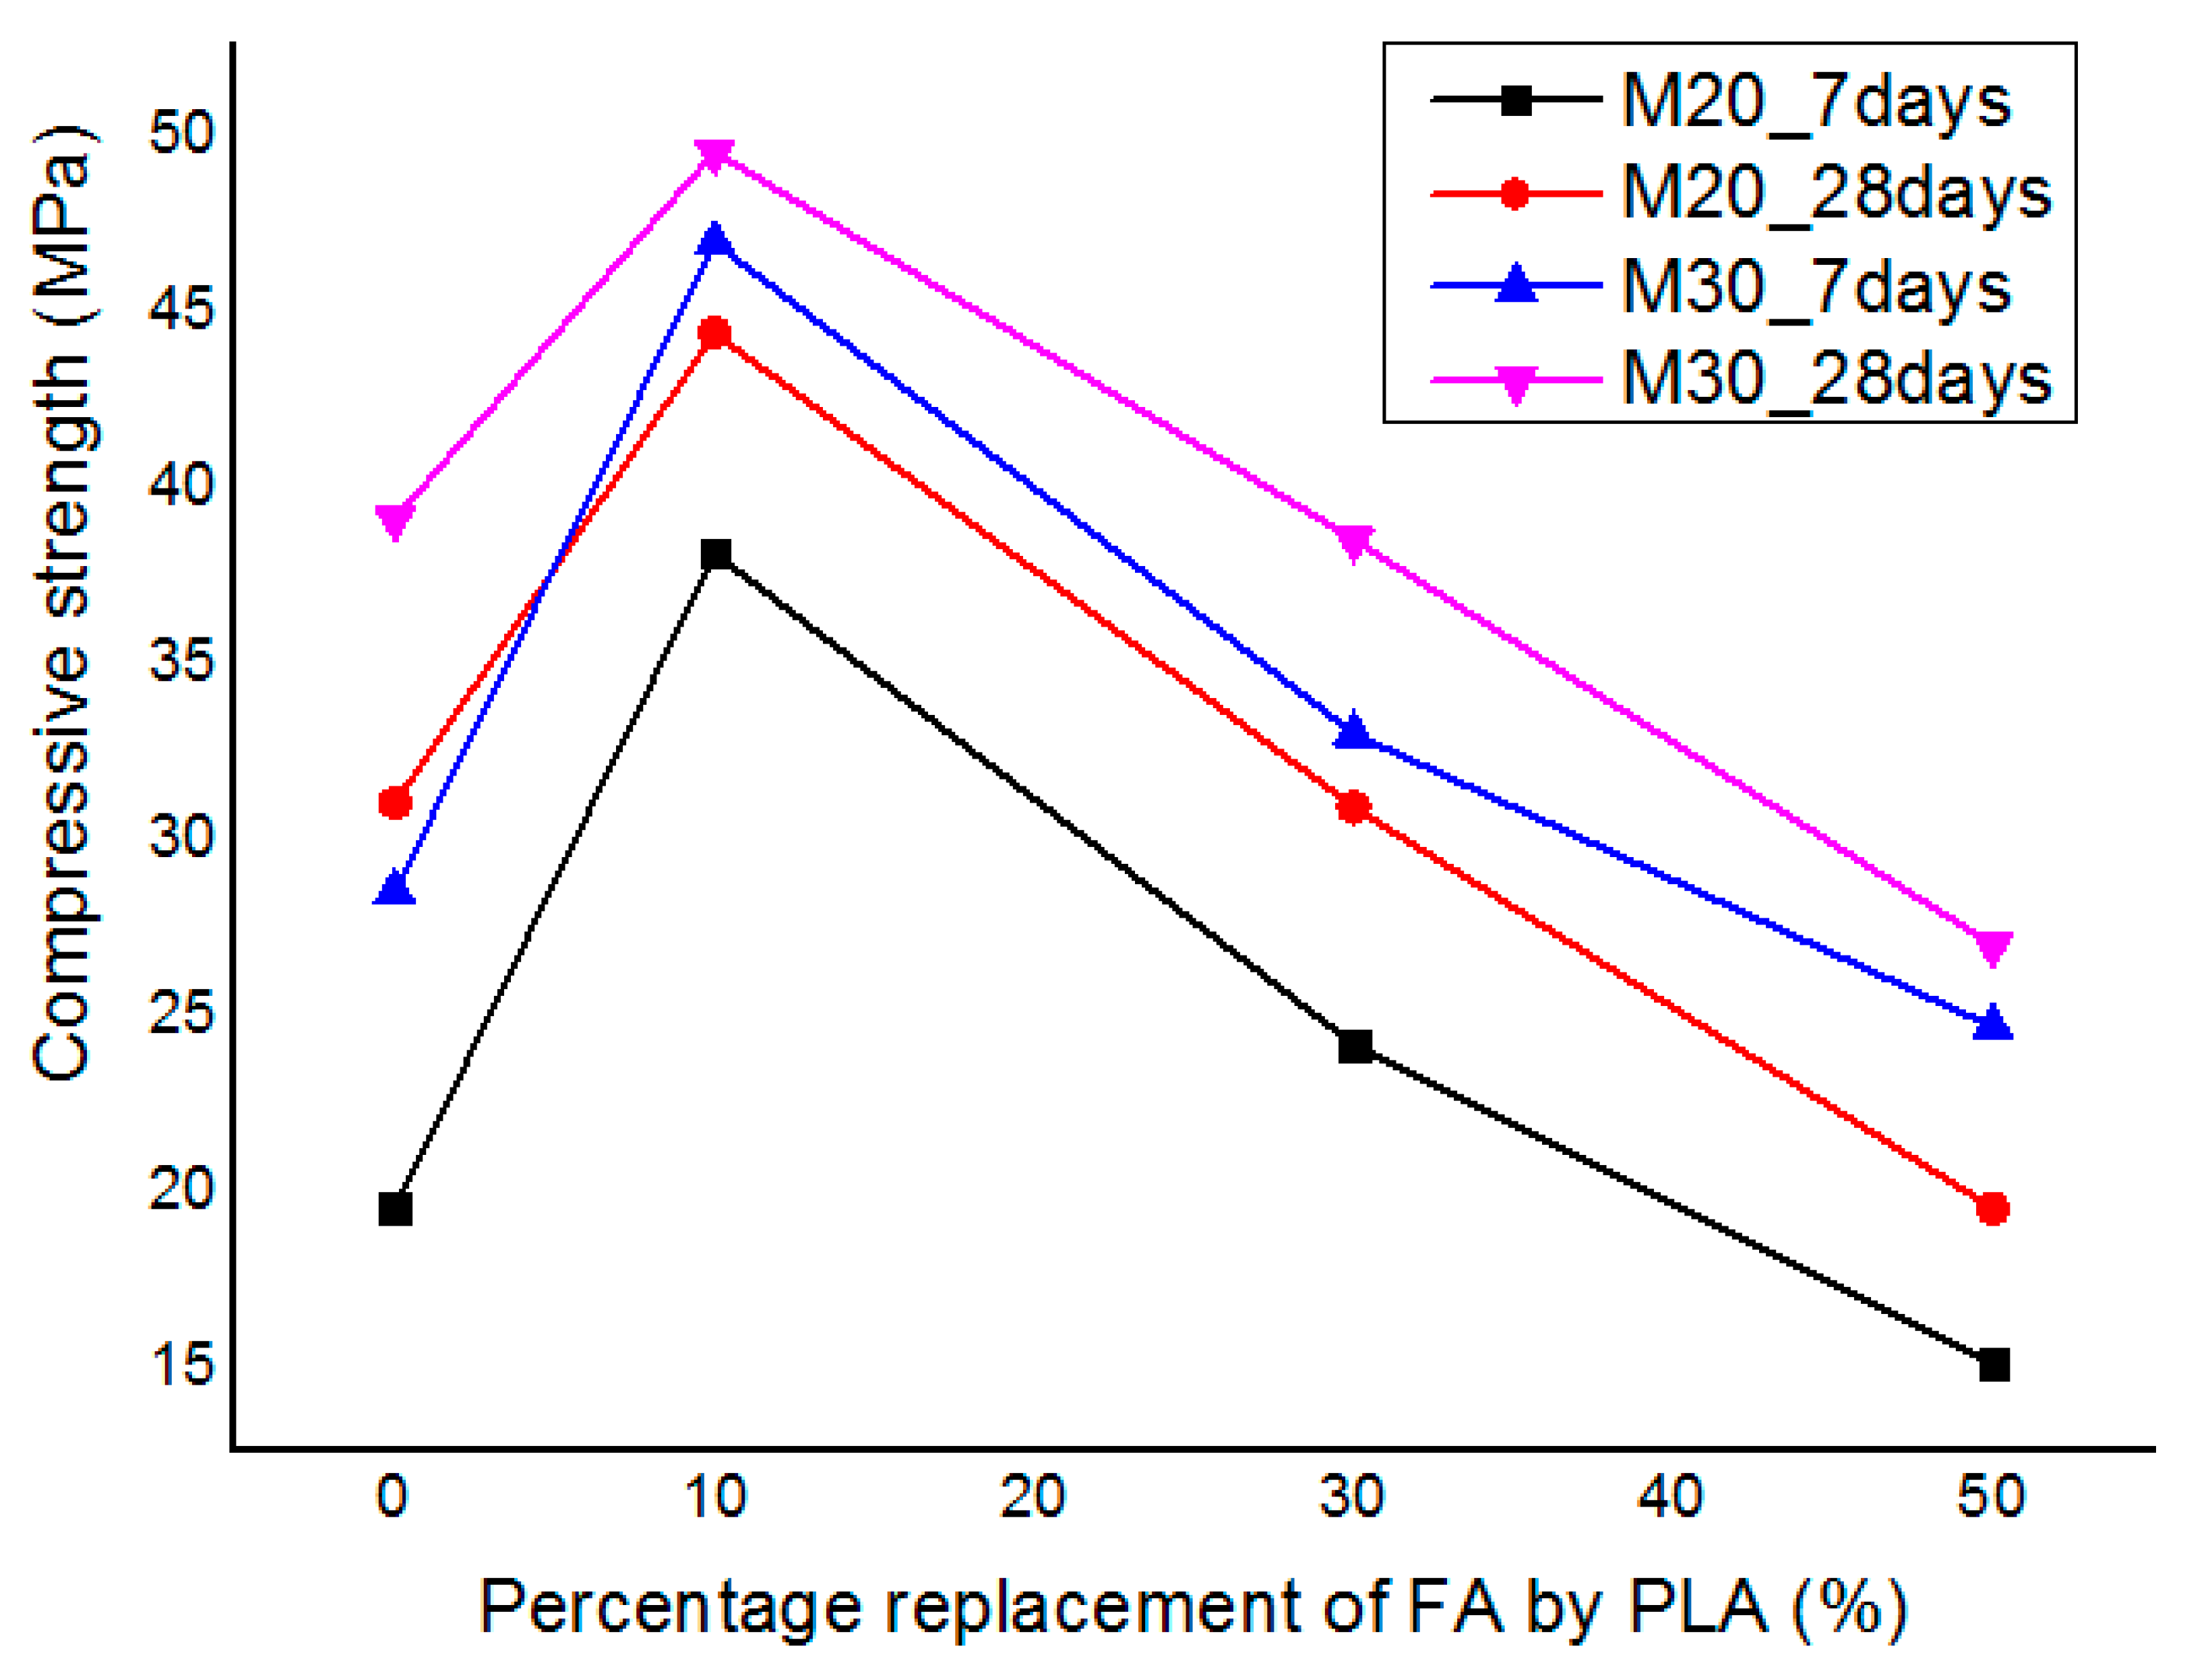
Figure 5.
Compressive strength test for M20 and M30 grade for 7/28 days curing.
Figure 5.
Compressive strength test for M20 and M30 grade for 7/28 days curing.
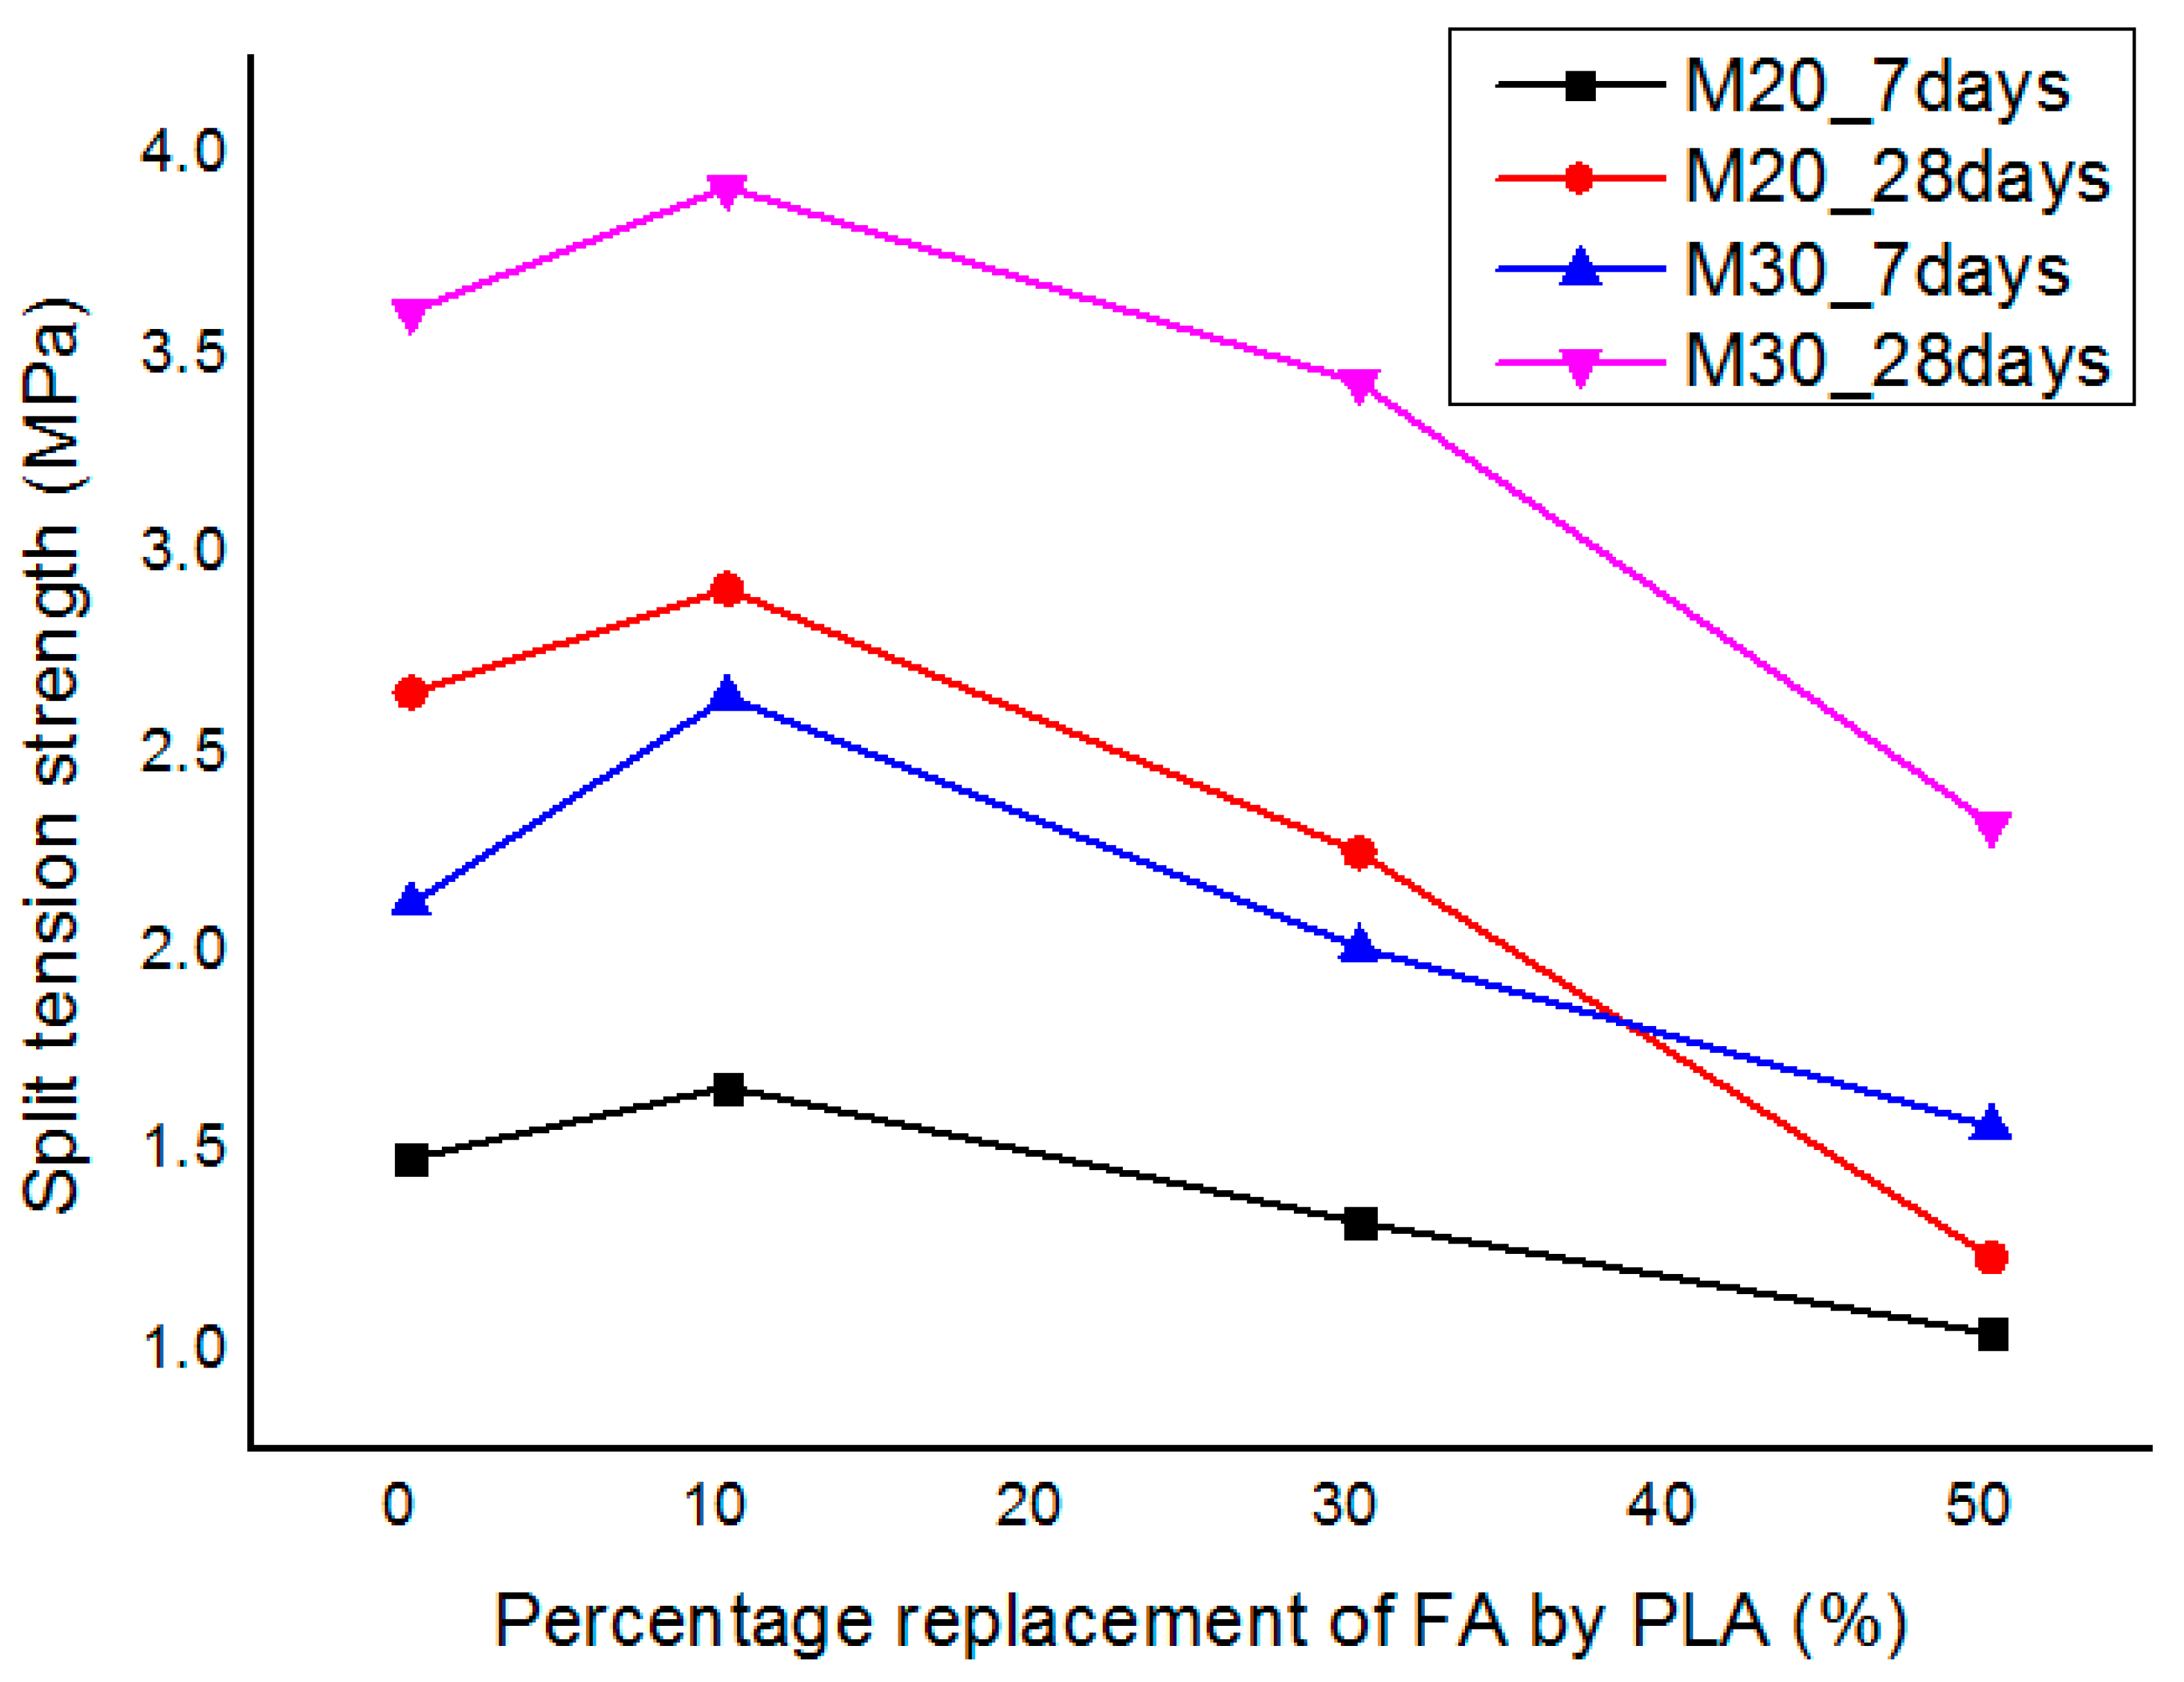
Figure 6.
Split tensile strength test results for M20 and M30.
Figure 6.
Split tensile strength test results for M20 and M30.
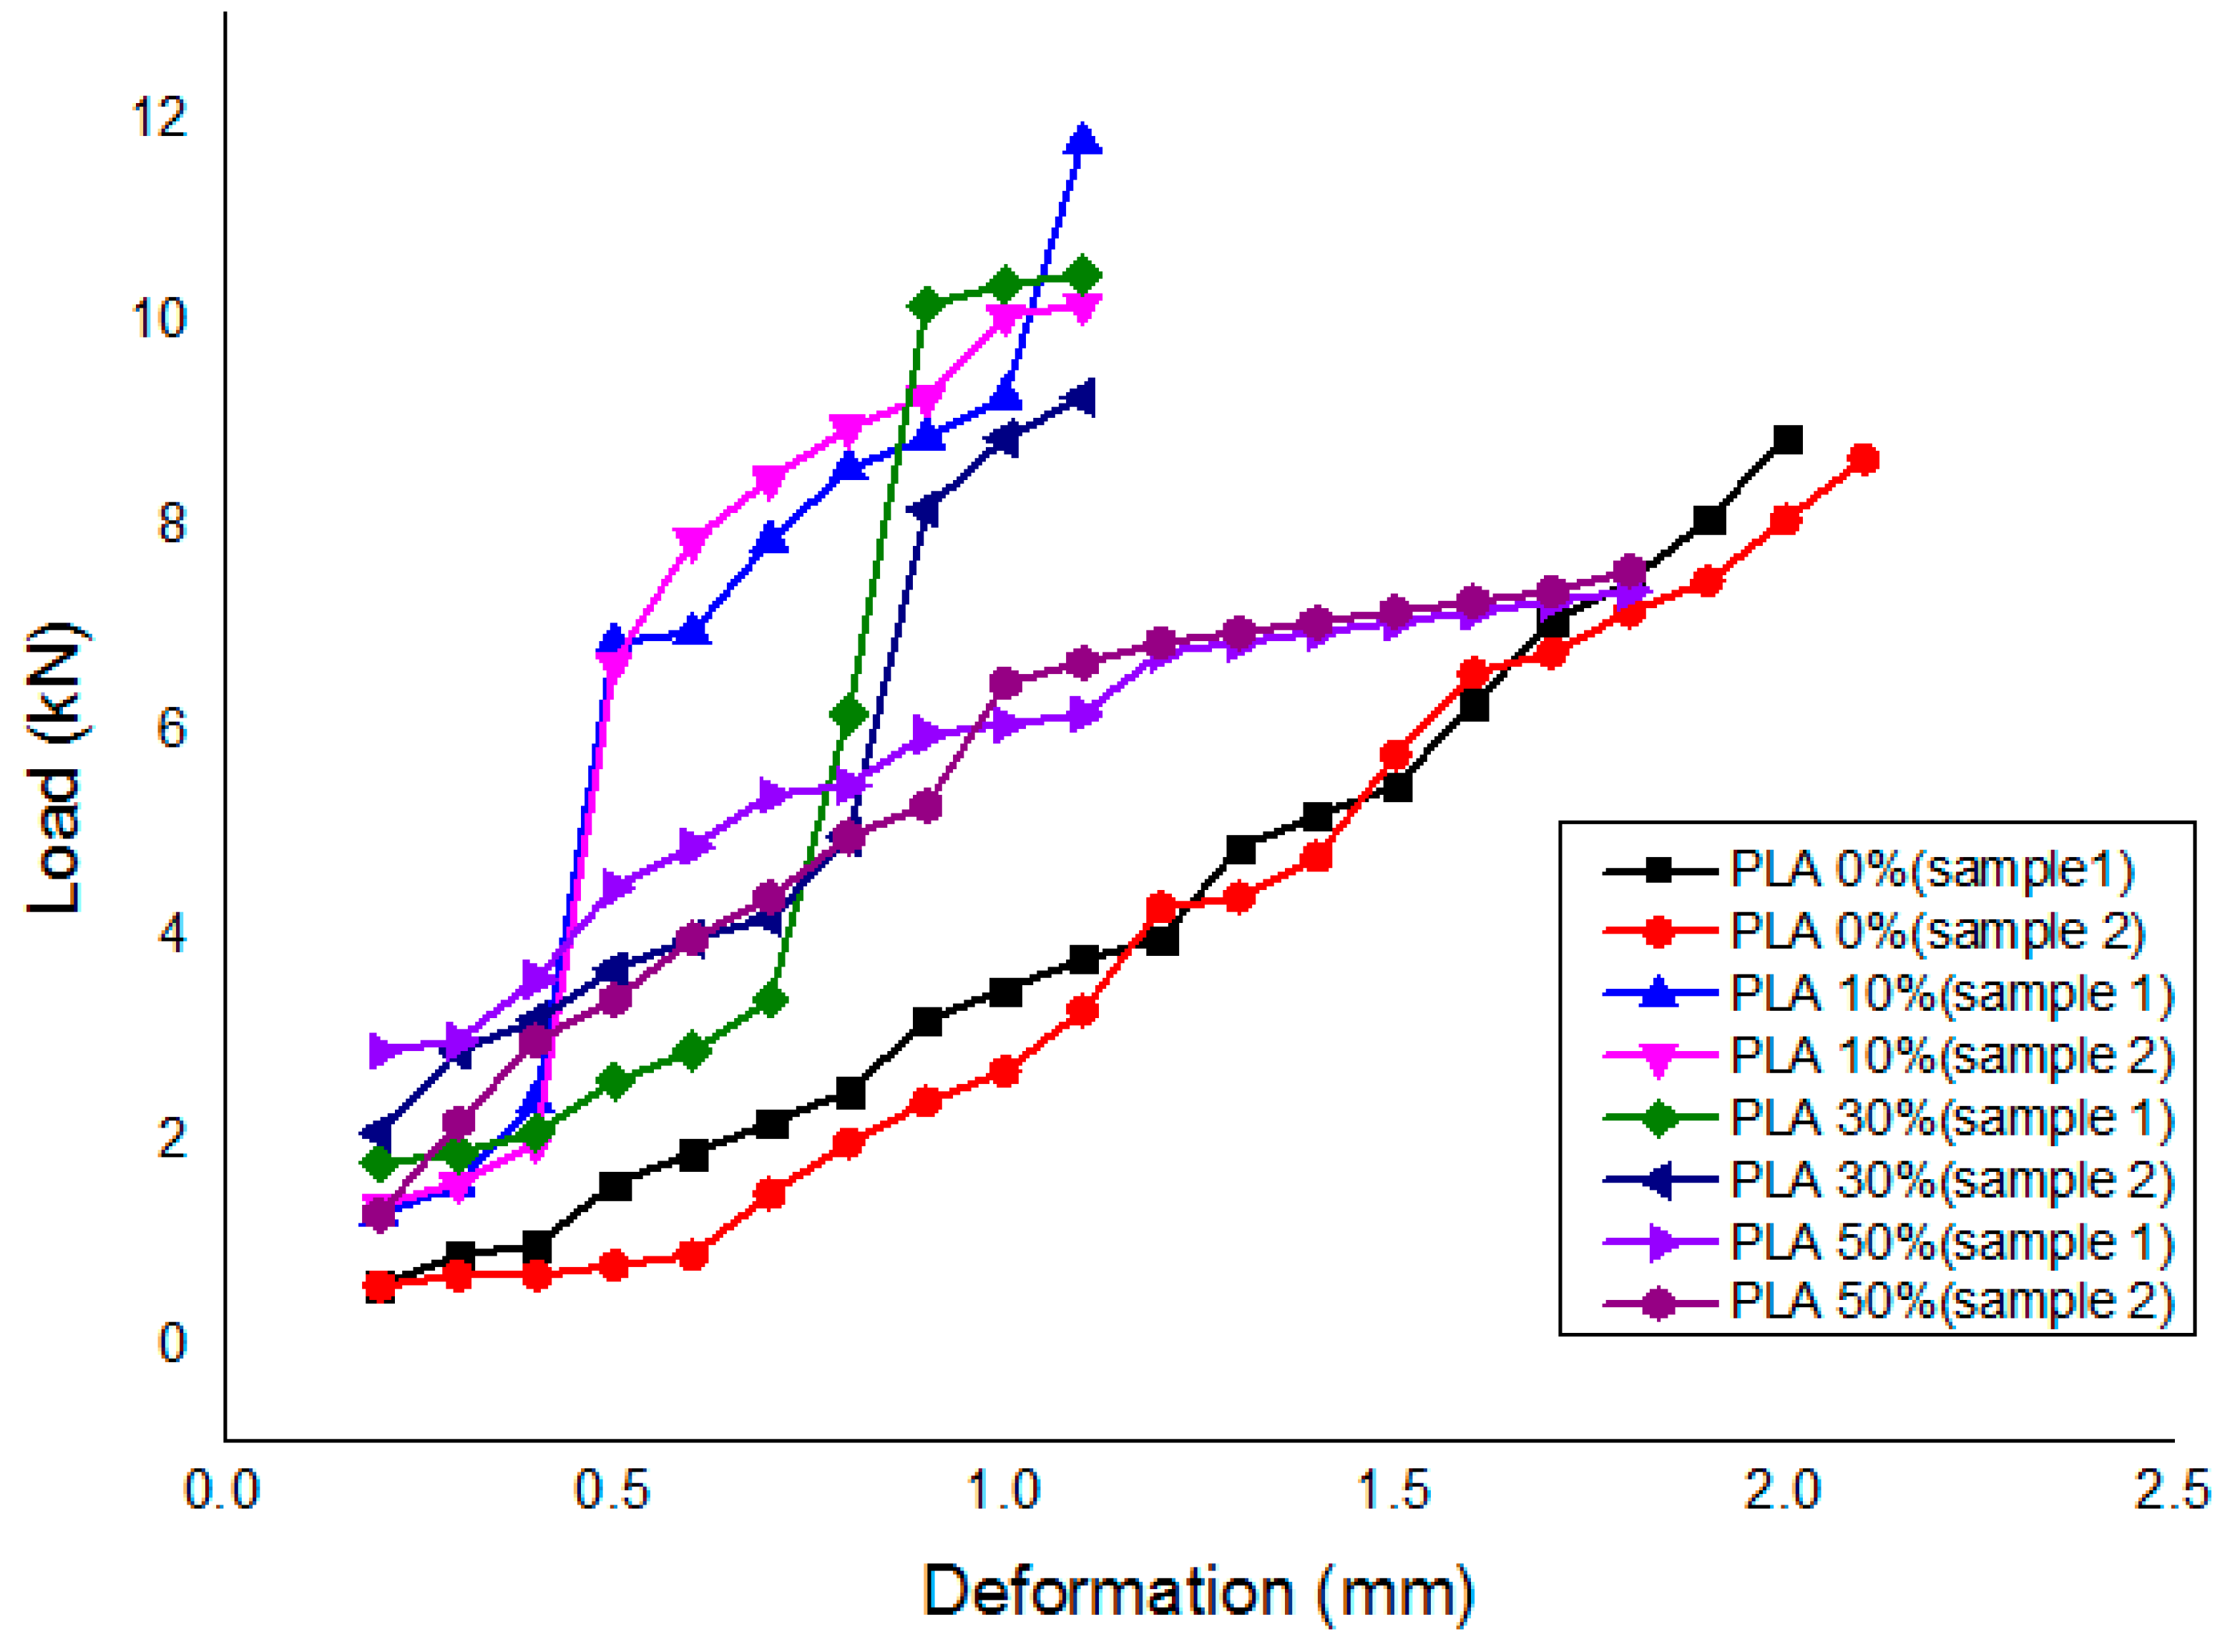
Figure 7.
Flexural strength test M20 grade for all cases.
Figure 7.
Flexural strength test M20 grade for all cases.
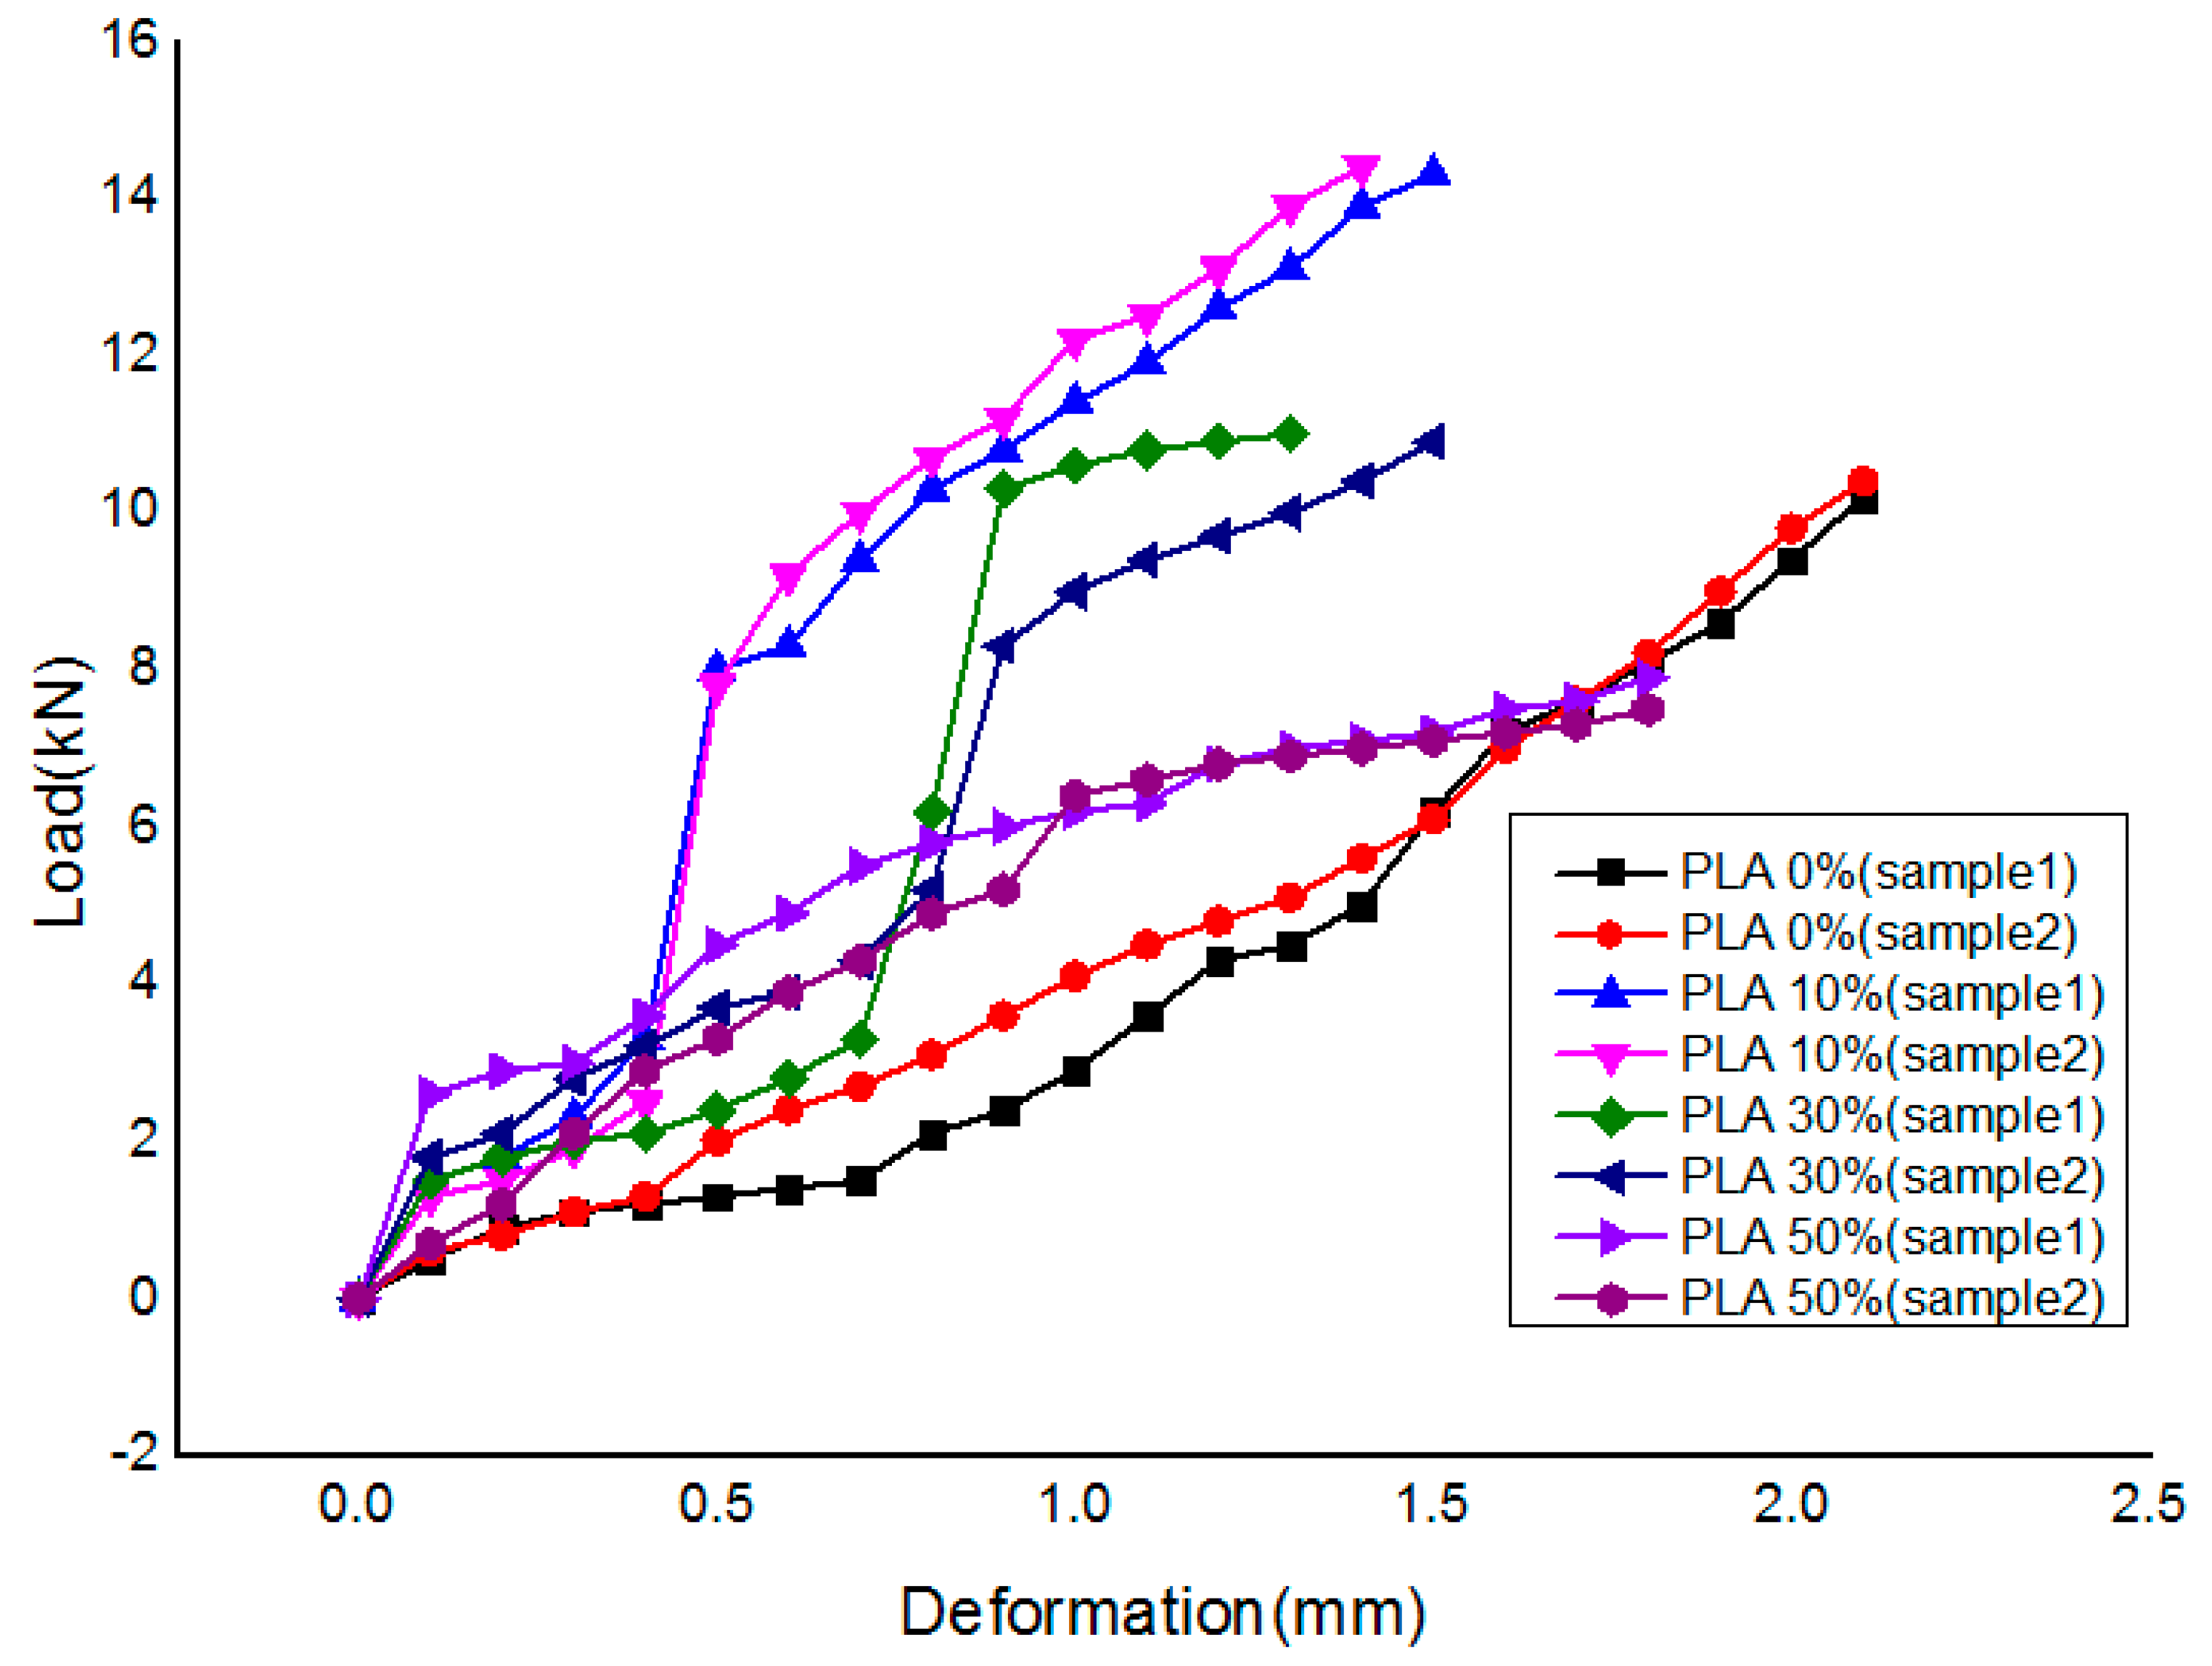
Figure 8.
Flexural strength test M30 grade for all cases.
Figure 8.
Flexural strength test M30 grade for all cases.
Figure 9.
Flexural strength test with percentage replacement of fine aggregate by PLA.
Figure 9.
Flexural strength test with percentage replacement of fine aggregate by PLA.
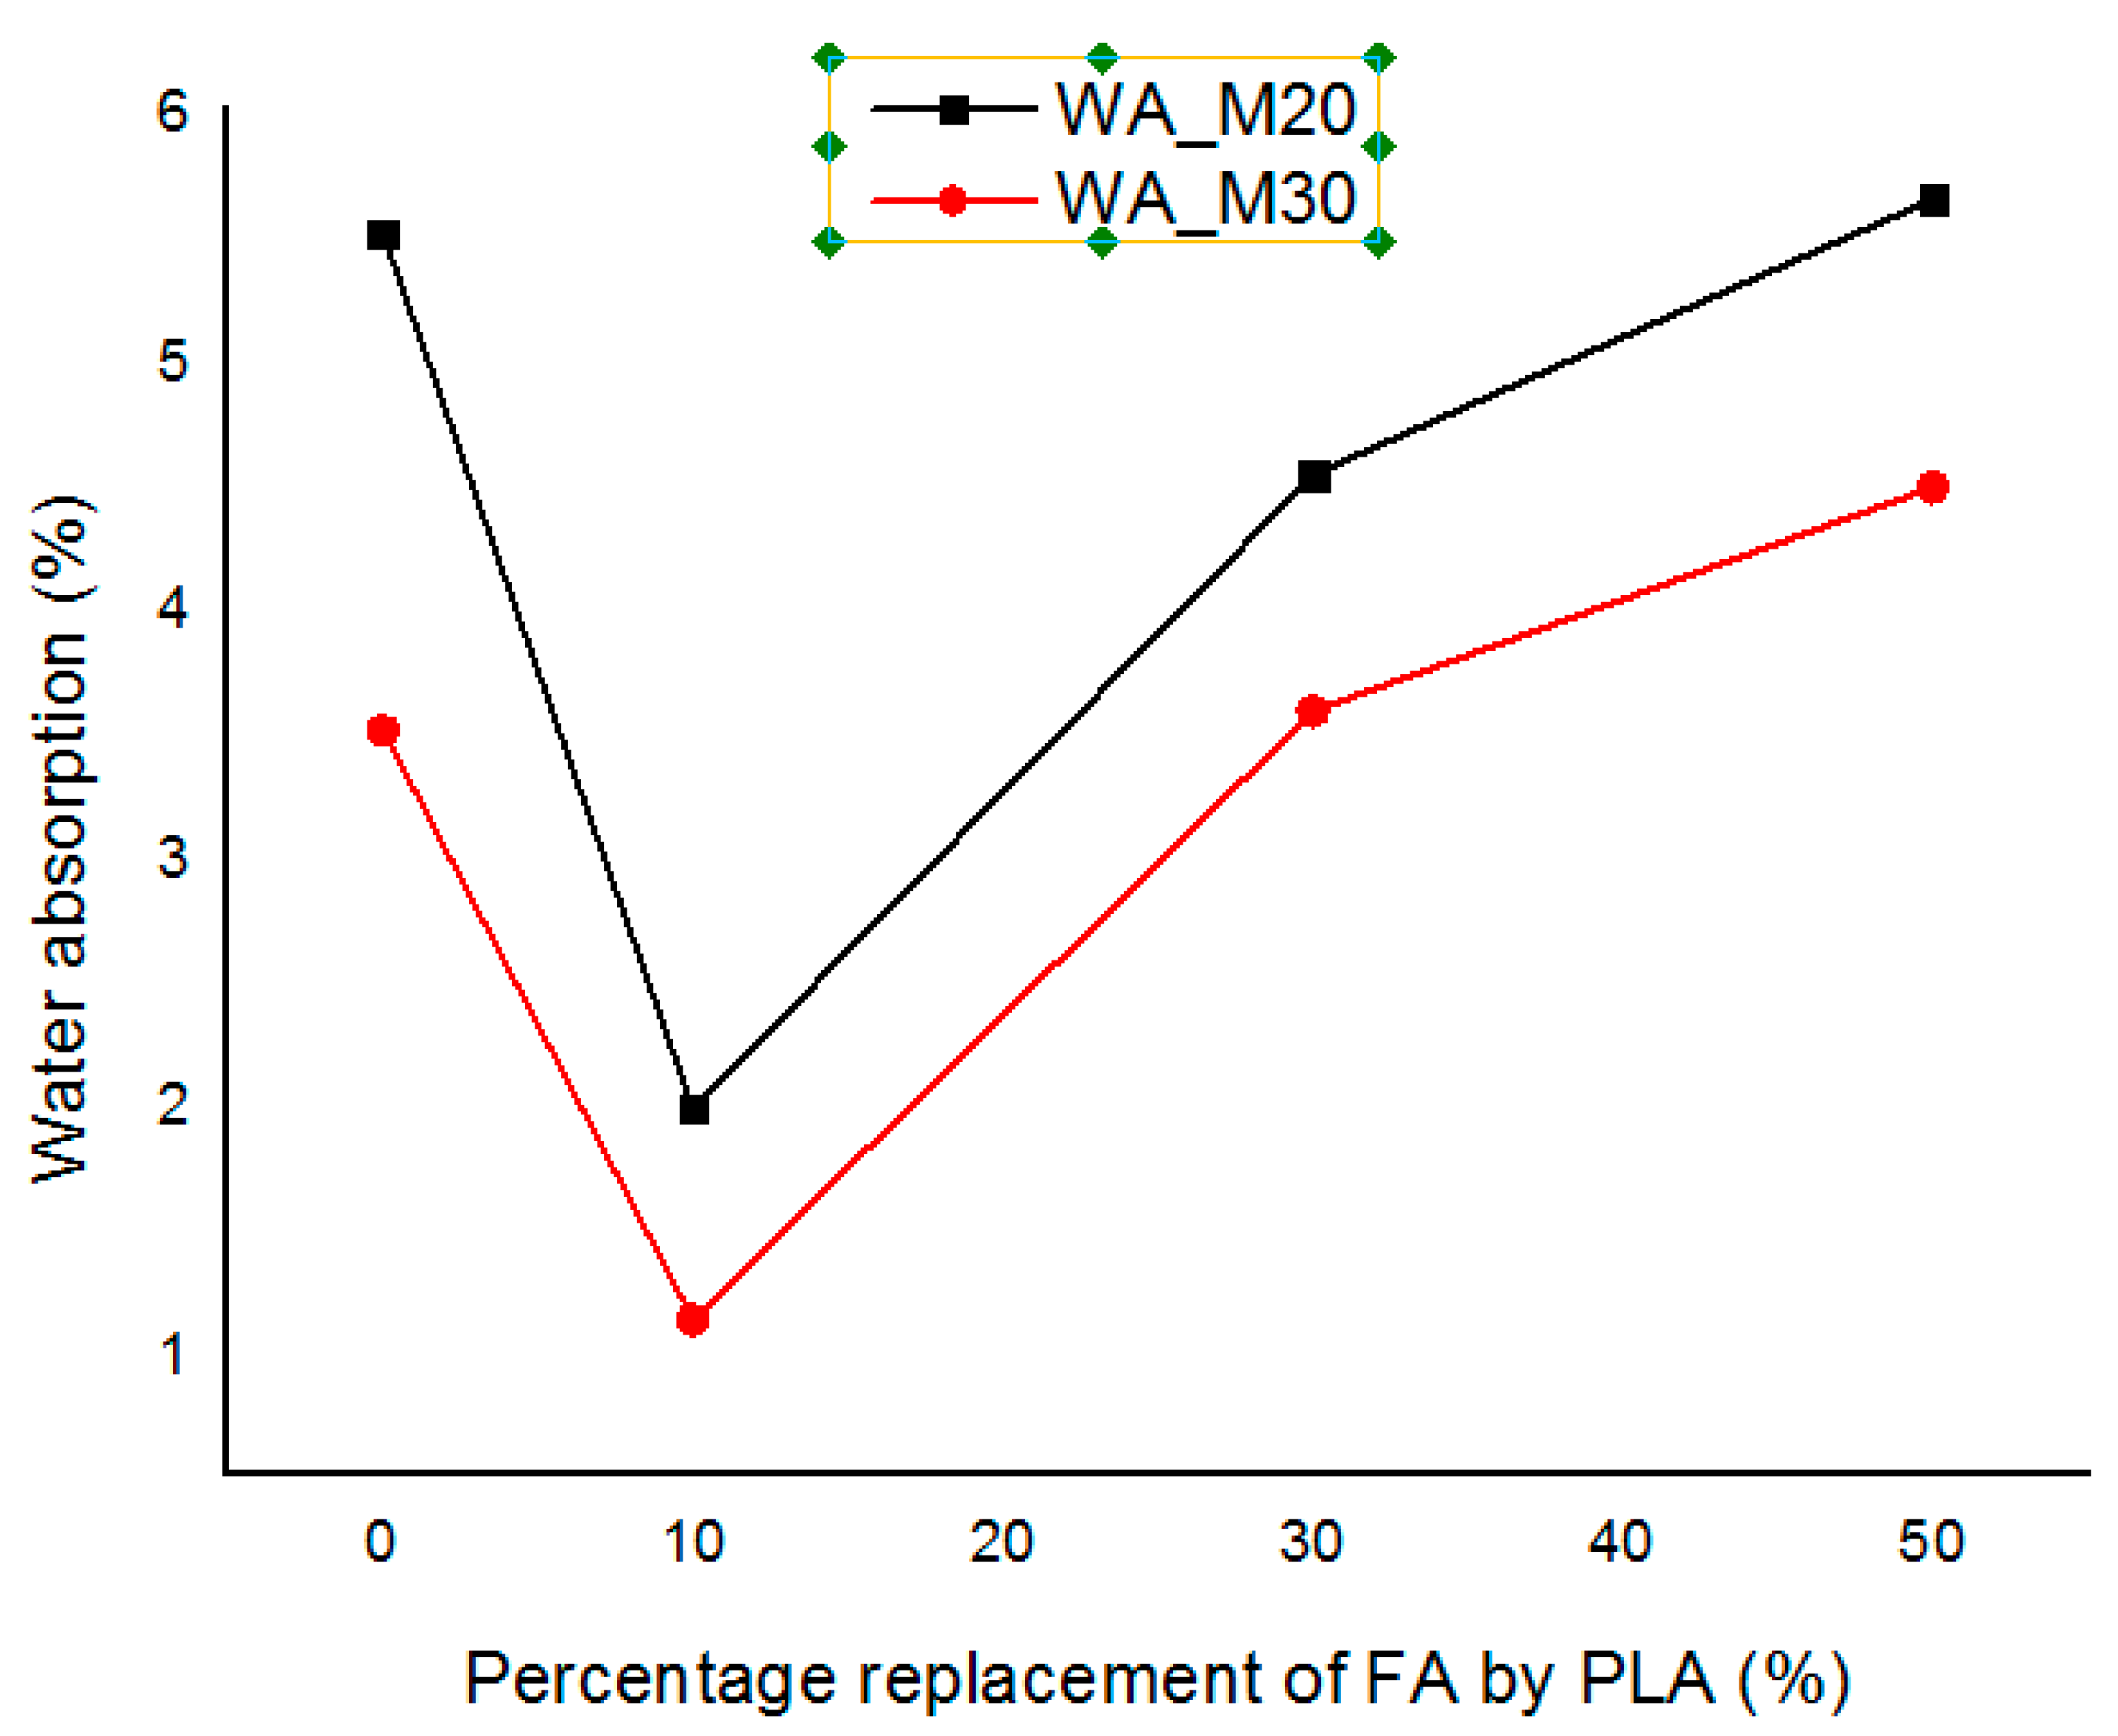
Figure 10.
Water absorption test.
Figure 10.
Water absorption test.
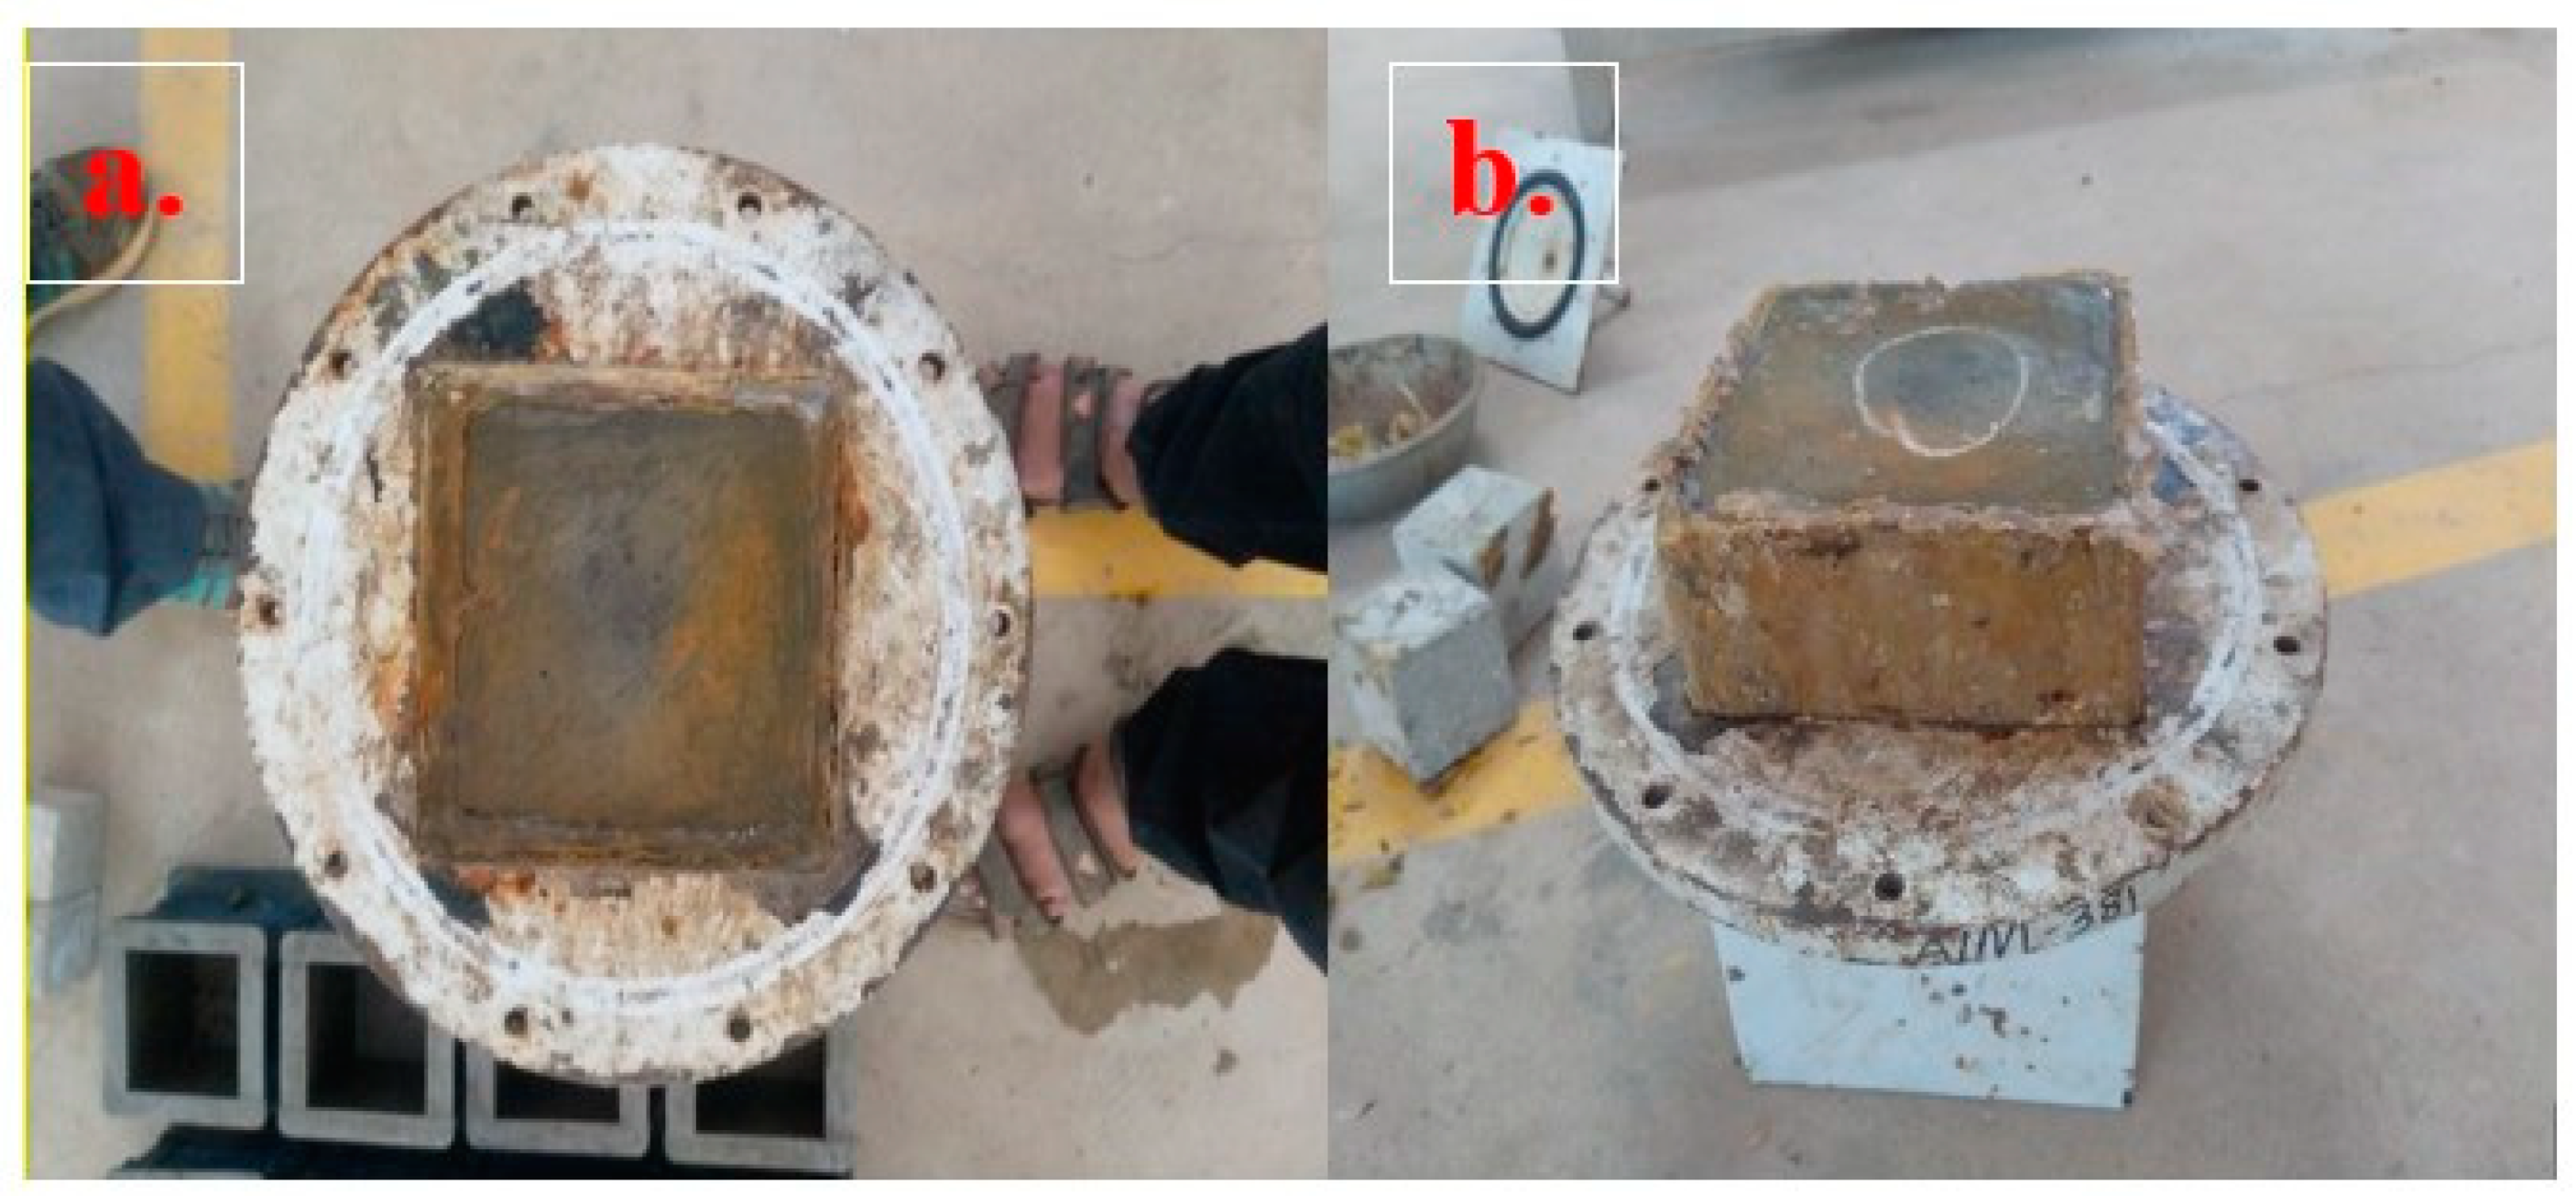
Figure 12.
(a) and (b) show sealing the specimen inside the permeability cell.
Figure 12.
(a) and (b) show sealing the specimen inside the permeability cell.
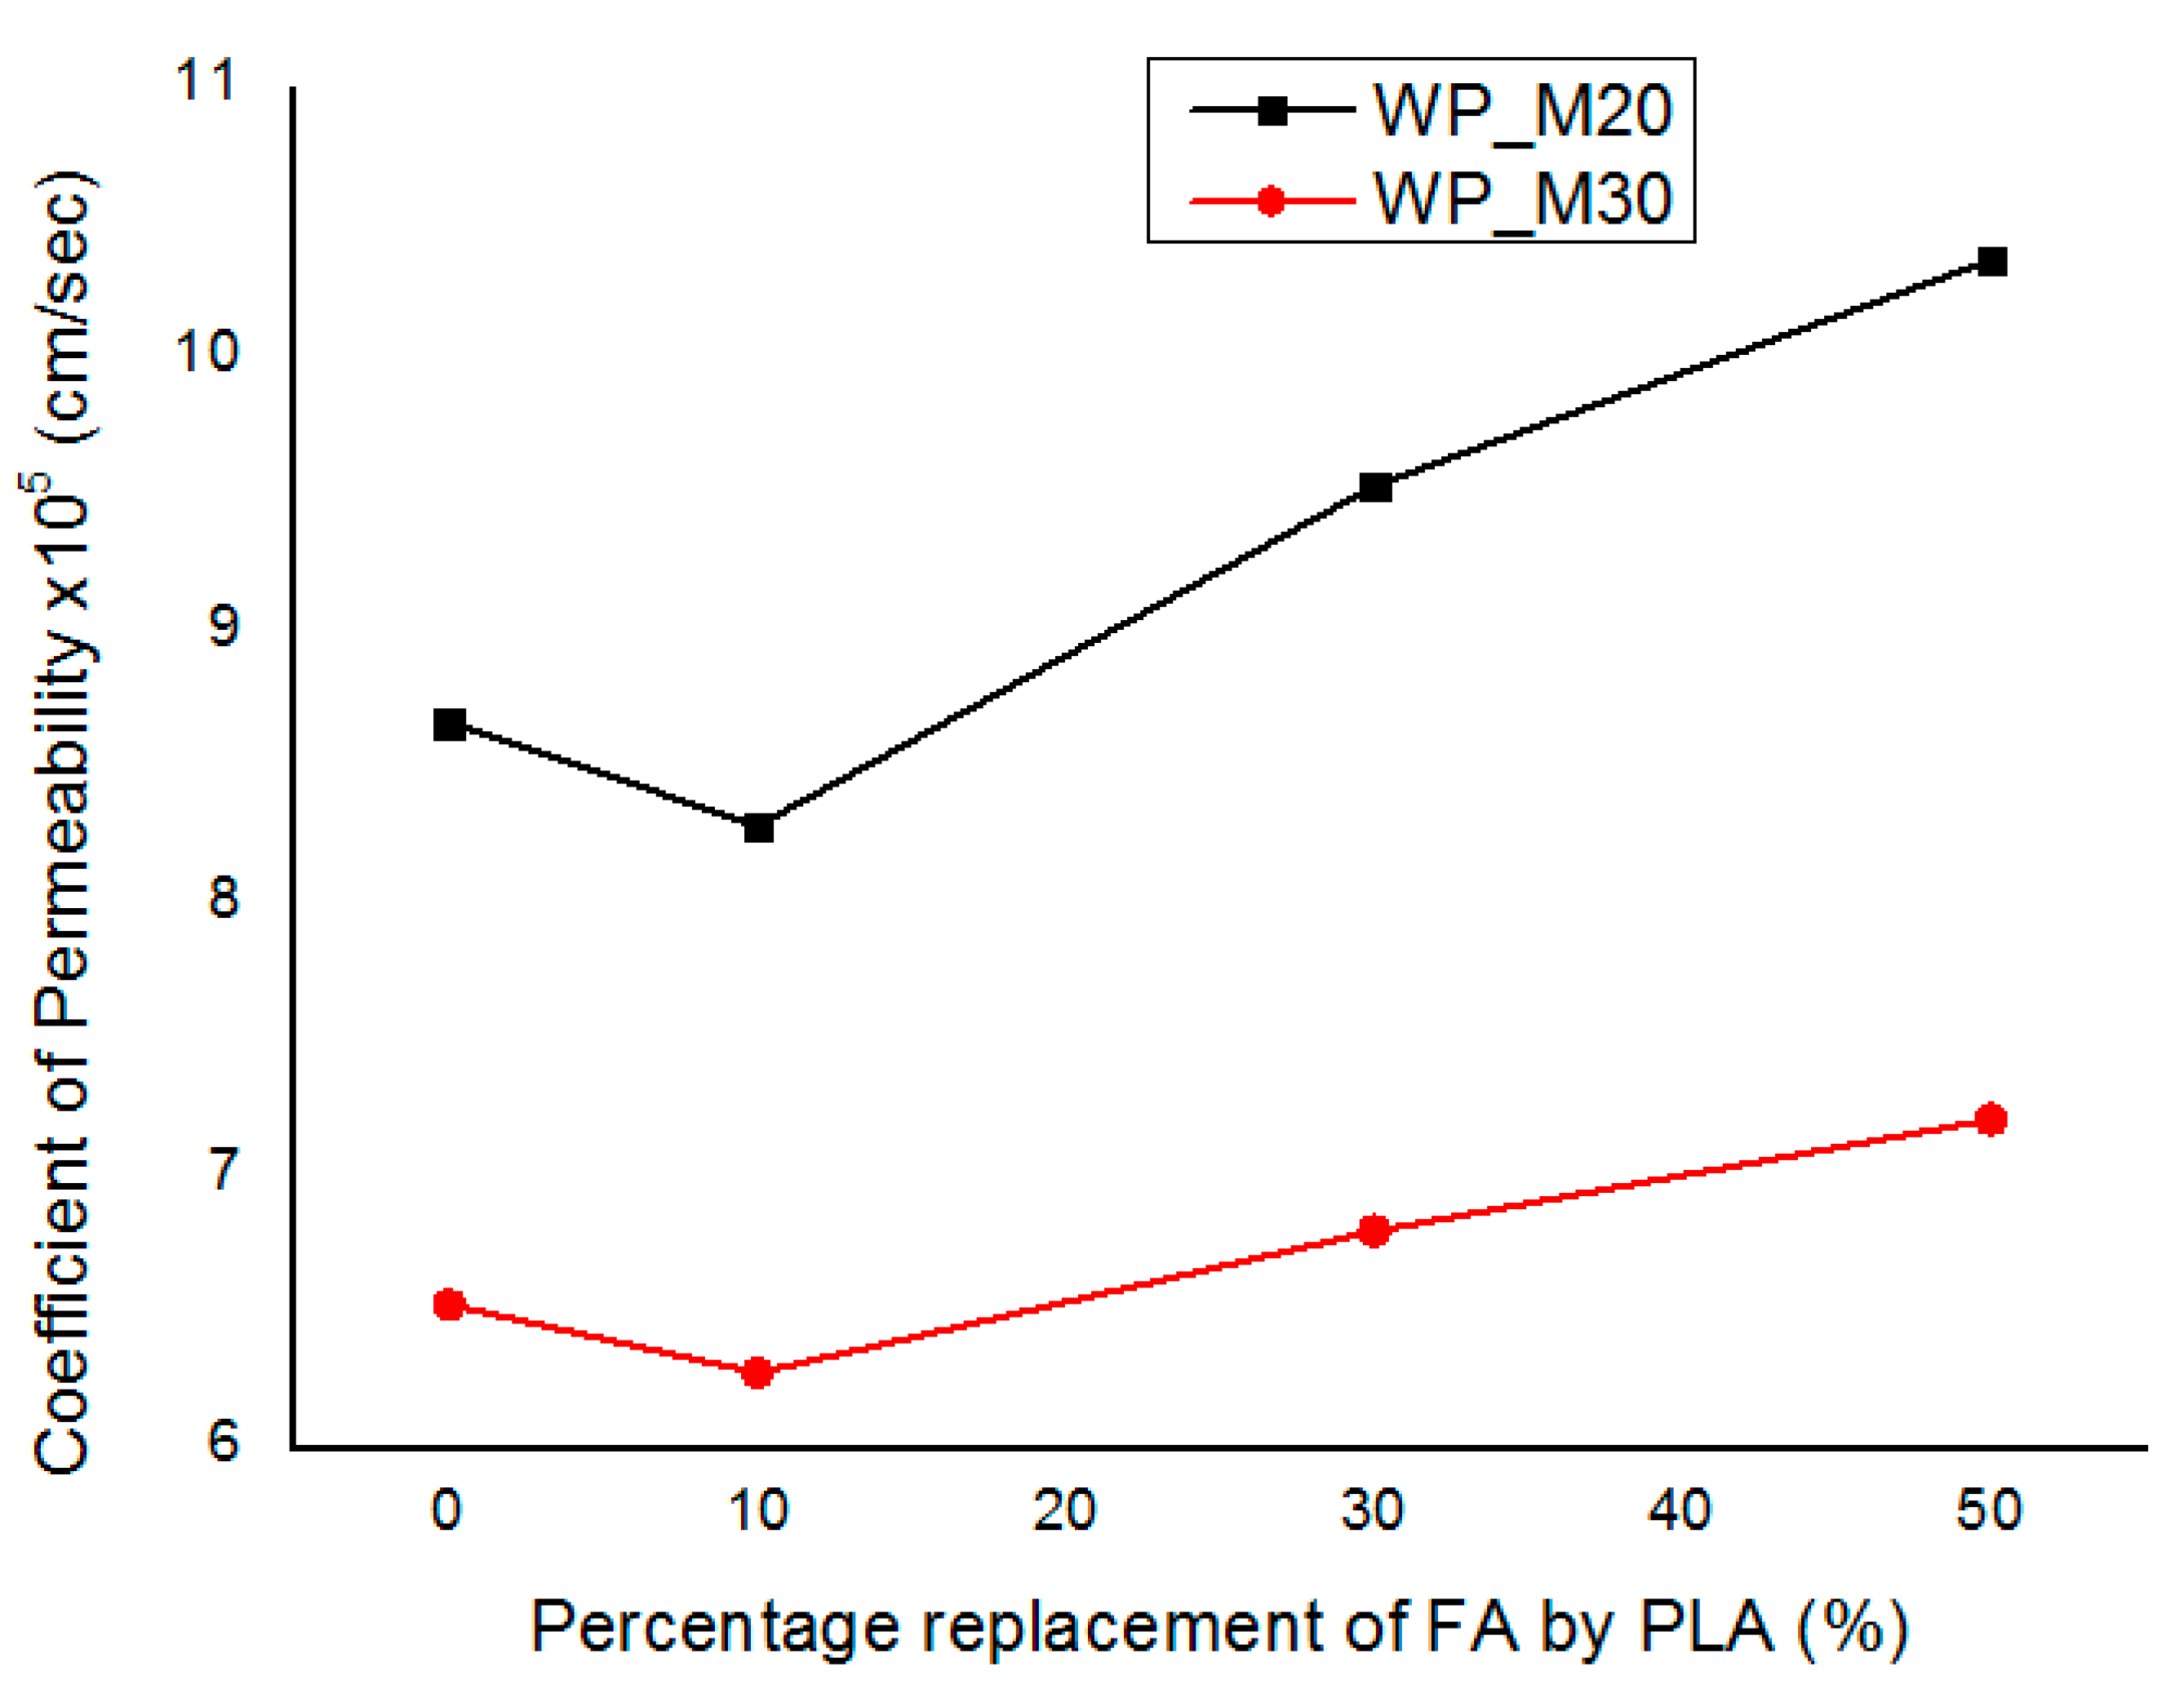
Figure 13.
Results on water permeability test.
Figure 13.
Results on water permeability test.
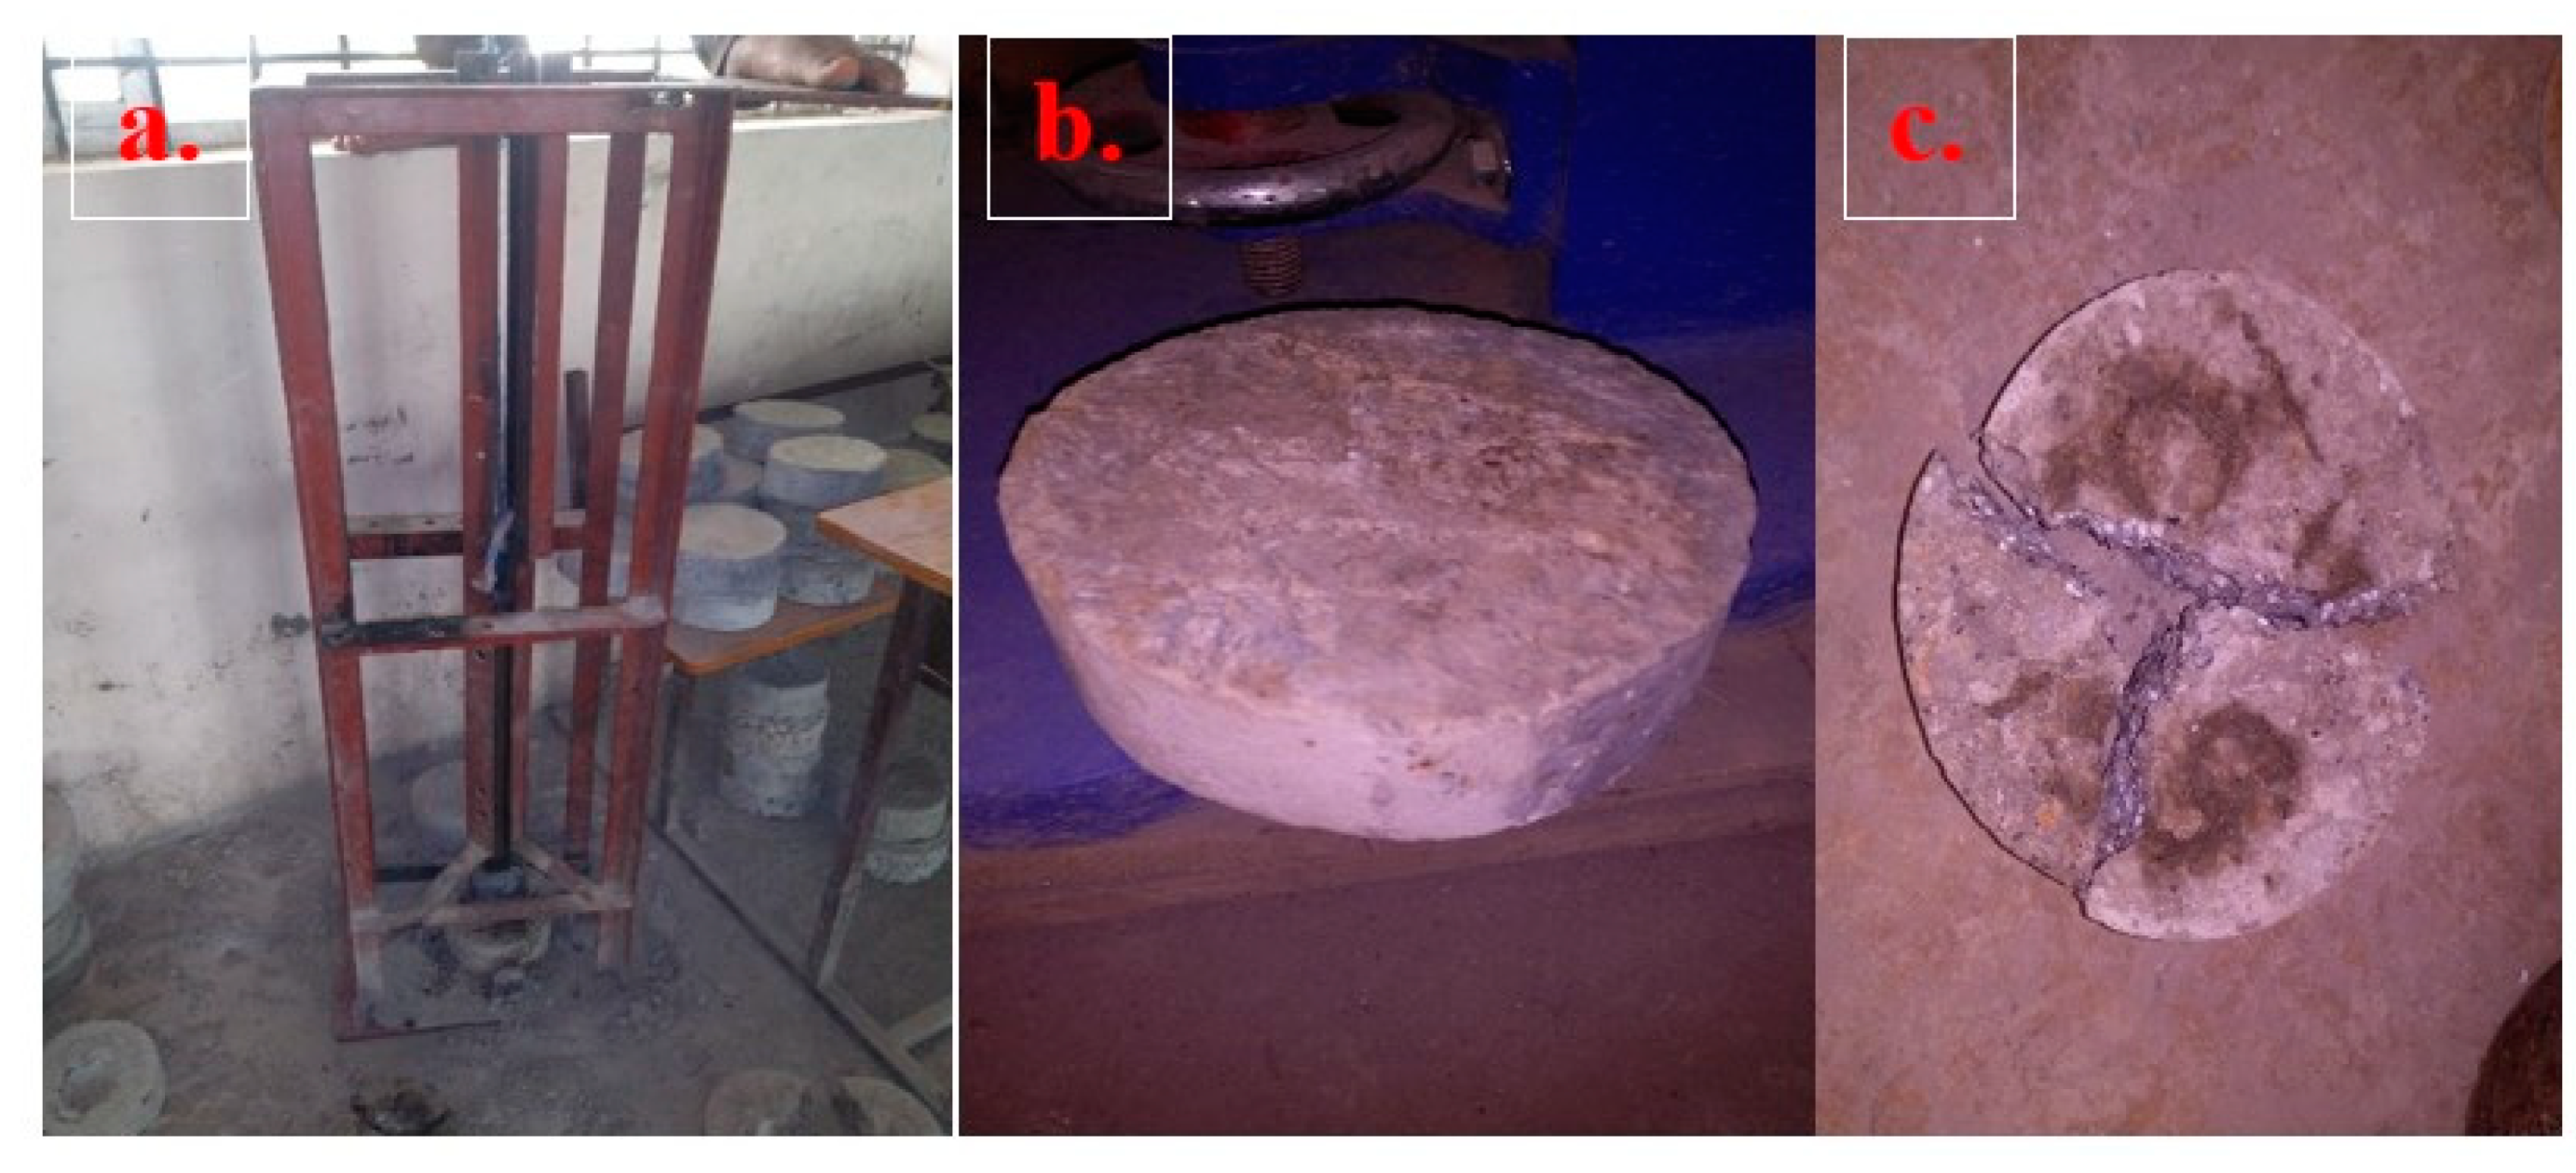
Figure 14.
(a) Impact test machine. (b) Coupon before test. (c) Failure of coupon.
Figure 14.
(a) Impact test machine. (b) Coupon before test. (c) Failure of coupon.
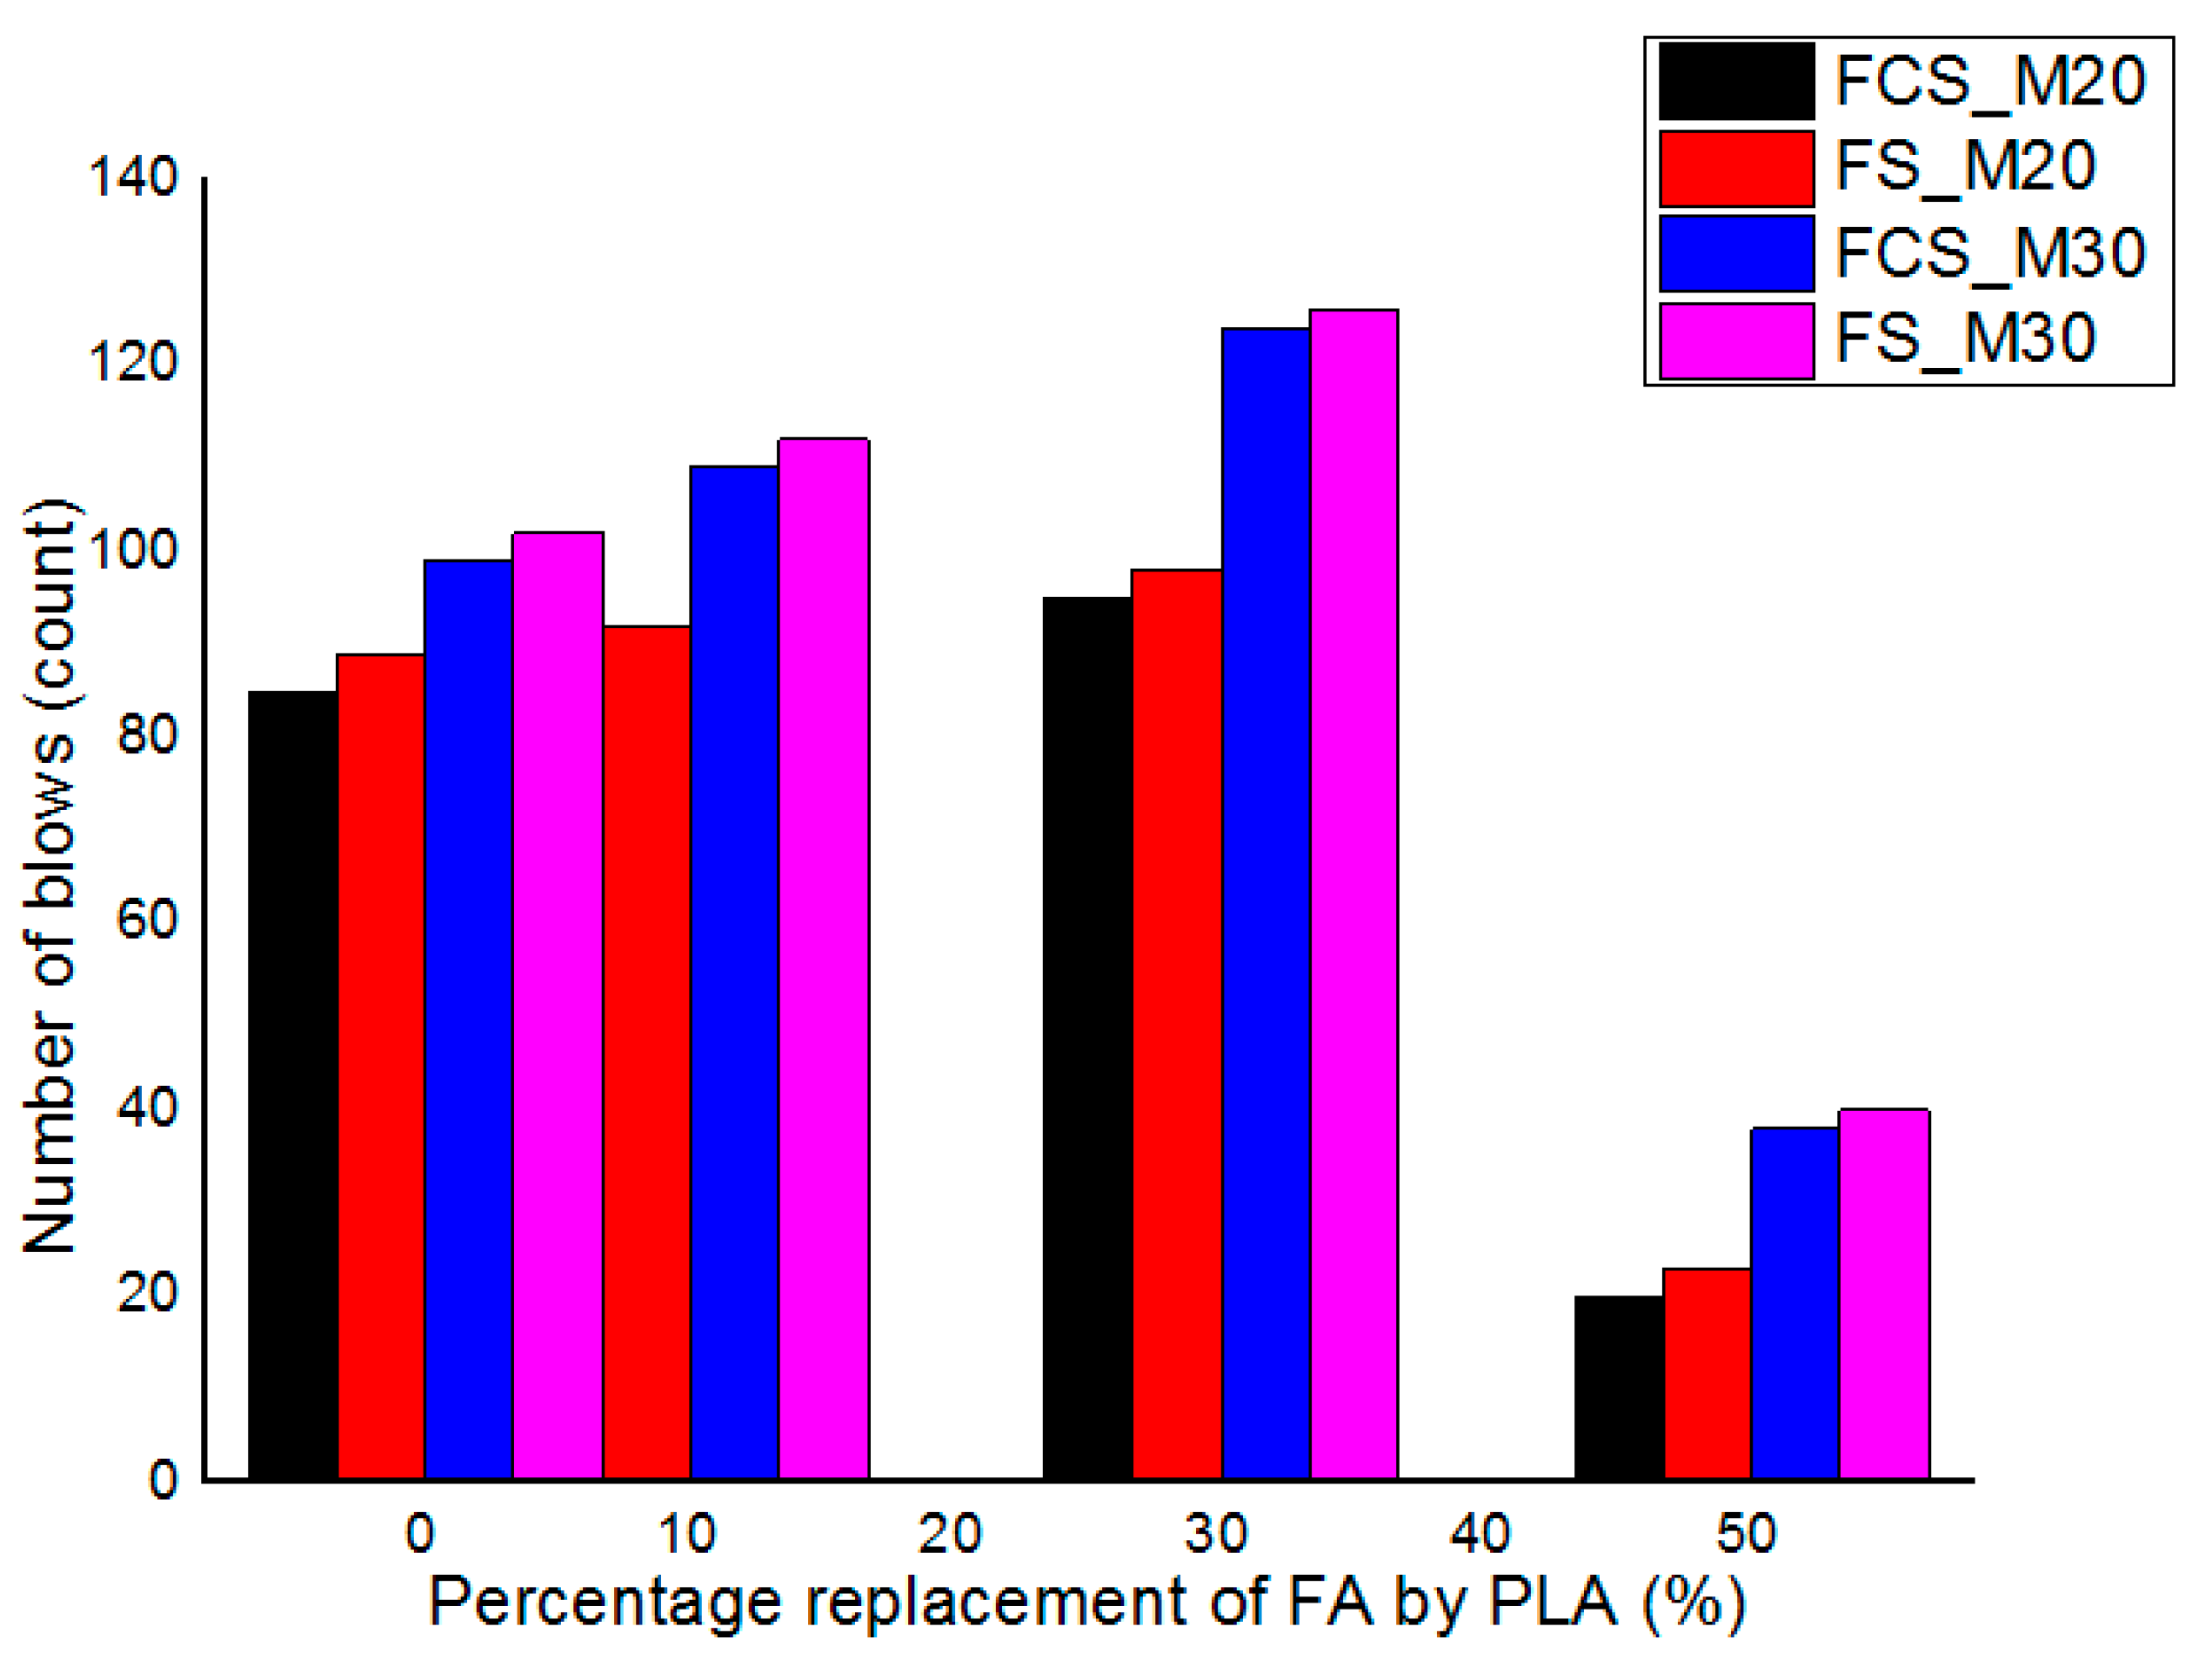
Figure 15.
Impact resistance results for M20 grade.
Figure 15.
Impact resistance results for M20 grade.
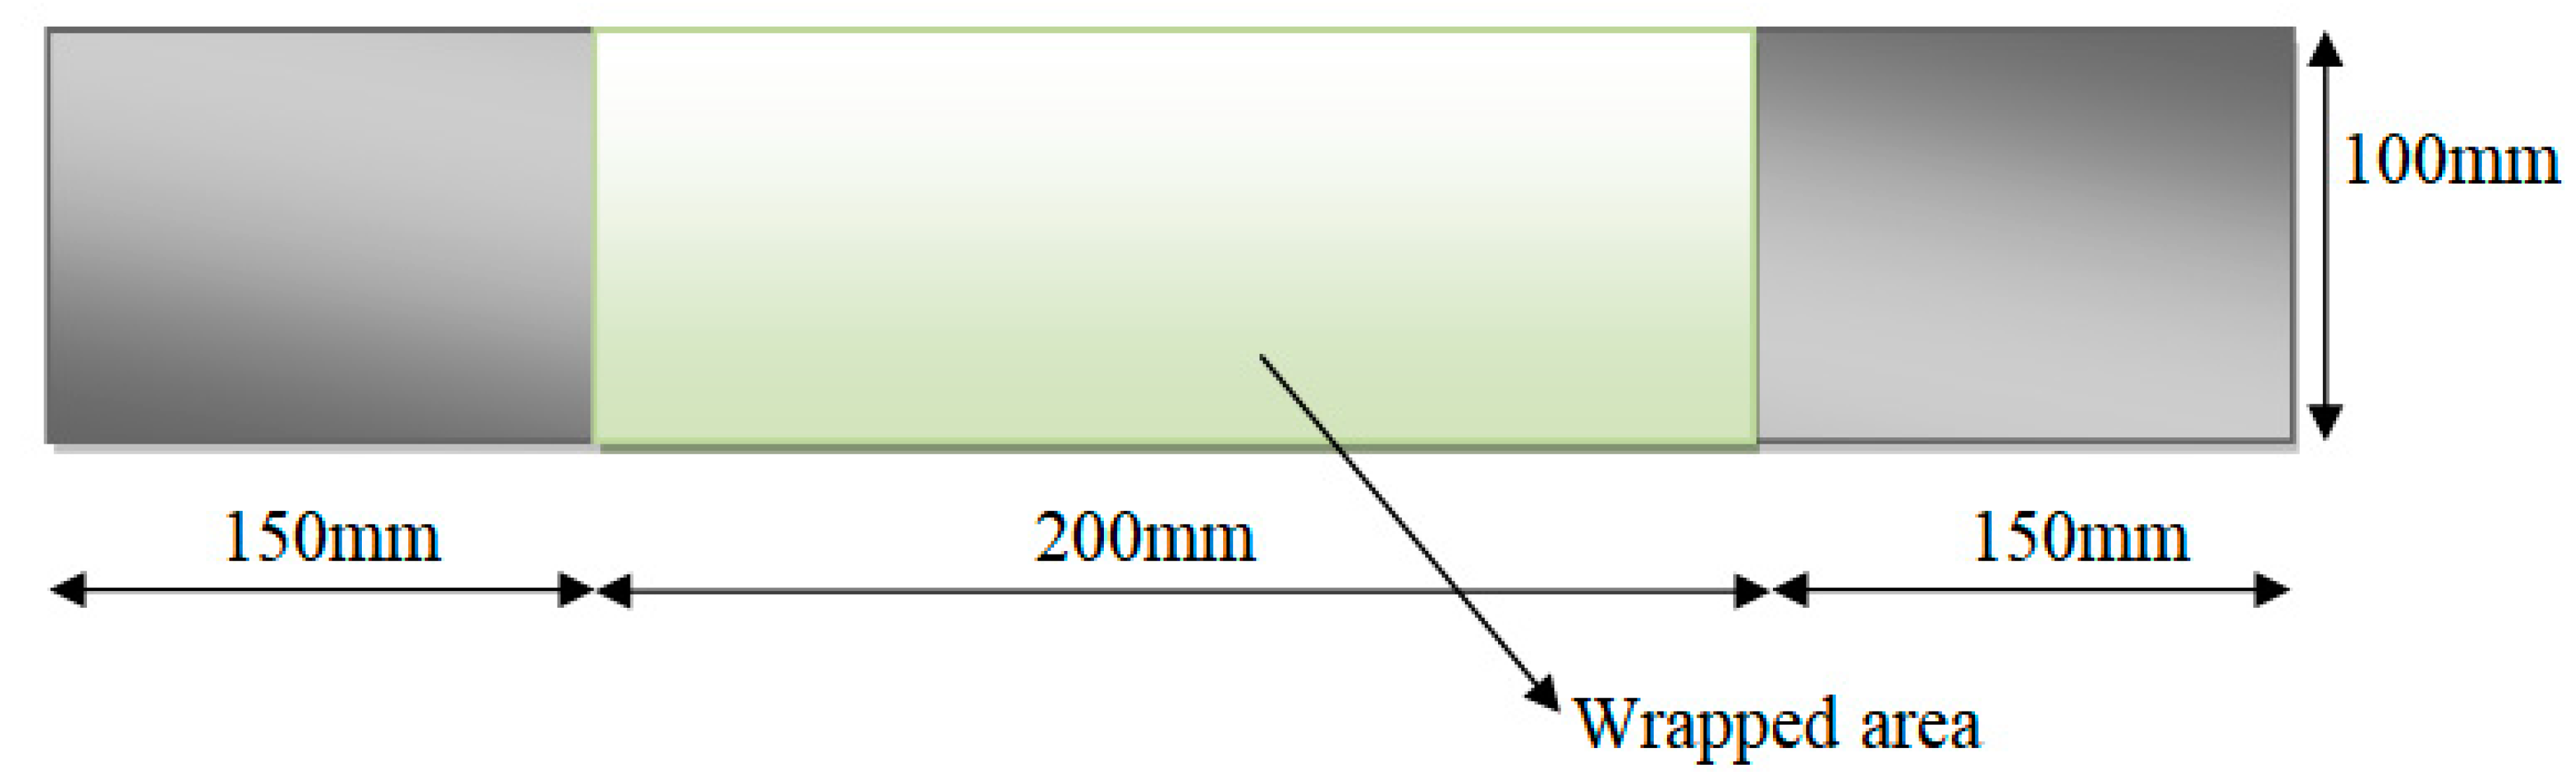
Figure 16.
The bottom face of the wrapping beam.
Figure 16.
The bottom face of the wrapping beam.
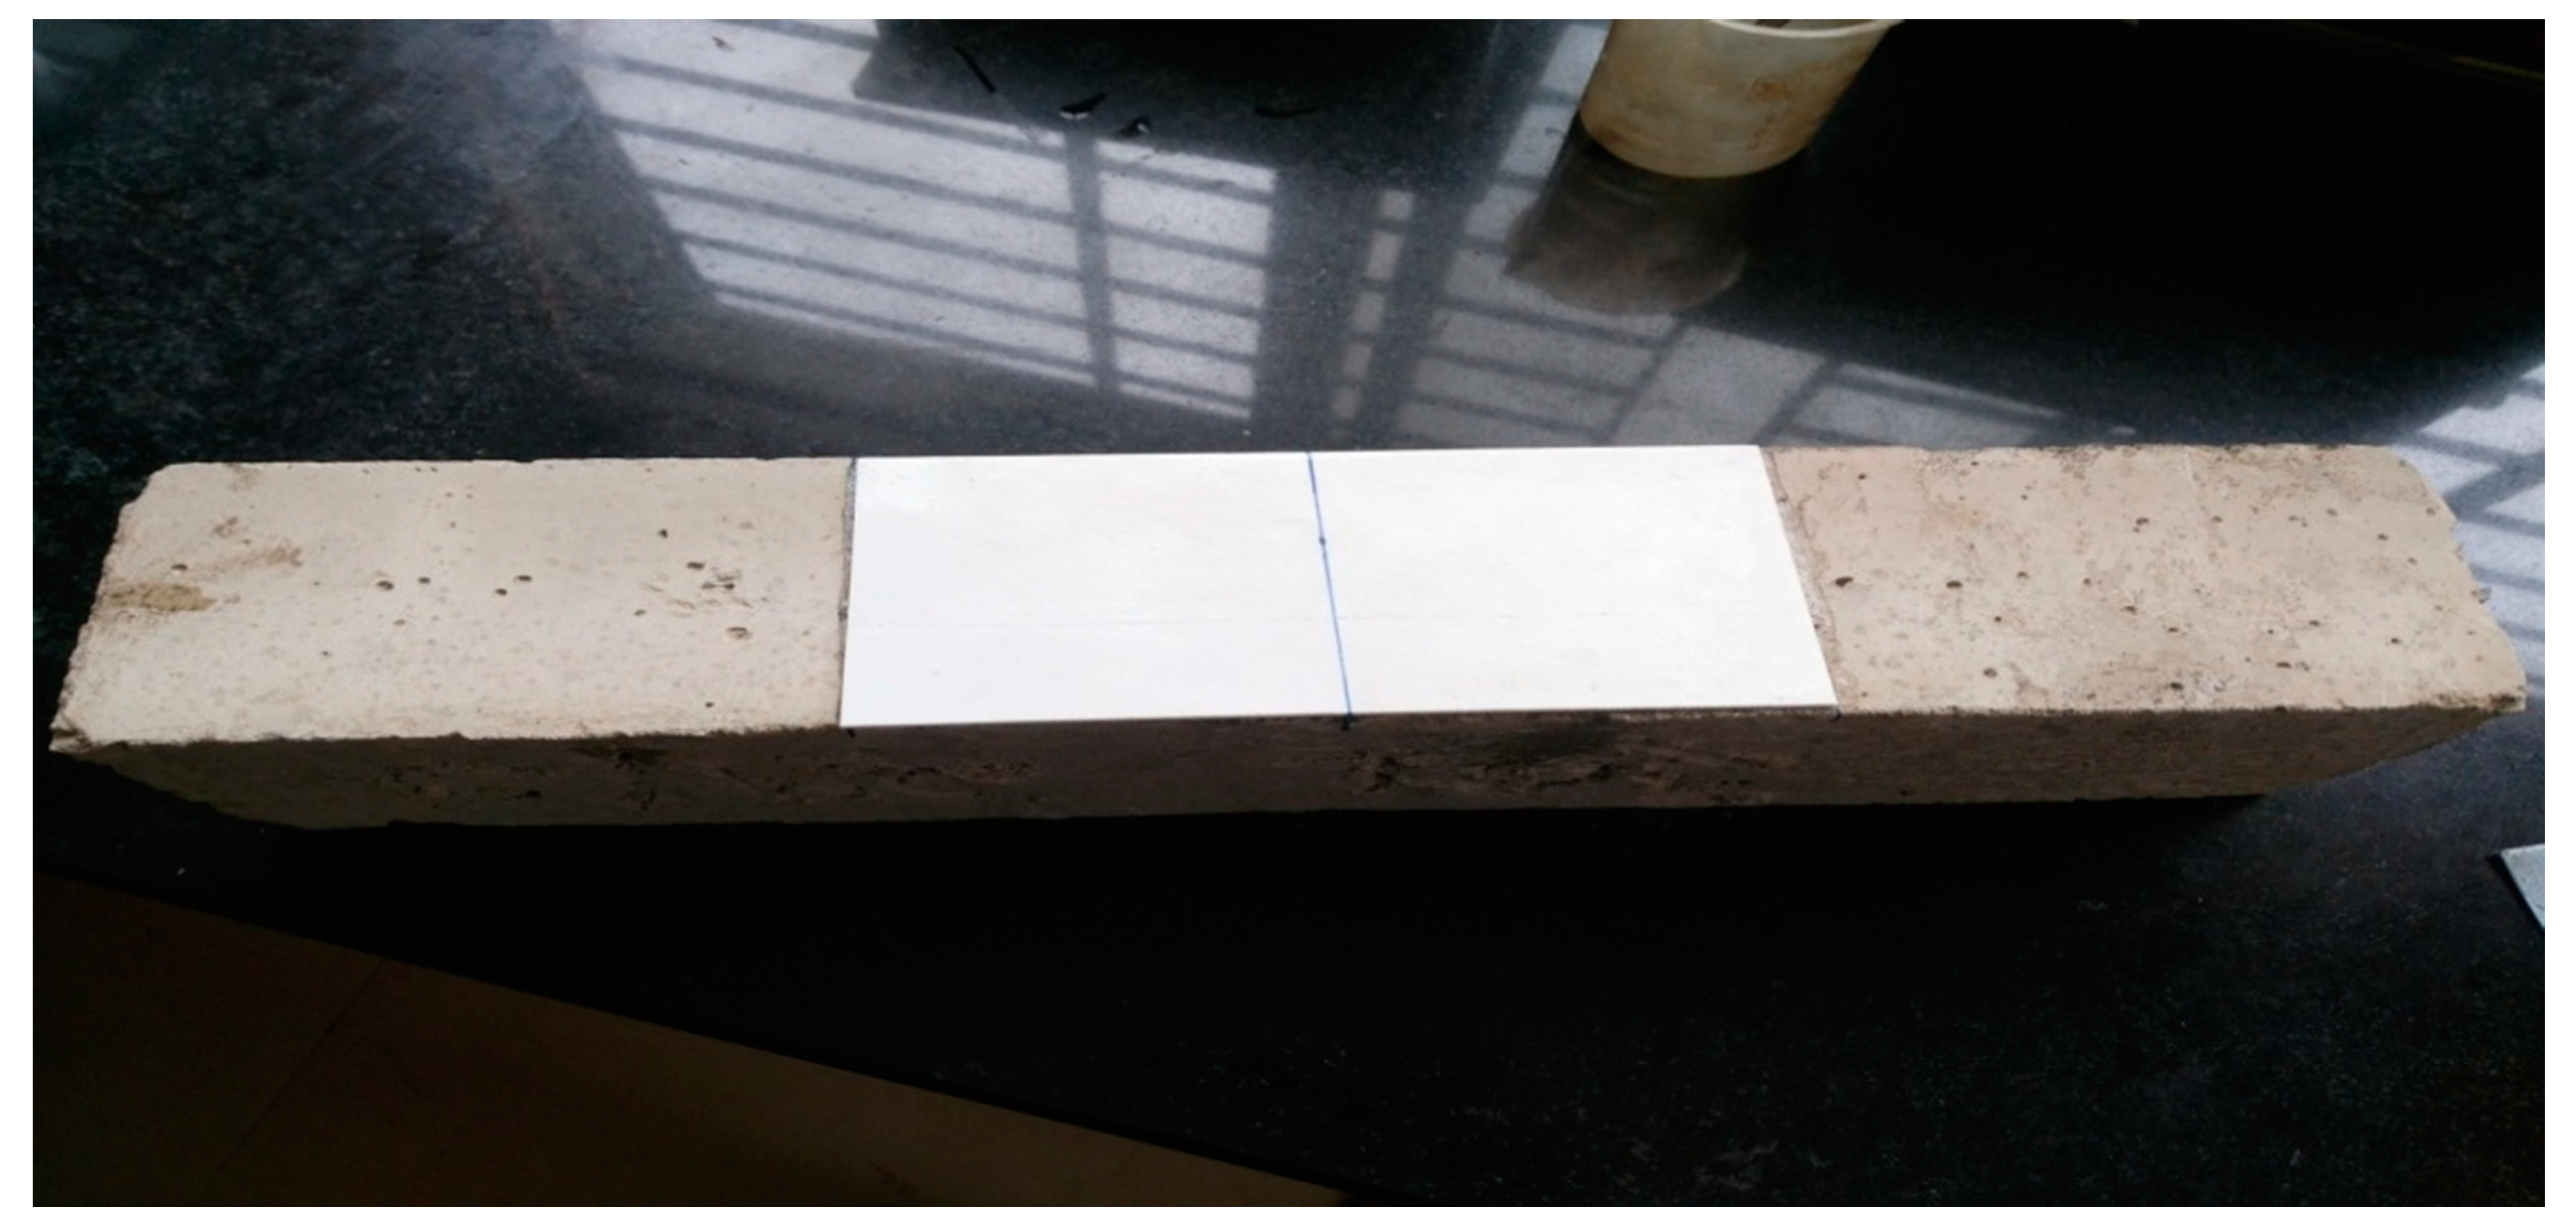
Figure 17.
PLA plate wrapped concrete beam before testing.
Figure 17.
PLA plate wrapped concrete beam before testing.
Figure 18.
vs. Deflection curve of wrapped and unwrapped beams.
Figure 18.
vs. Deflection curve of wrapped and unwrapped beams.
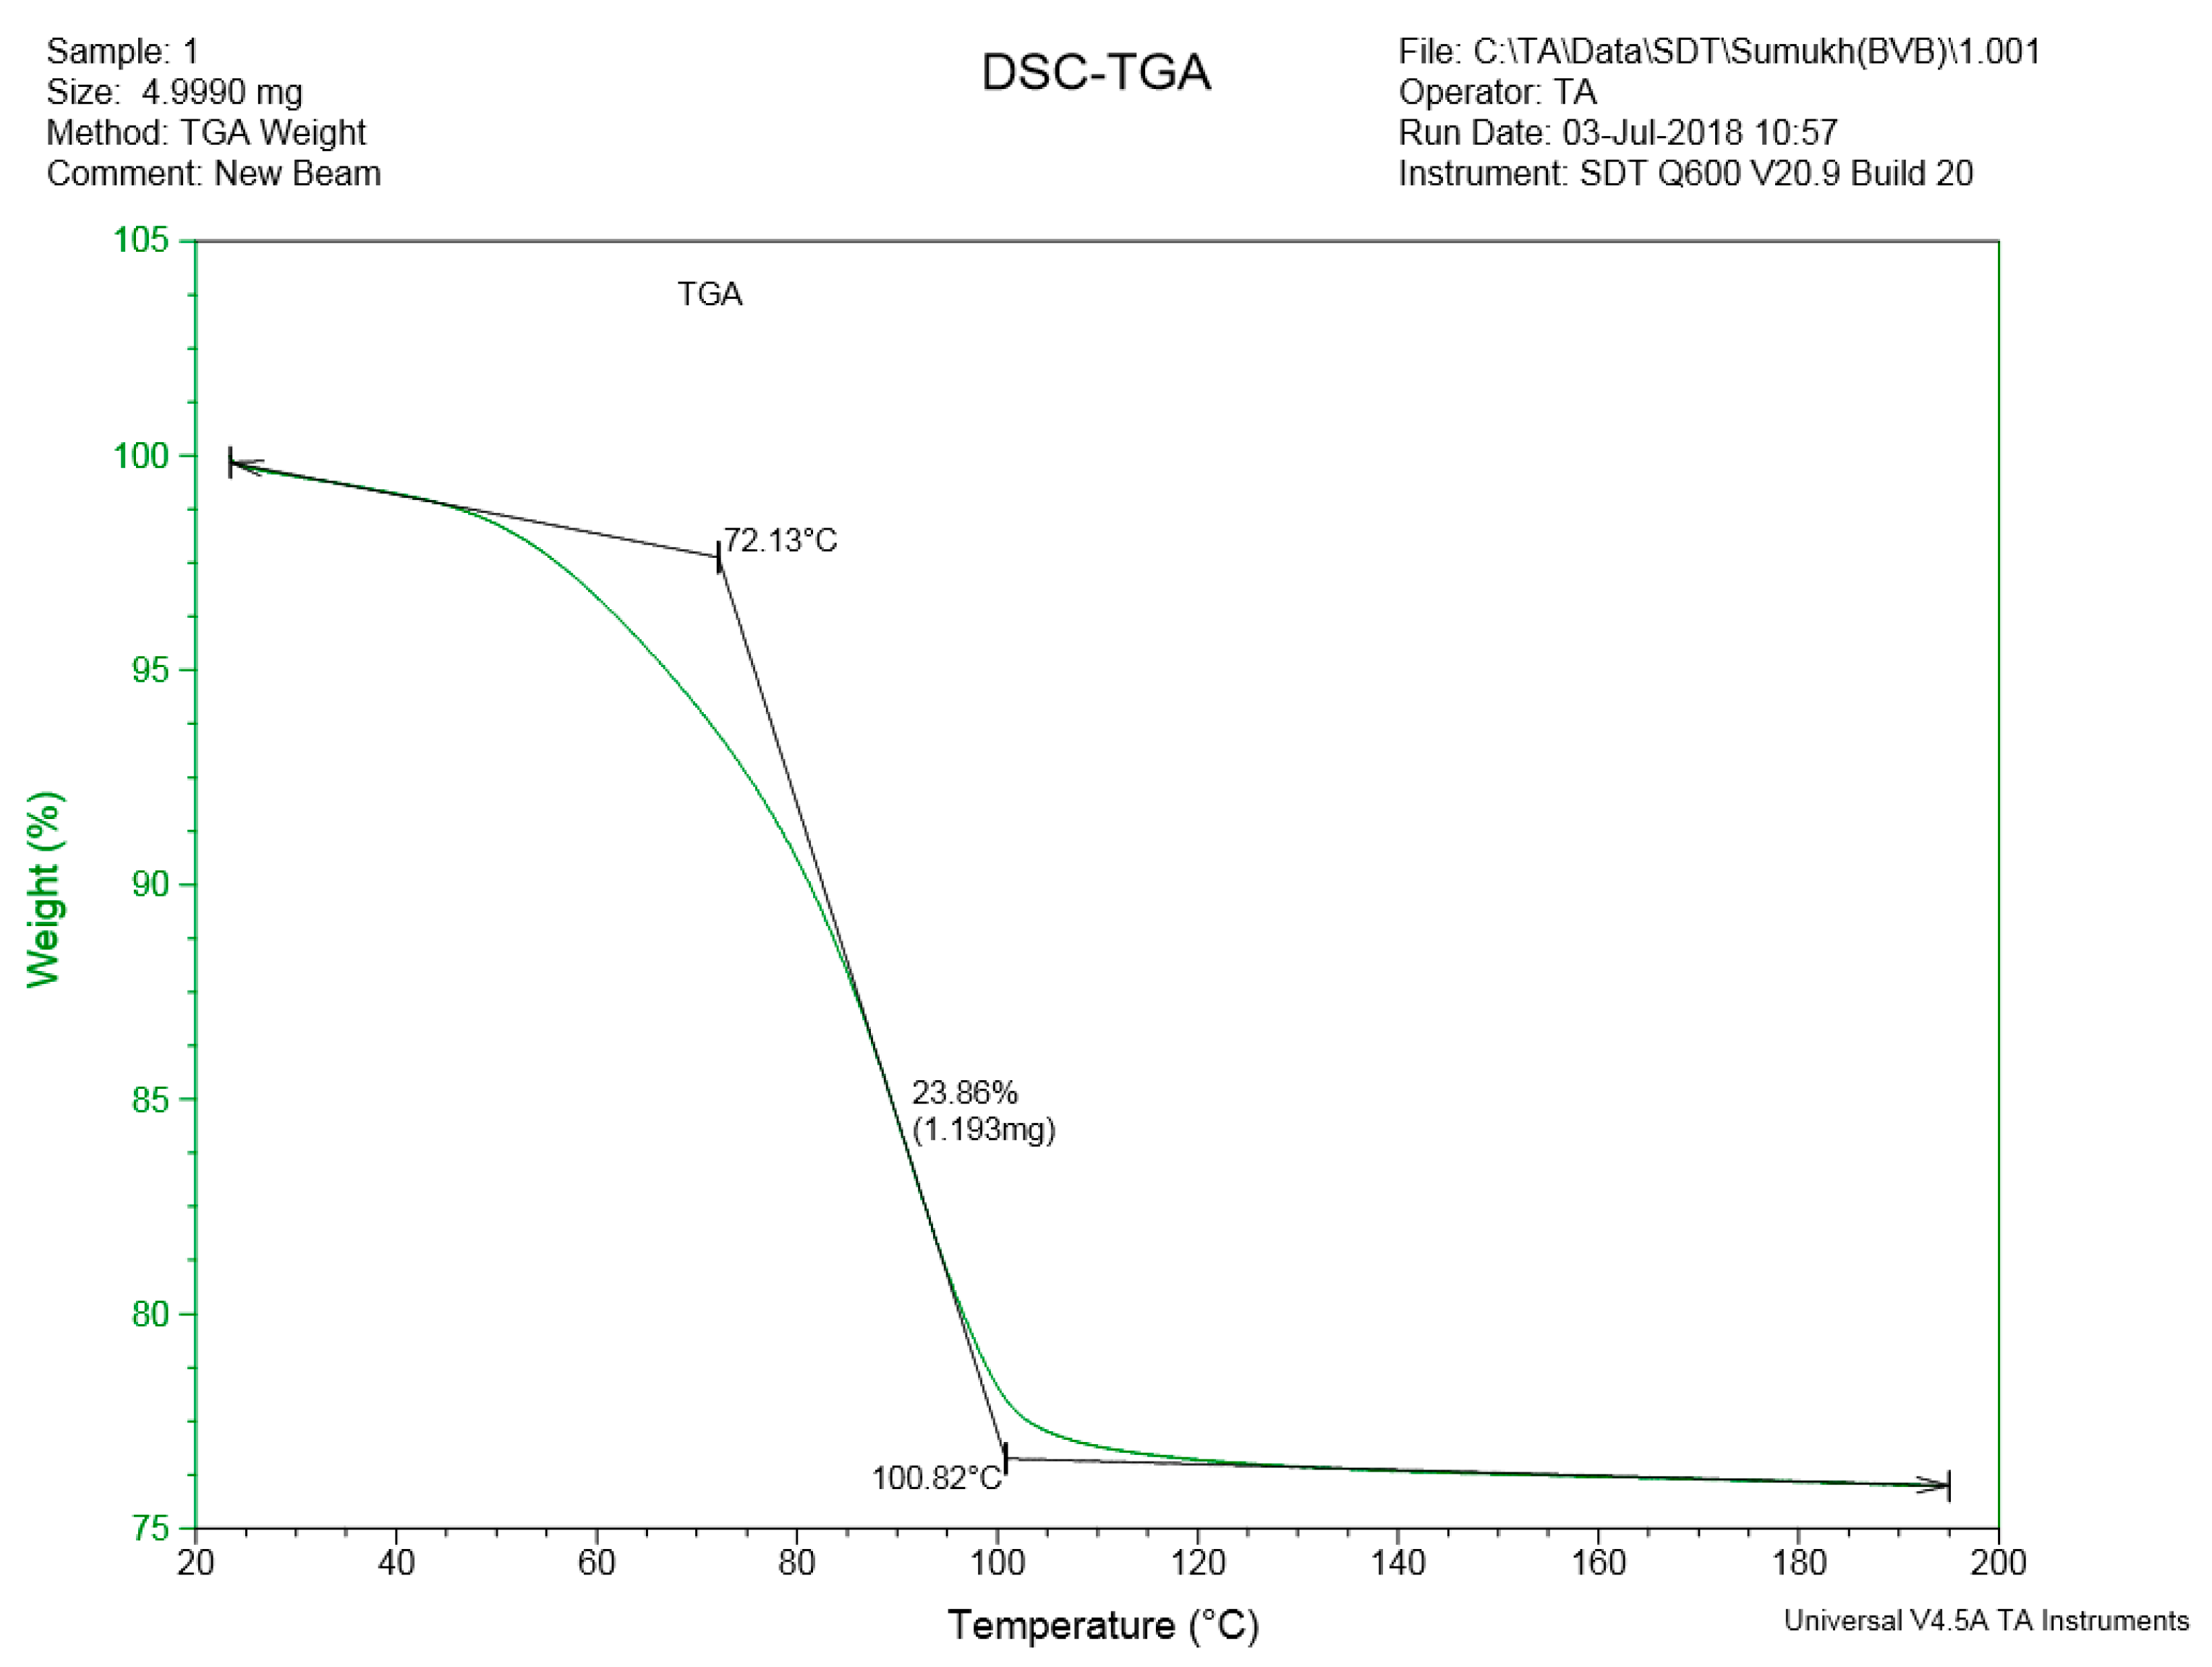
Figure 19.
Weight loss vs. temperature curve for PLA granules.
Figure 19.
Weight loss vs. temperature curve for PLA granules.
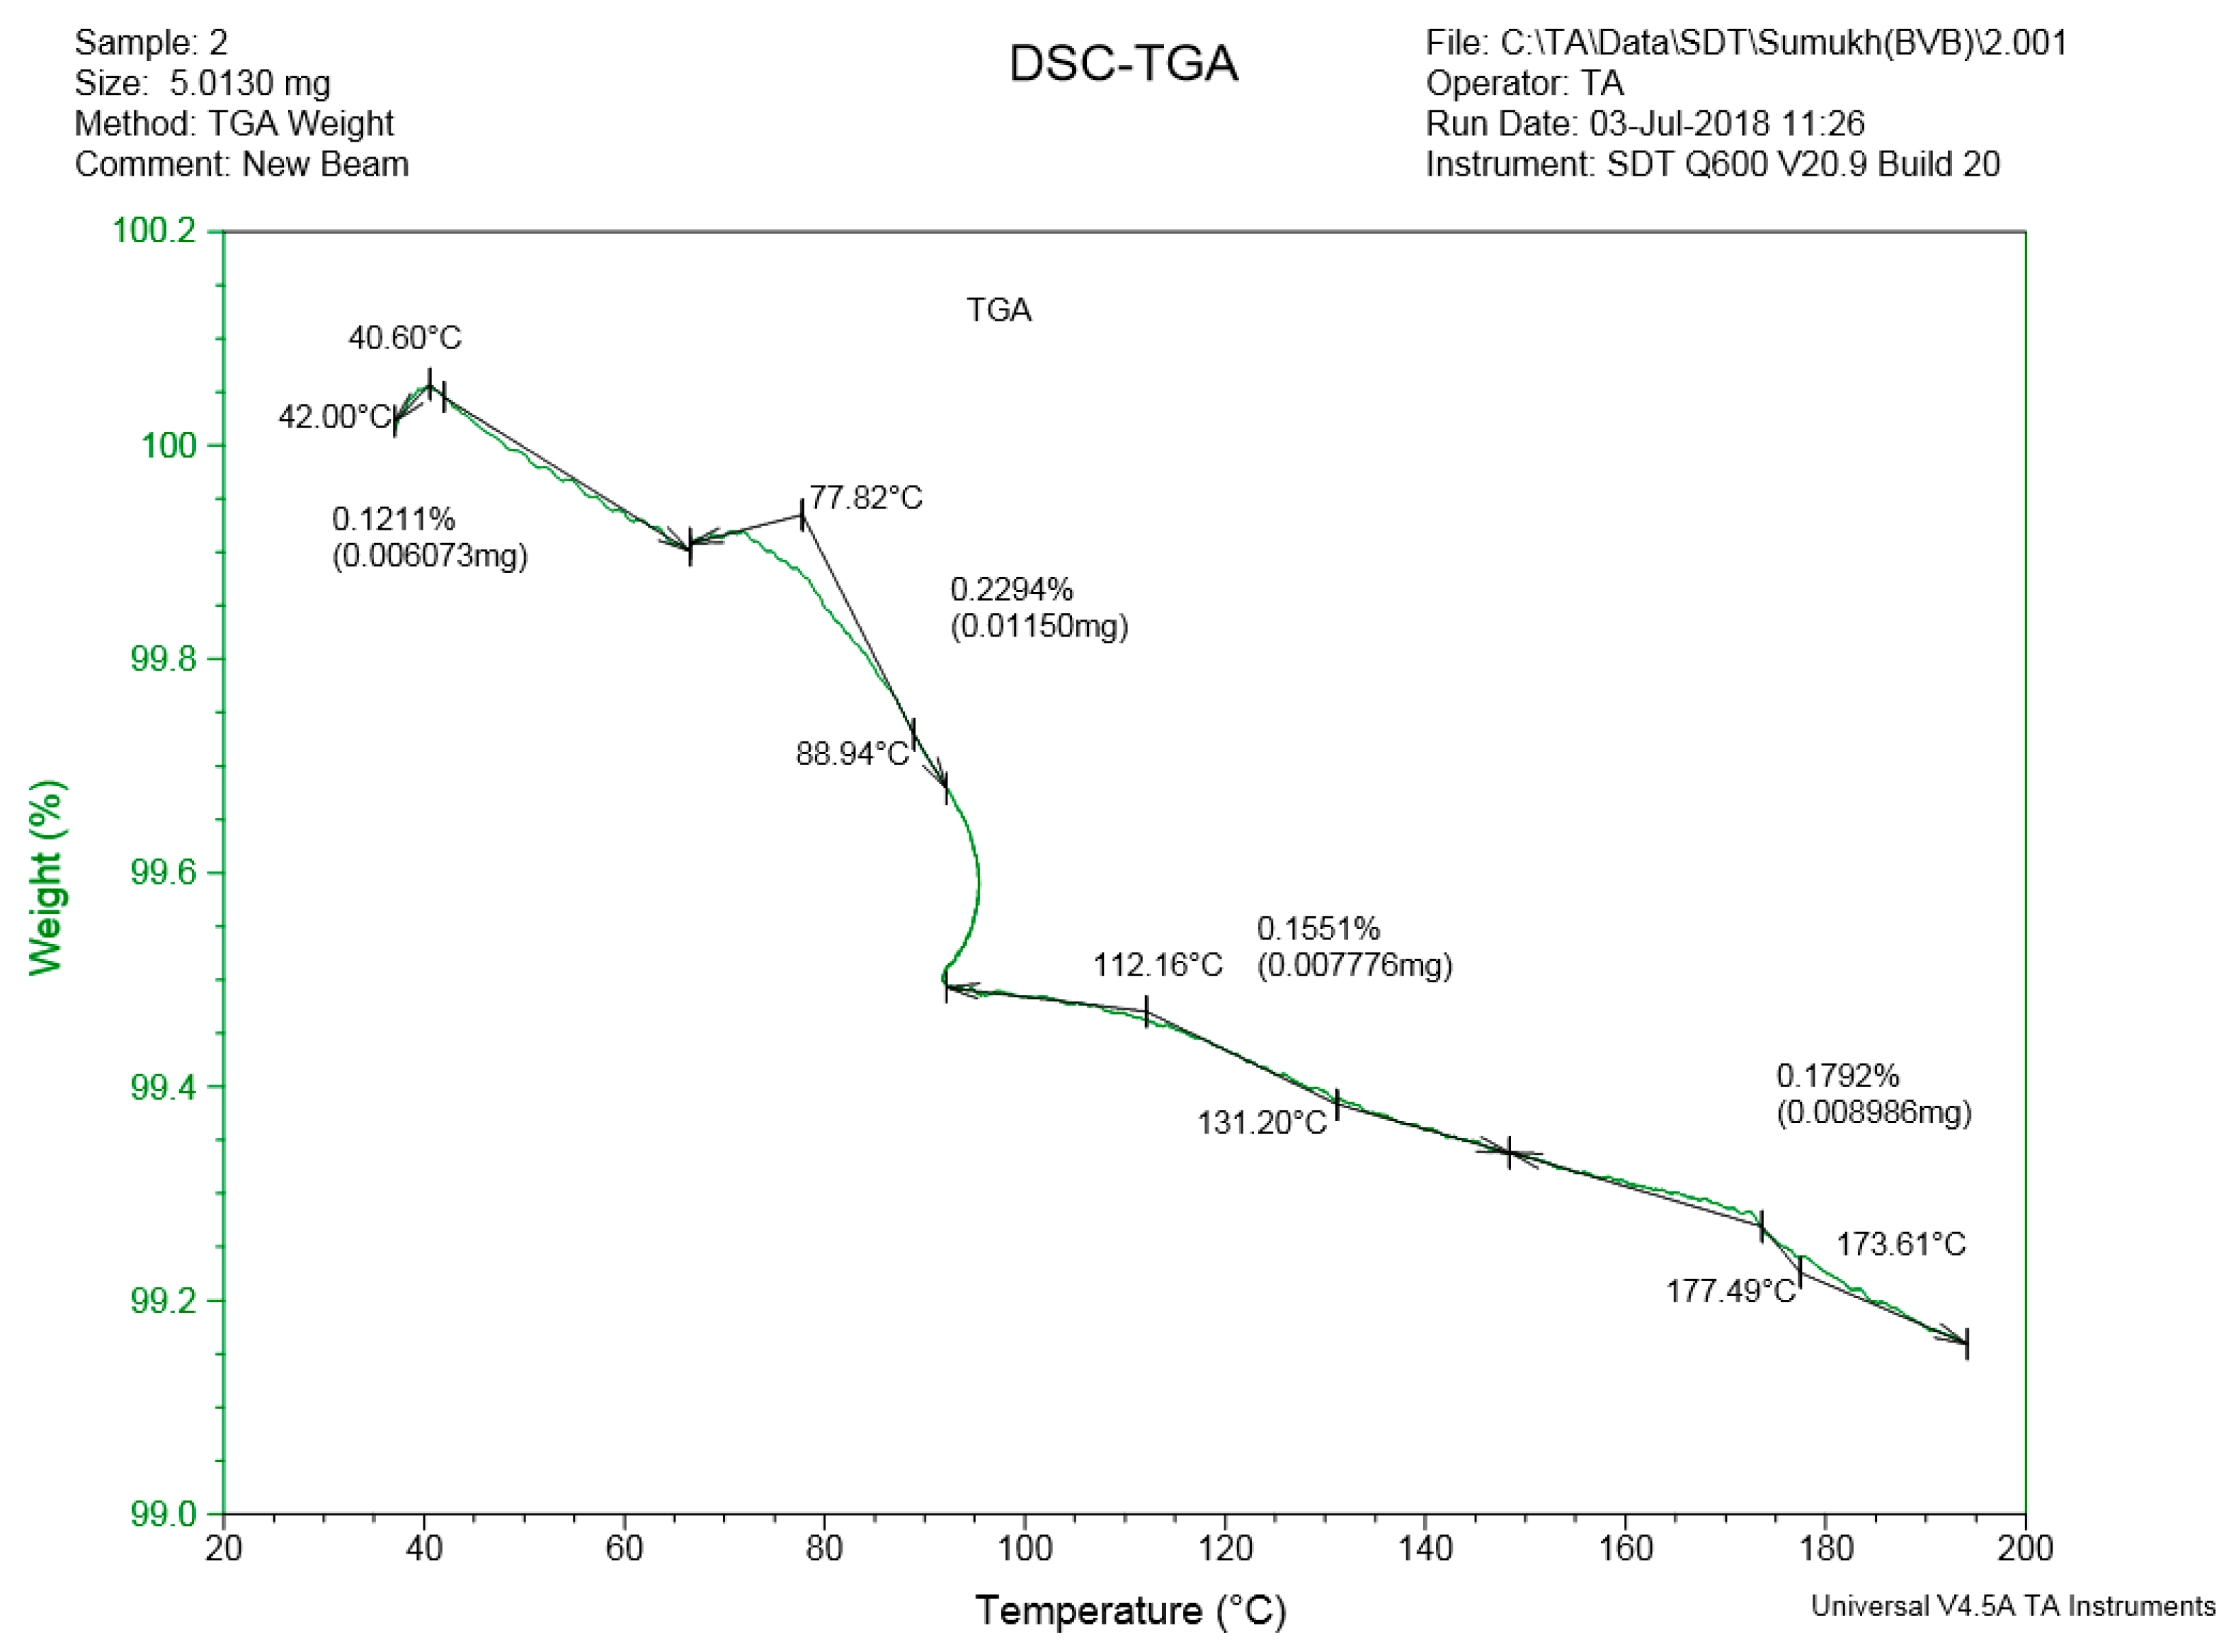
Figure 20.
Weight loss vs. temperature curve for wired PLA.
Figure 20.
Weight loss vs. temperature curve for wired PLA.
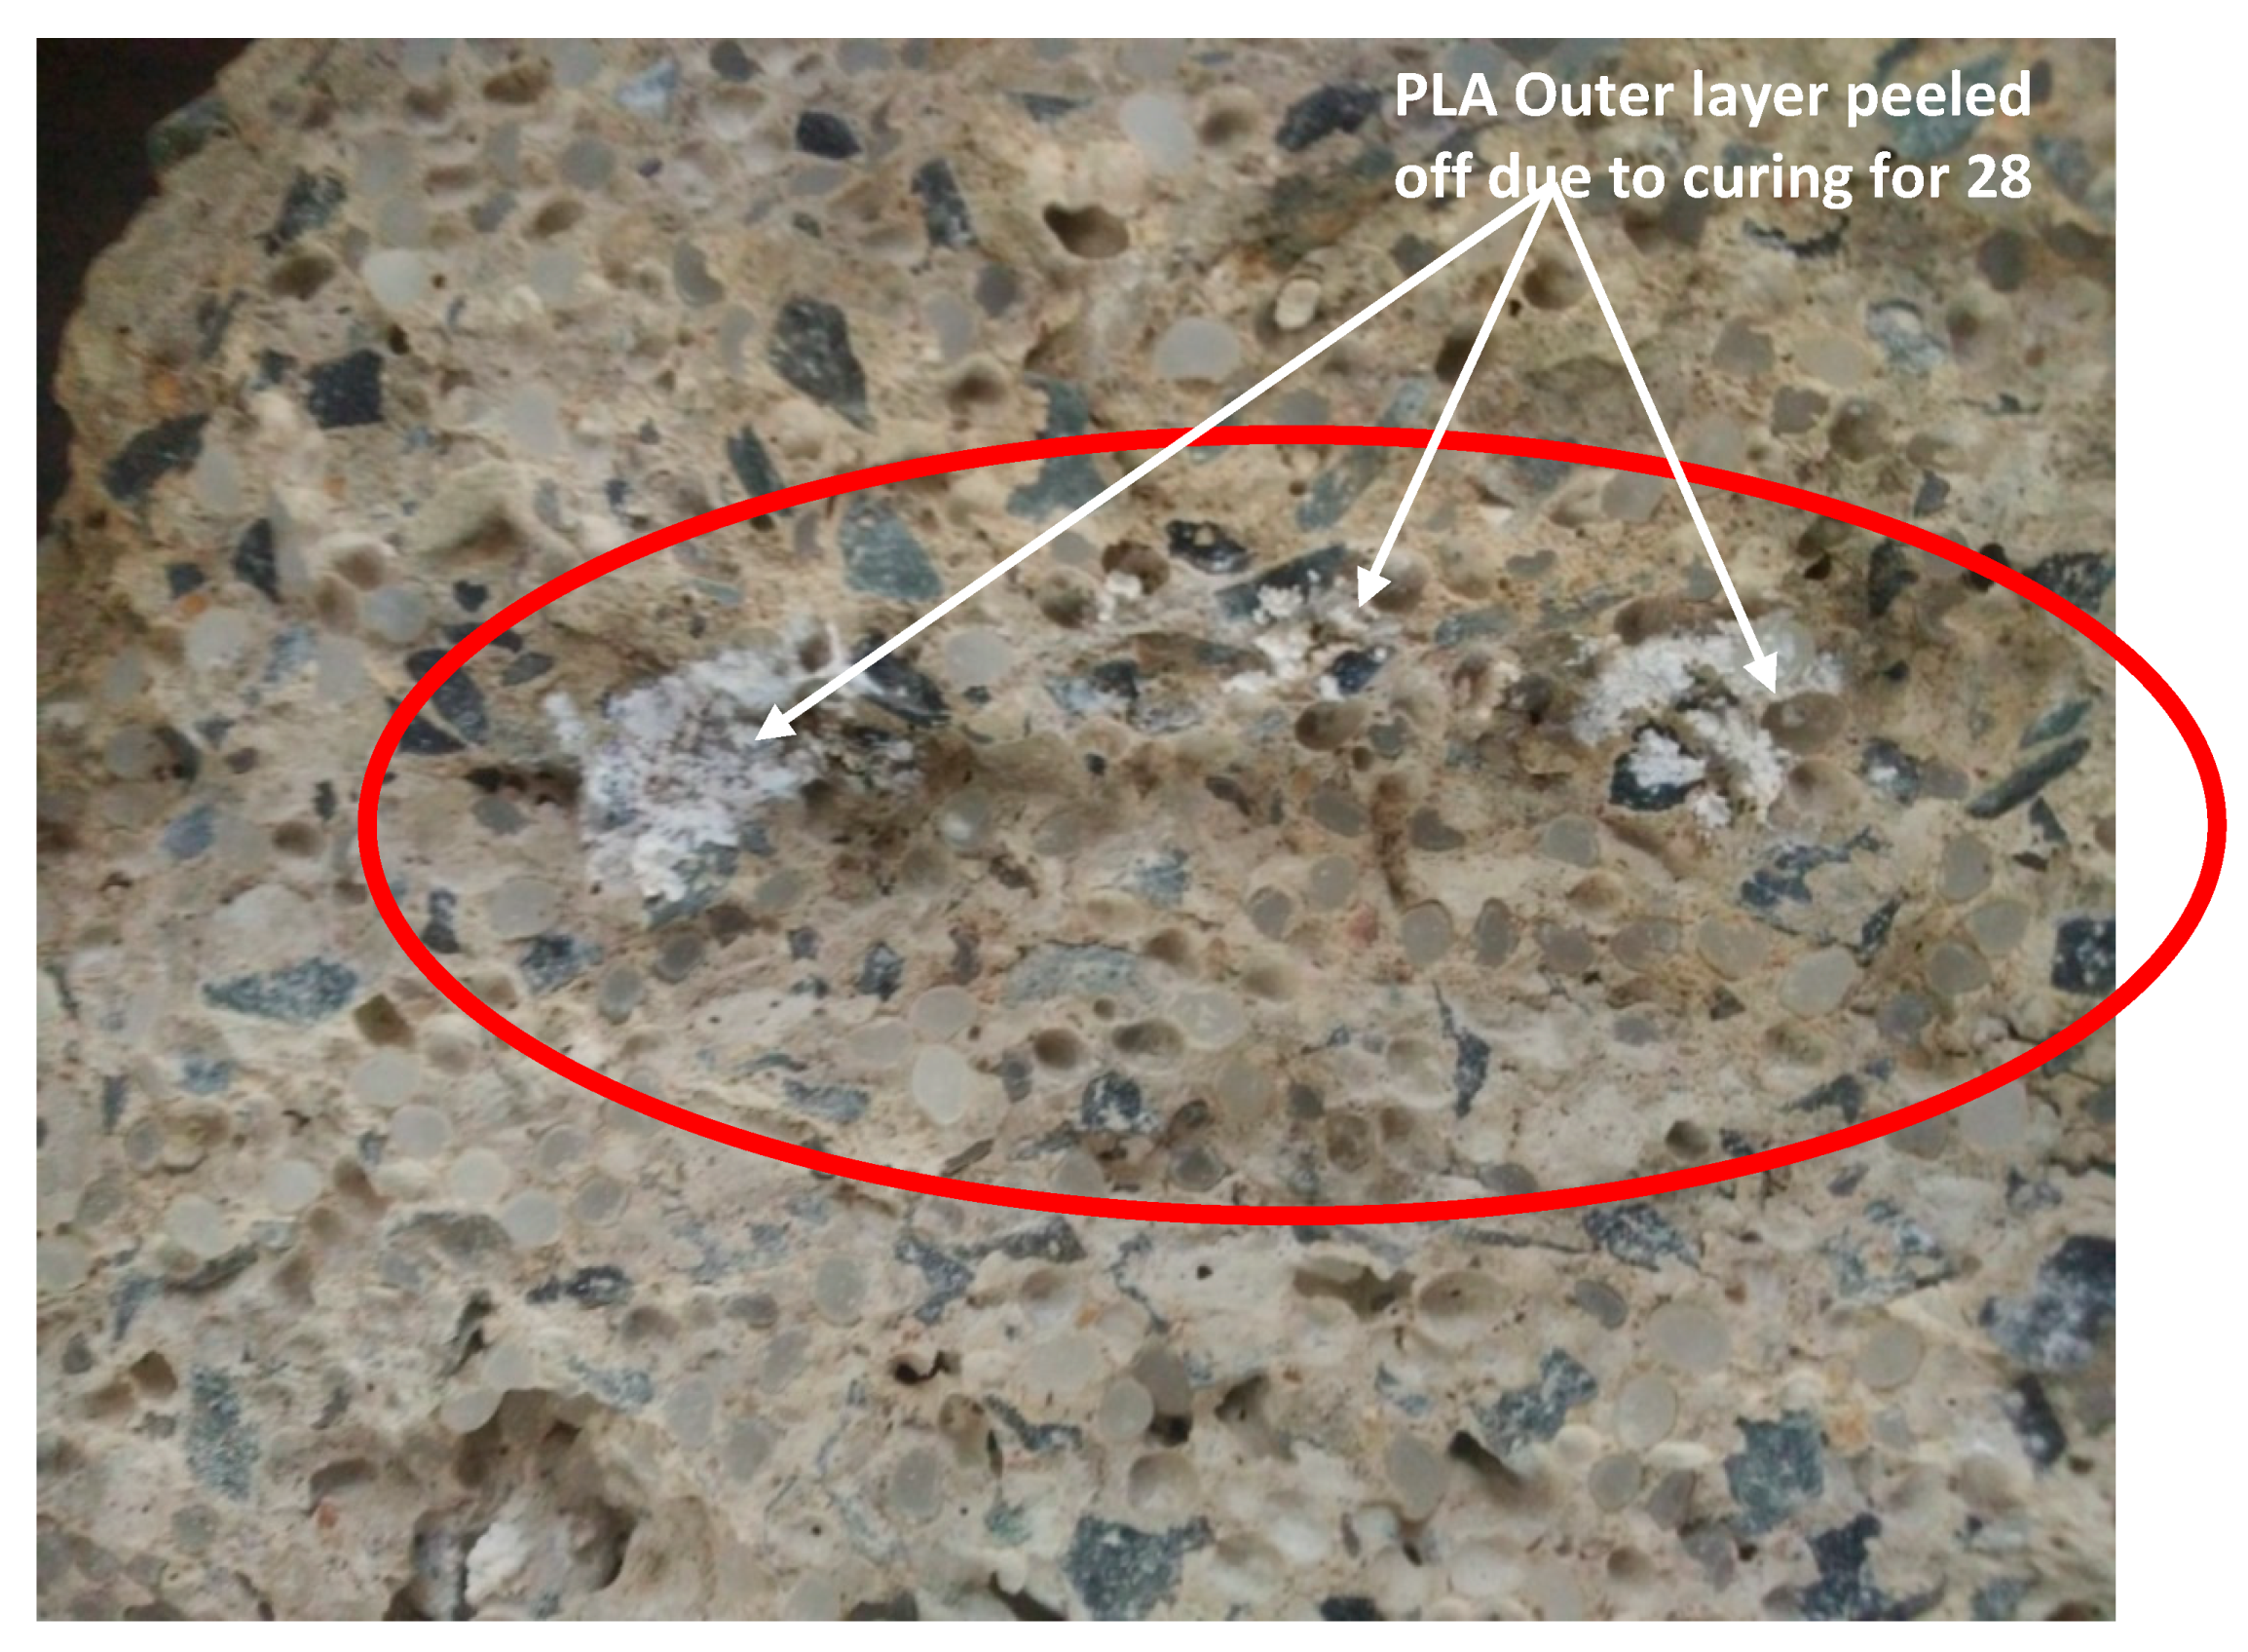
Figure 21.
PLA outer layer (wafer or diaphragm) during the curing period.
Figure 21.
PLA outer layer (wafer or diaphragm) during the curing period.
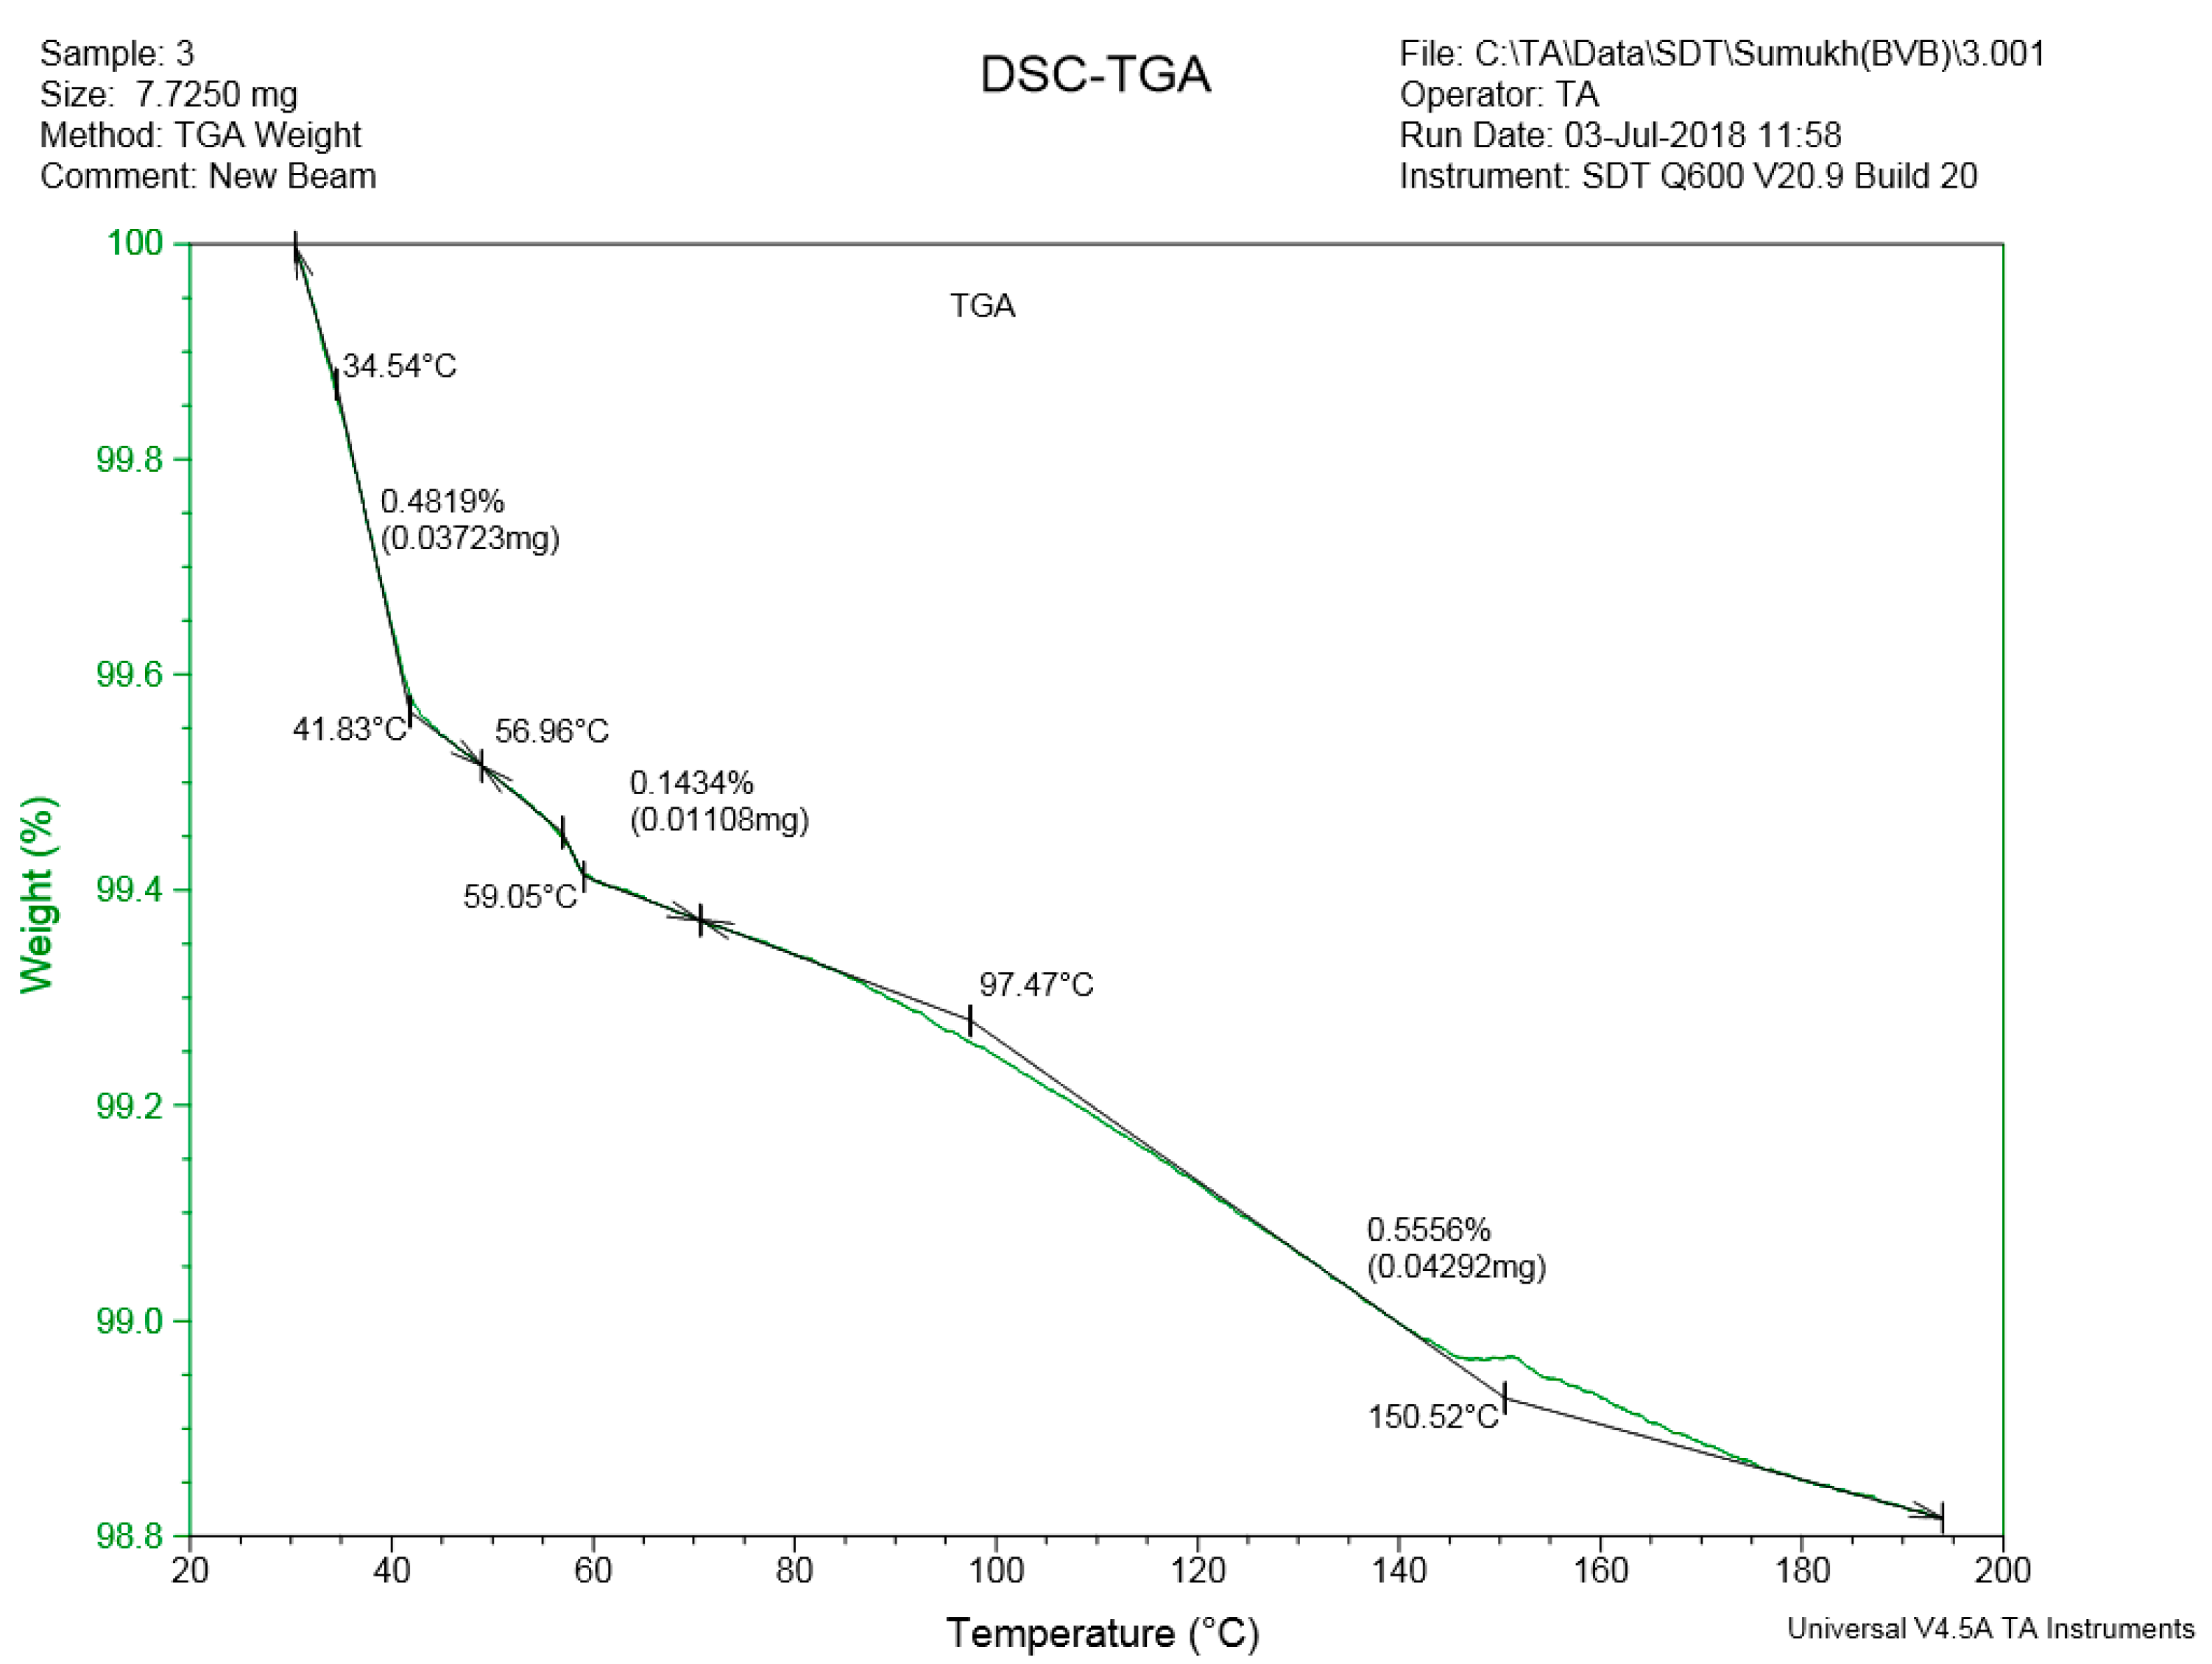
Figure 22.
Weight loss vs. temperature curve for reacted PLA layer.
Figure 22.
Weight loss vs. temperature curve for reacted PLA layer.
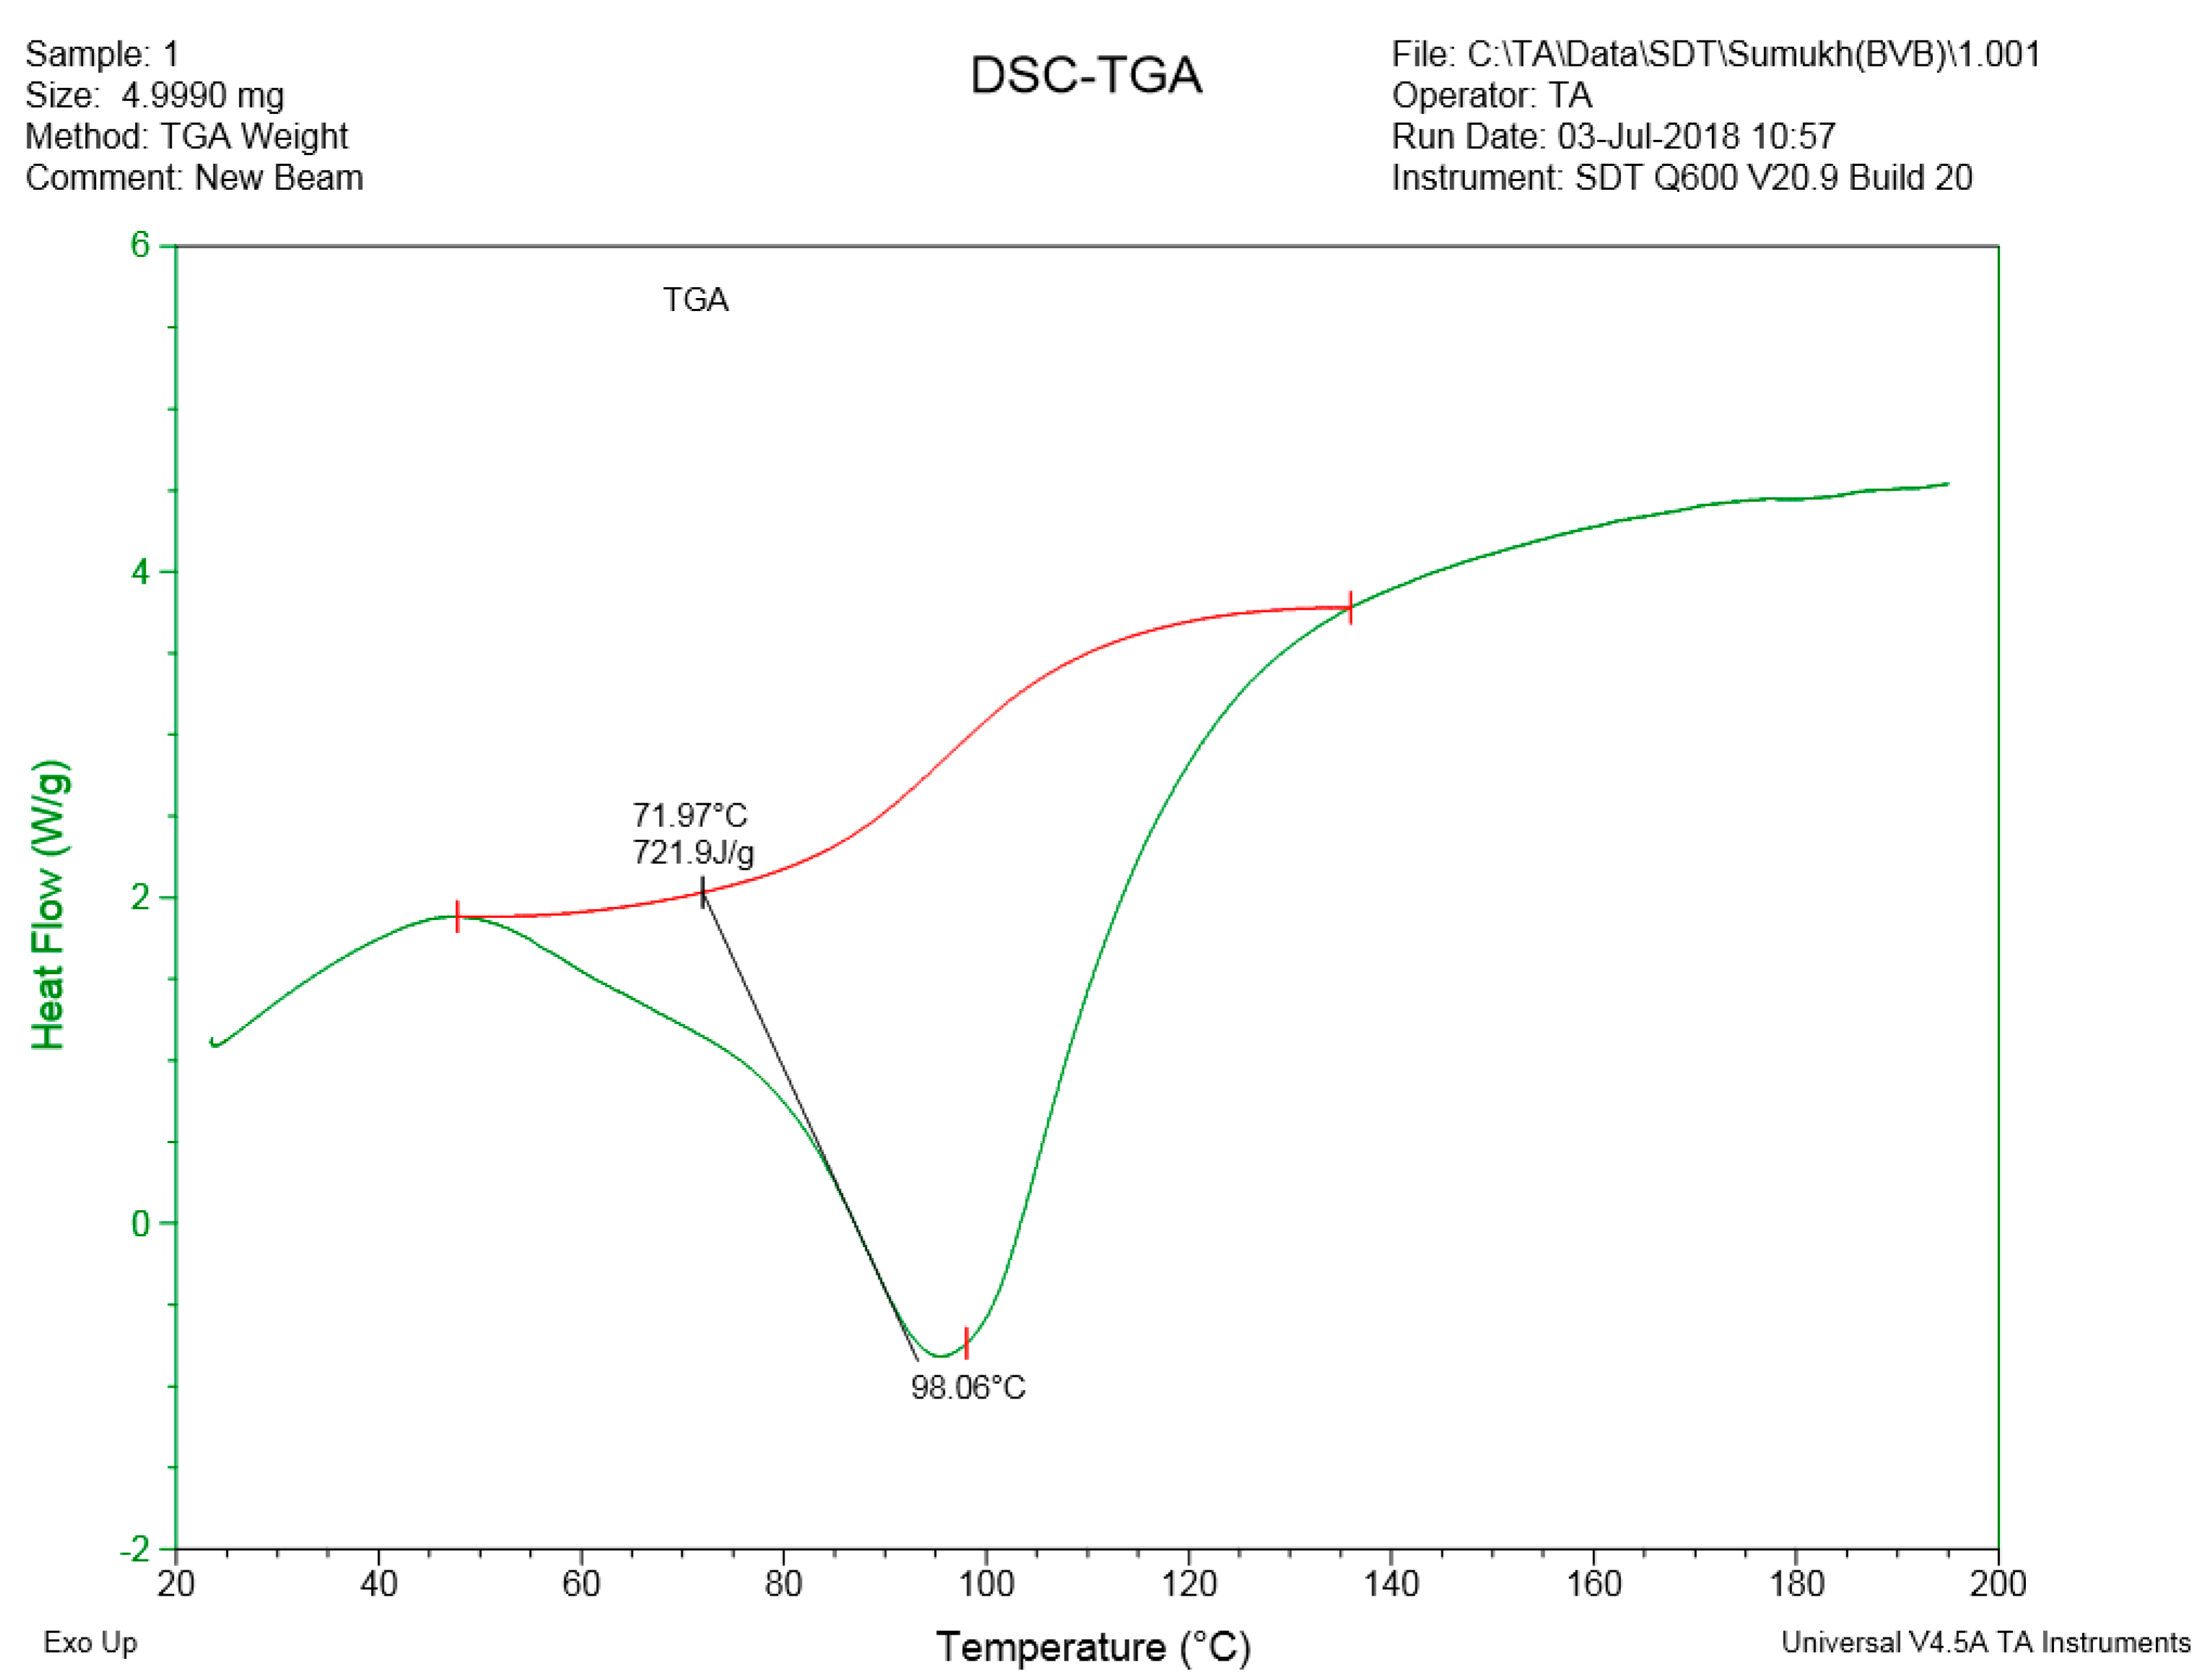
Figure 23.
Heat flow vs. temperature behavior of PLA granules.
Figure 23.
Heat flow vs. temperature behavior of PLA granules.
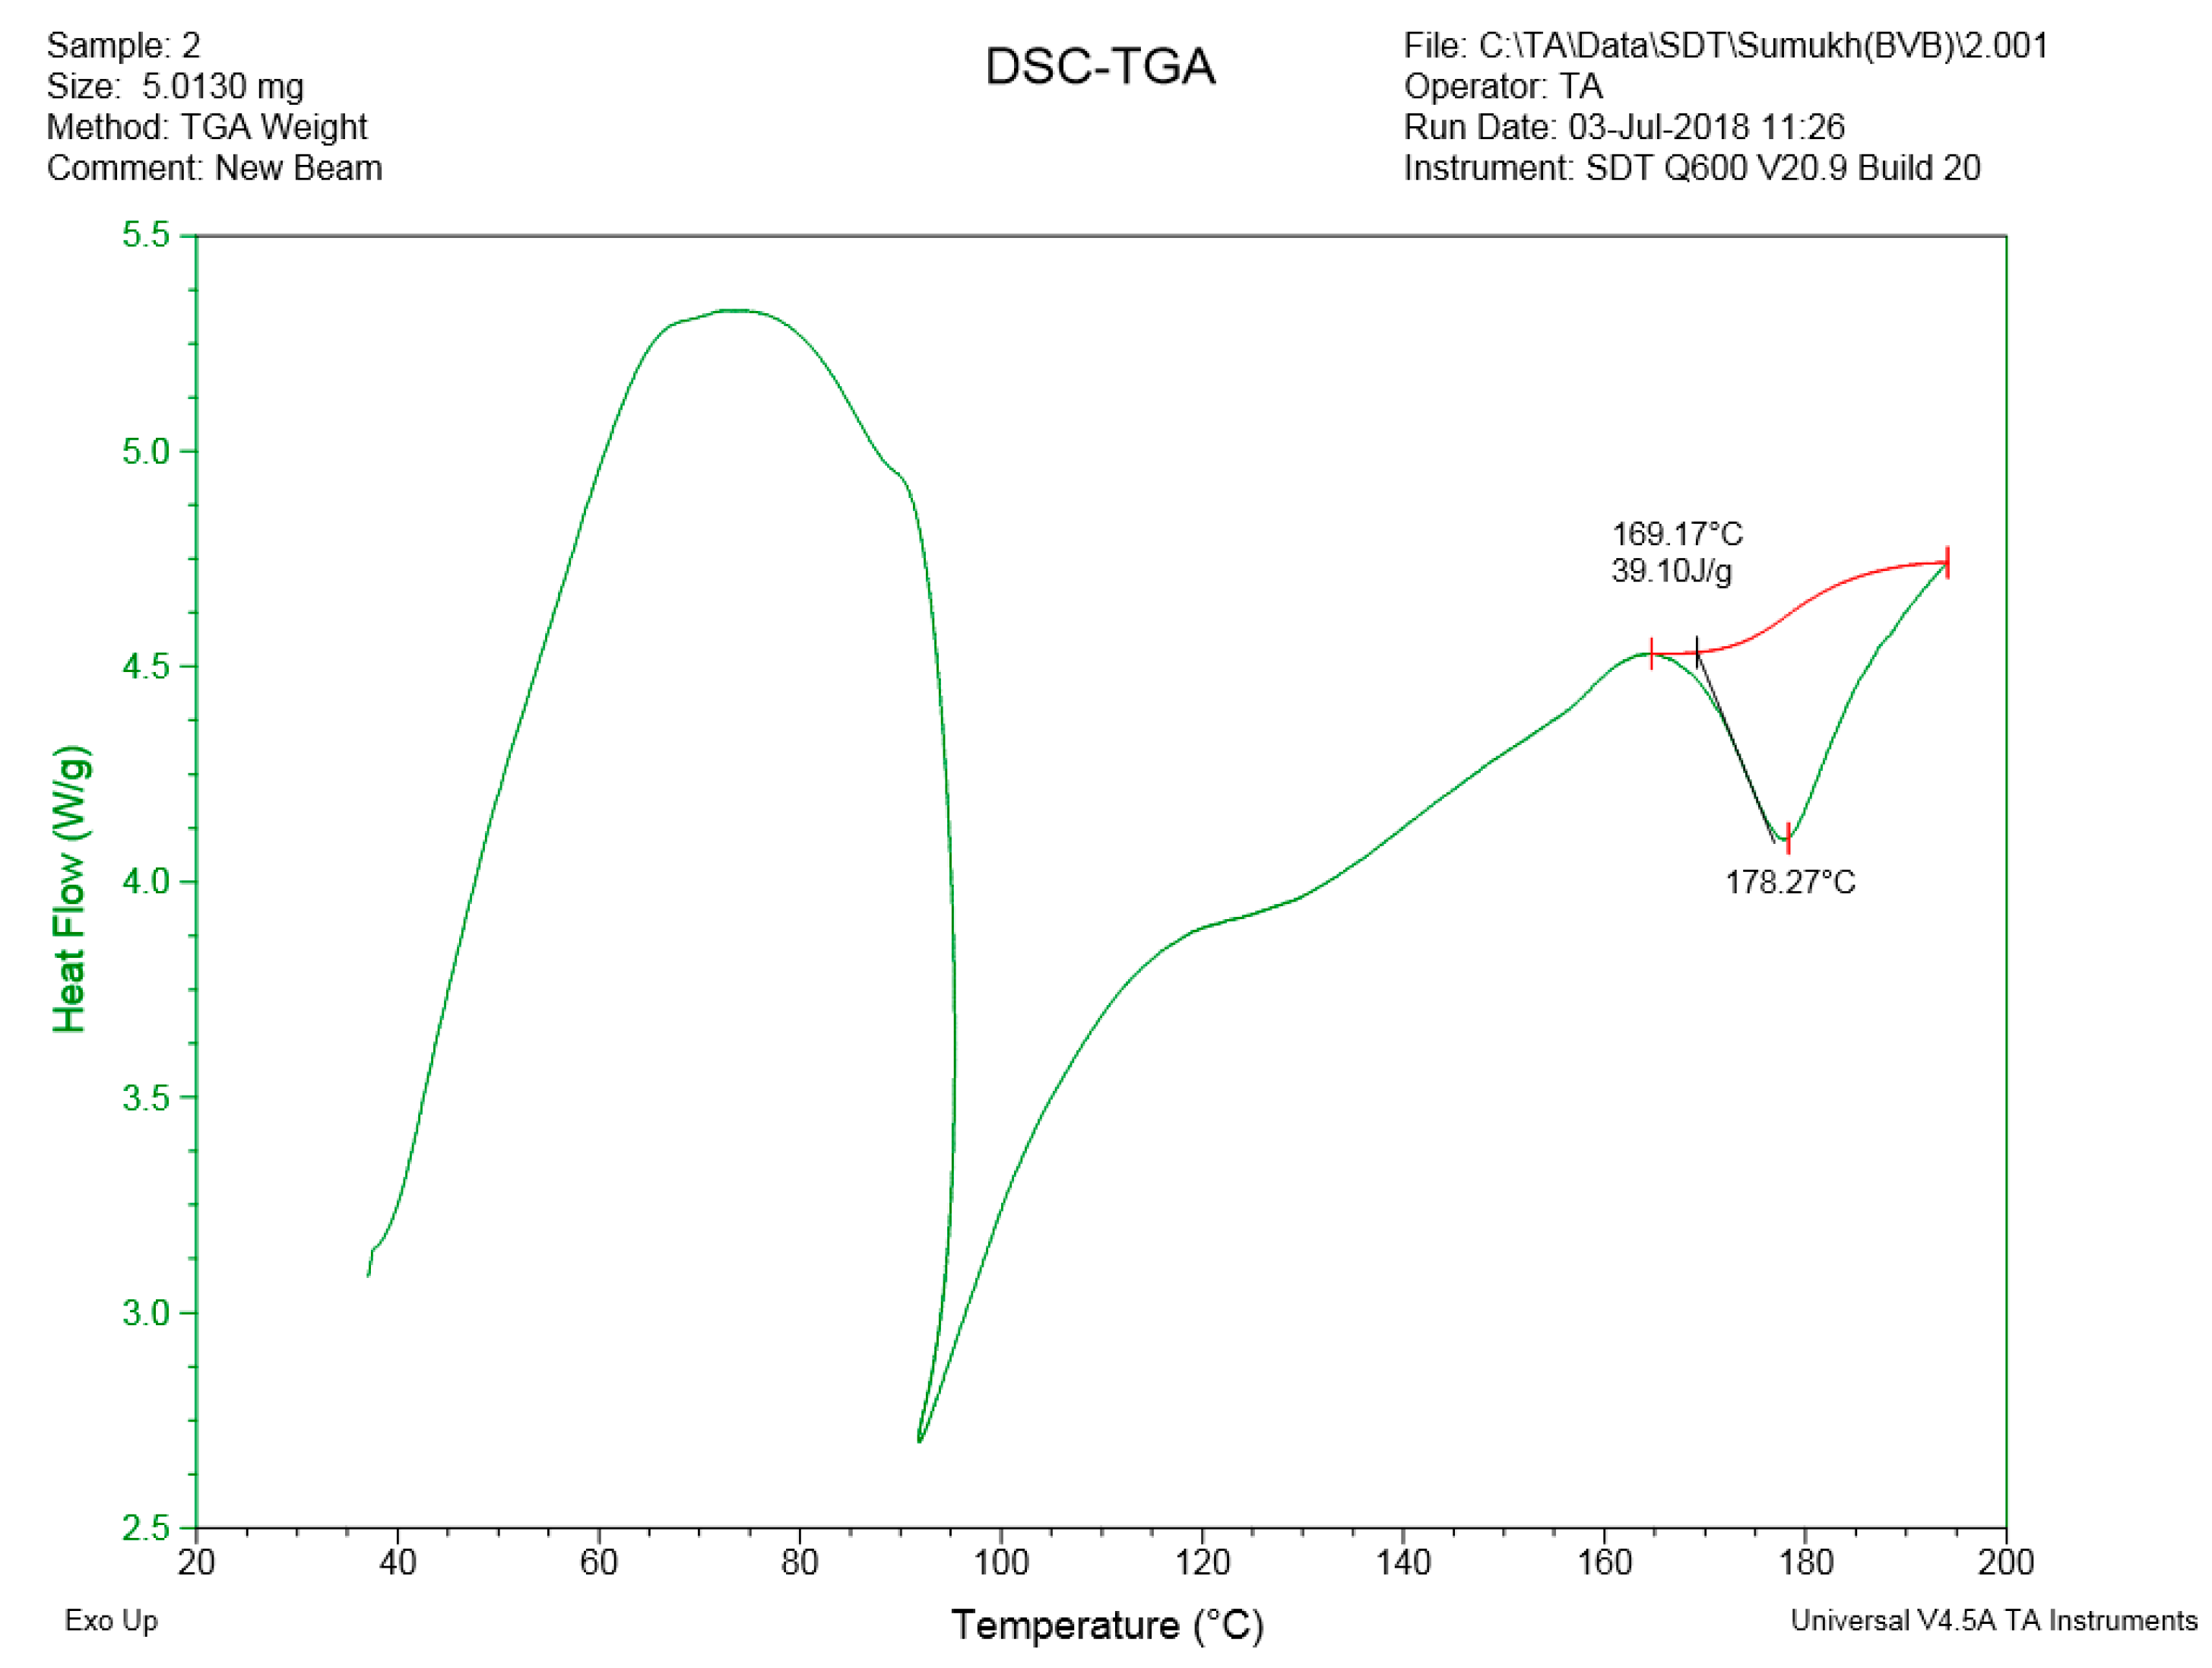
Figure 24.
Heat flow vs. temperature behavior of wired PLA.
Figure 24.
Heat flow vs. temperature behavior of wired PLA.
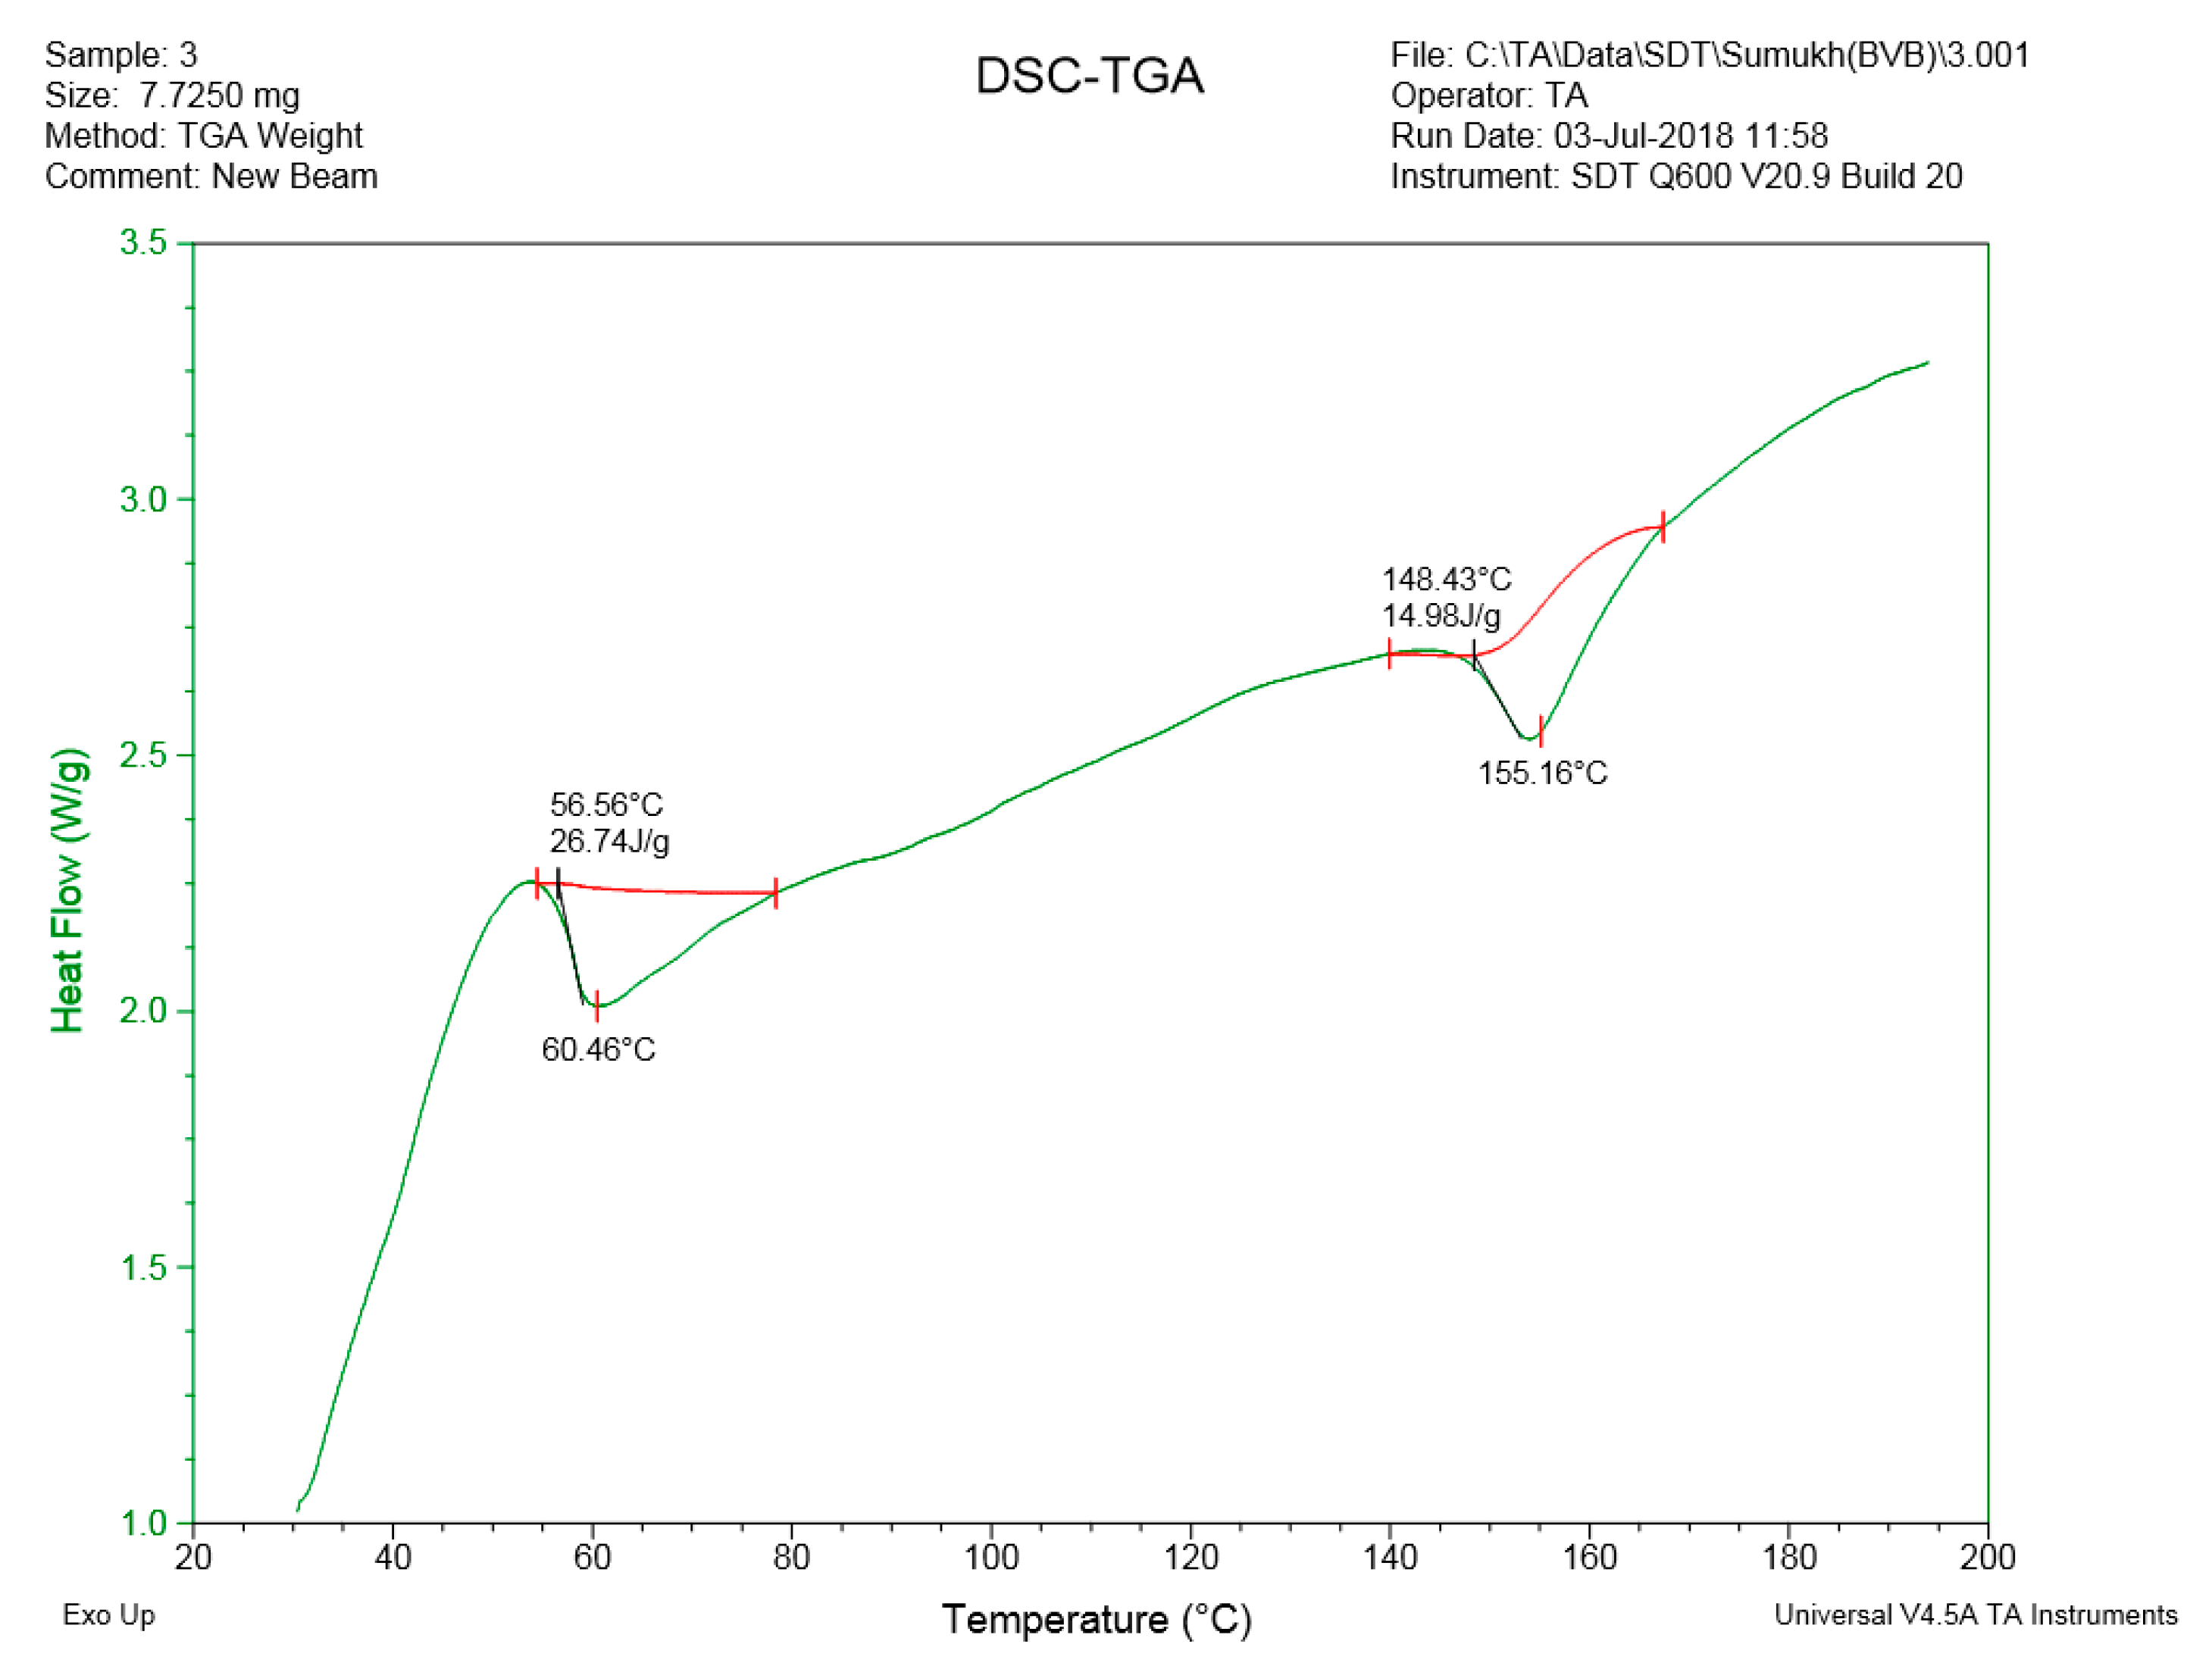
Figure 25.
Heat flow vs. temperature behavior of reacted PLA layer.
Figure 25.
Heat flow vs. temperature behavior of reacted PLA layer.
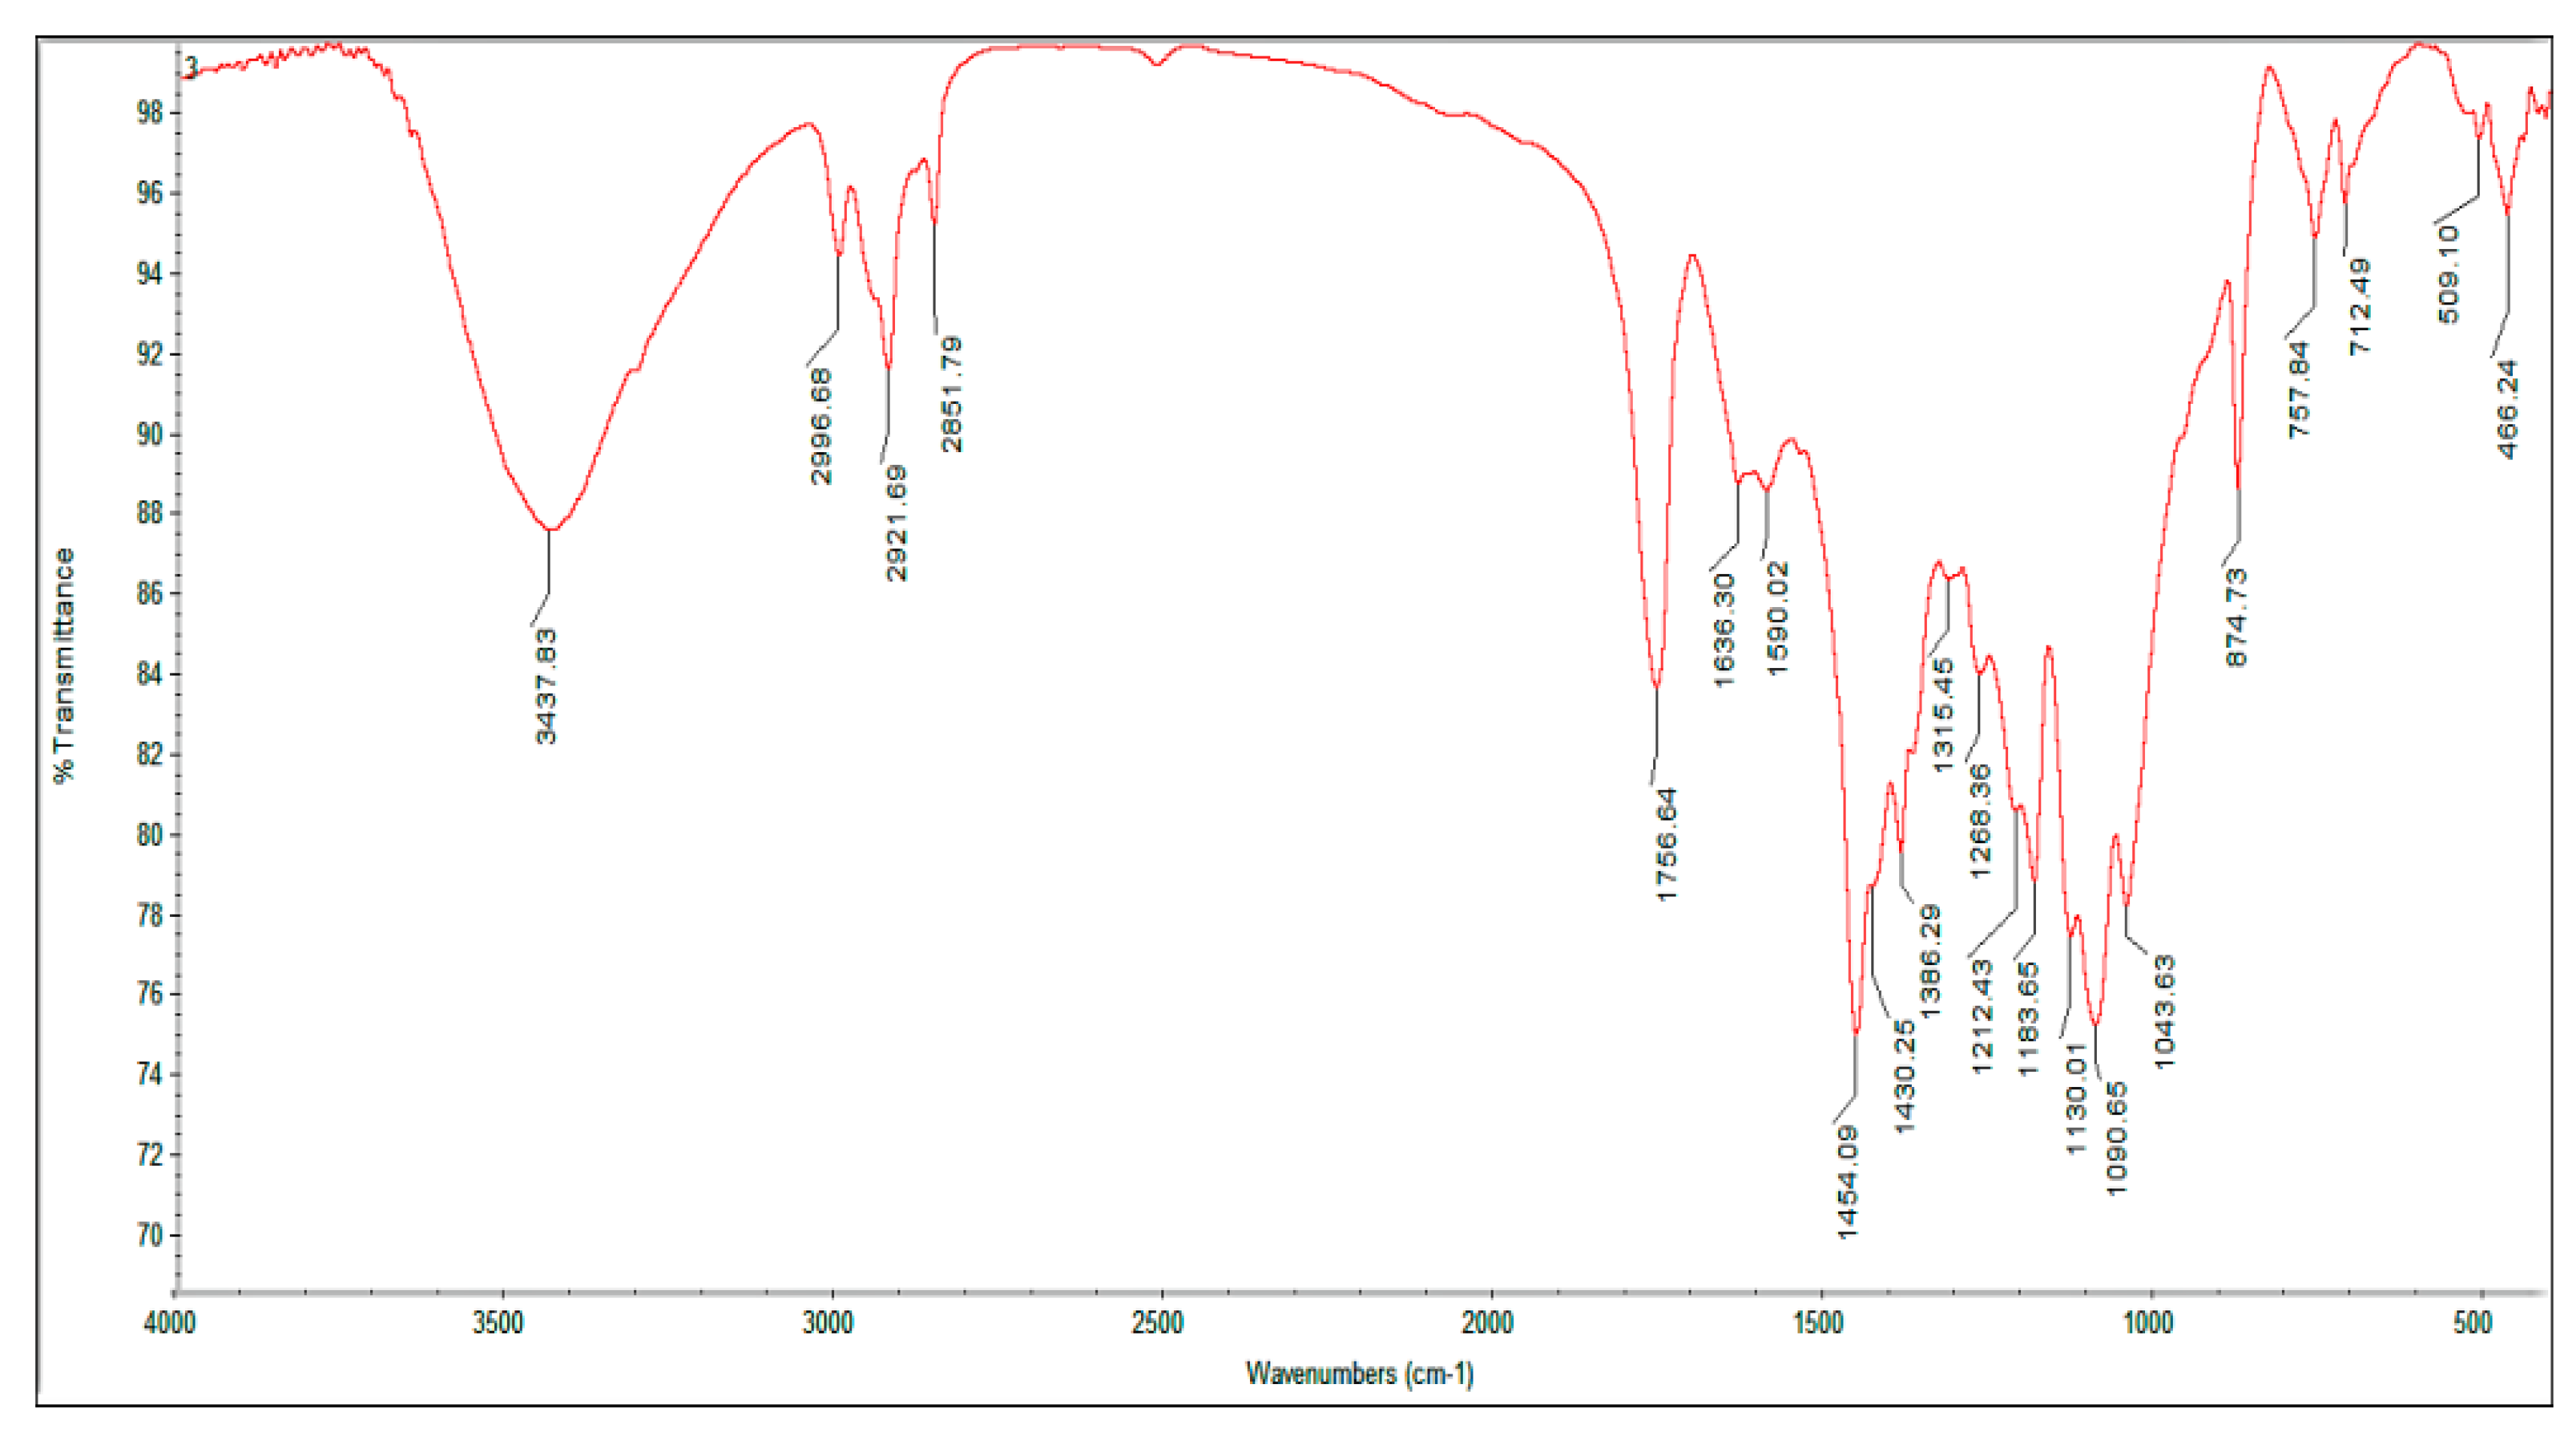
Figure 26.
Bands in IR spectrum of PLA granules.
Figure 26.
Bands in IR spectrum of PLA granules.
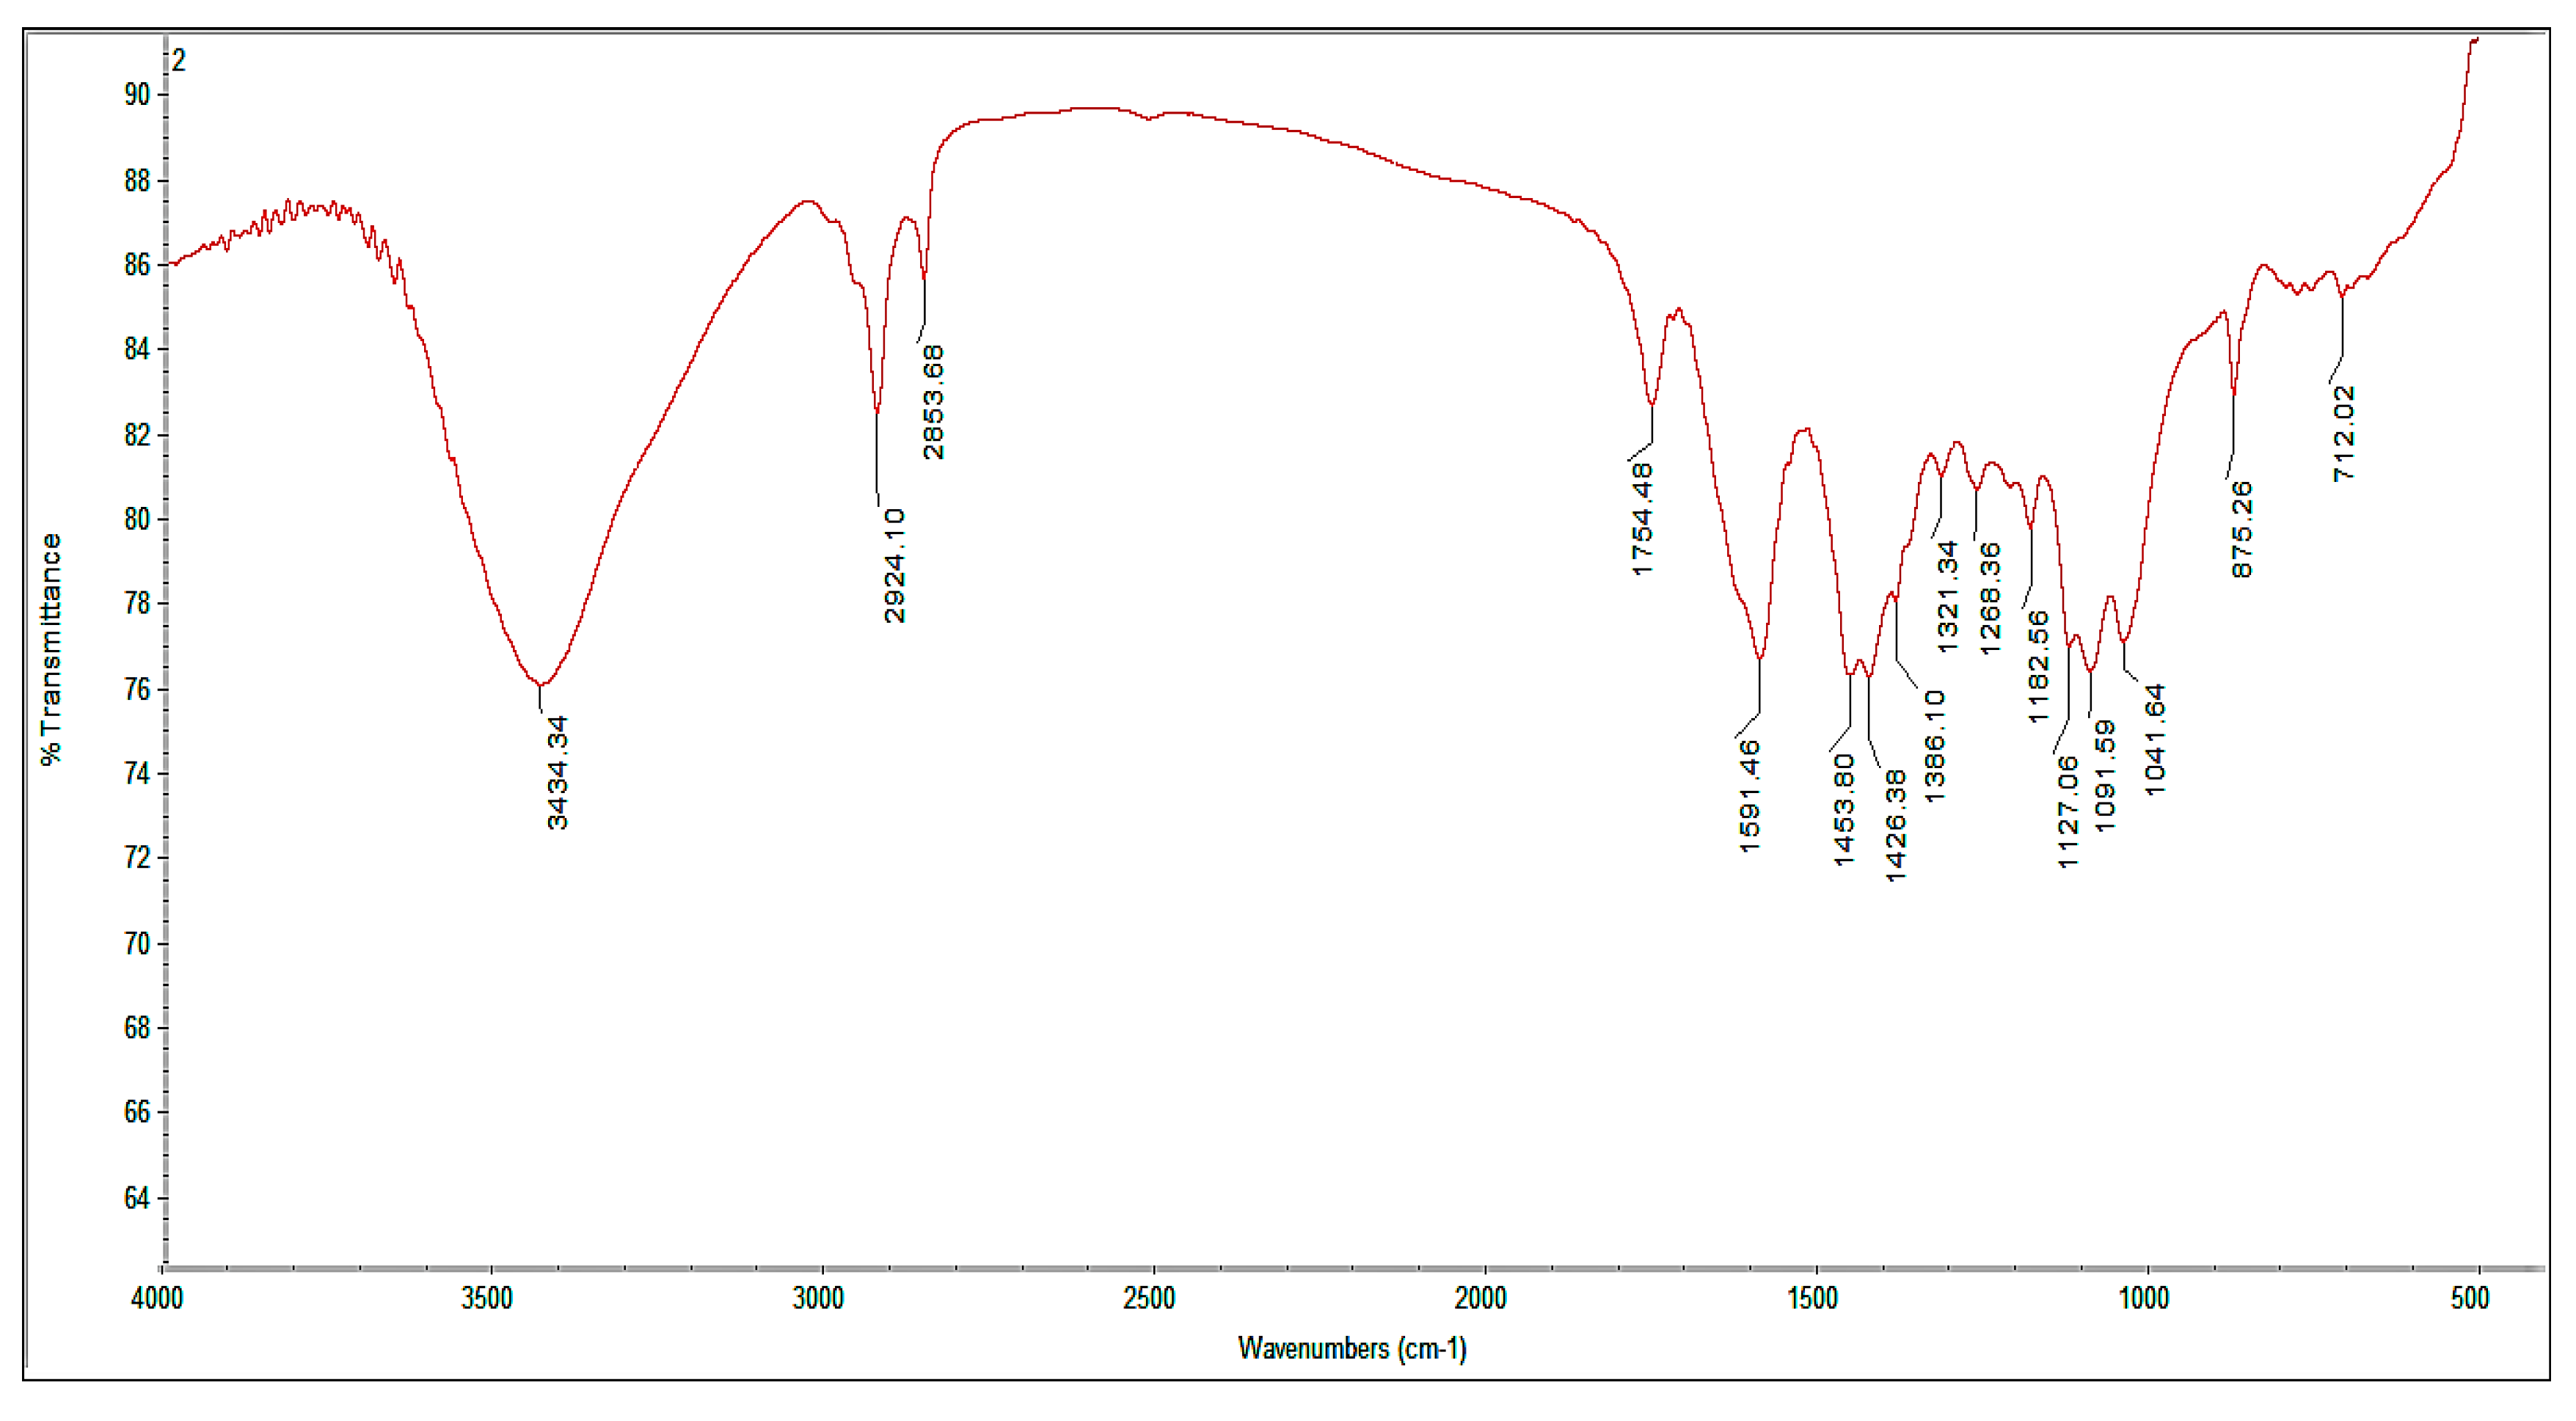
Figure 27.
Bands in IR spectrum of PLA in wired form.
Figure 27.
Bands in IR spectrum of PLA in wired form.
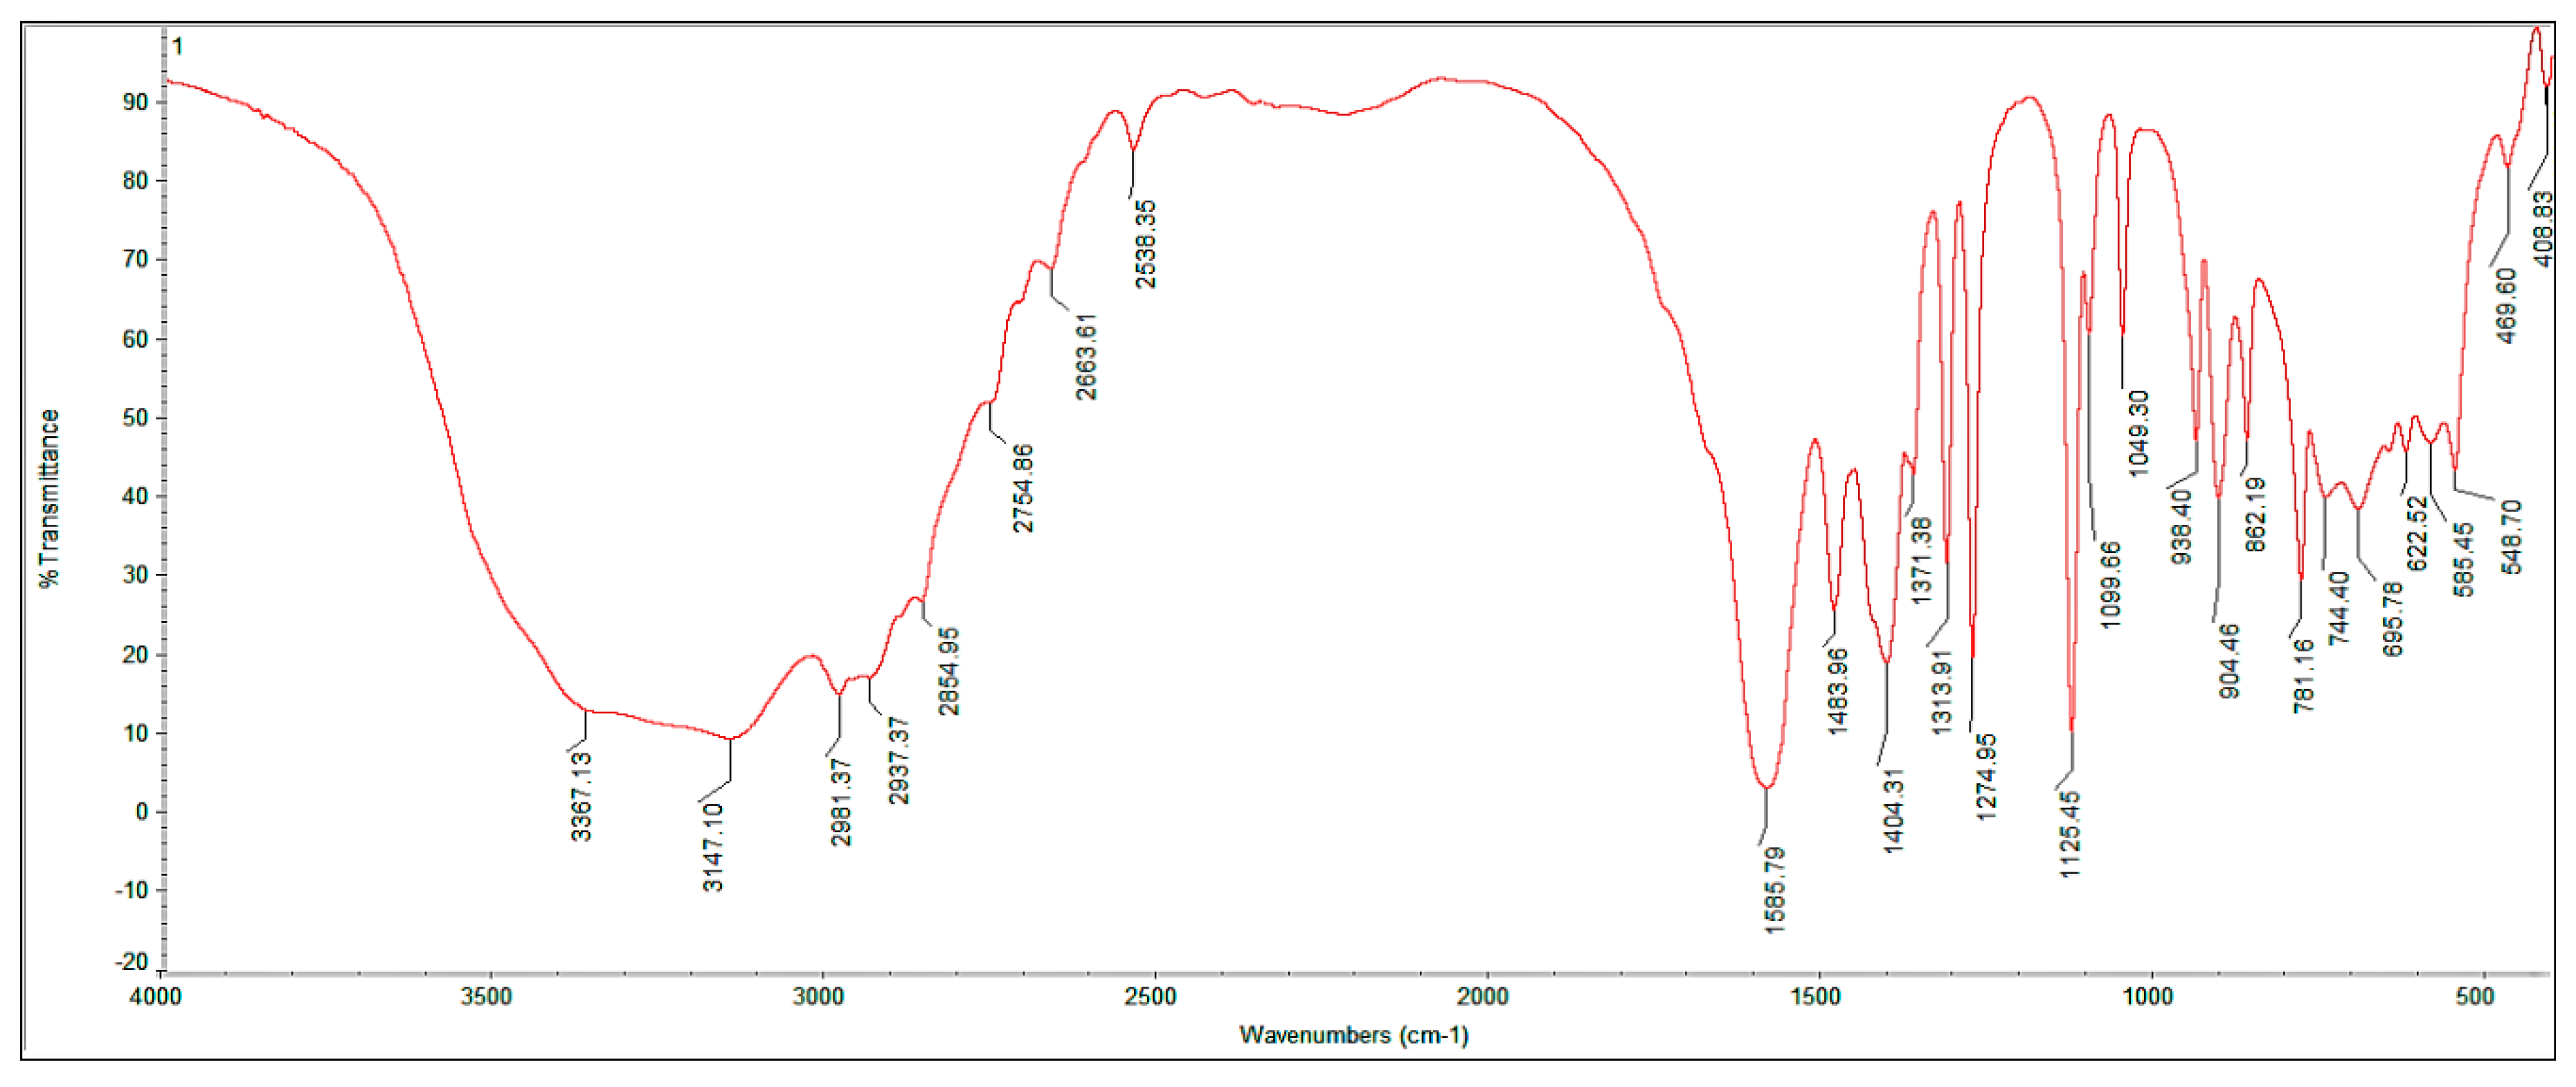
Figure 28.
Bands in IR spectrum of a reacted layer on PLA granule.
Figure 28.
Bands in IR spectrum of a reacted layer on PLA granule.
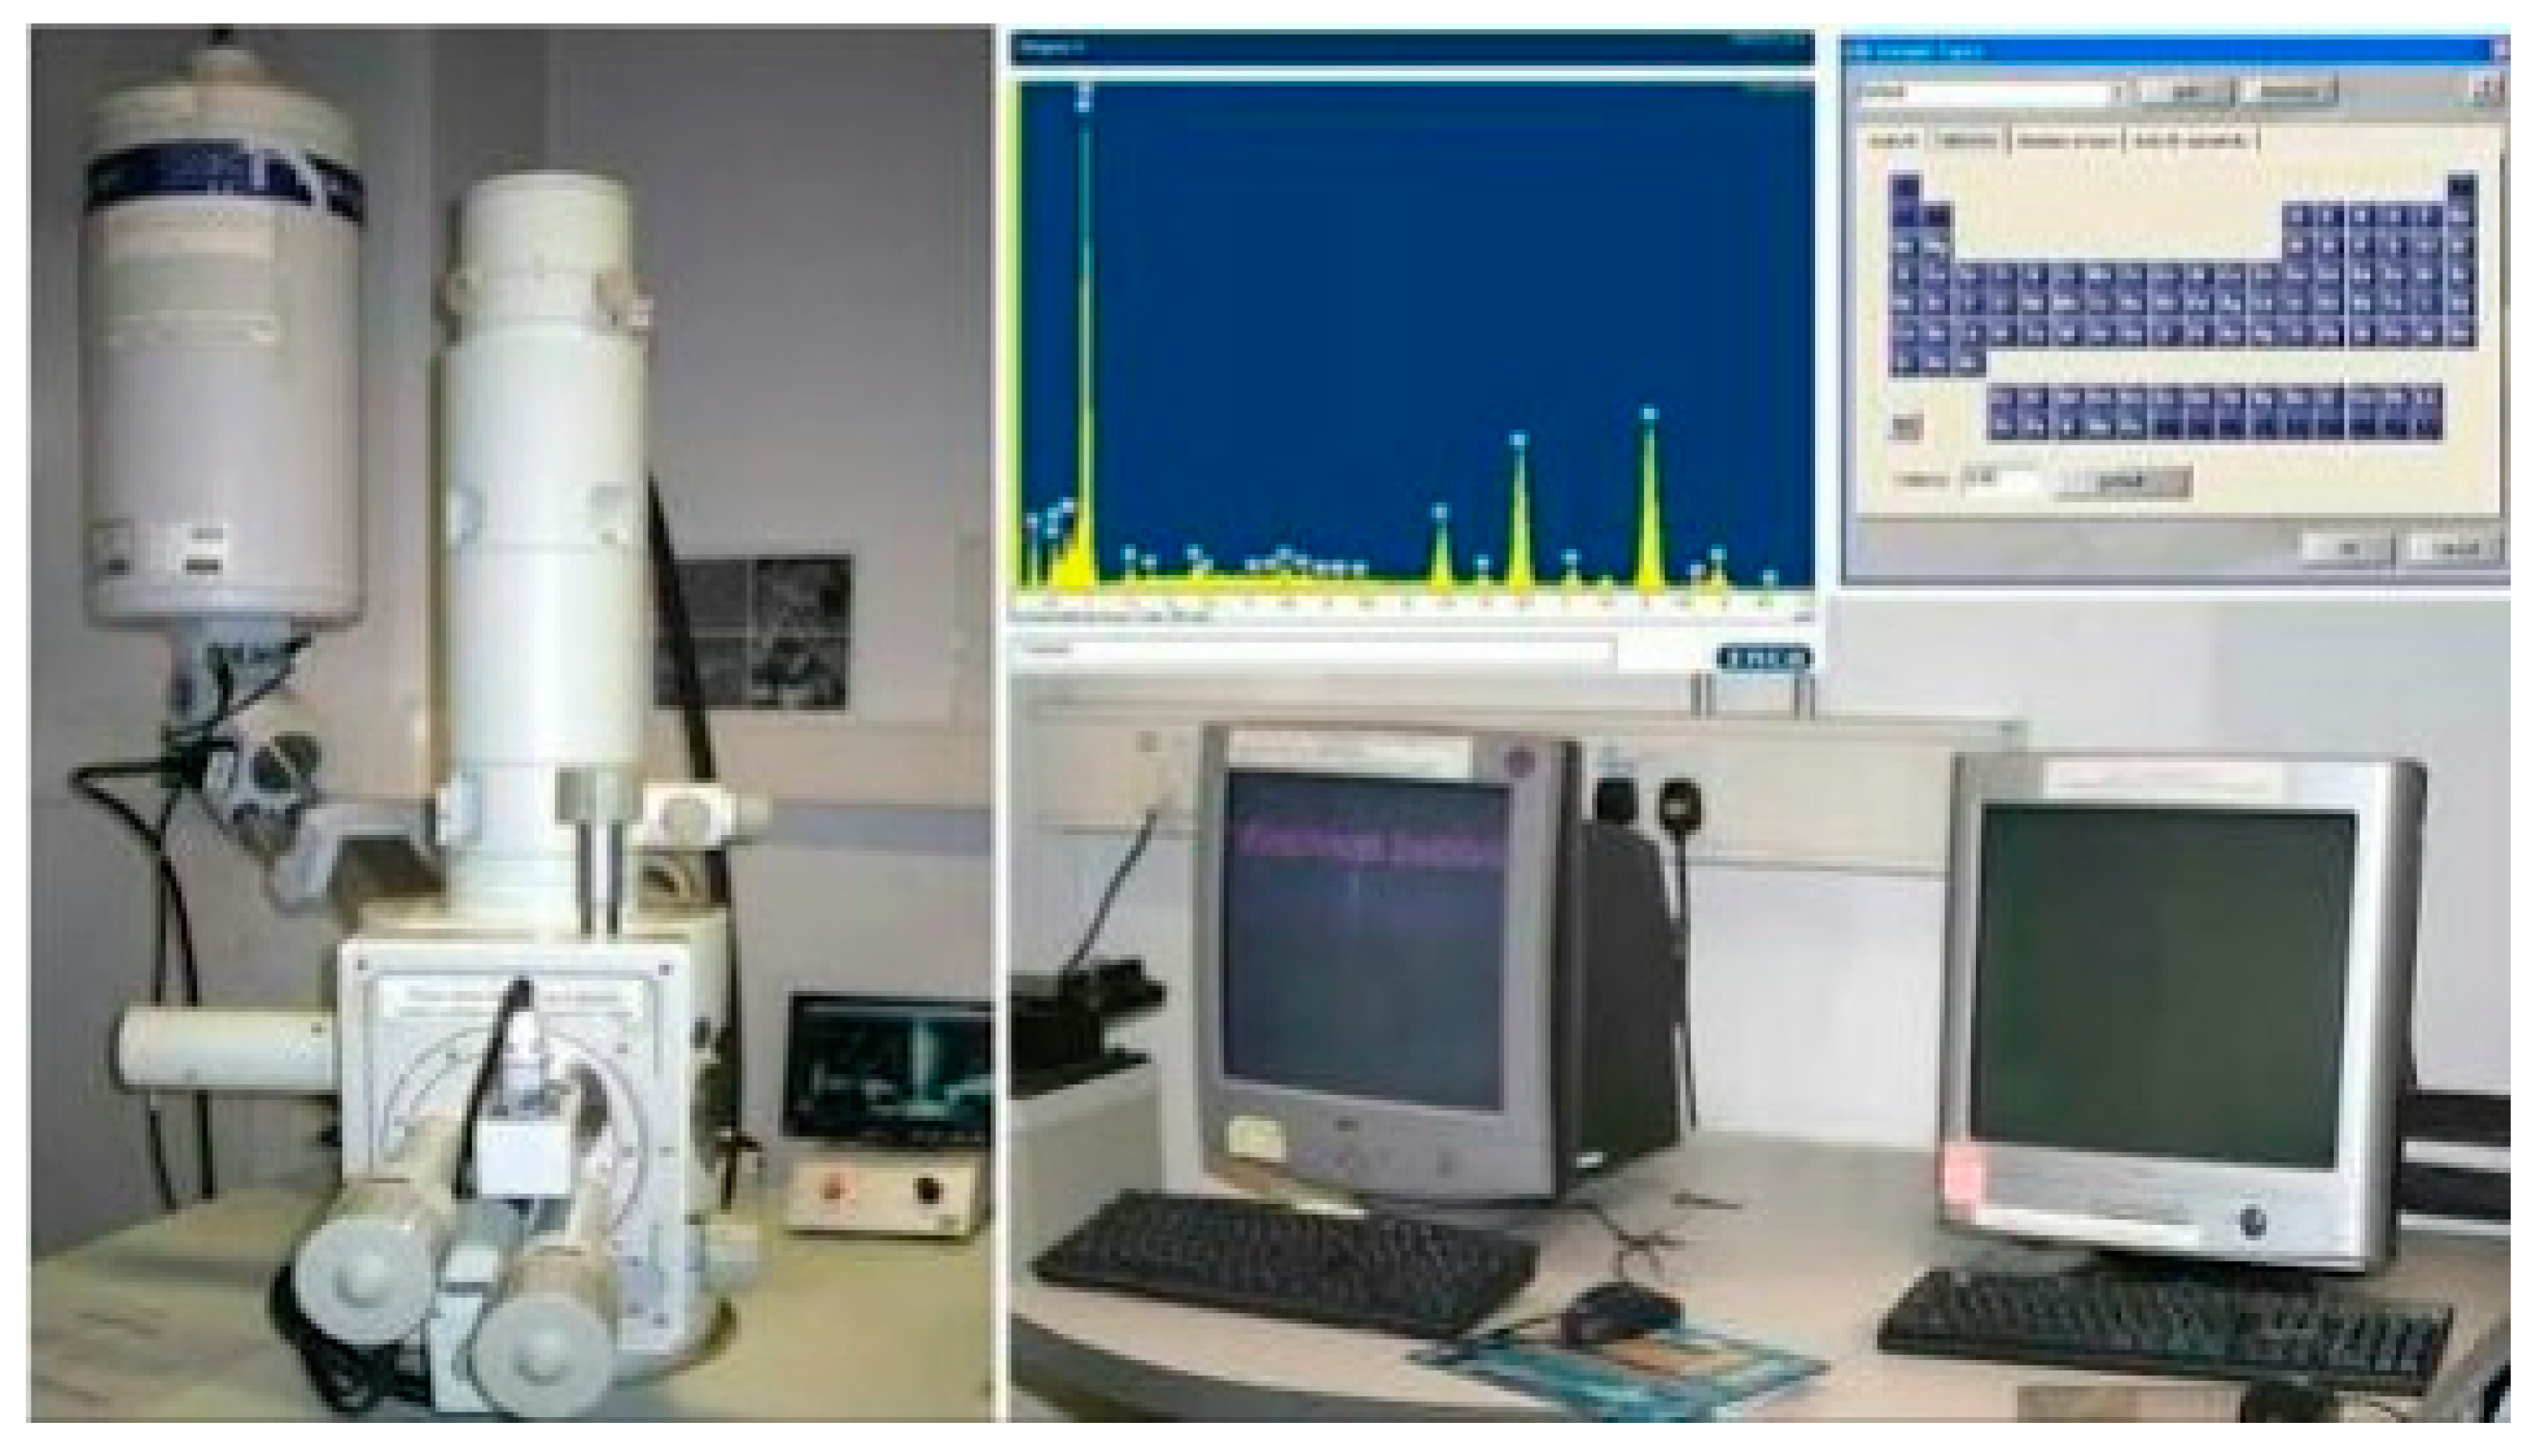
Figure 29.
EDX (Energy-Dispersive X-Ray Spectroscopy) equipment (Courtesy of CMTI, Bangalore).
Figure 29.
EDX (Energy-Dispersive X-Ray Spectroscopy) equipment (Courtesy of CMTI, Bangalore).
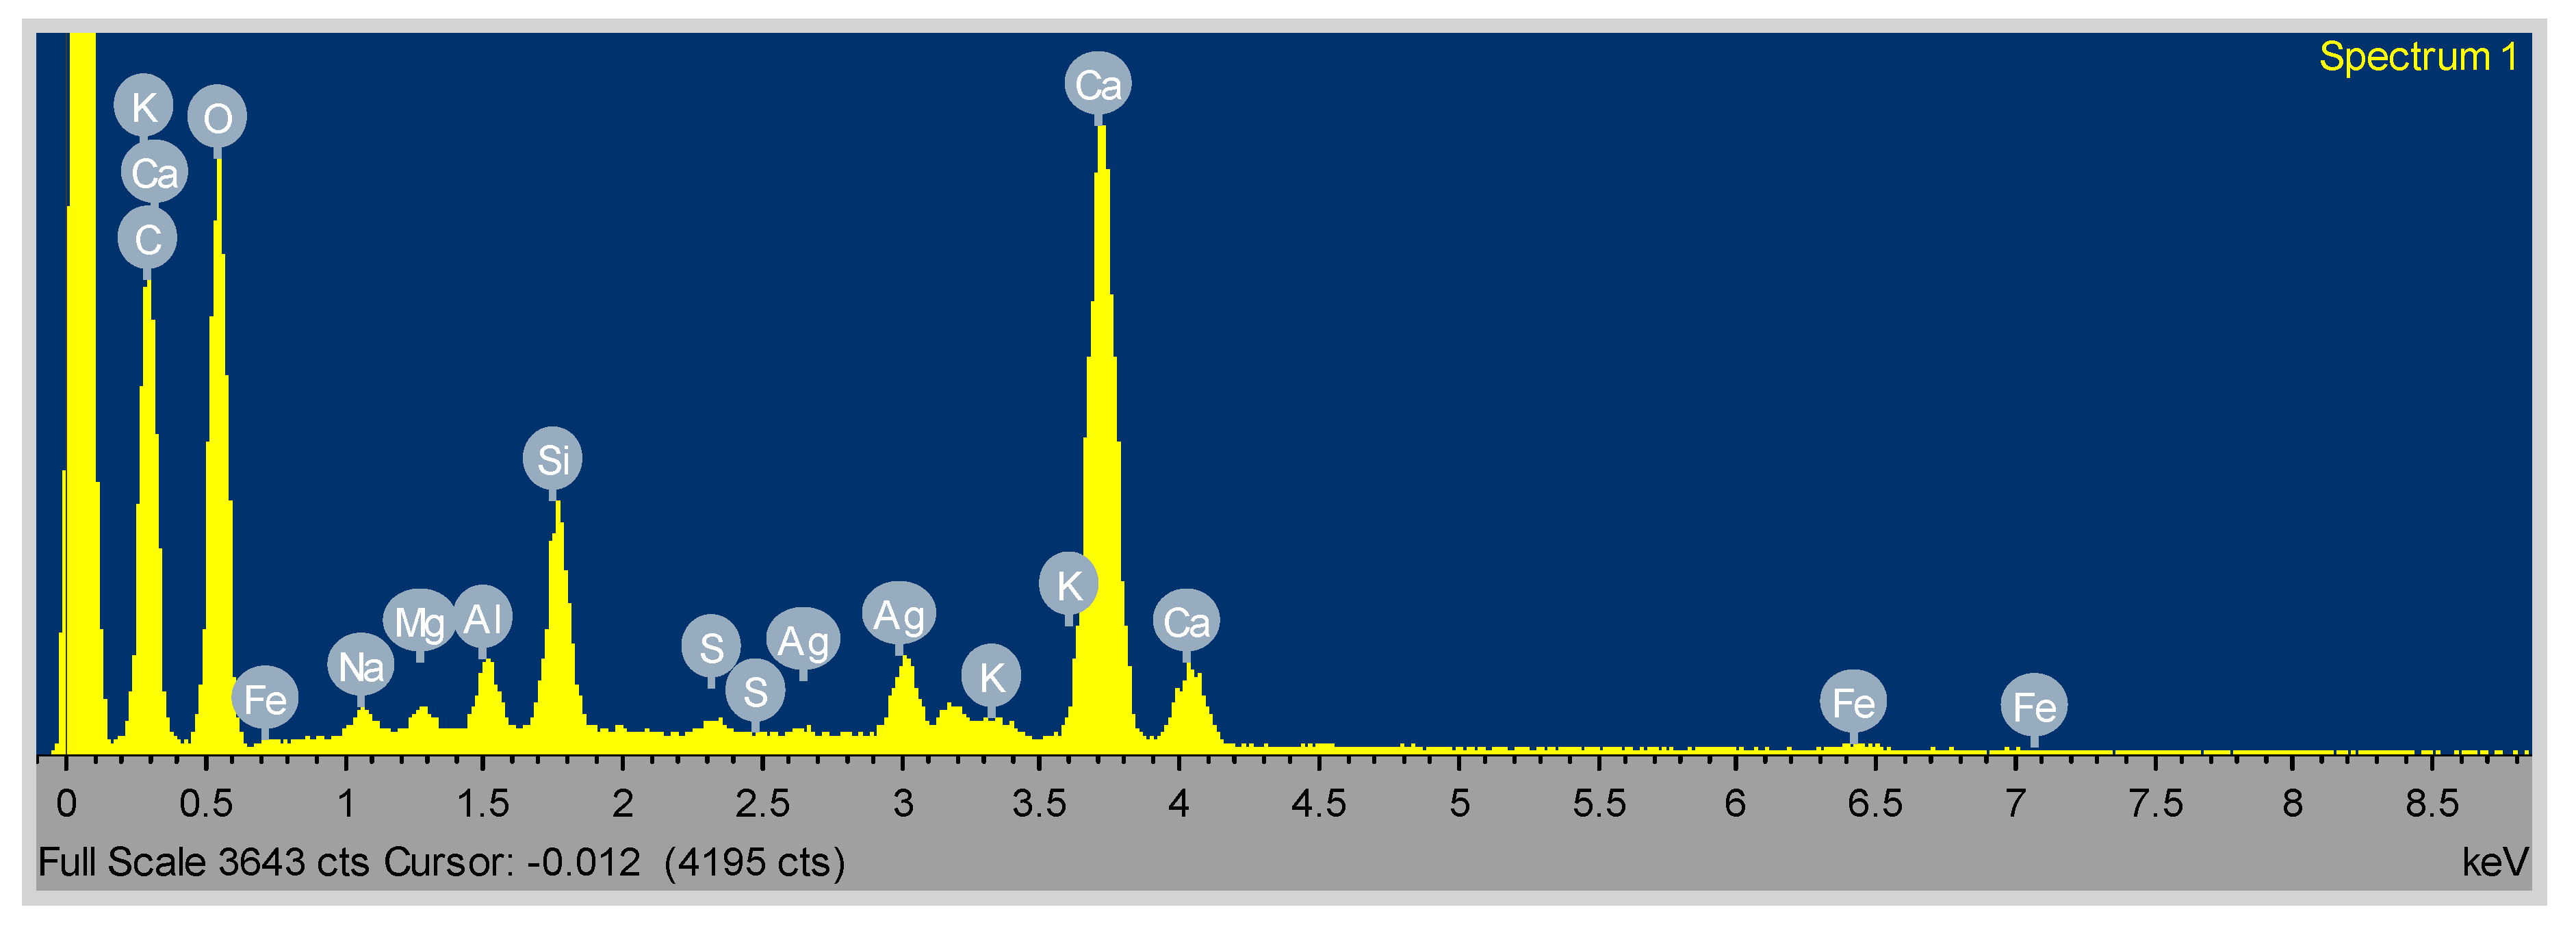
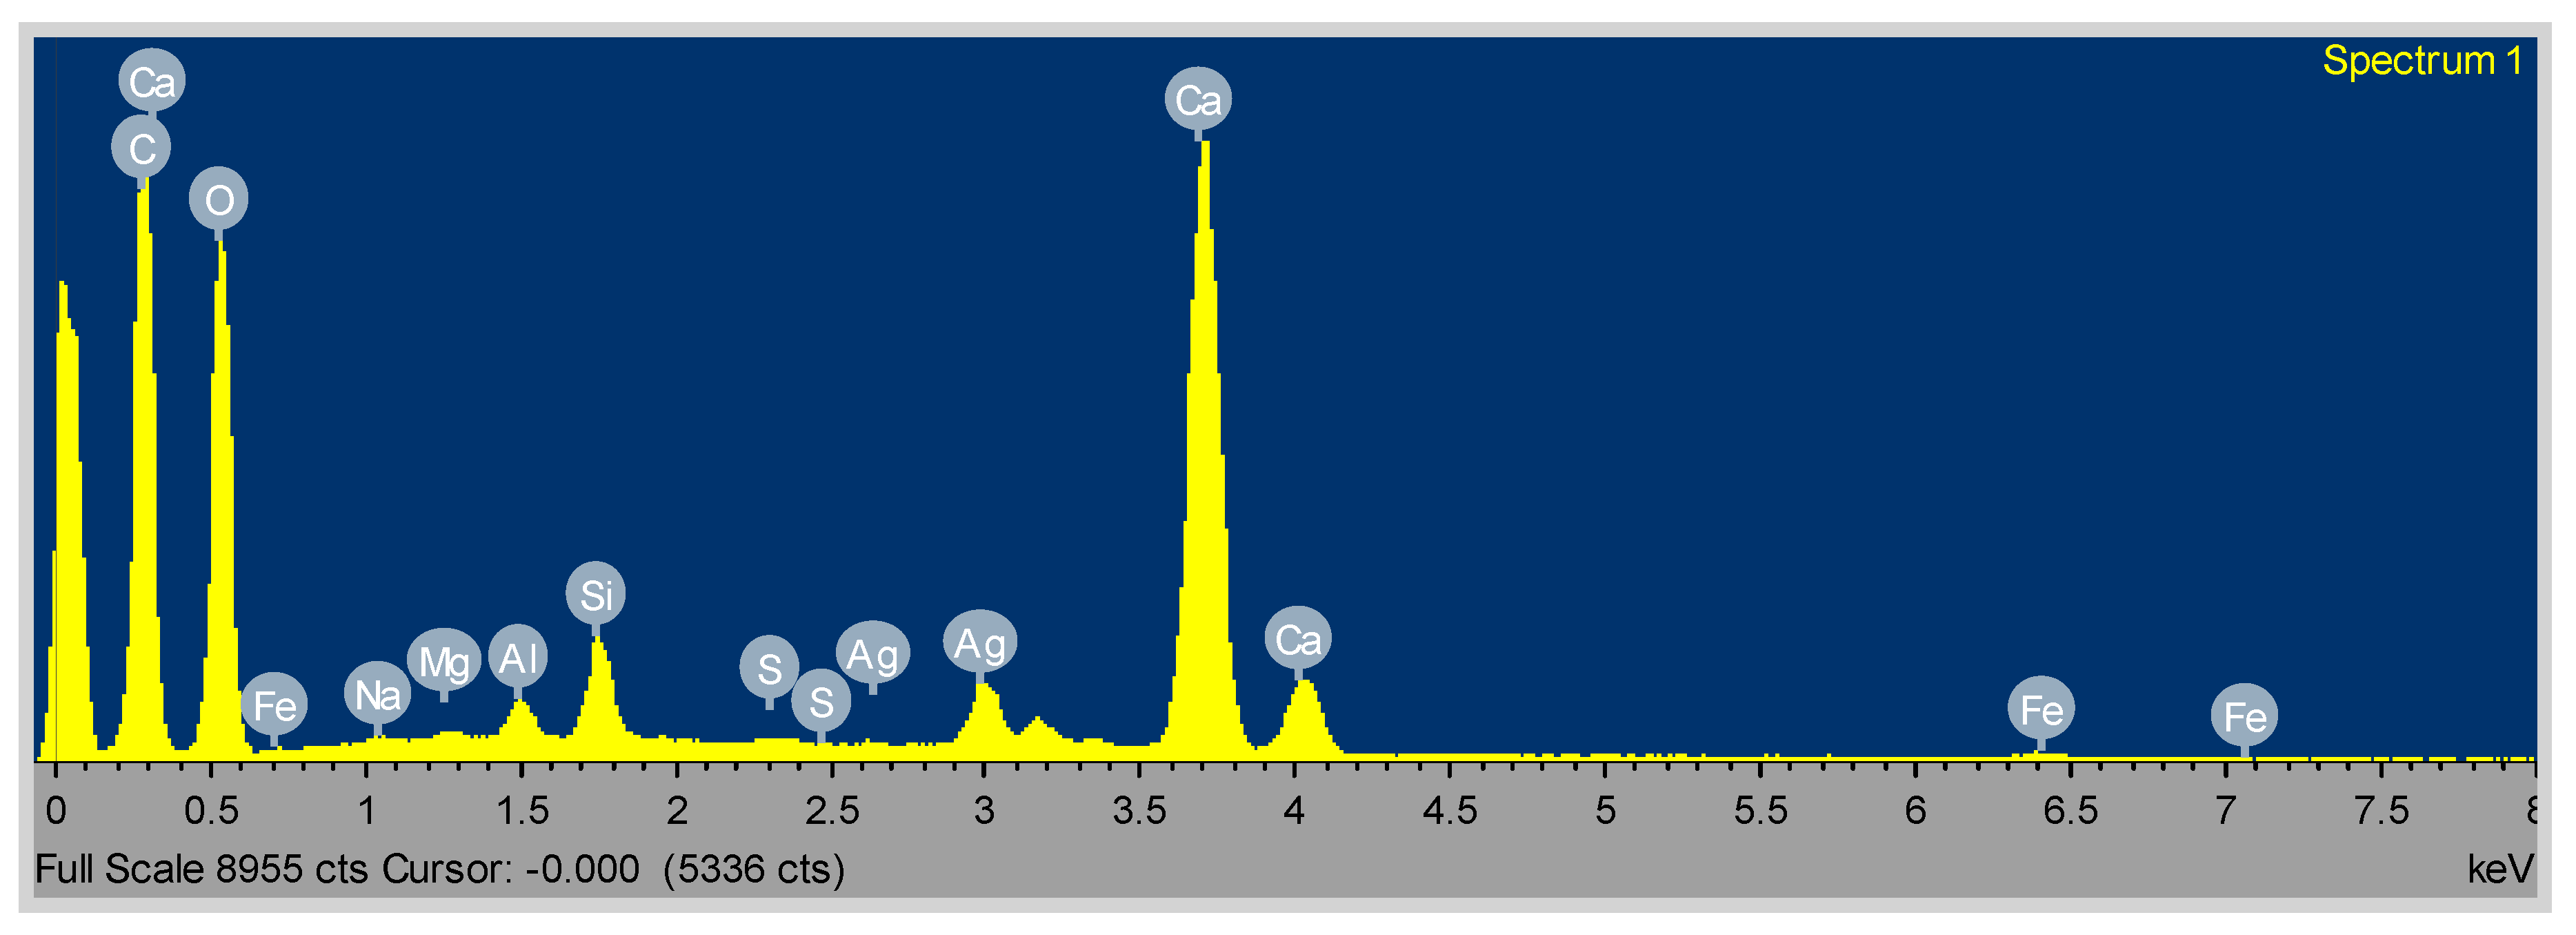
Figure 30.
EDX spectrum of conventional concrete.
Figure 30.
EDX spectrum of conventional concrete.
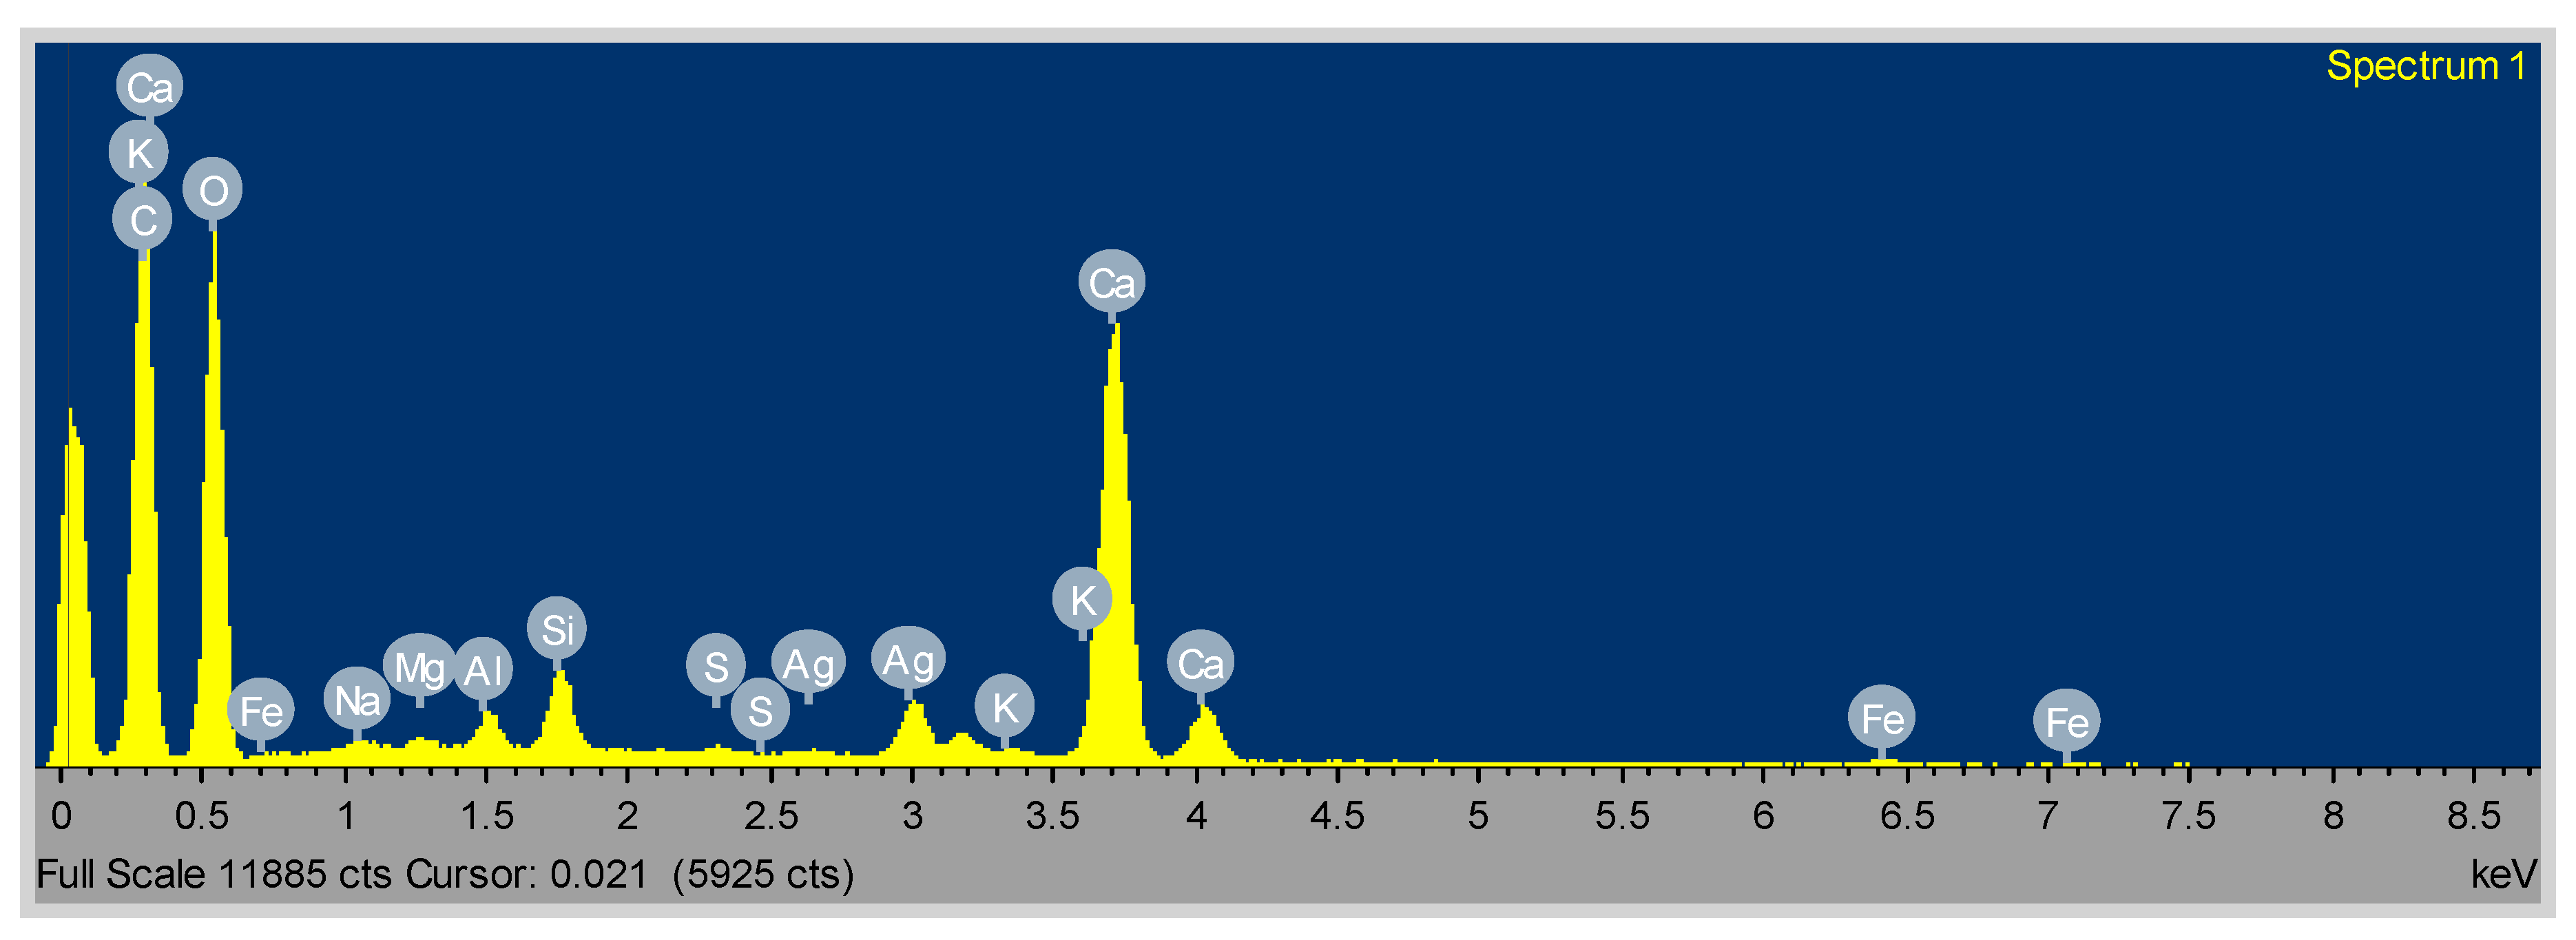
Figure 31.
EDX spectrum of 10% PLA used a concrete sample.
Figure 31.
EDX spectrum of 10% PLA used a concrete sample.
Figure 32.
EDX spectrum of 30% PLA used a concrete sample.
Figure 32.
EDX spectrum of 30% PLA used a concrete sample.
Figure 33.
EDX spectrum of 50% PLA used a concrete sample.
Figure 33.
EDX spectrum of 50% PLA used a concrete sample.
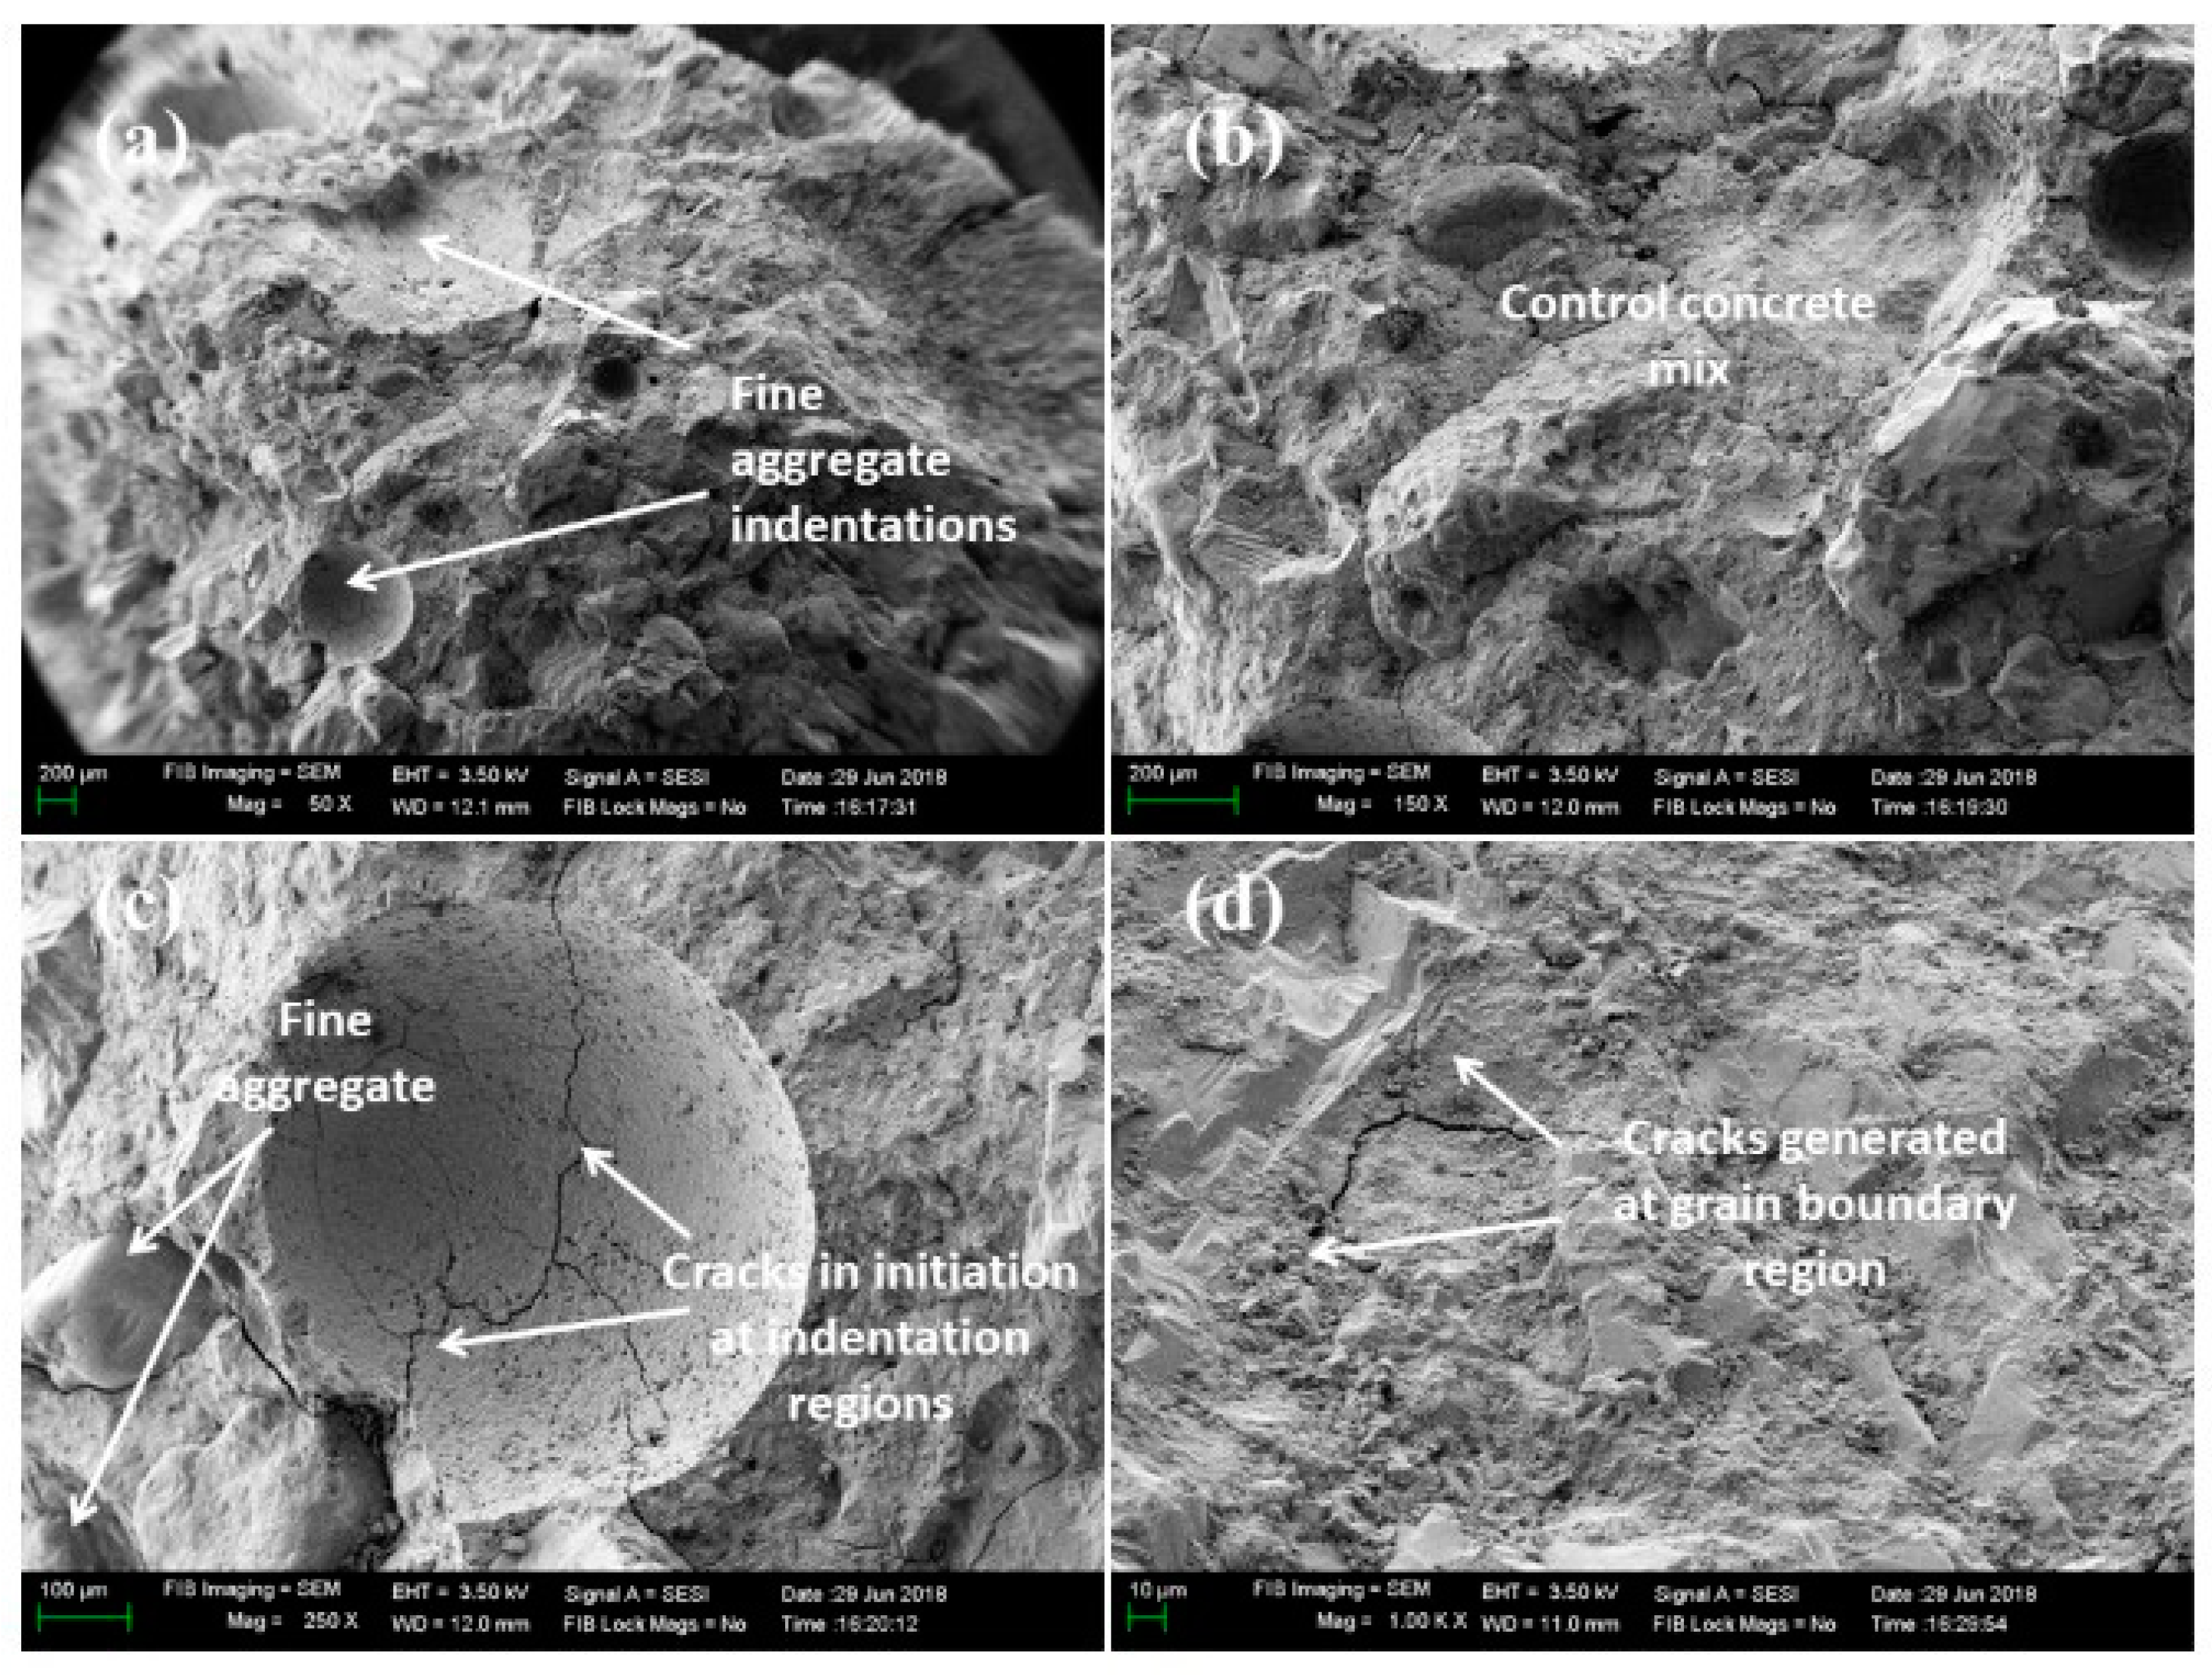
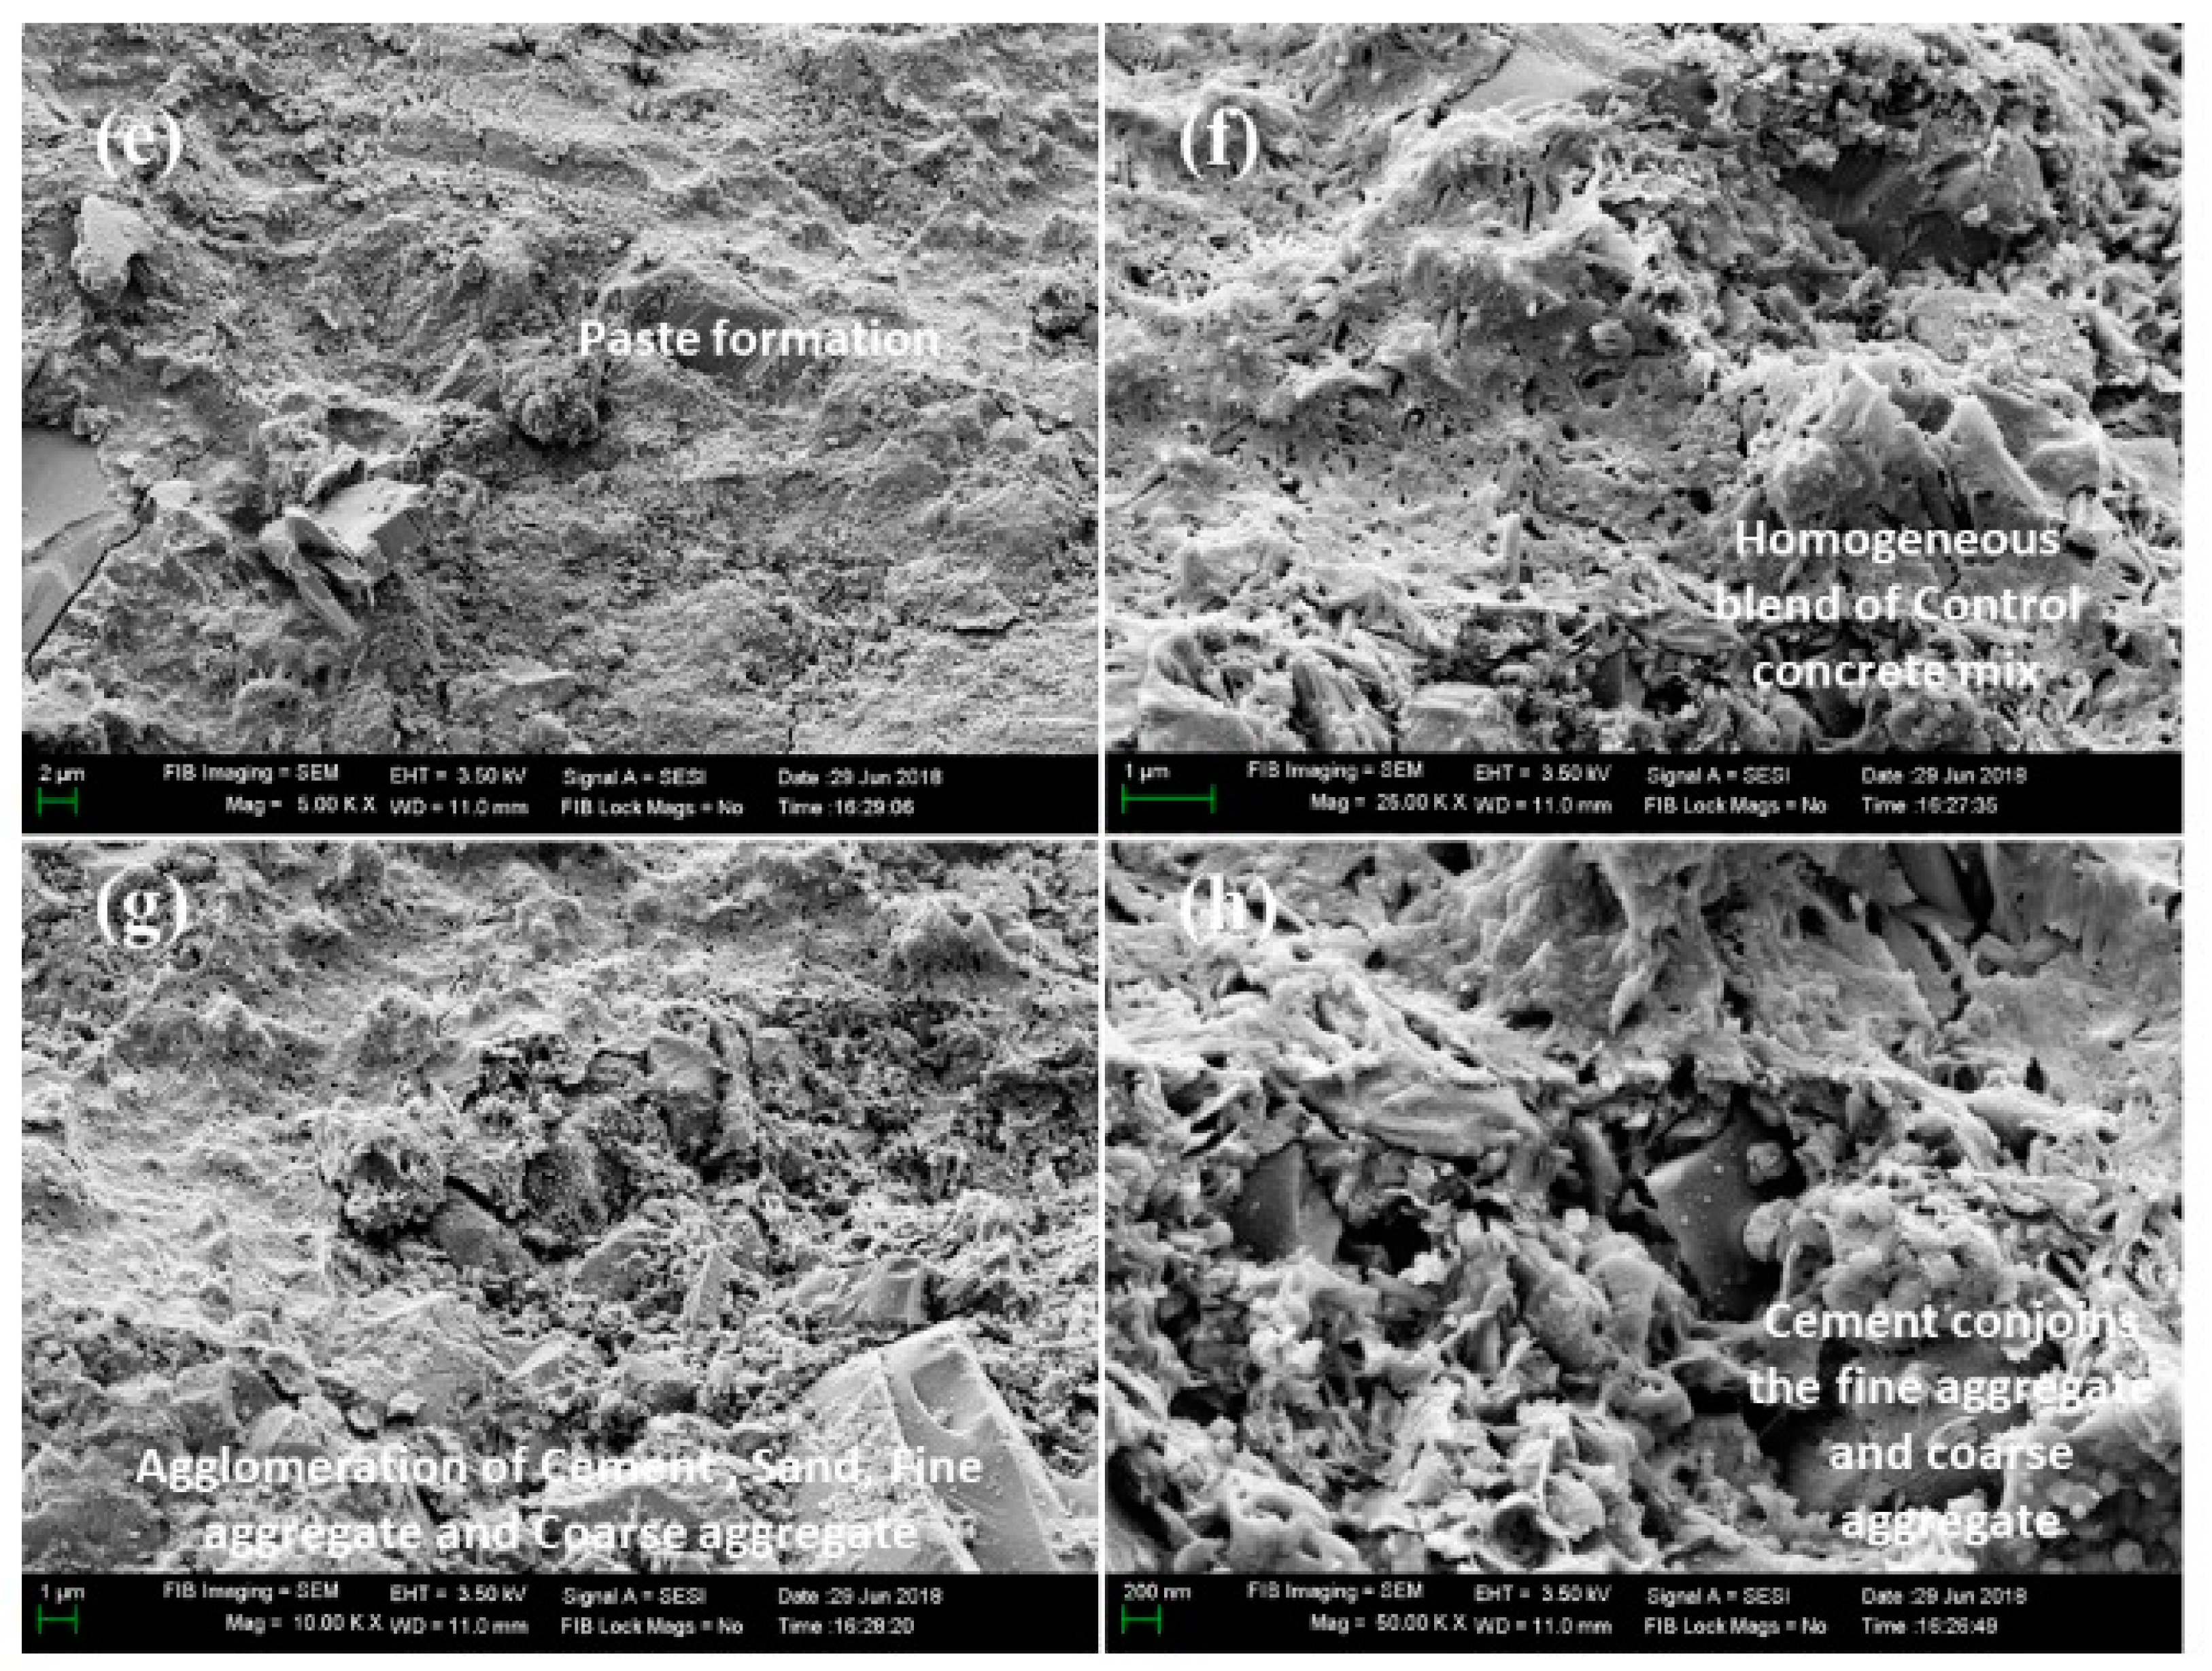
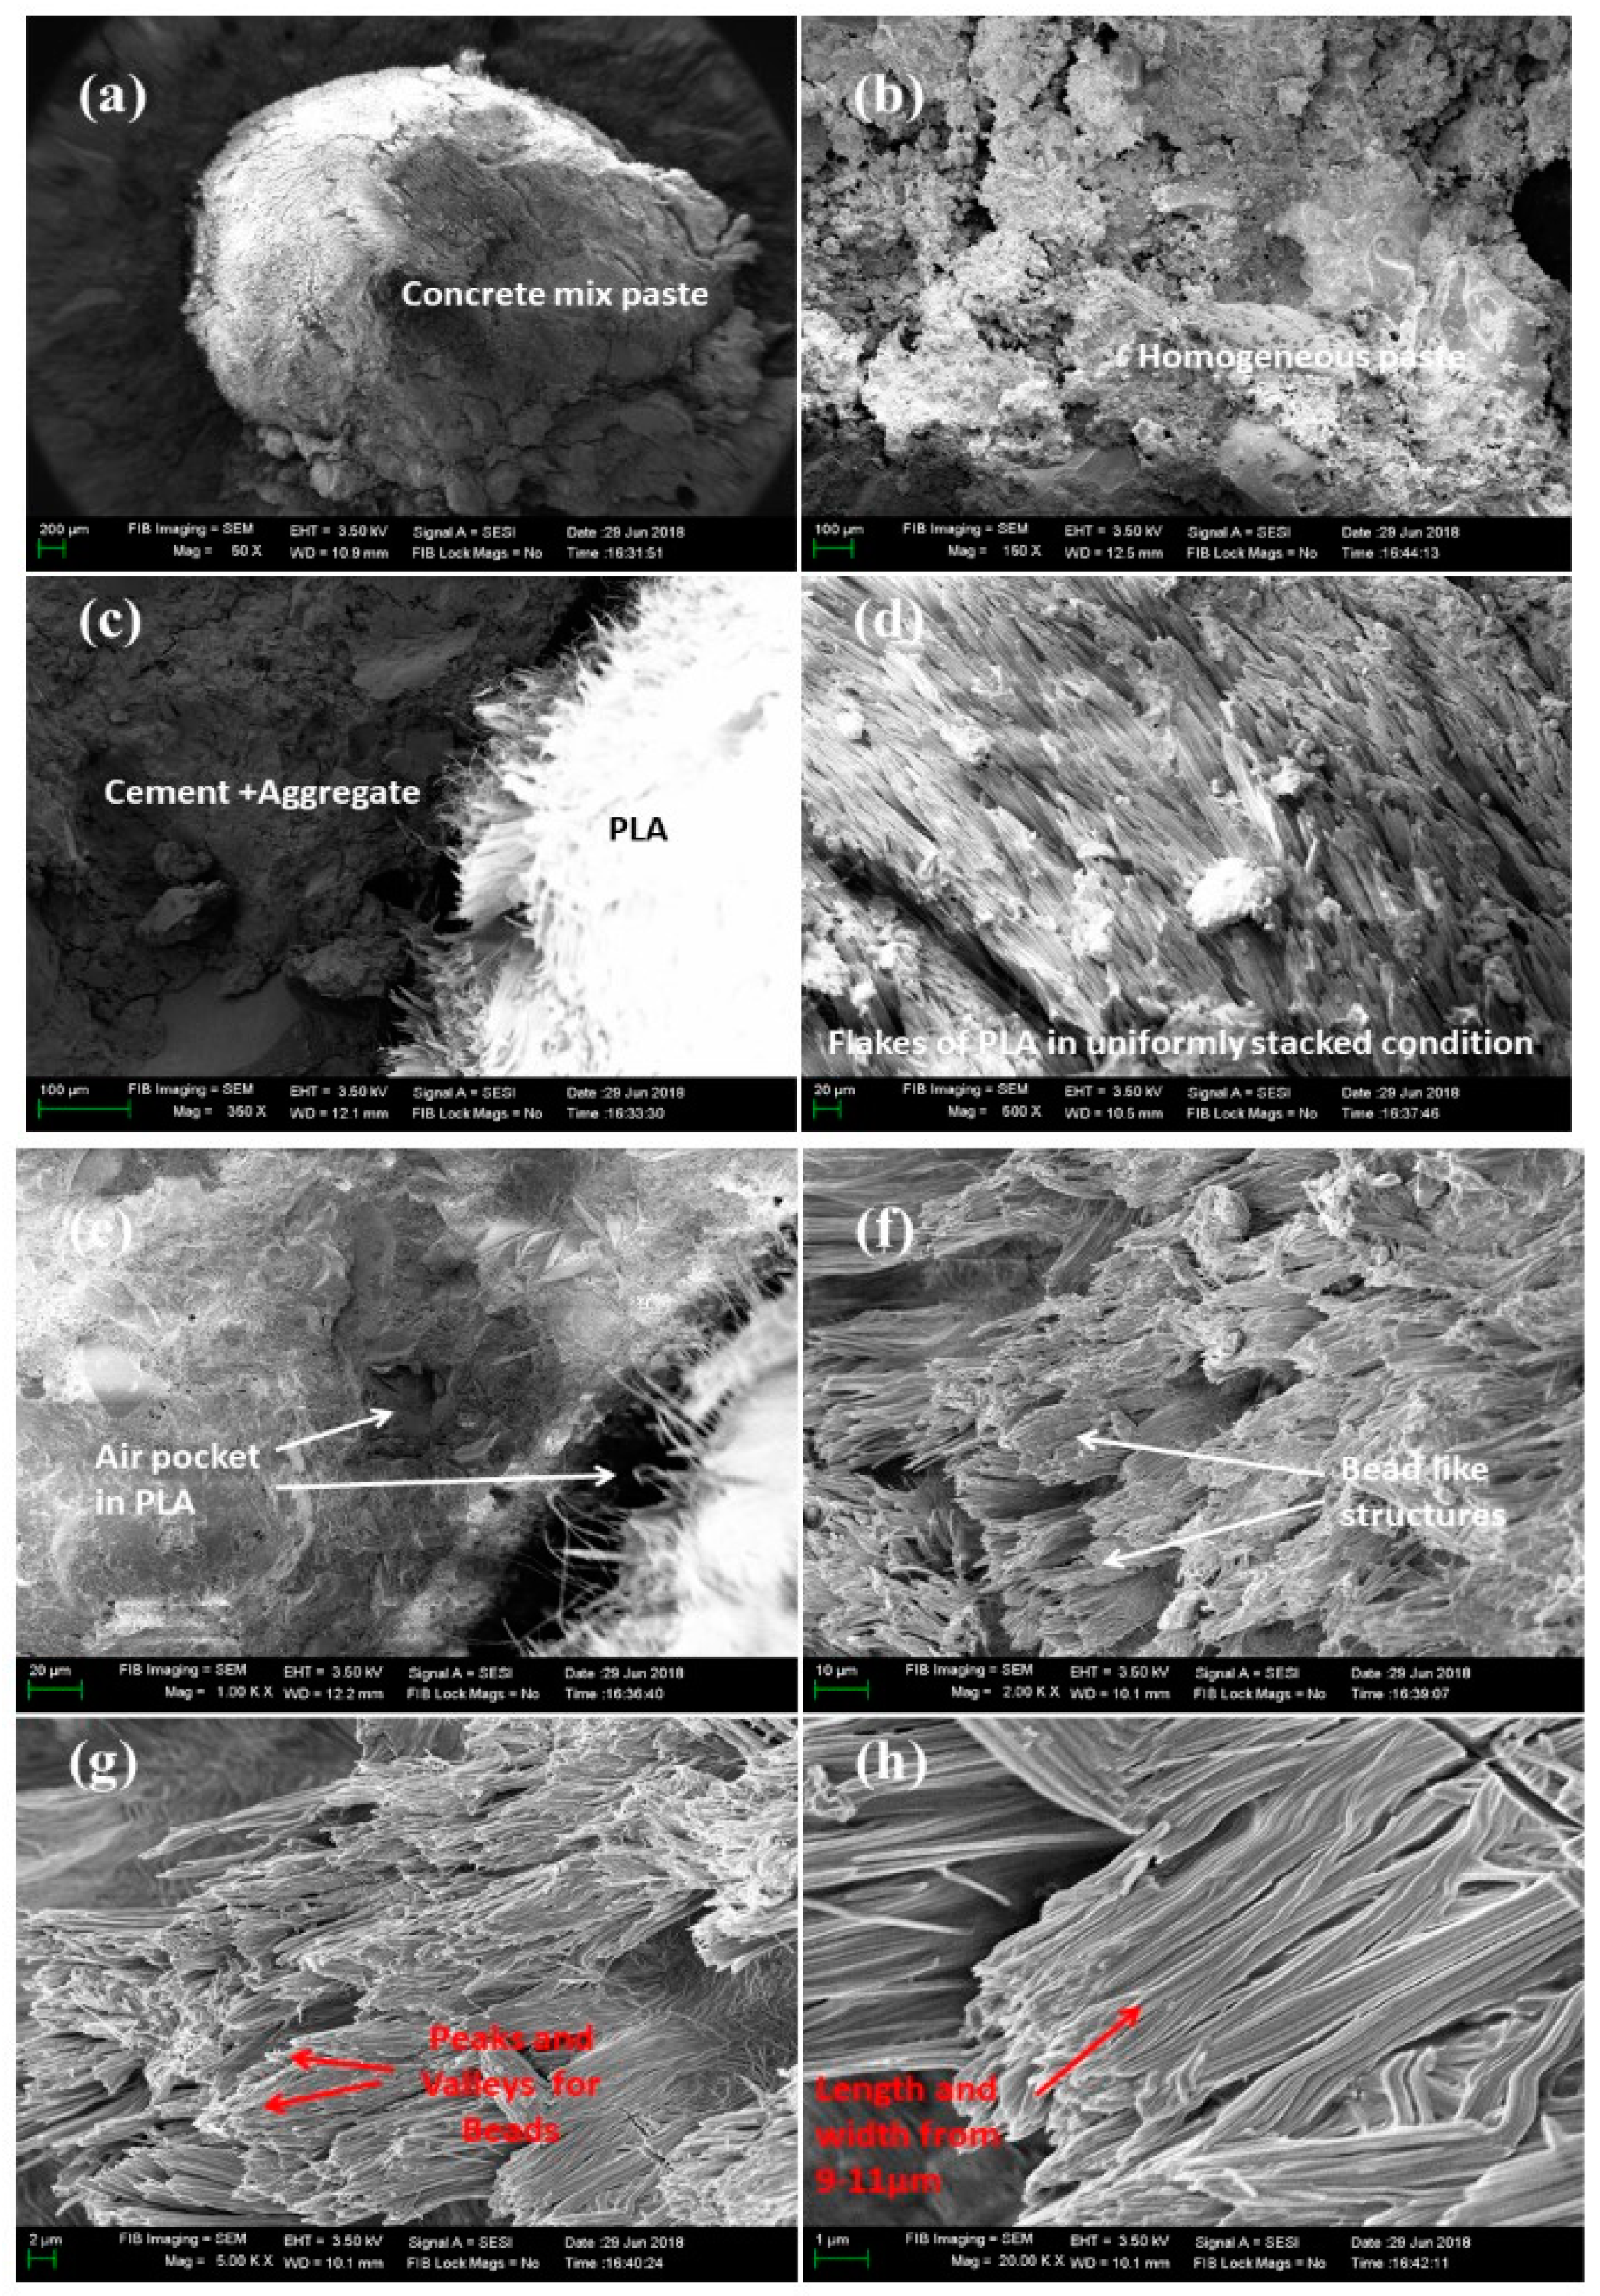
Figure 34.
(a–d) Fracture morphology of control concrete mix with 0% inclusion of PLA. (e–h) Fracture morphology of control concrete mix with 0% inclusion of PLA.
Figure 34.
(a–d) Fracture morphology of control concrete mix with 0% inclusion of PLA. (e–h) Fracture morphology of control concrete mix with 0% inclusion of PLA.
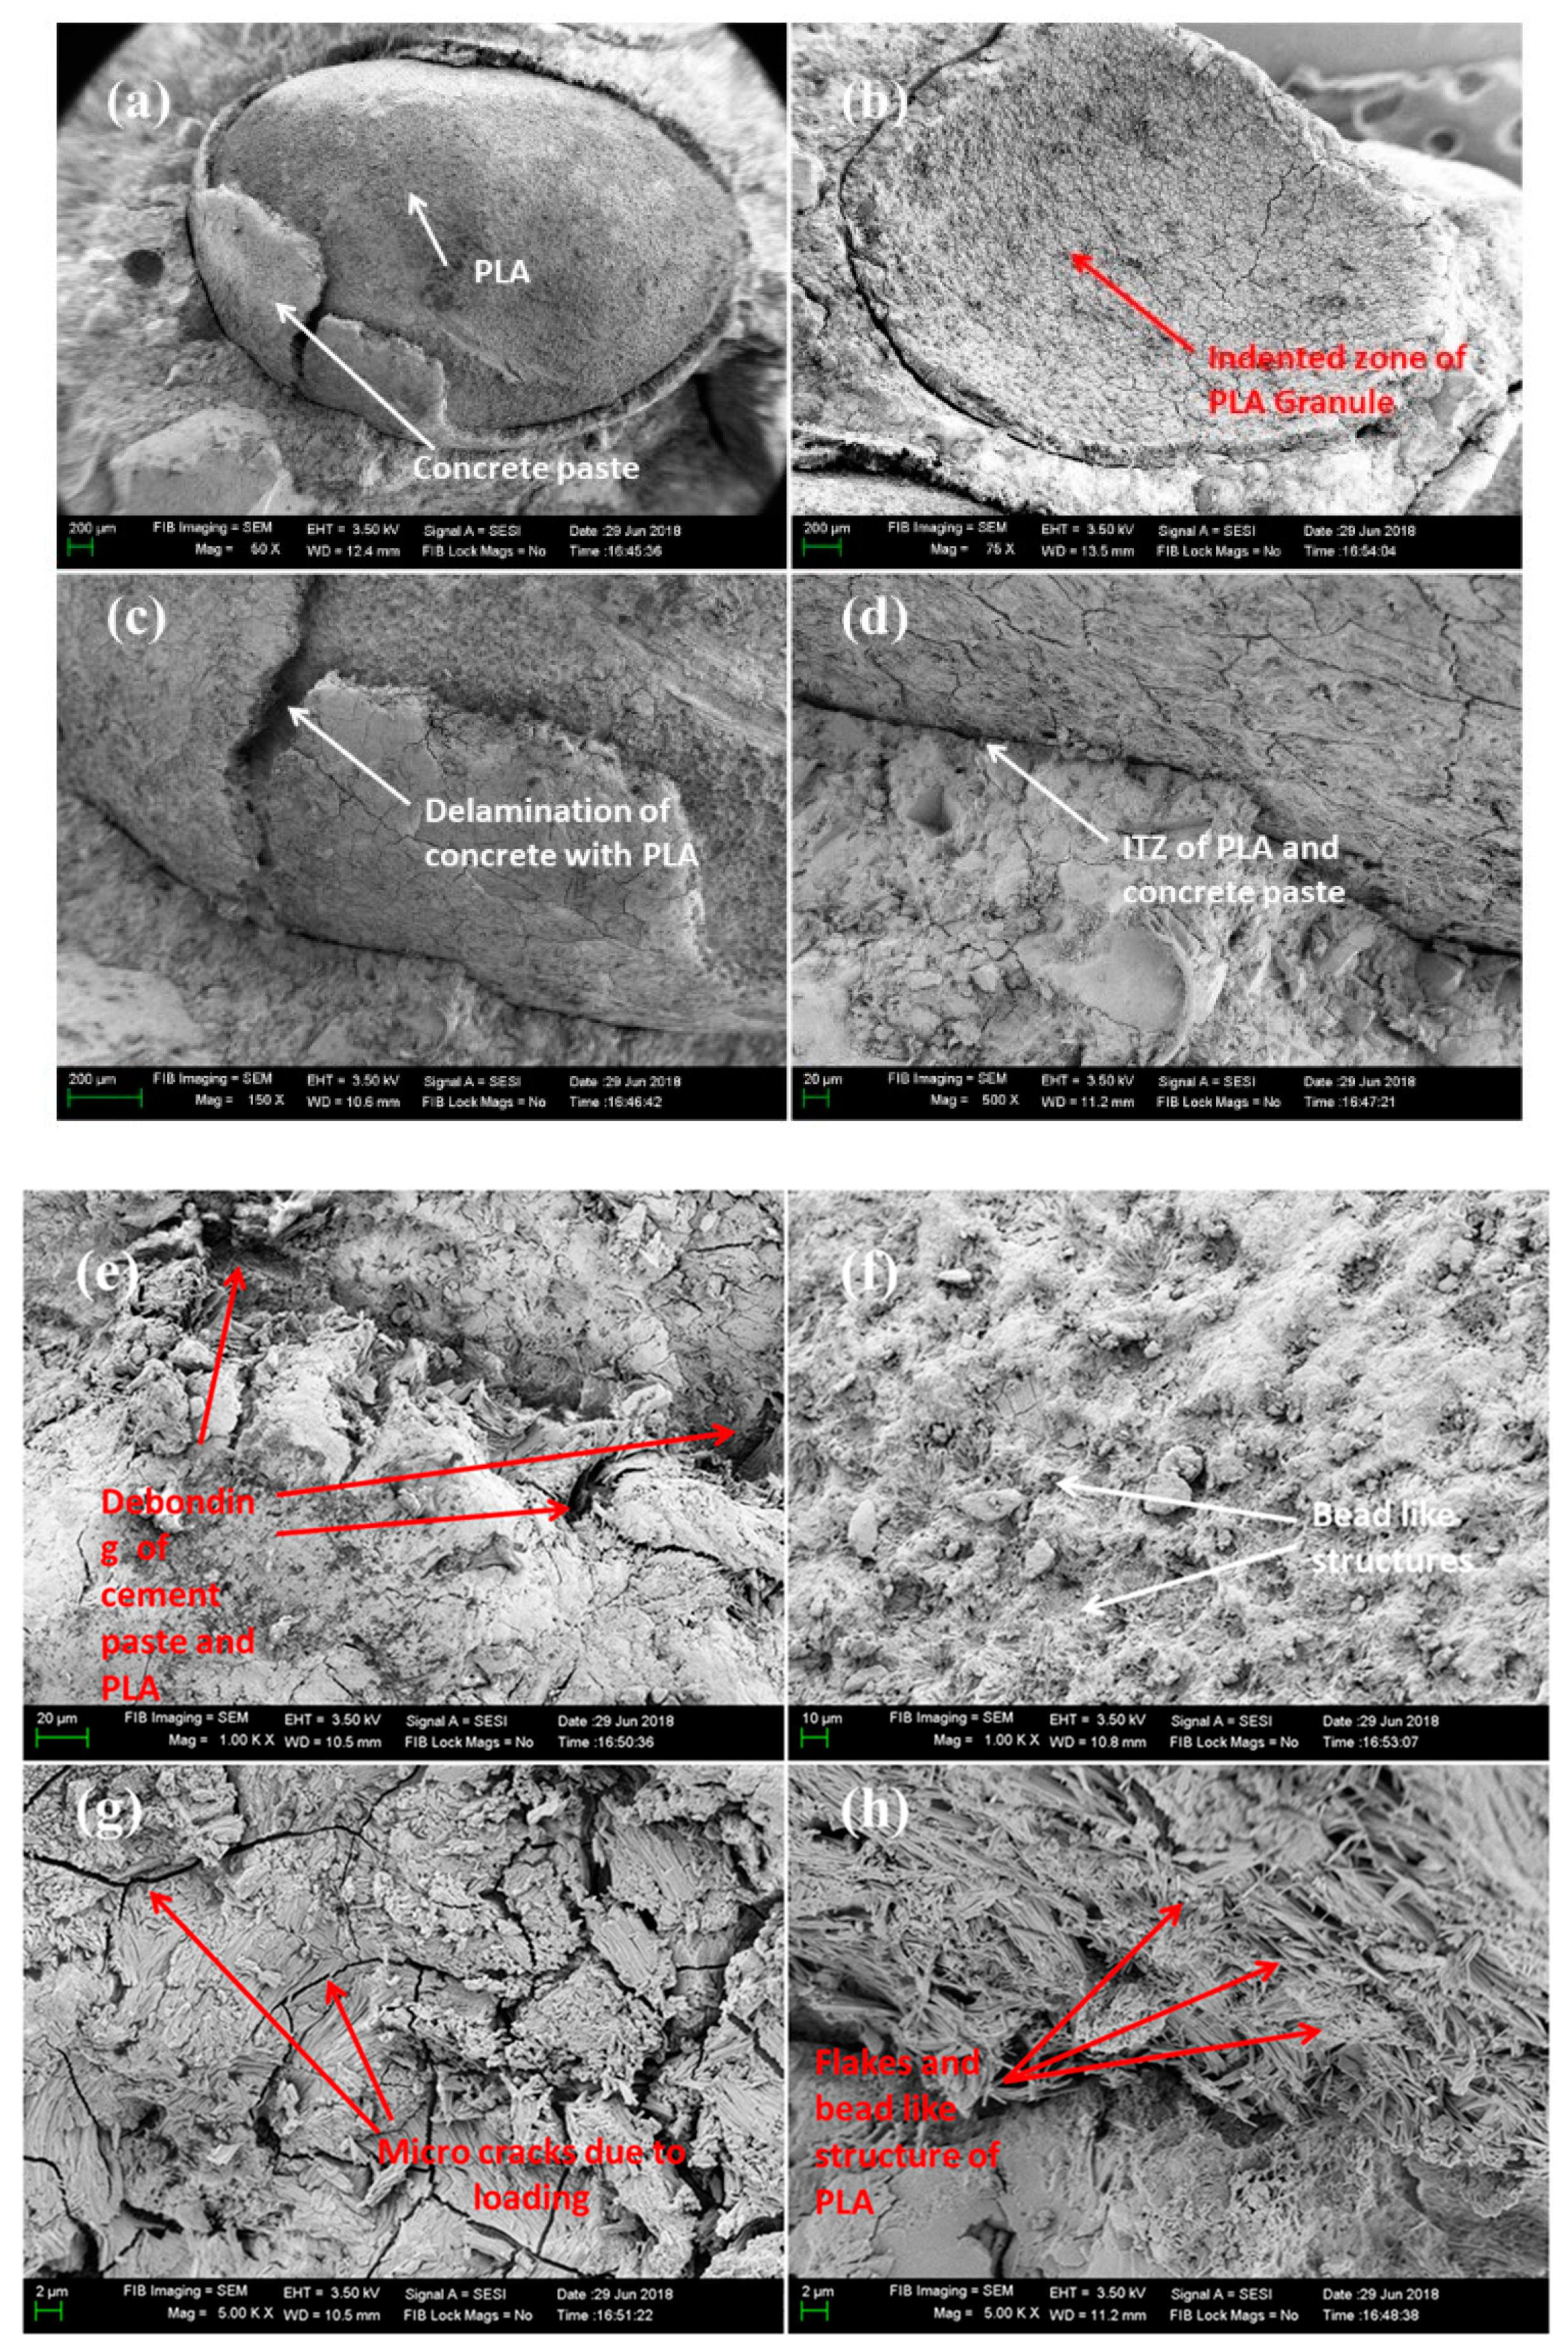
Figure 35.
(a–d) Fracture morphology of control concrete mix with 10% inclusion of PLA. (e–h) Fracture morphology of control concrete mix with 10% inclusion of PLA.
Figure 35.
(a–d) Fracture morphology of control concrete mix with 10% inclusion of PLA. (e–h) Fracture morphology of control concrete mix with 10% inclusion of PLA.
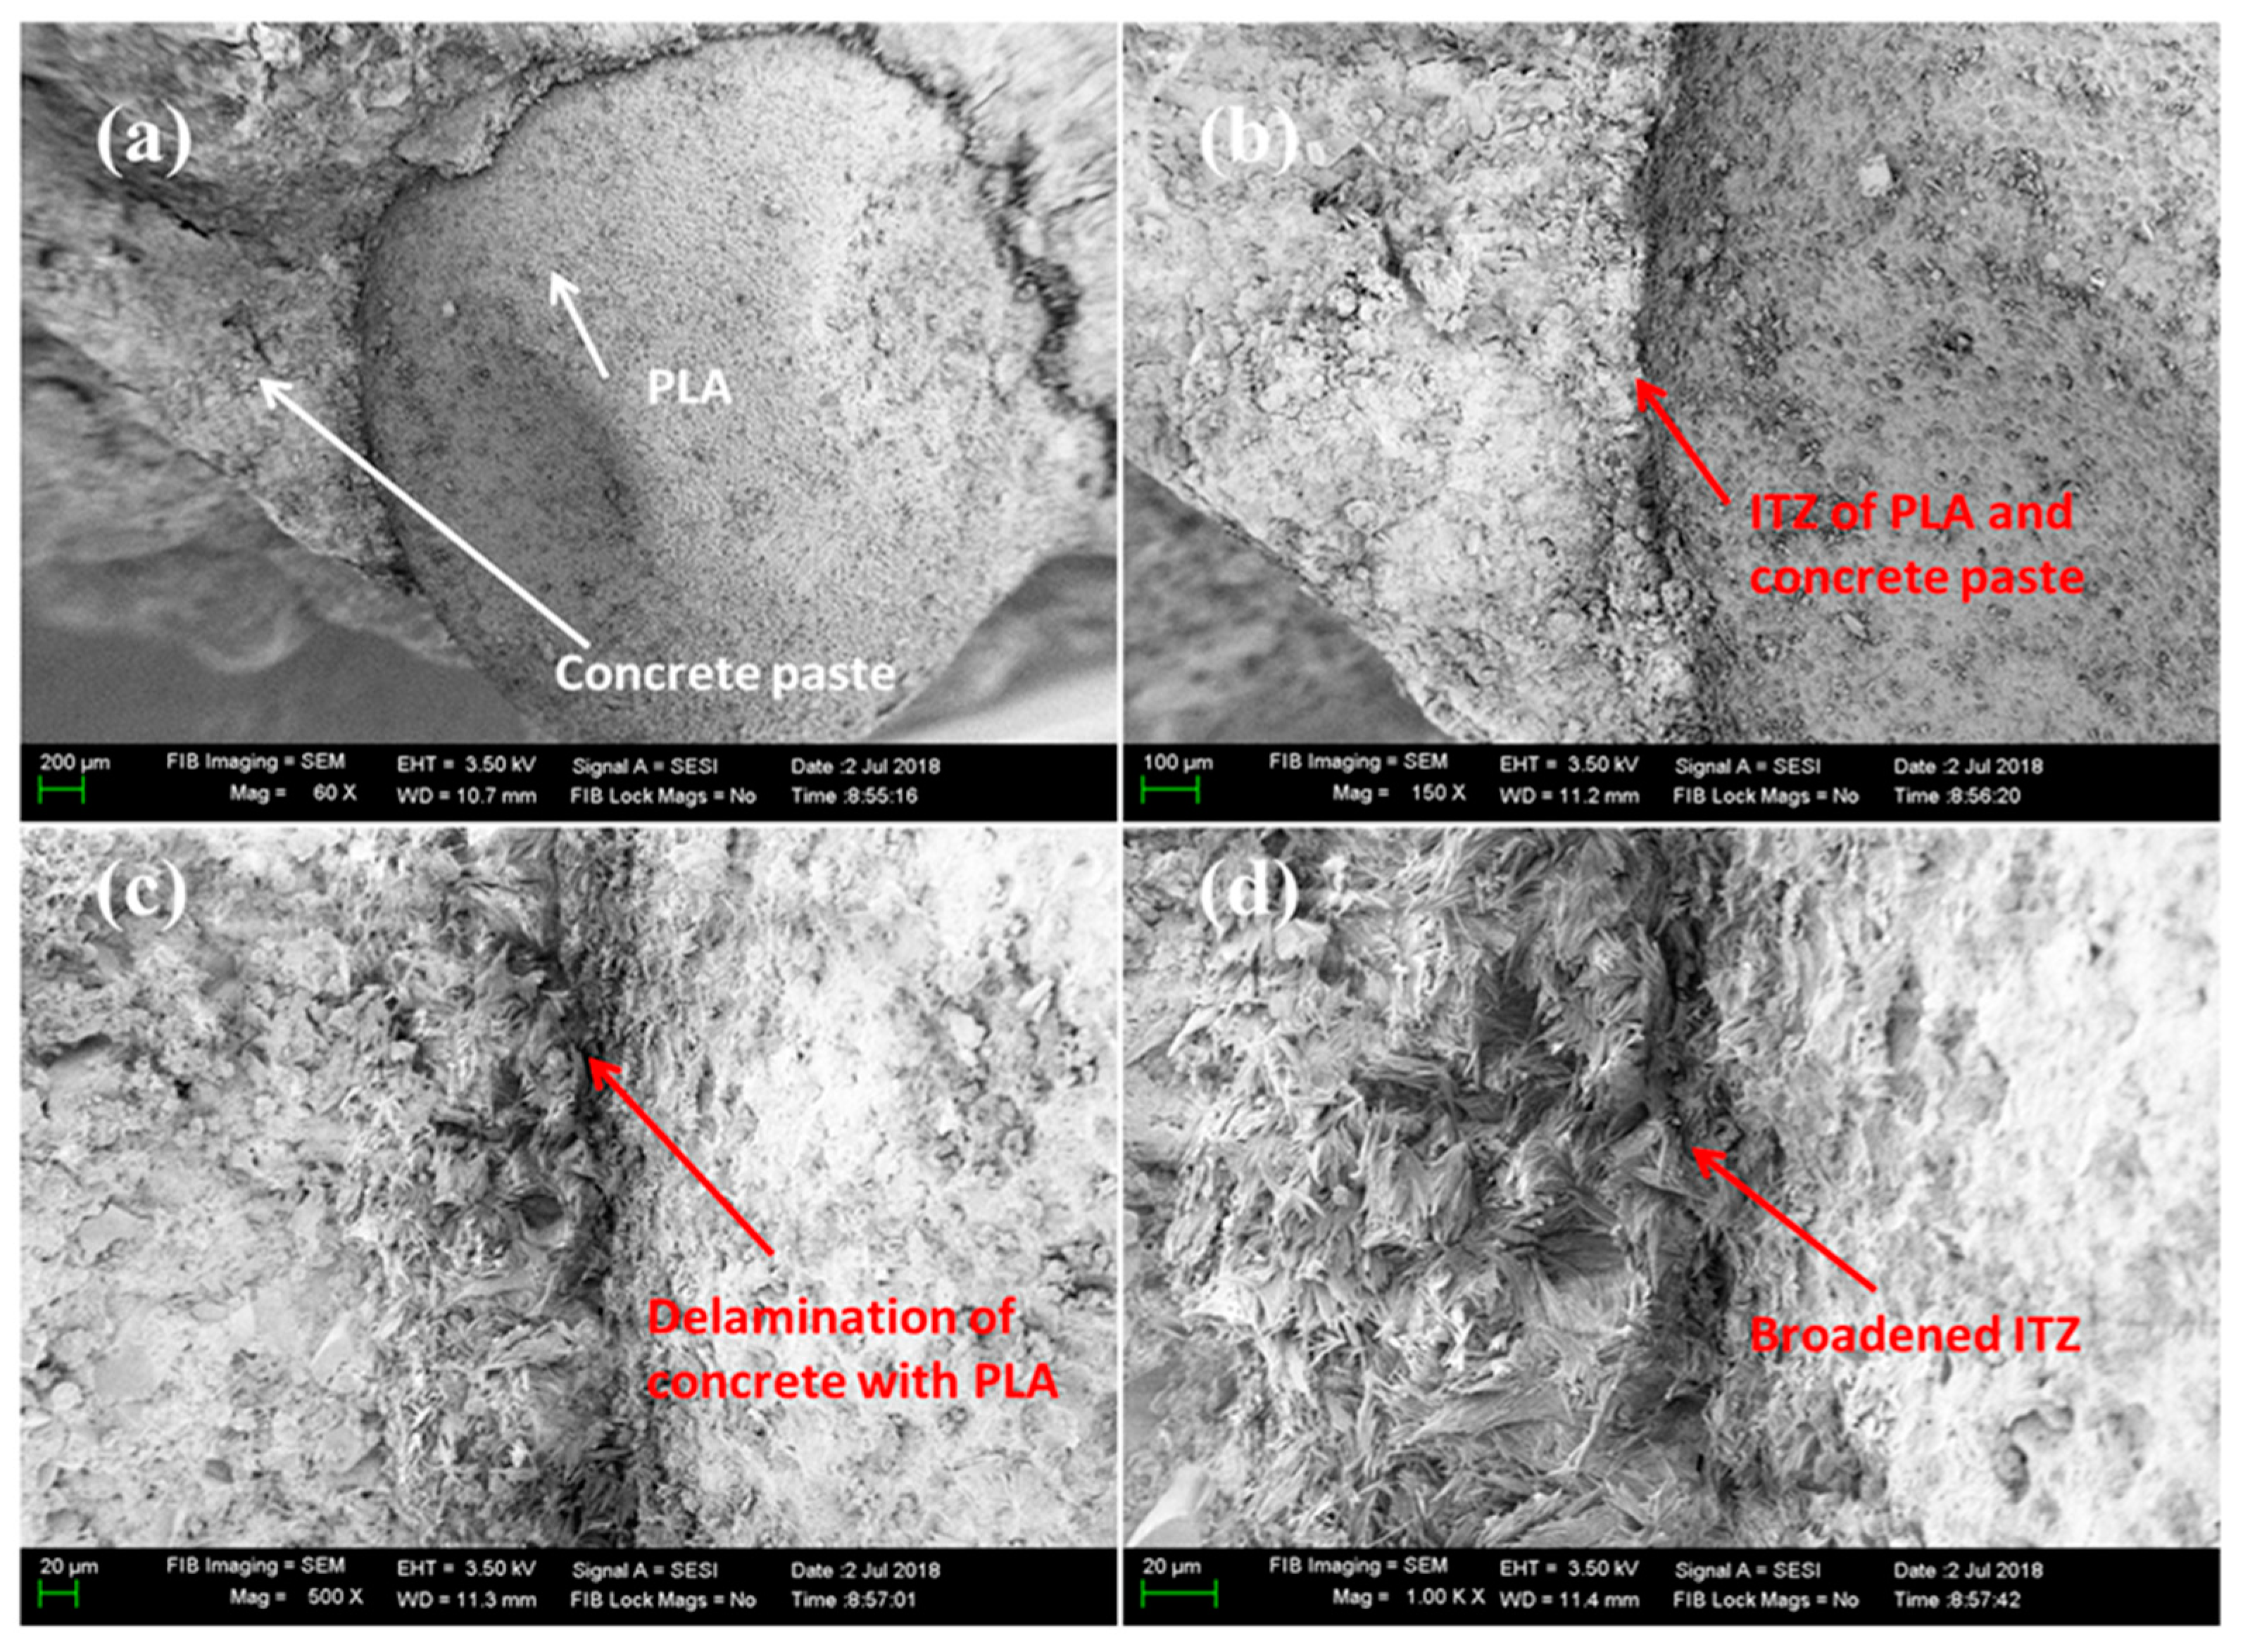
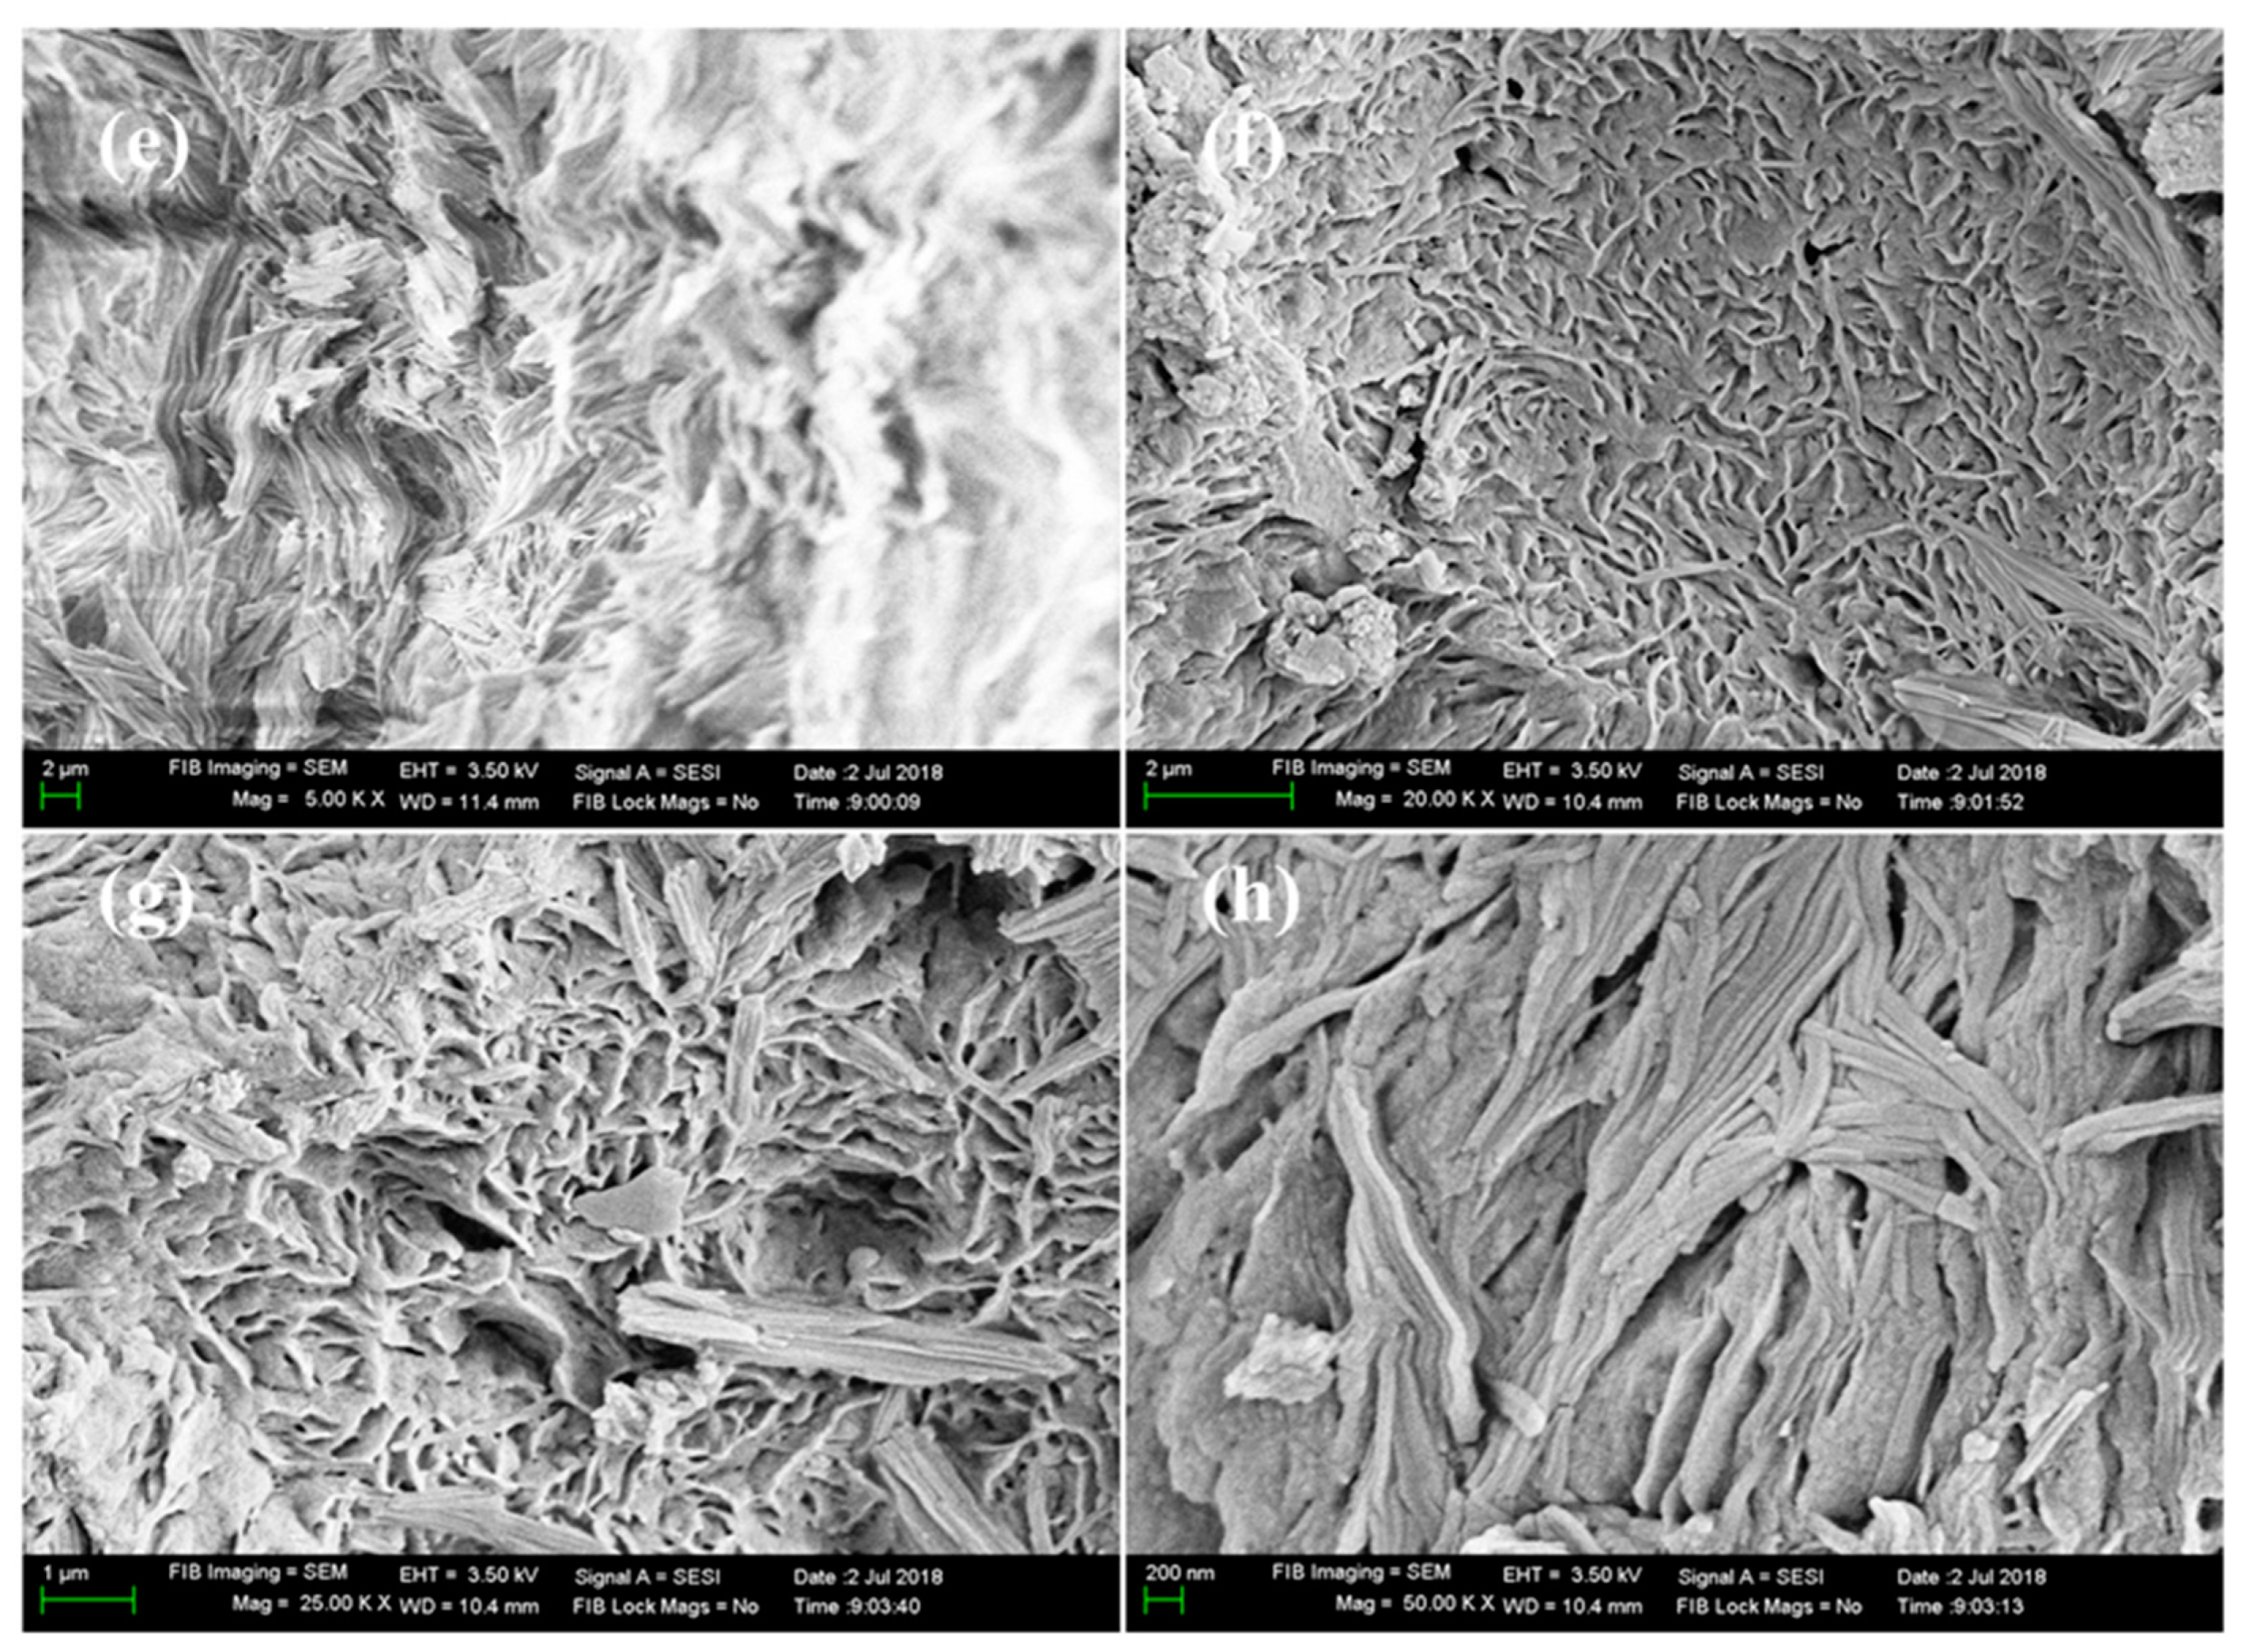
Figure 36.
(a–d) Fracture morphology of control concrete mix with 30% inclusion of PLA. (e–h) Fracture morphology of control concrete mix with 30% inclusion of PLA.
Figure 36.
(a–d) Fracture morphology of control concrete mix with 30% inclusion of PLA. (e–h) Fracture morphology of control concrete mix with 30% inclusion of PLA.
Figure 37.
(a–d) Fracture morphology of control concrete mix with 50% inclusion of PLA. (e–h) Fracture morphology of control concrete mix with 50% inclusion of PLA.
Figure 37.
(a–d) Fracture morphology of control concrete mix with 50% inclusion of PLA. (e–h) Fracture morphology of control concrete mix with 50% inclusion of PLA.
Table 1.
Physical properties of PLA.
Table 1.
Physical properties of PLA.
| Sl. No | Properties | PLA |
|---|
| 1 | Specific gravity | 1.25 |
| 2 | Water absorption | Nil |
| 3 | Bulk density | 1250 kg/m3 |
| 4 | Colour | White |
| 5 | Particle size | 1.18 mm–4.75 mm |
| 6 | Shape | Rounded |
| 7 | Texture | Smooth |
Table 2.
Mechanical Properties of PLA.
Table 2.
Mechanical Properties of PLA.
| Properties | Value |
|---|
| Density | 1.25 kg/m3 |
| Melt flow rate | 2.4–4.3 g/10 min |
| Haze | 2.2 |
| Yellowness index | 20–60 |
| Heat deflection temperature | 40–45 °C |
| VICAT softening point | 56 °C |
| Glass transition temperature, Tg | 55–56 °C |
| Melting point, Tm | 120–170 °C |
| Continuous service temperature | −20 to 40 °C |
| Tensile strength | 55 (±10%) MPa |
| Yield tensile strength | 53 MPa |
| Ultimate tensile strength | 73 MPa |
| Tensile Modulus | 3150 MPa |
| Flexural strength | 55 MPa |
| Flexural modulus | 350–450 MPa |
| Yield strength | 106 MPa |
| Young’s modulus | 70 MPa |
| Shear modulus | 1975 (±7%) MPa |
| Elastic modulus | 1287 MPa |
| Elongation at yield | 10–100 |
| Elongation at break | 9.3 (±7) % |
| Poisson’s ratio | 0.36 |
| Percent of elongation | 11.3% |
| Unnotched Izod Impact | 195 J/m |
| Notch Izod Impact | 26 J/m |
| Rockwell hardness | 88 J/m |
Table 3.
Details of ingredients along with compositions.
Table 3.
Details of ingredients along with compositions.
M20
(1:1.65:2.8)
| Materials | Replacement of Fine Aggregate by PLA (%) |
| 0% | 10% | 30% | 50% |
| Cement (Kg/m3) | 350 | 350 | 350 | 350 |
| River Sand (Kg/m3) | 577.5 | 519.65 | 404.17 | 288.69 |
| PLA granules (Kg/m3) | 0 | 30.325 | 90.975 | 151.625 |
| Coarse Aggregate (Kg m3) | 980 | 980 | 980 | 980 |
| Admixture | 0.73% | 0.73% | 0.73% | 0.73% |
| Water (mL) | 175 | 175 | 175 | 175 |
M30
(1:1.62:2.65)
| Materials | Replacement of Fine Aggregate by PLA (%) |
| 0% | 10% | 30% | 50% |
| Cement (Kg/m3) | 420 | 420 | 420 | 420 |
| River Sand (Kg/m3) | 680 | 611.97 | 475.98 | 339.983 |
| PLA granules (Kg/m3) | 0 | 31.71 | 107.138 | 178.56 |
| Coarse Aggregate (Kg/m3) | 1113 | 1113 | 1113 | 1113 |
| Admixture | 1.20% | 1.20% | 1.20% | 1.20% |
| Water (mL) | 159.6 | 159.6 | 159.6 | 159.6 |
Table 4.
Total of 146 specimens for various sets of tests.
Table 4.
Total of 146 specimens for various sets of tests.
| Specimen Type | Sizes and Respective Tests | Total No. of Specimens |
|---|
| Cubes | 10 cm × 10 cm × 10 cm (Compressive strength, Water absorption, and Density) | 48 |
| 15 cm × 15 cm × 15 cm (Water Permeability) | 8 |
| 7.06 cm × 7.06 cm × 7.06 cm (Compressive strength, Water absorption, and Density) | 24 |
| Cylinders | 15 cm dia, 30 cm height (Split Tensile) | 32 |
| 15 cm dia, 6 cm Height (Impact) | 16 |
| Beams | 10 cm × 10 cm × 50 cm (Flexural strength) | 18 |
Table 5.
PLA sieve analysis (weight of sample taken: 200 g).
Table 5.
PLA sieve analysis (weight of sample taken: 200 g).
| ISSieve mm | Weight Retained in Grams | Percentage of Weight Owned in Grams | Cumulative Percentage Retained | Percentage of Passing |
|---|
| 10 mm | 0 | 0 | 0 | 100 |
| 4.75 mm | 0 | 0 | 0 | 100 |
| 2.36 mm | 193 | 96.5 | 96.5 | 3.5 |
| 1.18 mm | 7 | 3.5 | 100 | 0 |
| 600 Micron | 0 | 0 | | |
| 300 Micron | 0 | 0 | | |
| 150 Micron | 0 | 0 | | |
| 75 Micron | 0 | 0 | | |
| Pan | 0 | 0 | | |
Table 6.
Slump Test results.
Table 6.
Slump Test results.
| Replacement of Fine Aggregate by PLA | Slump(mm) |
|---|
| M20 | M30 |
|---|
| 0% | 70 | 50 |
| 10% | 80 | 65 |
| 30% | 95 | 85 |
| 50% | Collapse | Collapse |
Table 7.
M20 and M30 grade results with 7 days and 28 days curing.
Table 7.
M20 and M30 grade results with 7 days and 28 days curing.
| Days of Curing | Replacement of Fine Aggregate by PLA | M20 | M30 |
|---|
| Compressive Strength (MPa) | Variation in Strength | Compressive Strength (MPa) | Variation in Strength |
|---|
| 7 Days | 0% | 19.37 | 0% | 28.40 | 0% |
| 10% | 38.01 | 96.19% | 46.84 | 65.00% |
| 30% | 24.03 | 24.03% | 32.87 | 15.74% |
| 50% | 14.96 | −22.78% | 24.53 | −13.63% |
| 28 Days | 0% | 30.90 | 0% | 38.99 | 0% |
| 10% | 44.27 | 43.25% | 49.42 | 26.75% |
| 30% | 30.78 | 0.39% | 38.38 | −1.56% |
| 50% | 19.37 | −37.30% | 26.85 | −31.14% |
Table 8.
M20 grade results with 7 days and 28 days curing.
Table 8.
M20 grade results with 7 days and 28 days curing.
| Days of Curing | Replacement of Fine Aggregate by PLA | M20 | M30 |
|---|
| Split Tensile Strength (MPa) | Variation in Strength | Split Tensile Strength (MPa) | Variation in Strength (%) |
|---|
| 7 Days | 0% | 1.457 | 0 | 2.115 | 0 |
| 10% | 1.664 | 14.20 | 2.635 | 24.59 |
| 30% | 1.318 | −9.54 | 2.011 | −4.92 |
| 50% | 1.04 | −28.62 | 1.56 | −26.24 |
| 28 Days | 0% | 2.653 | 0 | 3.606 | 0 |
| 10% | 2.913 | 9.80 | 3.92 | 8.70 |
| 30% | 2.254 | −15.04 | 3.433 | −4.80 |
| 50% | 1.231 | −53.60 | 2.323 | −35.58 |
Table 9.
M20 grade results with 7 days and 28 days curing.
Table 9.
M20 grade results with 7 days and 28 days curing.
| Grade of Concrete | Replacement of Fine Aggregate by PLA | Average Flexural Strength (MPa) | Variation in Strength (%) |
|---|
| M20 | 0% | 3.48 | 0 |
| 10% | 4.36 | 25.29 |
| 30% | 3.92 | 12.64 |
| 50% | 2.96 | −14.94 |
| M30 | 0% | 4.46 | 0 |
| 10% | 5.74 | 28.70 |
| 30% | 4.38 | −1.79 |
| 50% | 3.08 | −30.94 |
Table 10.
M20 grade results for the water absorption test.
Table 10.
M20 grade results for the water absorption test.
| Replacement of Fine Aggregate by PLA | Average Water Absorption (%) |
|---|
| M20 | M30 |
|---|
| 0% | 5.49 | 3.49 |
| 10% | 1.97 | 1.12 |
| 30% | 4.52 | 3.57 |
| 50% | 5.63 | 4.47 |
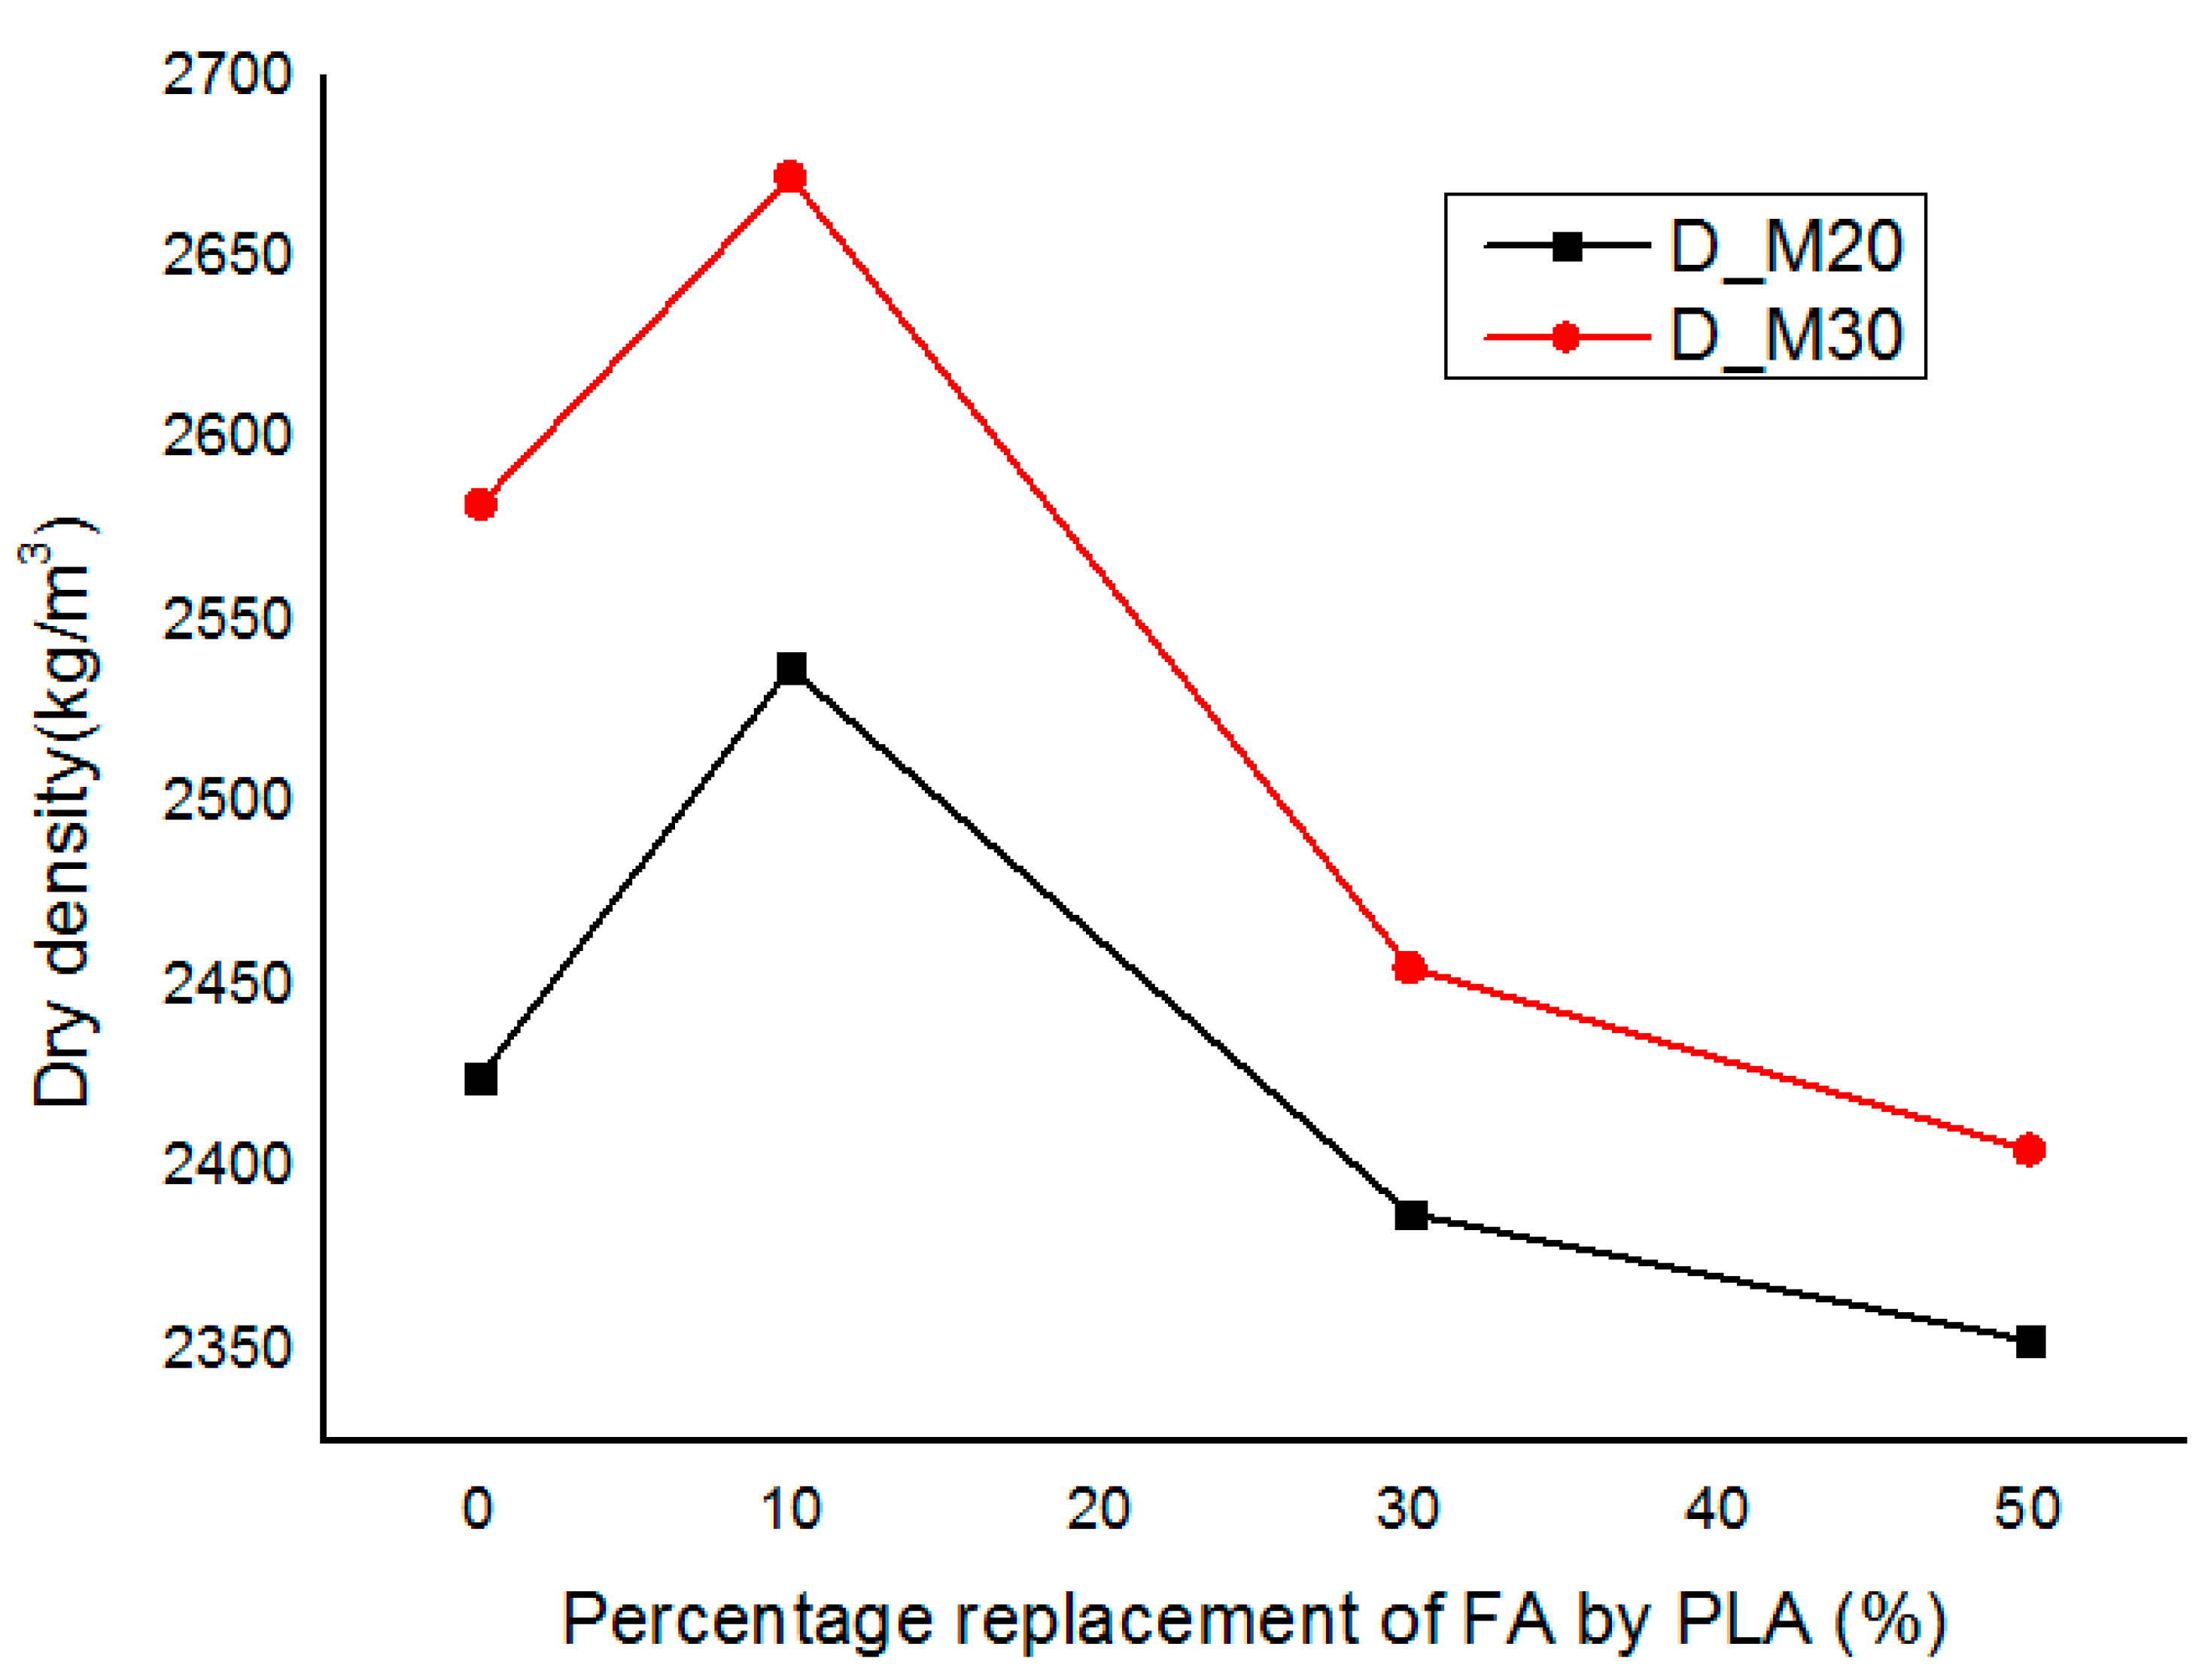
Table 11.
M20 and M30 grade results for density test.
Table 11.
M20 and M30 grade results for density test.
| Replacement of Fine Aggregate by PLA | Average Dry Density (Kg/m3) |
|---|
| M20 | M30 |
|---|
| 0% | 2425.0 | 2582.5 |
| 10% | 2537.5 | 2672.5 |
| 30% | 2387.5 | 2455.0 |
| 50% | 2352.5 | 2405.0 |
Table 12.
M20 and M30 grade water permeability test.
Table 12.
M20 and M30 grade water permeability test.
| Grade of Concrete | Replacement of Fine Aggregate by PLA | Water Collected (mL) | Time Elapsed | Coefficient of Permeability (cm/s) | Average Coefficient of Permeability (cm/s) |
|---|
| M20 | 0% | 2306 | 100 h | 8.54 × 10⁻⁵ | 8.67 × 10⁻⁵ |
| 2372 | 8.79 × 10⁻⁵ |
| 10% | 2228 | 8.25 × 10⁻⁵ | 8.29 × 10⁻⁵ |
| 2250 | 8.33 × 10⁻⁵ |
| 30% | 2494 | 9.24 × 10⁻⁵ | 9.54 × 10⁻⁵ |
| 2588 | 9.59 × 10⁻⁵ |
| 50% | 2734 | 10.13 × 10⁻⁵ | 10.37 × 10⁻⁵ |
| 2866 | 10.62 × 10⁻⁵ |
| M30 | 0% | 1782 | 6.60 × 10⁻⁵ | 6.53 × 10⁻⁵ |
| 1744 | 6.46 × 10⁻⁵ |
| 10% | 1702 | 6.30 × 10⁻⁵ | 6.28 × 10⁻⁵ |
| 1688 | 6.25 × 10⁻⁵ |
| 30% | 1862 | 6.90 × 10⁻⁵ | 6.80 × 10⁻⁵ |
| 1808 | 6.70 × 10⁻⁵ |
| 50% | 1990 | 7.37 × 10⁻⁵ | 7.21 × 10⁻⁵ |
| 1902 | 7.04 × 10⁻⁵ |
Table 13.
M20 and M30 grade Impact resistance test.
Table 13.
M20 and M30 grade Impact resistance test.
| Grade of Concrete | Replacement of Fine Aggregate by PLA | Average First Crack Strength (Blows) | Average Failure Strength (Blows) |
|---|
| M20 | 0% | 85 | 89 |
| 10% | 87 | 92 |
| 30% | 95 | 98 |
| 50% | 20 | 23 |
| M30 | 0% | 99 | 102 |
| 10% | 109 | 112 |
| 30% | 124 | 126 |
| 50% | 38 | 40 |
Table 14.
Flexural strength results of wrapped and unwrapped beams.
Table 14.
Flexural strength results of wrapped and unwrapped beams.
| Deflection(mm) | Load in kN |
|---|
| Without Wrapping | With Wrapping |
|---|
| 0 | 0 | 0 |
| 0.1 | 1.3 | 1.7 |
| 0.2 | 1.8 | 1.8 |
| 0.3 | 2.1 | 2.1 |
| 0.4 | 2.6 | 3.2 |
| 0.5 | 3.1 | 3.7 |
| 0.6 | 3.2 | 4.3 |
| 0.7 | 3.9 | 5.2 |
| 0.8 | 4.6 | 5.3 |
| 0.9 | 5 | 5.5 |
| 1 | 5.1 | 5.6 |
| 1.1 | 5.4 | 5.9 |
| 1.2 | 5.8 | 7.1 |
| 1.3 | 6.7 | 7.8 |
| 1.4 | 6.8 | 8.5 |
| 1.5 | 7.5 | 9.5 |
| 1.6 | 8.2 | 10.6 |
| 1.7 | 9 | 10.9 |
| 1.8 | - | 11.1 |
| | | 11.3 |
Table 15.
Peak positions in IR spectrum for PLA granules.
Table 15.
Peak positions in IR spectrum for PLA granules.
| Bonding | Type | Characteristic Peak Positions (cm−1) |
|---|
| -C-C- | Stretching | 874.73 |
| -OH | Bending | 3437.83 |
| -C-O- | Stretching | 1090.65 |
| -CH3 | Asymmetric Bending | 1454.09 |
| Symmetric Bending | 1430.25 |
| Asymmetric Stretching | 2996.68 |
| Symmetric Stretching | 2921.69 |
| -C=O- | Symmetric Bending | 1636.30 |
| -C=O | Carbonyl Stretching | 1756.64 |
| -CH- | Symmetric bending | 2500 |
| Asymmetric bending | 2851.79 |
| -CH- | Symmetric bending deformation | 1386.29 |
| Asymmetric bending deformation | 1365 |
| C=C | Stretching | 1590.02 |
Table 16.
Peak positions in IR spectrum for PLA in filament form.
Table 16.
Peak positions in IR spectrum for PLA in filament form.
| Bonding | Type | Characteristic Peak Positions (cm−1) |
|---|
| -C-C- | Stretching | 875.26 |
| -OH | Bending | 3434.34 |
| -C-O- | Stretching | 1091.59 |
| -CH3 | Asymmetric Bending | 1453.8 |
| Symmetric Bending | 1426.38 |
| -C=O- | Symmetric Bending | 1591.46 |
| -C=O | Carbonyl Stretching | 1754.48 |
| -CH- | Symmetric bending | 2853.68 |
| Asymmetric bending | 2924.1 |
| -CH- | Symmetric bending deformation | 1386.1 |
| Asymmetric bending deformation | 1360 |
Table 17.
Peak positions in IR spectrum for PLA granules.
Table 17.
Peak positions in IR spectrum for PLA granules.
| Bonding | Type | Characteristic Peak Positions (cm−1) |
|---|
| -C-C- | Stretching | 781.16 |
| -OH | Bending | 3367.13 |
| -C-O- | Stretching | 1125.45 |
| -CH3 | Asymmetric Bending | 1483.96 |
| Symmetric Bending | 1404.31 |
| Asymmetric Stretching | 2981.37 |
| Symmetric Stretching | 2937.37 |
| -C=O- | Symmetric Bending | 1483.96 |
| -C=O | Carbonyl Stretching | 1585.79 |
| -CH- | Symmetric bending | 2754.86 |
| Asymmetric bending | 2854.95 |
| -CH- | Symmetric bending deformation | 1404.31 |
| Asymmetric bending deformation | 1371.38 |
Table 18.
EDX spectrum details for 0, 10, 30, and 50% inclusion in concrete as replacement for fine aggregate.
Table 18.
EDX spectrum details for 0, 10, 30, and 50% inclusion in concrete as replacement for fine aggregate.
| X = 0 | X = 10% | X = 30% | X = 50% |
|---|
| Element | Weight (%) | Atomic (%) | Element | Weight (%) | Atomic (%) | Element | Weight (%) | Atomic (%) | Element | Weight (%) | Atomic (%) |
|---|
| C K | 5.16 | 8.36 | C K | 36.64 | 46.71 | C K | 33.98 | 44.04 | C K | 41.45 | 51.00 |
| O K | 56.36 | 68.54 | O K | 49.42 | 47.30 | O K | 51.28 | 49.89 | O K | 48.92 | 45.18 |
| Na K | 1.54 | 1.30 | Na K | 0.44 | 0.29 | Na K | 0.15 | 0.10 | Na K | 0.18 | 0.11 |
| Mg K | 1.29 | 1.03 | Mg K | 0.29 | 0.18 | Mg K | 0.11 | 0.07 | Mg K | 0.12 | 0.07 |
| Al K | 4.95 | 3.57 | Al K | 0.68 | 0.39 | Al K | 0.49 | 0.28 | Al K | 0.40 | 0.22 |
| Si K | 14.16 | 9.81 | Si K | 2.13 | 1.16 | Si K | 1.27 | 0.70 | Si K | 0.85 | 0.45 |
| S K | 0.32 | 0.20 | S K | 0.16 | 0.08 | S K | 0.08 | 0.04 | S K | 0.07 | 0.03 |
| Cl K | 0.13 | 0.07 | K K | 0.19 | 0.07 | Ca K | 12.38 | 4.81 | K K | 0.06 | 0.02 |
| K K | 0.34 | 0.17 | Ca K | 9.73 | 3.72 | Fe K | 0.27 | 0.07 | Ca K | 7.72 | 2.85 |
| Ca K | 10.44 | 5.07 | Fe K | 0.32 | 0.09 | Totals | 100.00 | | Fe K | 0.23 | 0.06 |
| Ti K | 0.57 | 0.23 | Totals | 100.00 | | | | | | 100.00 | |
| Mn K | 0.09 | 0.03 | | | | | | | | | |
| Fe K | 4.66 | 1.62 | | | | | | | | | |
| Totals | 100.00 | | | | | | | | | | |

 ,
, 


