Abstract
Recommendation systems play a significant role in alleviating information overload in the digital world. They provide suggestions to users based on past symmetric activities or behaviors. Being heavily dependent on users’ behavior, they tend to be vulnerable to shilling attacks. Therefore, protecting them from attacks’ effects is highly important. As shilling attacks have features of a large number of ratings and increasing complexity in attack models, deep learning methods become proper alternatives for more accurate attack detections. This paper proposes a hybrid model of two different neural networks, convolutional and recurrent neural networks, to detect shilling attacks efficiently. The proposed deep learning model utilizes the transformed network architecture for undertaking the attributes derived from user-rated profiles. This architecture enables modeling of the temporal and spatial information in the recommendation system’s ratings. The hybrid model overcomes the limitations of the existing shilling attack deep-learning methods to enhance the recommendation systems’ efficiency and robustness. Experimental results show that the hybrid model results in better predictions on the Movie-Lens 100 K and Netflix datasets by accurately detecting most of the obfuscated attacks compared to the state-of-art deep learning algorithms used for investigation.
1. Introduction
Information overload is a recognized phenomenon in the digital industry, especially in e-commerce, such that decision-makers would have relatively limited cognitive processing capacity. Consequently, in an information retrieval process, a reduction in the decision’s quality will likely occur. The role of recommender systems in information systems is essential as they filter information to enable both users and firms to maintain better decisions. They allow users to find relevant items and would allow companies to increase their revenue and cross-sales. Currently, recommendation systems are widely used in product, movie, and music recommendations [1]. Collaborative filtering recommendation systems are motivated by the observation that people tend to follow their friends’ recommendations. In such systems, users obtain personalized recommendations based on their similarities in preferences with other users. Therefore, these systems are vulnerable to manipulation from purposeful users who attempt to change the system’s recommendation toward their desired results. This can be achieved by fake users who try to elevate their items or demote their competitors’ items. This phenom is called the shilling attack behavior. Shilling attacks can cause users’ overall dissatisfaction and loss of revenue. Detecting shilling attacks is vital to reduce their effects on targeted items, provide more accurate recommendations to users, and enhance recommendation systems’ robustness. Various methods have been proposed for attack profiles detection, such as statistical methods [2] graph mining [3], clustering [4], and classification [5]. Existing approaches have some deficiencies, including confining to a limited type of attacks [6], sensitivity to the attack size or rating patterns for attackers [7,8], or ignoring the difference between a normal and attack the user. The latter type can cause a false alarm rate and increase the misclassification rate [9]. Recently, machine learning models have led to breakthroughs in shilling attack detection. However, traditional machine learning approaches heavily depend on feature engineering, which requires complex and time-consuming feature extraction. Therefore, more robust methods (i.e., deep learning) are needed to achieve real-time and end-to-end attack detection. Convolutional neural networks (CNNs) and recurrent neural networks (RNNs) are two types of deep learning methods that have been applied to the shilling attack detection problem [10,11,12]. Different studies have examined the integration of CNNs and RNNs and other neural network models in various applications, such as speech recognition [13], stock market analysis [14], and temporal and spatial features [15], to achieve better classification or prediction results. Different architectures to combine CNN and RNN models are introduced in different contexts and applications: in [15], authors used a hybrid CNN–RNN model on network traffic as a univariate time series classification problem. Their proposed C-LSTM model consists of CNN and (long short-term memory) LSTM layers, which are connected in a linear structure. In [16], a cascade CNN and RNN model is developed on a word embedded data, and then an attention layer is added, which combines their outputs. The authors in [17] used a particular type of RNN, the gated recurrent units (GRU), model on text data, and then applied a CNN model on the outcome. The GRU layer represents words, while the CNN layer extracts features of sentences. In [18], the authors used a hybrid model to classify sentences to K classes. In [14], CNN layers are combined with RNN layers to extract the correlation of different temporal sequences in the CNN layers. In [19], the authors proposed a hybrid model that used the CNN’s output as input to LSTM. Although CNN models are useful for shilling attack detection, they cannot account for the time distribution of an item’s rating, where the order of ratings can reveal abnormal patterns. On the other hand, existing RNN models have solely relied on a separate item’s ratings and ignored the correlation among data. Therefore, in this paper, we propose a combination of CNN and RNN models. The CNN model will extract the local features, and the RNN model will obtain long-distance dependencies. We used the LSTM and the GRU as instances of the RNN. The combined model has shown a significant detection accuracy compared to the traditional CNN and RNN on datasets with various sizes and configurations. This architecture is not yet applied to shilling attack detection in collaborative filtering recommendation systems for e-commerce datasets to the best of our knowledge. The main contributions of the proposed research work in this paper are summarized as:
- (1)
- We introduce a novel architecture to combine CNN and RNN models to better detect shilling attacks in item-based collaborative filtering recommendation systems as applied in e-commerce.
- (2)
- We provide a robust architecture that handles attacks of different sizes and types.
- (3)
- We consider both temporal and spatial information in the recommendation system (RS)’s ratings with a flexible time segmentation.
The rest of the paper is organized as follows: In Section 2, related work and background on recommendation systems and the shilling attack problem are introduced. In Section 3, our proposed models are introduced. The experimental results are provided and discussed in Section 4. Finally, Section 5 concludes the paper and provides future directions.
2. Related Work and Background
Recommendation systems (RSs) recommend desirable items to users and manage a vast amount of data. As e-commerce is growing fast, buyers are being fulfilled with various available choices. On the other hand, marketing activities are struggling to provide more customized offers for customers. The increasing diversity in these options results in an issue of information overload. RSs solve this issue by providing personalized recommendations to enhance customers’ purchasing experience. RSs can be classified into various types, such as content-based, collaborative filtering, knowledge-based recommenders, utility-based recommenders [20], demographic-filtering, hybrid systems [20], social-filtering [21], and geographic recommenders [22,23]. The collaborative-filtering RSs work based on finding relationships between new and existing users and recommending items using their similar interests. Research studies on collaborative filtering have been dedicated to selecting the most appropriate algorithm [24], selecting and validating recommendation models [25], promoting a specific selling strategy [26], or enhancing recommendation accuracy with reliability considerations [27]. Content-based RSs recommend products based on the correlation between product attributes, users’ preferences, and user’s previous choices [28]. Demographic Filtering RSs rely on standard profile attributes of users as gender, age, location, etc. They provide the best solution for users in a particular group with many similar neighborhood groups [29]. Knowledge-based RSs understand why an item should be recommended to a user based on knowing how an item fulfills a user requirement [30]. Utility-based RSs compute the utility of every object for a user and provide recommendations. These systems enable the user to indicate all considerations noticed in the recommendations [20]. Social filtering RSs aims to find similar users based on their social information, such as followers, followed, tweets, comments, and posts [31]. Geographic filtering RSs exploit the spread of mobile devices and location-aware systems to assist users with recommendations of events or locations [22]. Hybrid filtering RSs are based on combining multiple recommendation methods to benefit each other [32]. This paper focuses on collaborative filtering recommendation systems as they are very sensitive and vulnerable to shilling attacks.
Due to the openness of collaborative filtering RSs, they are incredibly vulnerable to biased information. Fake user profiles can easily manipulate recommendation results by giving the highest rates to targeted items and rate other items similar to regular profiles. This behavior is called a “shilling attack”. Attacks that are aimed to promote target items are called push attacks, and those to demote target items are called nuke attacks [32]. Attackers tend to use filler ratings to achieve their goal to push or nuke target items while remaining undetected by the system [7]. Attackers exploit fake profiles to inject ratings for both targeted items and another set of items to increase the attack’s impact while remaining unknown. This set of rated items includes a filler and selected items associated with target items. Filler items are a group of chosen items usually selected randomly, which are rated based on the attack types. Selected items are generally small in size; therefore, the number of filler items mostly determines the size of each attack profile [32]. There are different types of shilling attacks to a recommendation system including, random, average, bandwagon, average over popular (AOP), love/hate, and segment attacks. Attack types are different due to their rated items’ set, such as target, filler, selected items, and unrated items. Target items are usually rated equal to the maximum or minimum of possible rates (depending on their goal either to push or nuke), rmax and rmin represent these ratings. Filler items are rated based on attack models; for instance, for random and bandwagon attacks, they are equal to random values of ratings with normal distribution around the mean of all ratings in the dataset. For average and AOP attacks, filler items are rated similar to random ratings with normal distribution around each item’s mean. In contrast, in the segment or love/hate attacks, they are rated as rmax or rmin.
Machine learning methods have been widely used in shilling attack detection problems to detect attack users or attacked items. A support vector machine (SVM) classifier is trained in [31] using suspicious users/items and used additional trust measurement features to discriminate attack profiles. The authors in [33] used K-nearest neighbor (KNN) and SVM. Research work in [7] created separate clusters for items and user profiles to analyze items and discriminate attack users. The authors in [34] performed a target item analysis based on considerable changes in rating distributions and constructed a list of suspicious users. Principal component analysis (PCA) is used as an unsupervised shilling attack detection algorithm [9]. It suffers from low recall values, as some genuine users are misclassified as attackers. Introducing a semi-supervised naive Bayes method, the authors addressed the problem of a lack of labeled users. Their model performed well in detecting hybrid attacks and obfuscated profiles [35]. Using RNNs [12,36], time interval analysis is used for shilling attack detection, considering user’s ratings as sequential data. In [12], the authors used the long short-term memory (LSTM) to predict the next period’s ratings using historical rating records. In [10], a deep learning method using CNNs for attack detection is introduced. Their model is used for modeling sentences, suggesting a similarity between the customer rating and linguistic emotion. They tested the model for different attack types such as random, average, bandwagon, segment, AOP, and mixed. In [11], a detection method using CNN is provided by transforming user profiles to the resized rating matrixes and applied a bicubic interpolation algorithm. The model’s training time is computationally expensive, and it has only been tested on fewer attack models such as random, average, bandwagon. A recent study [37] combines CNN and LSTM methods to detect shilling attacks in the social-aware network. They compared their approach with six basic methods and showed the performance of their model. Compared to the state-of-the-art studies performed in the field, our proposed hybrid models in this paper provide a novel hybrid architecture that combines the CNN with LSTM or GRU with comparable performance; consider both temporal and spatial information in the RS’s ratings with a flexible time segmentation; and perform effectively for variable filler size, attack sizes, and attack types.
3. The Proposed Detection Model
In this paper, we propose a hybrid model to predict shilling attacks based on combing the features of CNNs and RNNs. The hybrid model composes of three layers, as shown in Figure 1. We transformed the rating matrix into a 3D array of users, items, and days in the first input layer. In the second layer, a CNN model is applied to input data, and then its output is conveyed into the RNN model. Finally, we classified users into two groups of genuine and attack users in the output layer using the RNN model. In this combined architecture, the CNN layer works as a feature selection, and the RNN layer allows repeating this operation to build up the internal state. We have developed two different hybrid models that intenerate the CNN and RNN layers. The two models are called CNN-LSTM and CNN-GRU. In the first model, we used long short-term memory. As previous studies have shown that GRU can outperform LSTM [38], the second model uses the gated recurrent unit to better detect shilling attacks. Unlike previous studies that applied CNN or RNN separately on user-based or item-based data, in our model, we aggregated users’ ratings for each item daily. We then created a 3D array of users, items, and days. The time feature in the 3D array is used to consider sequences of ratings in the RNNs, and ratings are aggregated daily. Our model provides a flexible time segmentation, such that the aggregation level is extensible and can be selected based on dataset properties. Therefore, the segmentation can be achieved by changing the aggregation level of ratings over time, such as hourly, daily, weekly, etc.
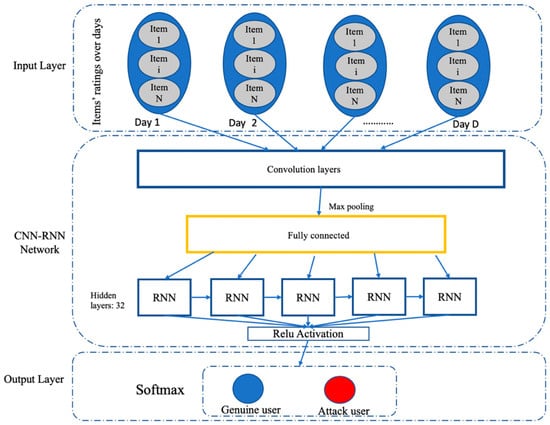
Figure 1.
The proposed CNN–RNN architecture.
To create a hybrid model of CNNs and RNNs to extract ratings’ features and analyze them over time, TimeDistributed in Keras is used. This wrapper enables the model to apply a layer to every temporal slice of an input. Network architecture is designed with the TimeDistributed wrapper, a 2D convolution layer with 32 hidden neurons, a Relu activation function, and a kernel size of 3 × 3. It goes through a max-pooling layer, a dropout, and a flatten layer. In the CNN-LSTM model, an LSTM layer with 32 hidden neurons, a dense layer with Relu activation function, a drop out layer, and another dense layer with Softmax activation function are added to form a final classification of users into genuine and attackers. In the CNN-GRU model, a similar structure is used but using a GRU layer with 32 hidden neurons in the RNN layer in addition to the Relu activation function, one drop out layer, and one dense layer with a Softmax activation function. In both models, we used “Adam optimizer” and “categorical_crossentropy” as the optimizer and a loss function, respectively. Feature extraction is performed on a 2D array of items’ ratings per day, and then the result is used in the RNN layer to classify users into two groups of genuine and attack users. Assuming that existing users in the dataset are all genuine users, we injected attack profiles based on different attack models and parameters. For every attack profile, we defined a target item set, filler item set, and selected item set accordingly. We injected all attacks with push attack types. As the only difference between push and nuke attack types is in the rating of target items, the former is rated with rmax (maximum possible rate in RS) and later with rmin (minimum possible rate in RS). The proposed models can be easily applied to nuke attacks too. Table 1 briefly shows the logic of generating attack profiles. Two parameters of attack size and filler items should be defined before injecting attack profiles. Attack size affects the number of fake users, and filler items affect the number of filler items. Target items are selected randomly, and their numbers are a fixed value. In this paper, we set it equal to 100. Popular items in the bandwagon attack model are those items rated by a large group of users.µr and δr are the average and the standard deviation of all ratings in the dataset. µri and δri are the average and the standard deviation of ratings of item i. The rmax shows the system’s maximum rating, which is equal to 5 in our experimental work. The number of filler items set for the average over popular (AOP) attack is x% of popular items, which is equal to 1% in our experimental work. Four attack models are considered in this paper, including random, average, bandwagon, and AOP.

Table 1.
The logic of attack models.
4. Results and Discussion
This section discusses the performance of the proposed models on two real datasets. The performance is quantified by the accuracy and the F1-measure validation measures [32,39,40]. We compared the proposed models to individual CNN and LSTM, and GRU. The hybrid model is run in 5 epochs and 20 batch sizes. The experimental work is conducted on the Intel Core i5 processor with a 1.60 GHz speed and 8 GB RAM.
4.1. Experimental Datasets
Two benchmark datasets, Movie-Lens 100 K (https://grouplens.org/datasets/movielens/), and Netflix (https://netflixprize.com/index.html), are used in this research. In the Movie-Lens dataset, there are 943 users with 100,000 ratings on 1682 movies. Ratings are from 1 to 5, with 5 indicating the best movie. The Netflix2 dataset has 470,758 users who have rated movies. Since the Movie-Lens dataset is too small in comparison with the Netflix dataset, we used a subset of the Netflix dataset. The subset dataset is chosen randomly and consists of ratings from 1238 users for seven months, including movies with at least 60 rates. Both datasets are split to train and test, considering 30% as test data.
4.2. Performance Evaluation
To provide a comprehensive analysis of the proposed models, two evaluation metrics are used, including accuracy and F1-measure. Accuracy is not enough for measuring the model’s performance as it does not reflect false-positive and false-negative rates. F1-measure helps to avoid misclassification of genuine users, which can influence the recommendation quality. These metrics are calculated as:
4.3. Hybrid CNN-LSTM Results
The performance of the hybrid CNN-LSTM model is evaluated for the four different attack types, including random, average, bandwagon, and AOP. To investigate the model performance with varying attack parameters, we injected attacks with varying filler sizes, including 1%, 3%, 5%, 7%, and 9%, with various attack sizes, including 10%, 15, and 20%. Table 2 shows the prediction accuracy for each attack model at different filler and attack sizes for the Movie-Lens 100 K dataset. It shows that for the random attack, the CNN-LSTM model produces high accuracy of up to 99.97% with filler sizes between 5% to 7%. As with the increase in the number of attack sizes, the detection of those attacks becomes harder. It also shows the same results for the average attack, and the model achieves high accuracy with a 15% attack size with an overall accuracy above 99%. For the bandwagon attack, the CNN-LSTM achieves 99.67% accuracy for a filler size of 5% and a small attack size of 10%. All the variations in both attack size and filler size for the bandwagon attack resulted in more than 97% accuracy, which is excellent performance for this complicated attack type. Based on the results in Table 2, we can see that the CNN-LSTM model has an accuracy that exceeds 98% for the AOP attack detection, which can be considered an obfuscated attack. Table 3 shows the prediction accuracy for each attack type with variable filler and attack sizes for the Netflix dataset. In this table, for the random attack, the same filler sizes and larger attack sizes result in better accuracy. For the average attack, although the best accuracy resulted from the largest filler size and attack sizes 9% and 20%, other scenarios result in more than 93% accuracy on the Netflix dataset. As shown in Table 3, the CNN-LSTM performance on obfuscated attack types exceeds 95% accuracy. The reason for low accuracy is based on high sparsity in the Netflix dataset. From Table 2 and Table 3, it can be shown that the CNN-LSTM model shows better performance at different values of filler and attack sizes for all types of attacks.

Table 2.
Accuracy (%) of the CNN-long short-term memory (LSTM) model: Movie-Lens dataset.

Table 3.
Accuracy (%) of the CNN-LSTM model: Netflix dataset.
Figure 2, Figure 3, Figure 4, Figure 5, Figure 6 and Figure 7 show the CNN-LSTM model’s performance on Movie-Lens100K and Netflix datasets using F1-measure metric, for different attack sizes of 10%, 15% and 20% and various filler sizes of 1%, 3%, 5%, 7% and 9%. We can see that for the smallest attack size (10%), and biggest filler size (9%), random, average, and AOP attacks show less F1-measure in the Movie-Lens dataset. Figure 2, Figure 3, Figure 4, Figure 5, Figure 6 and Figure 7 verify that attacks are more predictable when there is a larger attack size (20%), as all the F1-measures in Figure 4 are above 0.97. Unlike previous studies that showed poor performance on smaller attack sizes, Figure 2 and Figure 5 show that the hybrid model achieves an F1-measure that exceeds 0.94 with all varying filler sizes. All figures show good performance for an obfuscated attack as AOP.
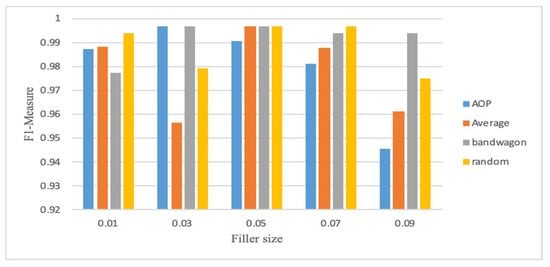
Figure 2.
F1-measure for CNN-LSTM with 10% attack size (Movie-Lens).
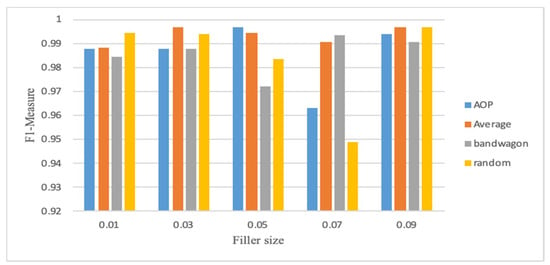
Figure 3.
F1-measure for CNN-LSTM with 15% attack size (Movie-Lens).
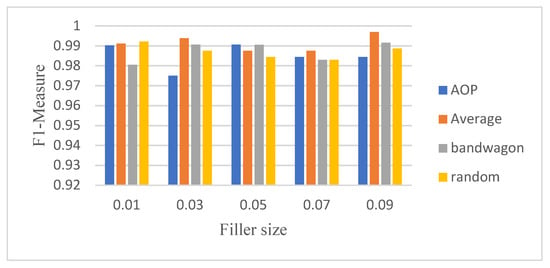
Figure 4.
F1-measure for CNN-LSTM with 20% attack size (Movie-Lens).
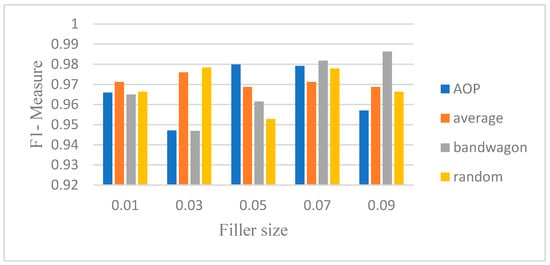
Figure 5.
F1-measure for CNN-LSTM with 10% attack size (Netflix).
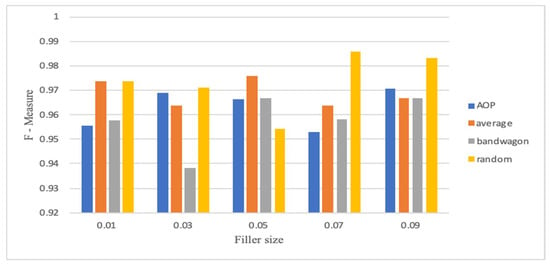
Figure 6.
F1-measure for CNN-LSTM with 15% attack size (Netflix).
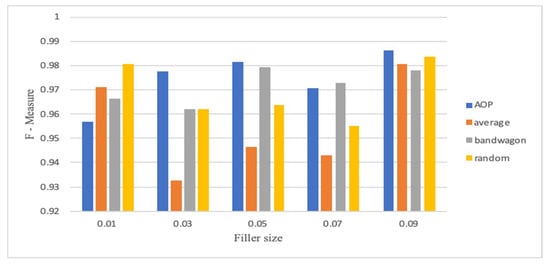
Figure 7.
F1-measure for CNN-LSTM with 20% attack size (Netflix).
4.4. Hybrid CNN-GRU Results
This section illustrates the results of running the hybrid CNN-GRU model on the Movie-Lens 100 K and Netflix dataset. Table 4 shows the accuracy of prediction for different parameters on the Movie-Lens dataset. Although accuracy is more than 95% in all scenarios for the random attack, increasing filler size would cause a slight reduction in the prediction accuracy. However, the accuracy rises again for larger filler sizes. This table shows that the CNN-GRU model achieves the highest accuracy for the bandwagon attack for a massive attack size of 20%. Table 5 shows the accuracy of prediction for different parameters on the Netflix dataset. We can see that although overall accuracy is less than CNN-LSTM modes with the same parameters, this model shows accuracy of up to 99.7%.

Table 4.
Accuracy (%) of the CNN-gated recurrent units (GRU): Movie-Lens dataset.

Table 5.
Accuracy (%) of the CNN-GRU: Netflix dataset.
4.5. Comparative Analysis
In this section, we compared the proposed hybrid models’ performance to the individual-based CNN, LSTM, and GRU models for both Movie-Lens and Netflix datasets. Figure 8, Figure 9, Figure 10 and Figure 11 and Figure 12, Figure 13, Figure 14 and Figure 15 show the F1-measure values with 15% attack size and different filler sizes for the Movie-Lens and Netflix datasets, respectively. It can be shown from Figure 8, Figure 9, Figure 10, Figure 11, Figure 12, Figure 13, Figure 14 and Figure 15 that hybrid models achieve higher values of the F1-measure as compared to the individual CNN, LSTM, and GRU models at variable filler sizes, which shows the efficiency of the proposed model in detecting various types of shilling’s attacks. The hybrid models perform much better than the individual approaches.
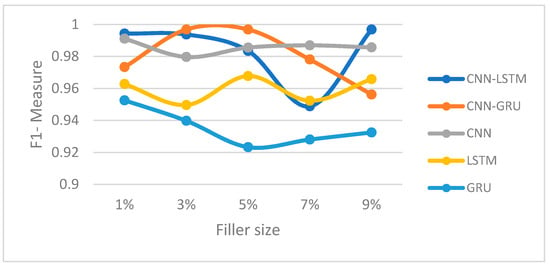
Figure 8.
F1-measure trajectory (random attack) (Movie-Lens).
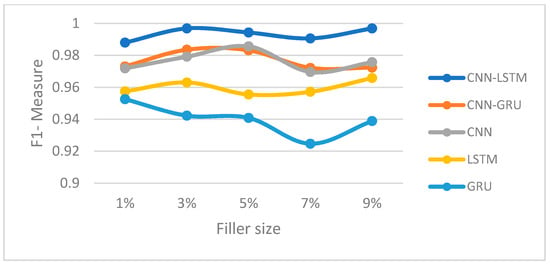
Figure 9.
F1-measure trajectory (average attack) (Movie-Lens).
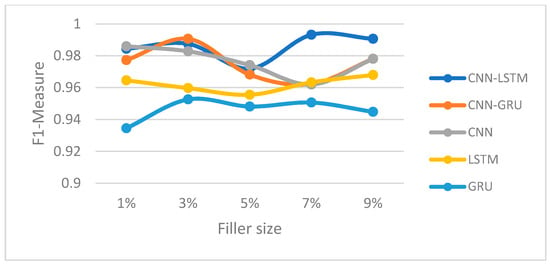
Figure 10.
F1-measure trajectory (bandwagon attack) (Movie-Lens).
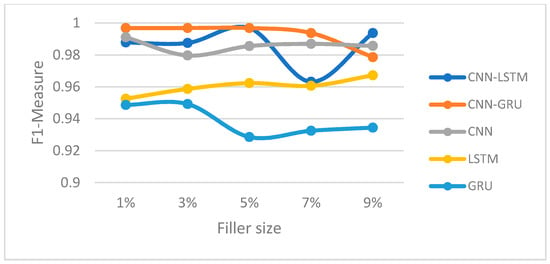
Figure 11.
F1-measure trajectory(AOP attack) (Movie-Lens dataset).
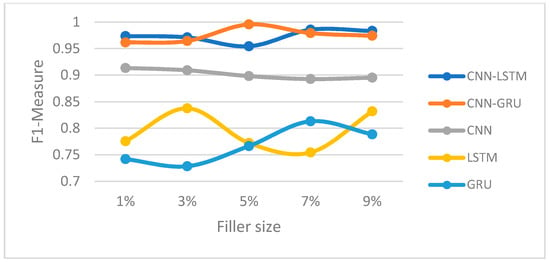
Figure 12.
F1-measure trajectory (random attack) (Netflix dataset).
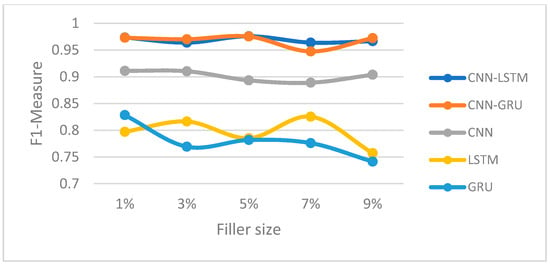
Figure 13.
F1-measure trajectory (average attack) (Netflix dataset).
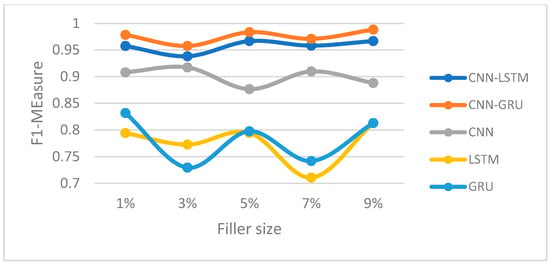
Figure 14.
F1-measure trajectory (bandwagon attack) (Netflix dataset).
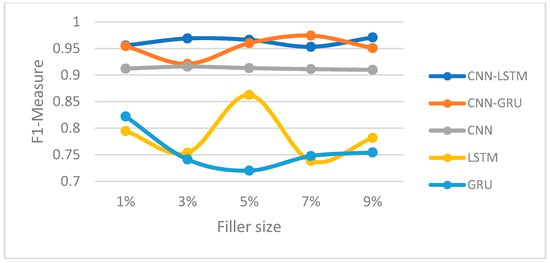
Figure 15.
F1-measure trajectory (AOP attack) (Netflix dataset).
Table 6 and Table 7 show the best performance of each model with their corresponding parameters. The CNN-LSTM and CNN-GRU models achieve the best performance compared to using a single CNN, RNN, or GRU. Considering that different types of attacks may occur to a recommendation system, the proposed methods can be generalized for various attack types. Despite all benefits of using the hybrid model, we should mention the high computational cost of applying this hybrid method to massive datasets, especially in increasing the number of hidden neurons.

Table 6.
Comparison of the accuracy (Movie-Lens dataset).

Table 7.
Comparison of the accuracy (Netflix dataset).
As we compared the performance of the proposed hybrid model with individual-based deep learning models, in the following, we compared the proposed models with the state-of-the-art shilling attack hybrid deep learning model available in the literature, including DNN (Deep Neural Network), CNN-SADS (Combination of CNN and Social Aware Network), IPP-SNS-SAD (Integrated Perception Patterns and Social Network Search-based Shilling Attack Detection), and SEMISLM-SAD (Semi-Supervised Learning Method of Shilling Attack Detection) hybrid schemes as discussed in [37]. The comparison is made based on the value of the F1-measure obtained against attacks such as random attack, bandwagon attack, and average attack. As reported in [37], for the Movie-Lens dataset, the F1-measure of the proposed DNN scheme is greater than 0.9, compared to the benchmarked CNN-SADS, IPP-SNSSAD, and SEMI-SLM-SAD against all the three types of obfuscated attack. On the contrary, IPP-SNS-SAD and SEMISLM-SAD models performed not as well as the F1-measure, struggling to reach 41% and 29%, which is considered an unstable outcome. In particular, our proposed architecture in this paper, using the CNN-GRU model, achieved an F1-measure that exceeds 0.997. Moreover, for the Netflix dataset, the DNN, CNN-SADS, IPP-SNS-SAD, and SEMISLM-SAD achieved an F1-measure of 0.9, 0.9, 0.39, and 0.28, respectively. Our proposed models achieved an F1-measure of 0.997. Furthermore, it was denoted in [37] that the classification accuracy of the DNN model achieved a maximum accuracy of 94.29% as compared to the CNN-SADS, IPP-SNS-SAD, and SEMISLM-SAD. In our hybrid architecture, the proposed CNN-LSTM and CNN-GRU reached an accuracy of 99.72% and 99.74% for both the Movie-Lens and Netflix datasets. This performance reveals that the proposed hybrid CNN-LSTM and CNN-GRU models can detect shilling attack profiles under different obfuscated attacks.
5. Conclusions and Future Directions
In this paper, two-hybrid deep learning methods are proposed for detecting shilling attacks. These models are end-to-end solutions to extract the dataset’s features directly from rating data and model temporal and spatial information in the RS’s ratings. We propose two hybrid models that combine CNN and RNN models for detecting attack users in a shilling attack environment. Our first proposed model is a combination of CNN and LSTM layers, and the second one is a combination of CNN and GRU layers. We concluded that the CNN-LSTM model performs better than CNN-GRU. Both models performed very well on two benchmark movie rating datasets compared to single CNN, LSTM, and GRU models and hybrid models, such as DNN, CNN-SADS, IPP-SNS-SAD, and SEMISLM-SAD in terms of accuracy and F1-measure. We tested the models’ performance by injecting different attack profiles in terms of filler size and attack size for four different attack models, including “random”, “average”, “bandwagon,” and “AOP” attack. The proposed models resulted in up to 99% accuracy. We noticed that the model results in higher accuracy when filler sizes are small or big and lower accuracy with medium filler sizes. We can also conclude that the larger the attack size, the better the accuracy. Our proposed model provides an end-to-end solution, which deeply extracts profile features of users or items. This method is independent of attack type and considers both temporal and spatial information in the RS’s ratings dataset. Future directions include improving the models’ efficiency by using bigger datasets with various sparsity levels.
Author Contributions
Conceptualization, M.E. and R.K.; methodology, M.E. and R.K.; software, M.E.; validation, M.E. and R.K.; formal analysis, R.K.; investigation, R.K.; resources, M.E.; data curation, M.E.; writing—original draft preparation, M.E. and R.K.; writing—review and editing, M.E. and R.K.; visualization, M.E. and R.K.; supervision, R.K.; project administration, R.K.; funding acquisition, R.K. All authors have read and agreed to the published version of the manuscript.
Funding
This research was funded by Ryerson University, Start-up-fund and the APC was also funded by start-up fund.
Conflicts of Interest
The authors declare no conflict of interest
References
- Chirita, P.-A.; Nejdl, W.; Zamfir, C. Preventing Shilling Attacks in Online Recommender Systems. In Proceedings of the 7th ACM International Workshop on Web Information and Data Management, Bremen, Germany, 4 November 2005; pp. 67–74. [Google Scholar]
- Xia, H.; Fang, B.; Gao, M.; Ma, H.; Tang, Y.; Wen, J. A novel item anomaly detection approach against shilling attacks in collaborative recommendation systems using the dynamic time interval segmentation technique. Inf. Sci. 2015, 306, 150–165. [Google Scholar] [CrossRef]
- Yang, Z.; Cai, Z. Detecting Anomalous Ratings in Collaborative Filtering Recommender Systems. Int. J. Digit. Crime Forensics 2016, 8, 16–26. [Google Scholar] [CrossRef]
- Bilge, A.; Ozdemir, Z.; Polat, H. A Novel Shilling Attack Detection Method. Procedia Comput. Sci. 2014, 31, 165–174. [Google Scholar] [CrossRef]
- Zayed, R.A.; Ibrahim, L.F.; Hefny, H.A.; Salman, H.A. Shilling Attacks Detection in Collaborative Recommender System: Challenges and Promise. In Proceedings of the Workshops of the International Conference on Advanced Information Networking and Applications, Caserta, Italy, 15–17 April 2020; Springer: Cham, Switzerland; pp. 429–439. [Google Scholar]
- Zhang, S.; Chakrabarti, A.; Ford, J.; Makedon, F. Attack Detection in Time Series for Recommender Systems. In Proceedings of the 12th ACM SIGKDD International Conference on Knowledge Discovery and Data Mining, Philadelphia, PA, USA, 20–23 August 2006; Association for Computing Machinery: New York NY, USA; pp. 809–814. [Google Scholar]
- Lee, J.-S.; Zhu, D. Shilling Attack Detection—A New Approach for a Trustworthy Recommender System. INFORMS J. Comput. 2012, 24, 117–131. [Google Scholar] [CrossRef]
- Alonso, S.; Bobadilla, J.; Ortega, F.; Moya, R. Robust Model-Based Reliability Approach to Tackle Shilling Attacks in Collaborative Filtering Recommender Systems. IEEE Access 2019, 7, 41782–41798. [Google Scholar] [CrossRef]
- Mehta, B.; Nejdl, W. Unsupervised strategies for shilling detection and robust collaborative filtering. User Model. User Adapt. Interact. 2008, 19, 65–97. [Google Scholar] [CrossRef]
- Tong, C.; Yin, X.; Li, J.; Zhu, T.; Lv, R.; Sun, L.; Rodrigues, J.J.P.C. A shilling attack detector based on convolutional neural network for collaborative recommender system in social aware network. Comput. J. 2018, 61, 949–958. [Google Scholar] [CrossRef]
- Zhou, Q.; Wu, J.; Duan, L. Recommendation attack detection based on deep learning. J. Inf. Secur. Appl. 2020, 52, 102493. [Google Scholar] [CrossRef]
- Gao, J.; Qi, L.; Huang, H.; Sha, C. Shilling Attack Detection Scheme in Collaborative Filtering Recommendation System Based on Recurrent Neural Network. In Proceedings of the Future of Information and Communication Conference, San Francisco, CA, USA, 5–6 March 2020; Springer: Cham, Switzerland; pp. 634–644. [Google Scholar]
- Deng, L.; Platt, J. Ensemble Deep Learning for Speech Recognition, in Proc. Interspeech, 2014. In Proceedings of the 15th Annual Conference of the International Speech Communication Association, Singapore, 14–18 September 2014. [Google Scholar]
- Zhang, R.; Yuan, Z.; Shao, X. A New Combined CNN-RNN Model for Sector Stock Price Analysis. In Proceedings of the IEEE 42nd Annual Computer Software and Applications Conference (COMPSAC), Tokyo, Japan, 23–27 July 2018; pp. 546–551. [Google Scholar] [CrossRef]
- Kim, T.-Y.; Cho, S.-B. Web traffic anomaly detection using C-LSTM neural networks. Expert Syst. Appl. 2018, 106, 66–76. [Google Scholar] [CrossRef]
- Guo, L.; Zhang, D.; Wang, L.; Wang, H.; Cui, B. CRAN: A Hybrid CNN-RNN Attention-Based Model for Text Classification. In International Conference on Conceptual Modeling, Xi’an, China, 22–25th October; Springer: Cham, Switzerland, 2018; pp. 571–585. [Google Scholar]
- Guo, X.; Zhang, H.; Yang, H.; Xu, L.; Ye, Z. A Single Attention-Based Combination of CNN and RNN for Relation Classification. IEEE Access 2019, 7, 12467–12475. [Google Scholar] [CrossRef]
- Hsu, S.T.; Moon, C.; Jones, P.; Samatova, N. A Hybrid CNN-RNN Alignment Model for Phrase-Aware Sentence Classification. In Proceedings of the 15th Conference of the European Chapter of the Association for Computational Linguistics: Volume 2, Short Papers, Valencia, Spain, 3–7 April 2017; pp. 443–449. [Google Scholar]
- Kim, T.-Y.; Cho, S.-B. Predicting the Household Power Consumption Using CNN-LSTM Hybrid Networks. In International Conference on Intelligent Data Engineering and Automated Learning, Madrid, Spain, 21–23 November 2018; Springer: Cham, Switzerland, 2018; pp. 481–490. [Google Scholar]
- Burke, R. Hybrid Recommender Systems: Survey and Experiments. User Model. User Adapt. Interact. 2002, 12, 331–370. [Google Scholar] [CrossRef]
- Jiang, Y.; Chen, H.; Yang, B. Deep social collaborative filtering by trust. IEEE Trans. Pattern Anal. Mach. Intell. 2018, 39, 1633–1647. [Google Scholar]
- Bobadilla, J.; Ortega, F.; Hernando, A.; Gutiérrez, A. Recommender systems survey. Knowl. Based Syst. 2013, 46, 109–132. [Google Scholar] [CrossRef]
- Oku, K.; Kotera, R.; Sumiya, K. Geographical Recommender System Based on Interaction Between Map Operation and Category Selection. In Proceedings of the 1st International Workshop on Information Heterogeneity and Fusion in Recommender Systems, Barcelona, Spain, 26 September 2010; Association of Computing Machinery: New York, NY, USA; pp. 71–74. [Google Scholar]
- Geuens, S.; Coussement, K.; De Bock, K.W. A framework for configuring collaborative filtering-based recommendations derived from purchase data. Eur. J. Oper. Res. 2018, 265, 208–218. [Google Scholar] [CrossRef]
- Huang, Z.; Zeng, D.D. Why Does Collaborative Filtering Work? Transaction-Based Recommendation Model Validation and Selection by Analyzing Bipartite Random Graphs. INFORMS J. Comput. 2011, 23, 138–152. [Google Scholar] [CrossRef]
- Gunes, I.; Kaleli, C.; Bilge, A.; Polat, H. Shilling attacks against recommender systems: A comprehensive survey. Artif. Intell. Rev. 2012, 42, 767–799. [Google Scholar] [CrossRef]
- Zhu, B.; Ortega, F.; Bobadilla, J.; Gutiérrez, A. Assigning reliability values to recommendations using matrix factorization. J. Comput. Sci. 2018, 26, 165–177. [Google Scholar] [CrossRef]
- Cao, J.; Wu, Z.; Mao, B.; Zhang, Y. Shilling attack detection utilizing semi-supervised learning method for collaborative recommender system. World Wide Web 2012, 16, 729–748. [Google Scholar] [CrossRef]
- Claypool, M.; Anuja, G.; Tim, M.; Paul, M.; Dmitry, N.; Matthew, S. Combing Content-Based and Collaborative Filters in an Online Newspaper. 1999. Available online: https://digitalcommons.wpi.edu/computerscience-pubs/194/ (accessed on 2 October 2020).
- Carrer-Neto, W.; Hernández-Alcaraz, M.L.; Valencia-García, R.; García-Sánchez, F. Social knowledge-based recommender system. Application to the movies domain. Expert Syst. Appl. 2012, 39, 10990–11000. [Google Scholar] [CrossRef]
- Xu, Y.; Zhang, F. Detecting shilling attacks in social recommender systems based on time series analysis and trust features. Knowl. Based Syst. 2019, 178, 25–47. [Google Scholar] [CrossRef]
- Mobasher, B.; Burke, R.; Bhaumik, R.; Williams, C. Toward trustworthy recommender systems. ACM Trans. Internet Technol. 2007, 7, 23. [Google Scholar] [CrossRef]
- Batmaz, Z.; Yilmazel, B.; Kaleli, C. Shilling attack detection in binary data: A classification approach. J. Ambient. Intell. Humaniz. Comput. 2019, 11, 2601–2611. [Google Scholar] [CrossRef]
- Cai, H.; Zhang, F. Detecting shilling attacks in recommender systems based on analysis of user rating behavior. Knowl. Based Syst. 2019, 177, 22–43. [Google Scholar] [CrossRef]
- Wu, Z.; Wu, J.; Cao, J.; Tao, D. HySAD: A Semi-Supervised Hybrid Shilling Attack Detector for Trustworthy Product Recommendation. In Proceedings of the 18th ACM SIGKDD International Conference on Knowledge Discovery and Data Mining, Beijing, China, 12–16 August 2012; Association of Computing Machinery: New York, NY, USA; pp. 985–993. [Google Scholar]
- Tian, Y.; Pan, L. Predicting Short-Term Traffic Flow by Long Short-Term Memory Recurrent Neural Network. In Proceedings of the 2015 IEEE International Conference on Smart City/SocialCom/SustainCom (SmartCity), Chengdu, China, 19–21 December 2015; pp. 153–158. [Google Scholar]
- Vivekanandan, K.; Praveena, N. Hybrid convolutional neural network (CNN) and long-short term memory (LSTM) based deep learning model for detecting shilling attack in the social-aware network. J. Ambient. Intell. Humaniz. Comput. 2020. [Google Scholar] [CrossRef]
- Chung, J.; Gulcehre, C.; Cho, K.; Bengio, Y. Empirical evaluation of gated recurrent neural networks on sequence modeling. arXiv 2014, arXiv:1412.3555. [Google Scholar]
- Kashef, R. Enhancing the Role of Large-Scale Recommendation Systems in the IoT Context. IEEE Access 2020, 8, 178248–178257. [Google Scholar] [CrossRef]
- Nawara, D.; Kashef, R. IoT-based Recommendation Systems–An Overview. In Proceedings of the 2020 IEEE International IOT, Electronics and Mechatronics Conference (IEMTRONICS), Vancouver, BC, Canada, 9–12 September 2020; pp. 1–7. [Google Scholar] [CrossRef]
Publisher’s Note: MDPI stays neutral with regard to jurisdictional claims in published maps and institutional affiliations. |
© 2020 by the authors. Licensee MDPI, Basel, Switzerland. This article is an open access article distributed under the terms and conditions of the Creative Commons Attribution (CC BY) license (http://creativecommons.org/licenses/by/4.0/).