Probabilistic Unsupervised Machine Learning Approach for a Similar Image Recommender System for E-Commerce

Abstract
1. Introduction
- Homogeneity (hg), Completeness (cp) are the measures for the same class and same cluster predictions [18], and harmonic mean can be computed using V-measure [19] as described in Equation (3) [16].where is the random value to be randomly considered as less than 1, the harmonic mean value ranges between 0 and 1, and the highest value will be the best to consider.
- The Fowlkes–Mallows score (FMS) [20,21] is used to compute the geometric mean of the similarity of the clusters where the ground truth labels are known where the FMS is lying between the 0 and 1, and a greater value is a better similarity among the clusters. The FMS uses the True Positives (TP), False Positive (FP), and False Negative (FN) for the similarity measure analysis is shown in Equation (4) [16].
2. Related Works
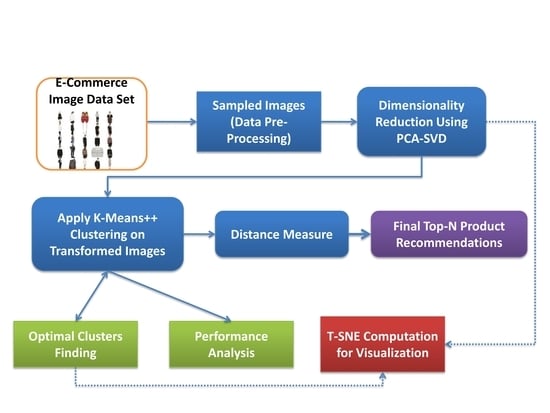
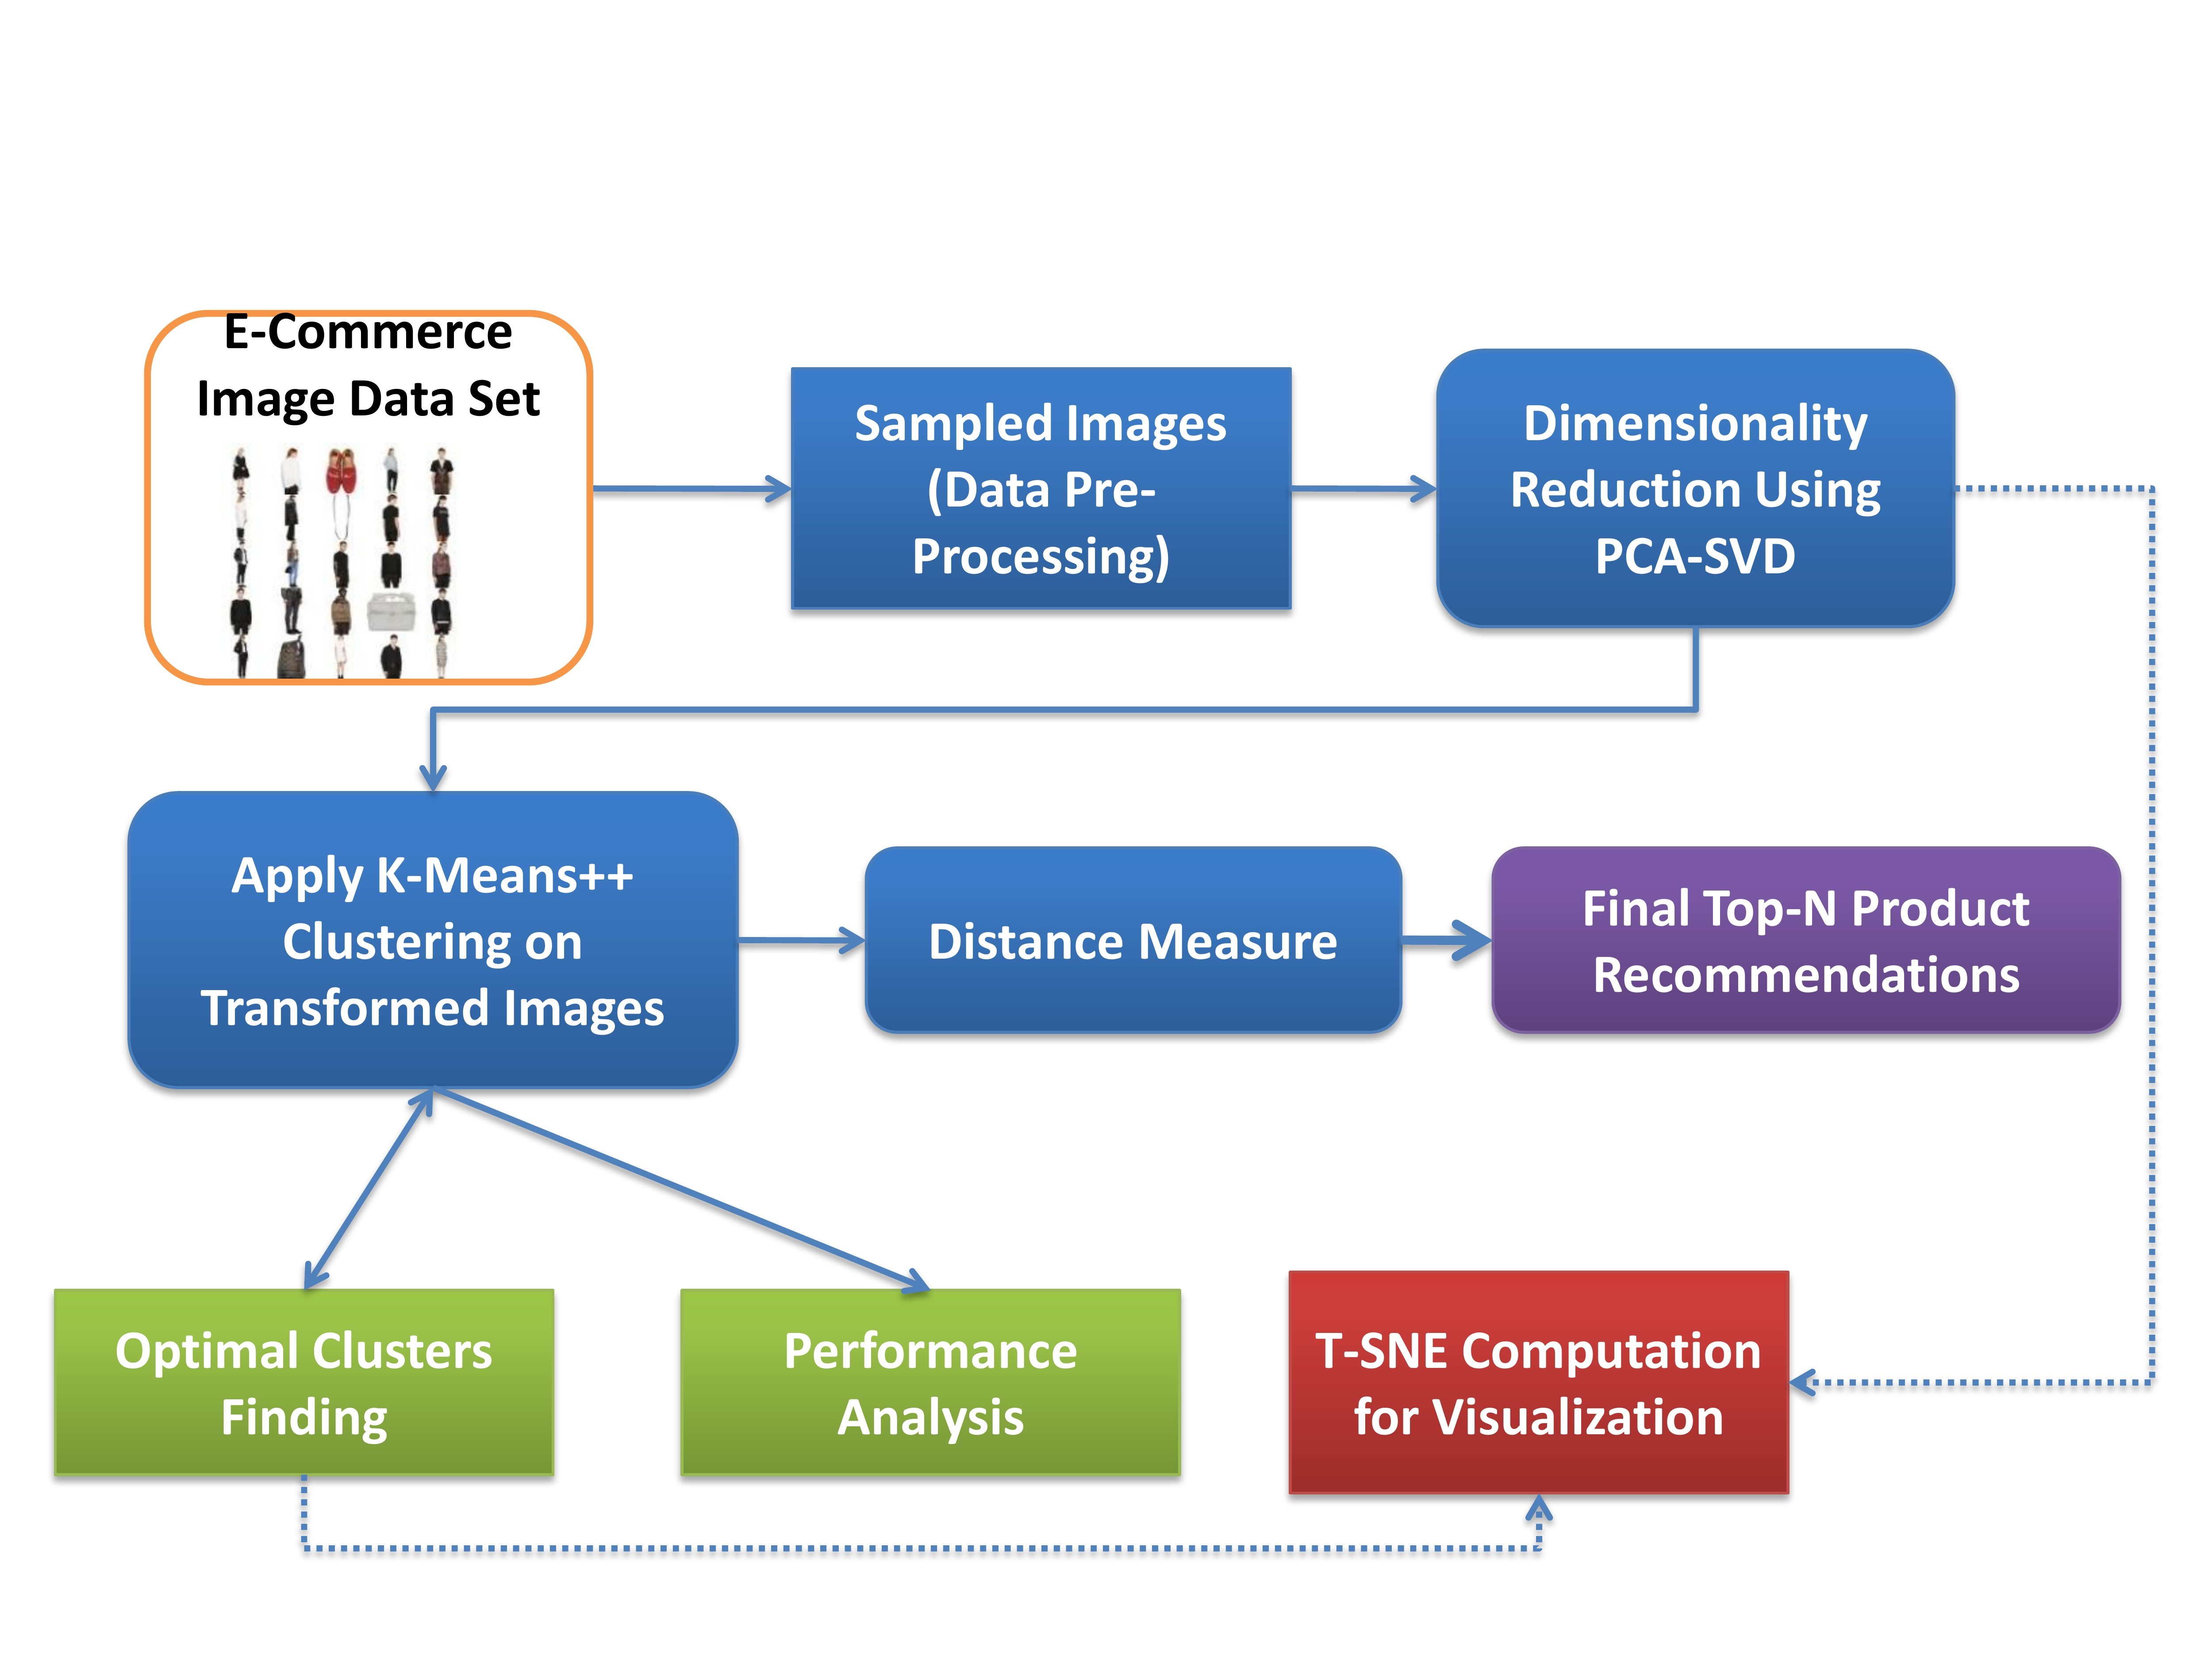
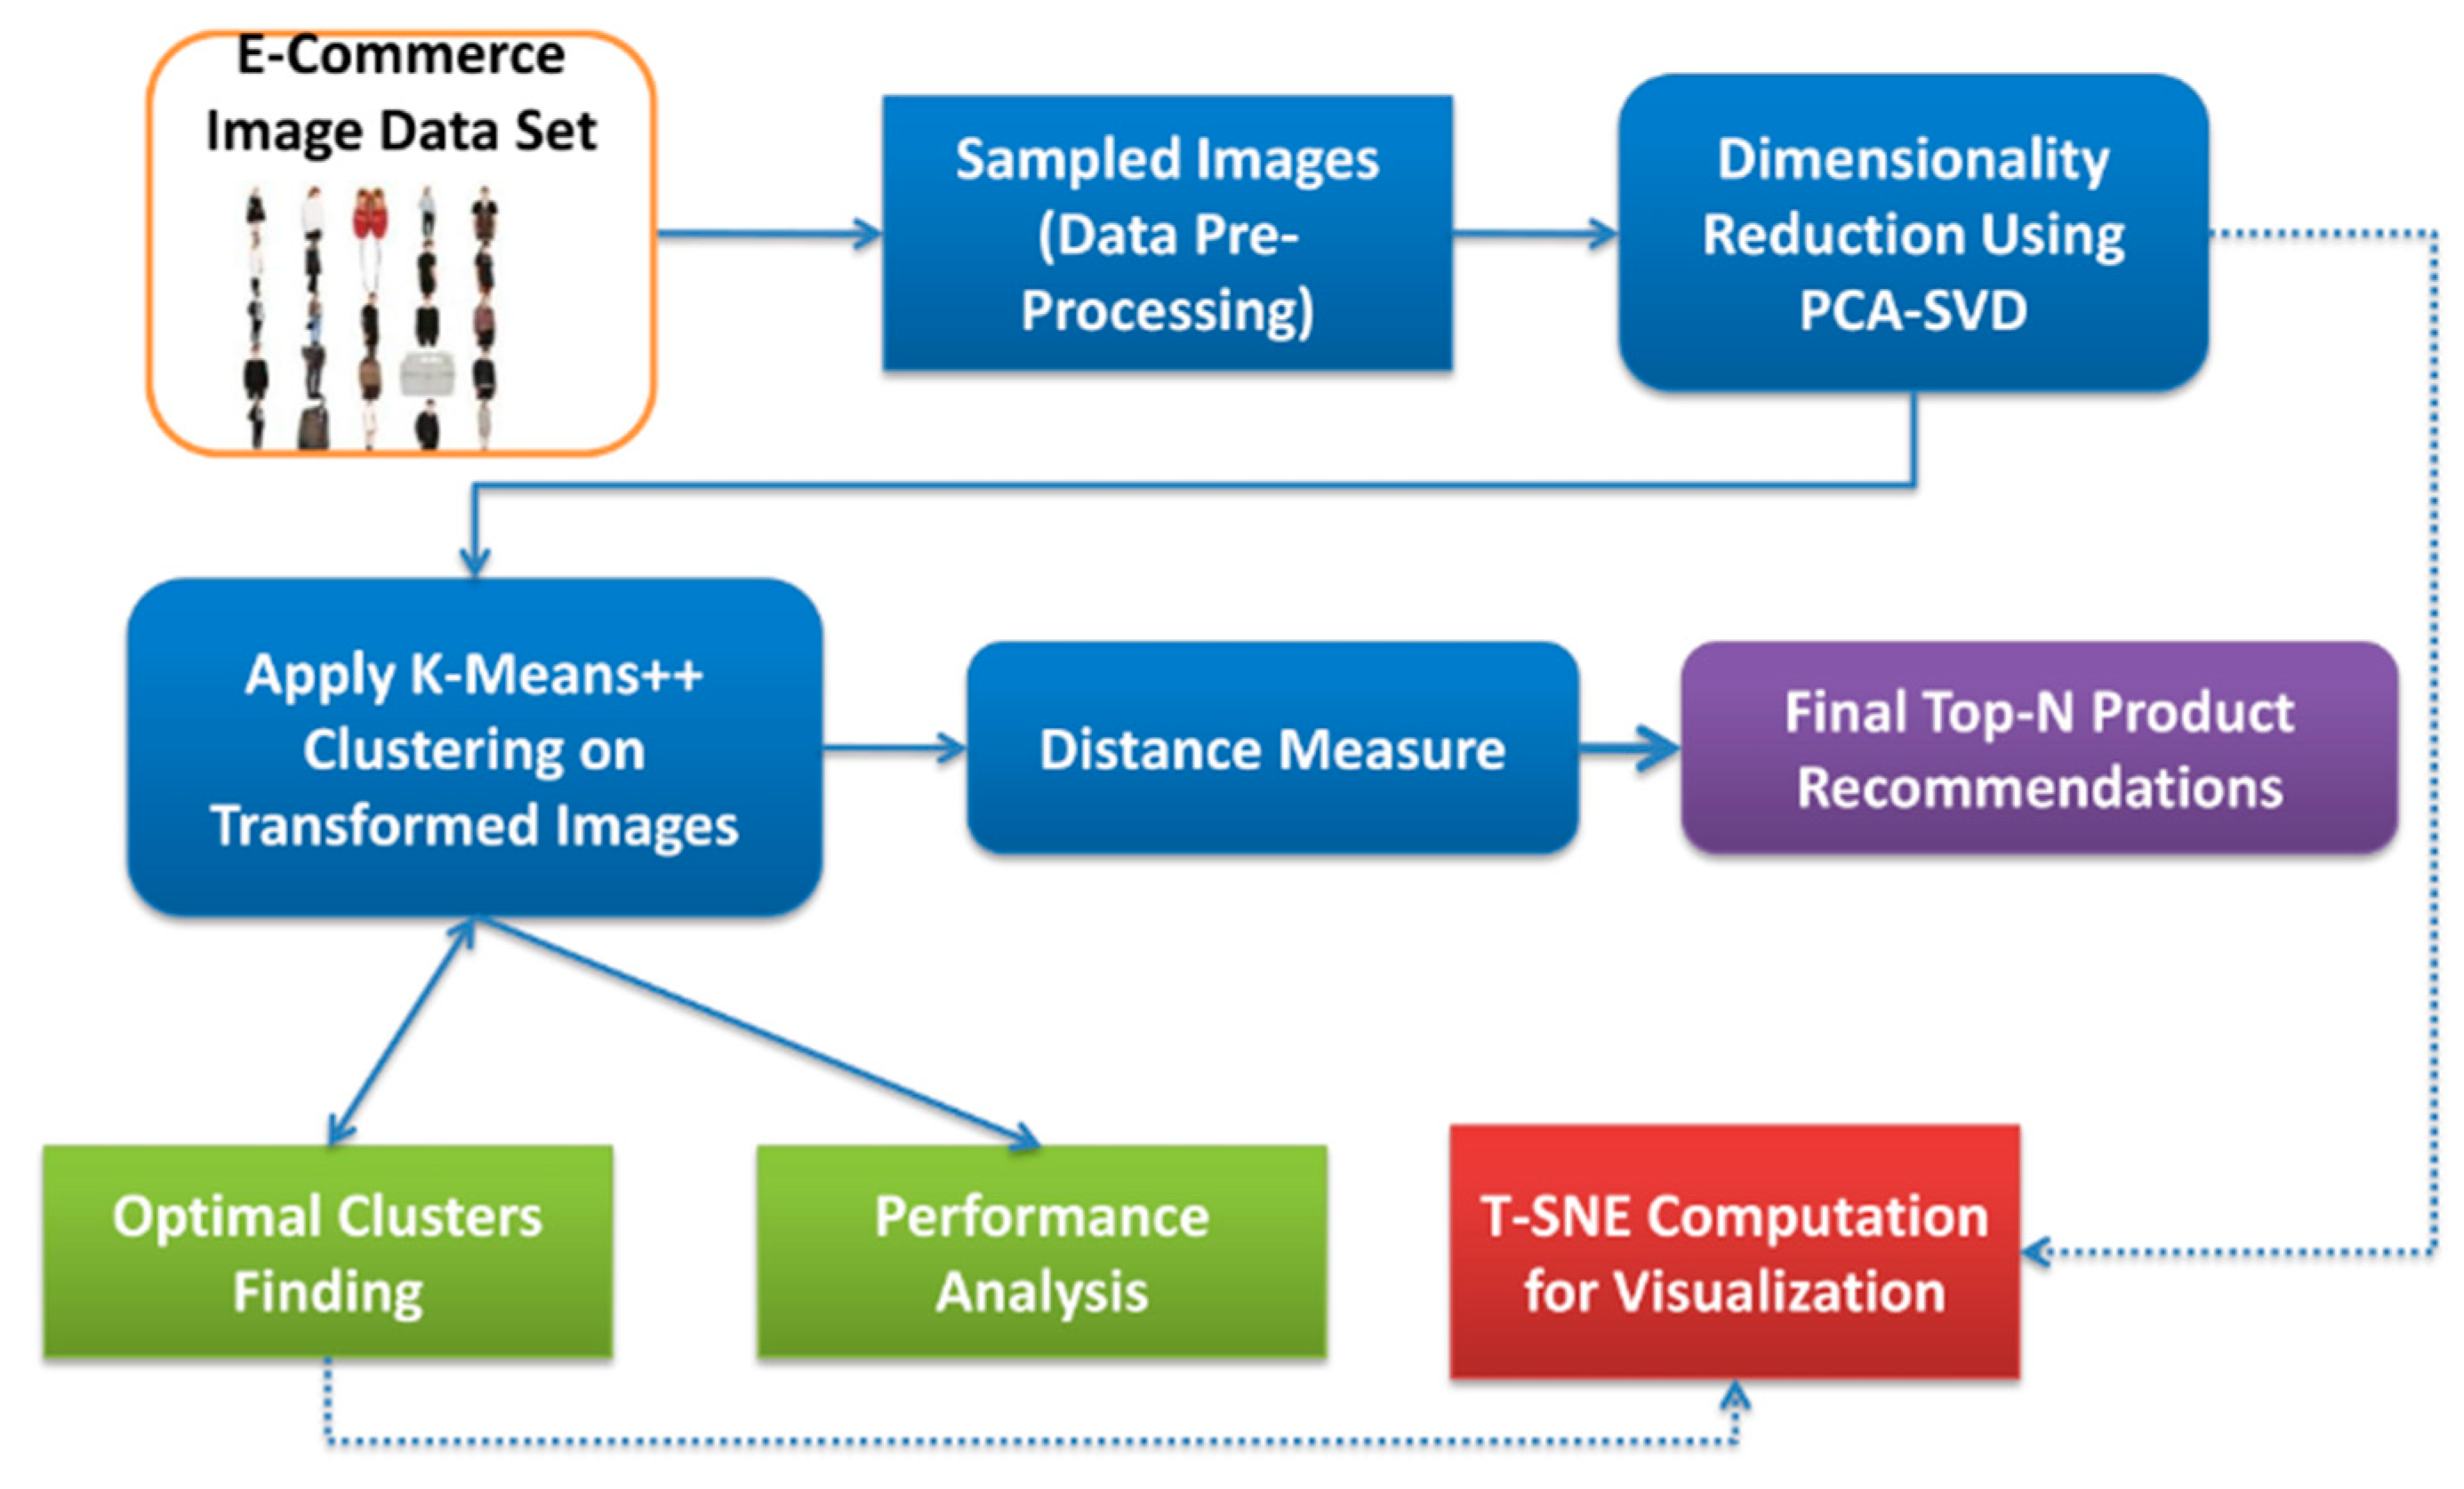
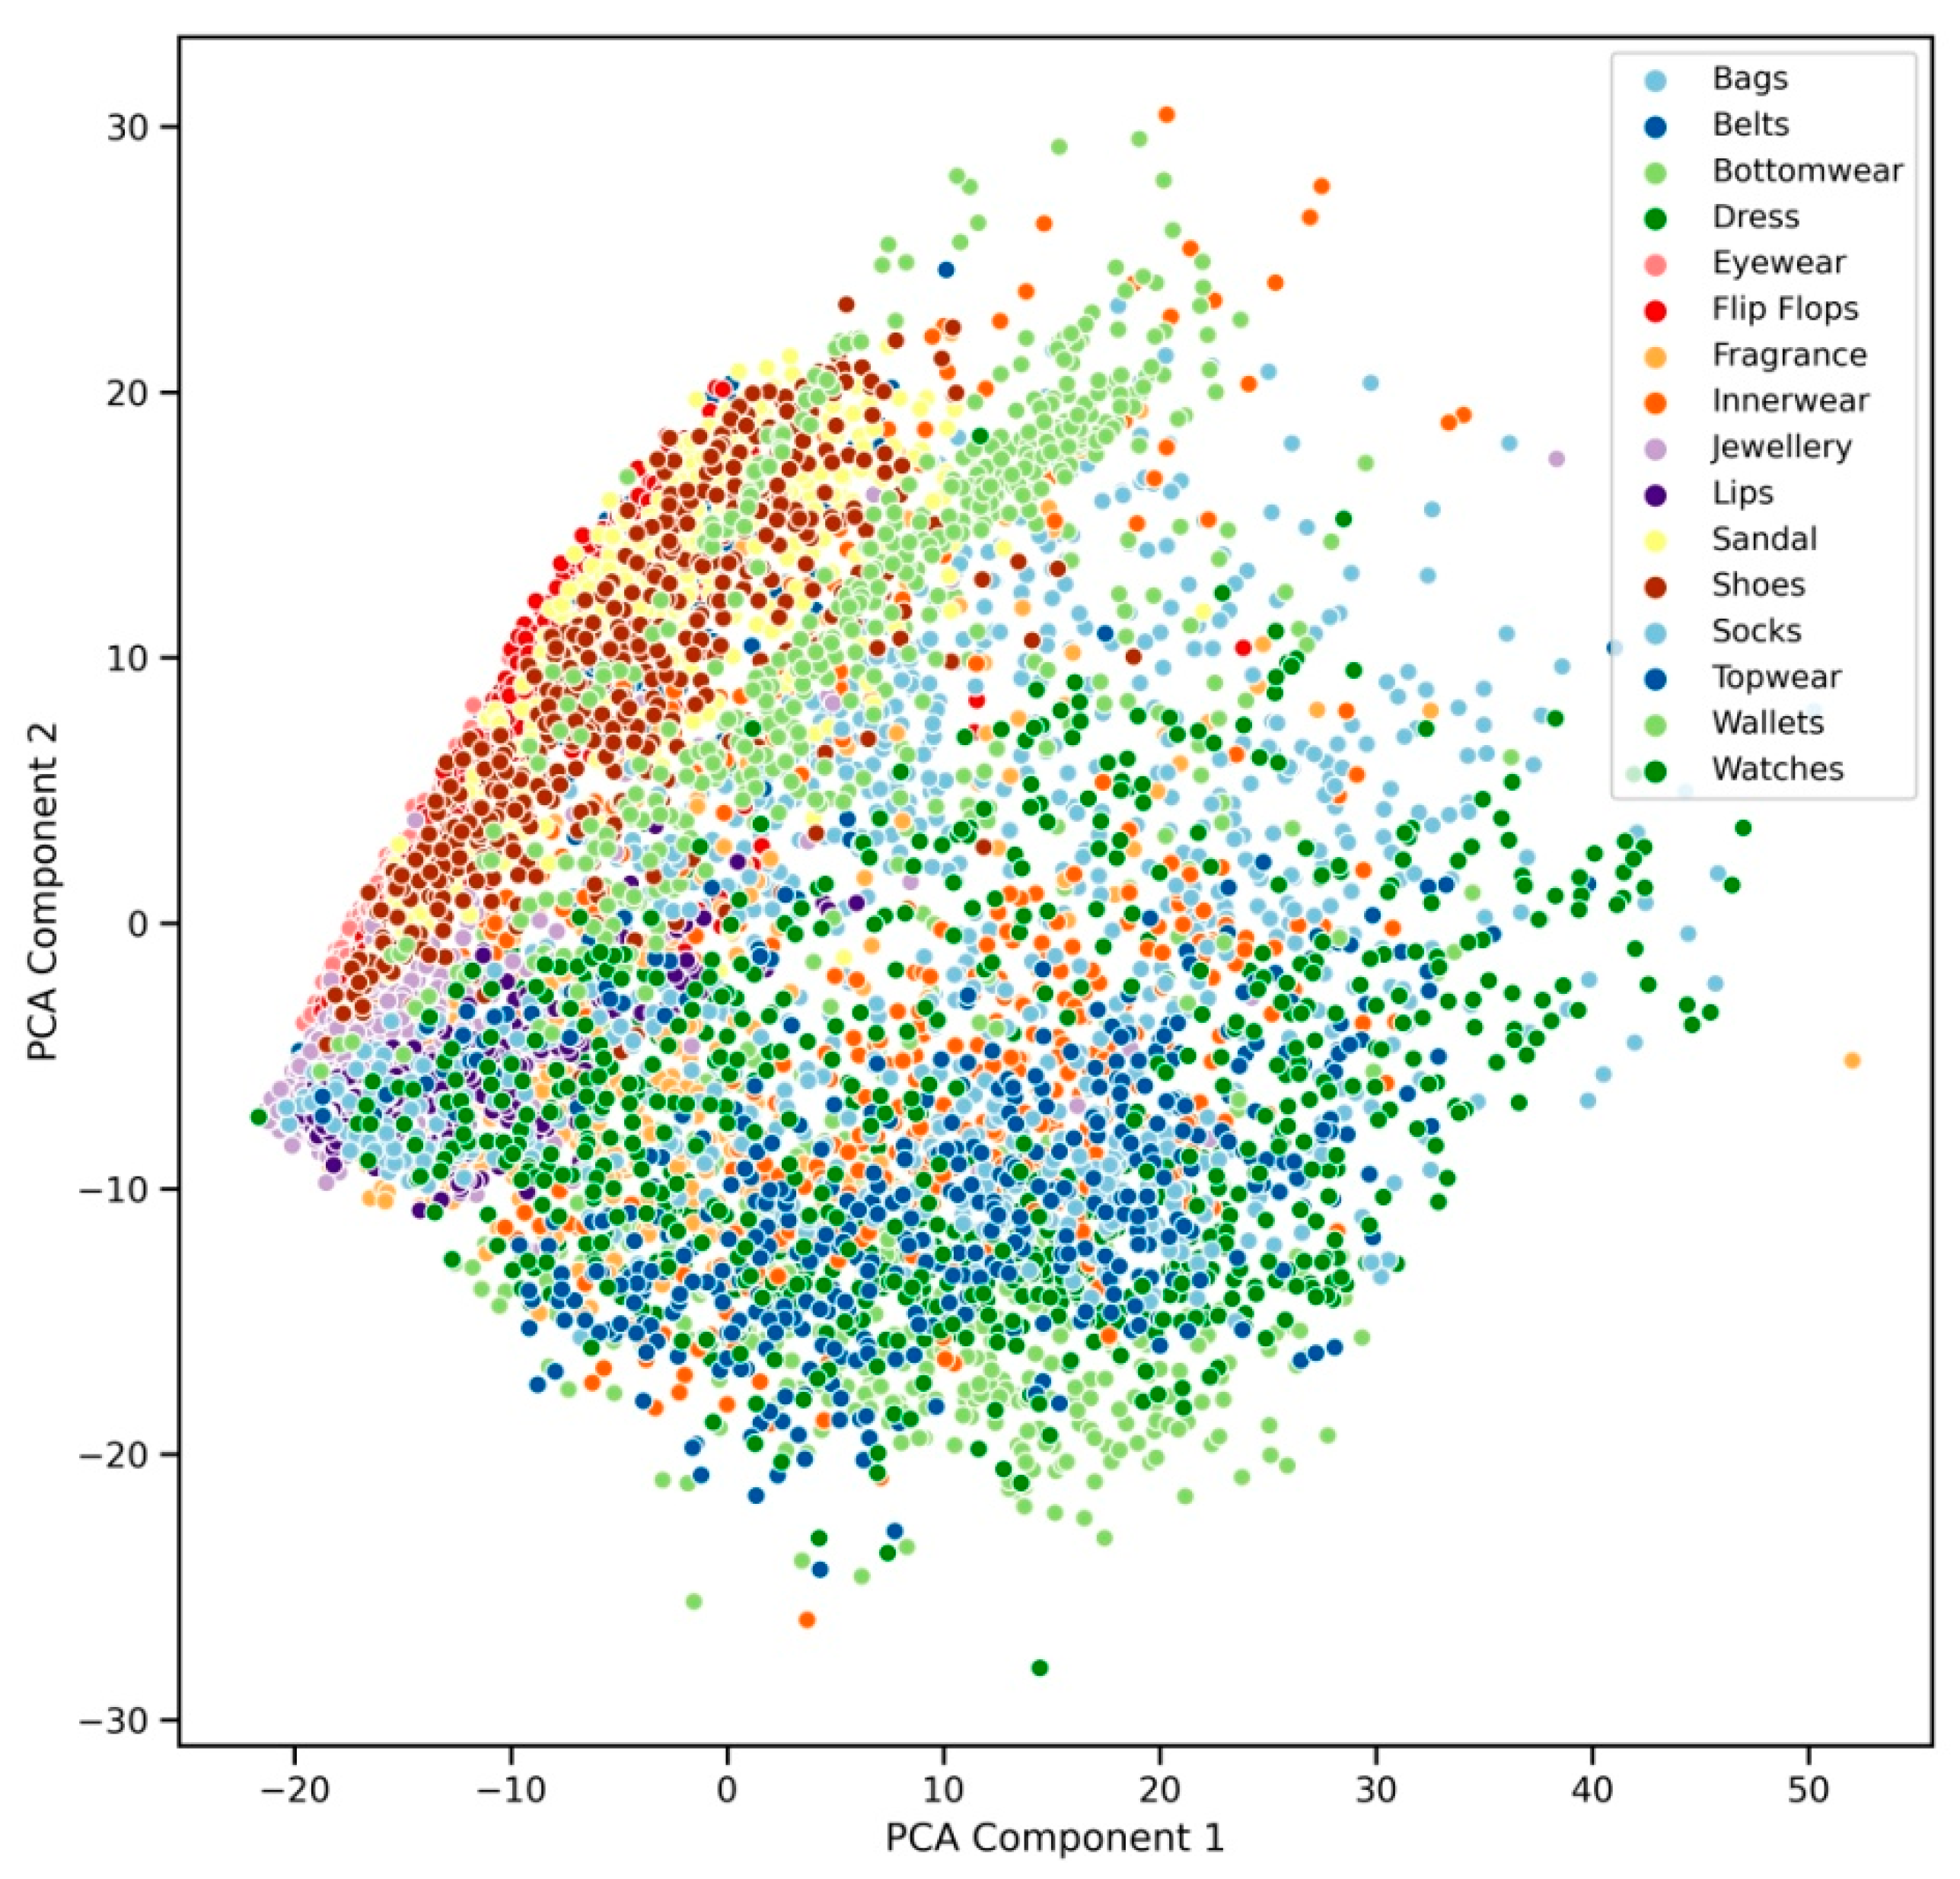
3. Similar Image Recommendation
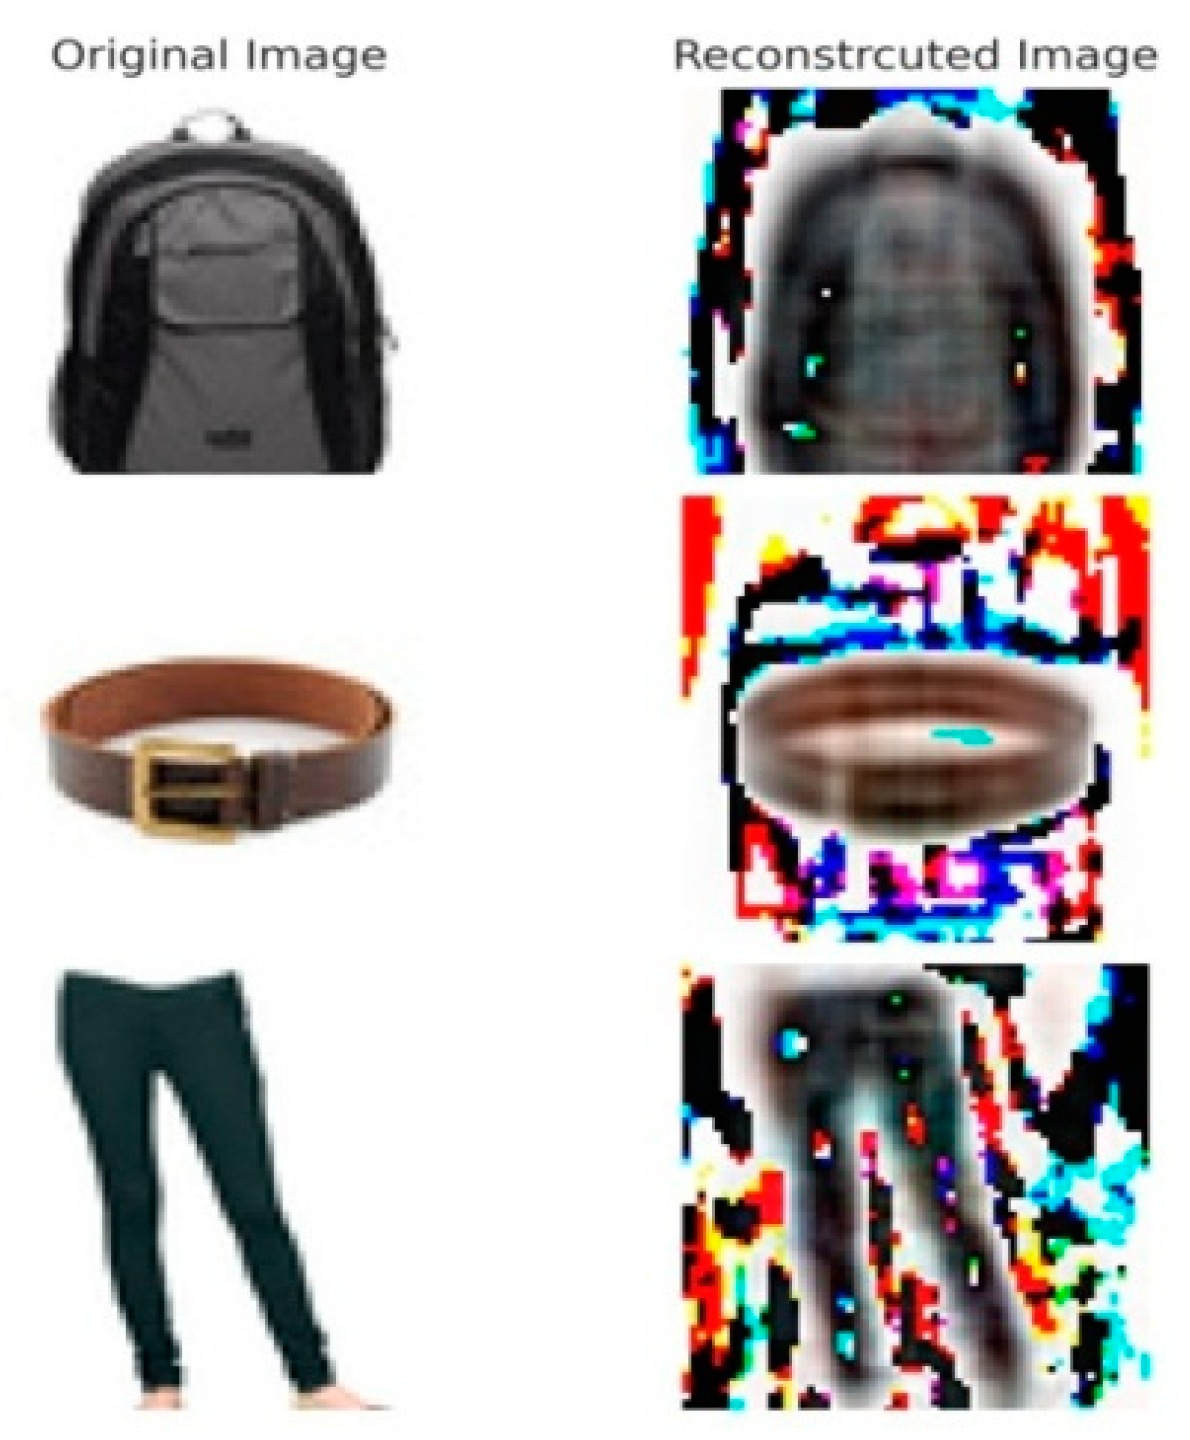
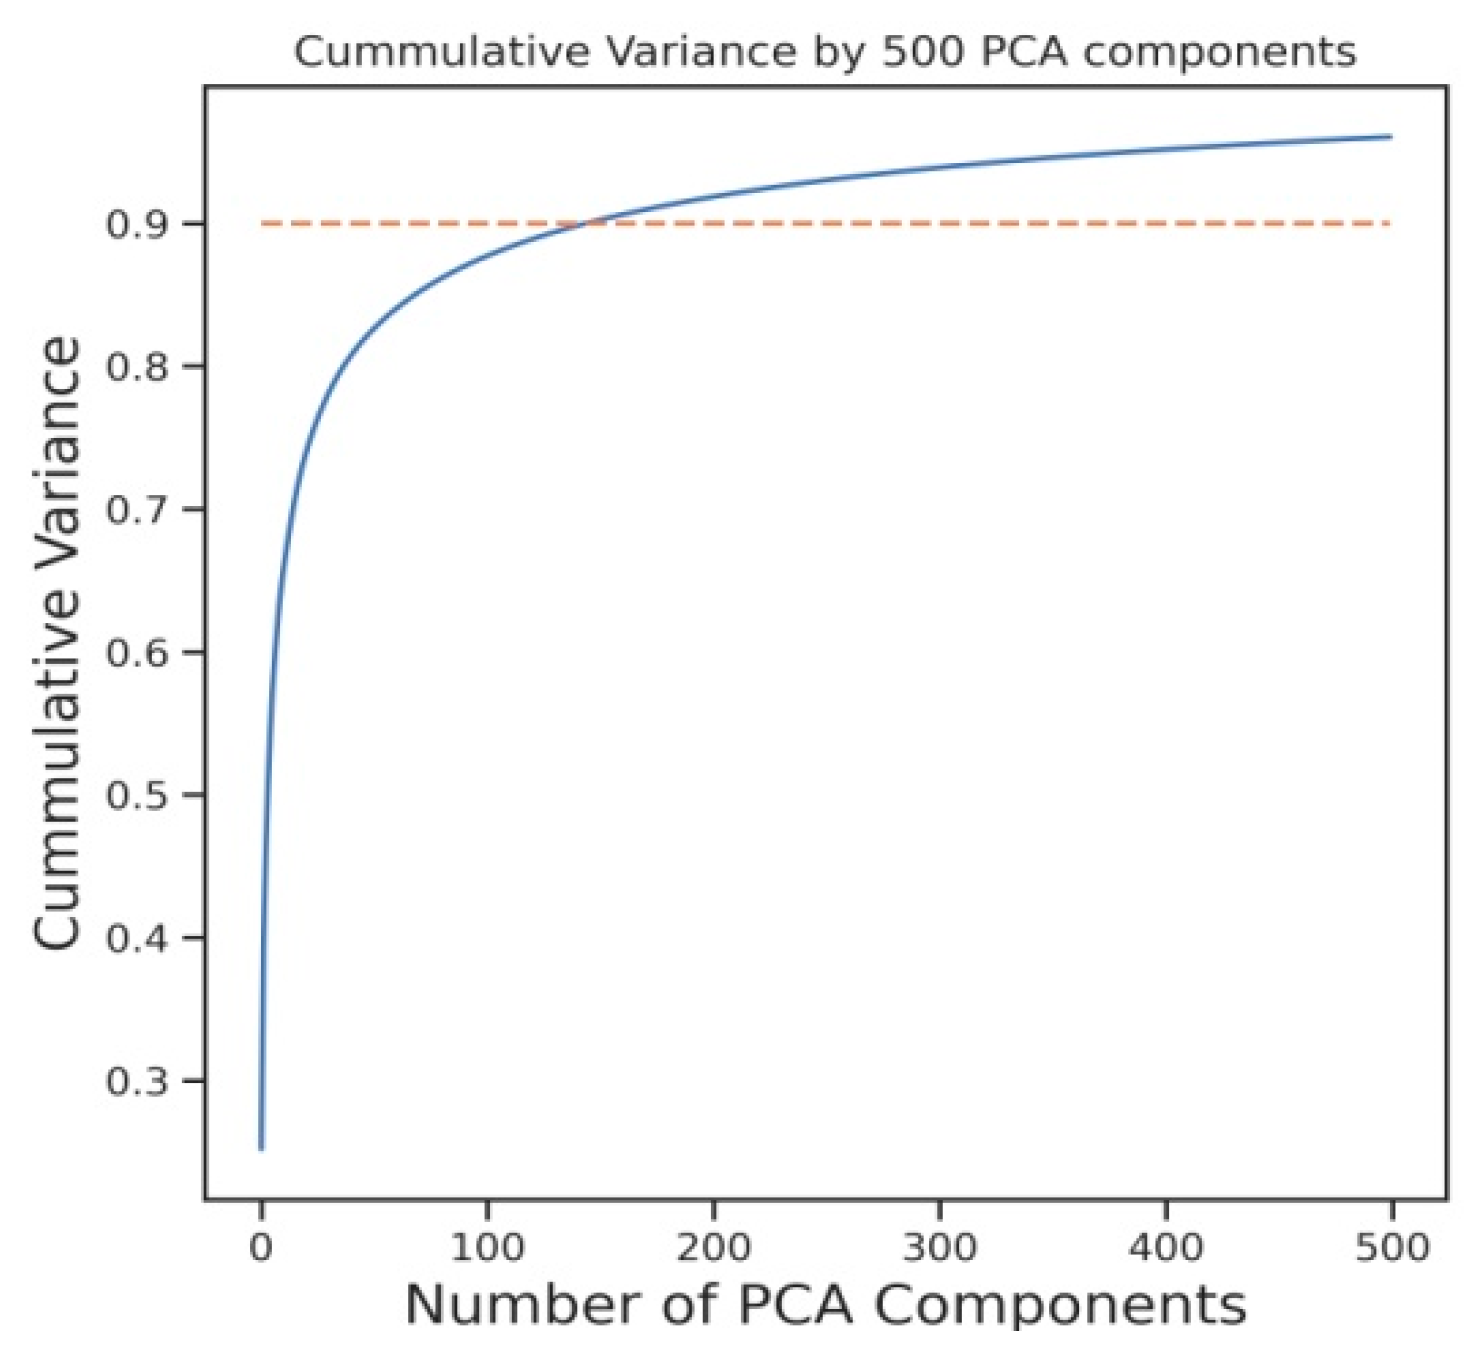
3.1. PCA through Eigen Value Decomposition (PEVD)
3.2. PCA through Singular Value Decomposition (PSVD)
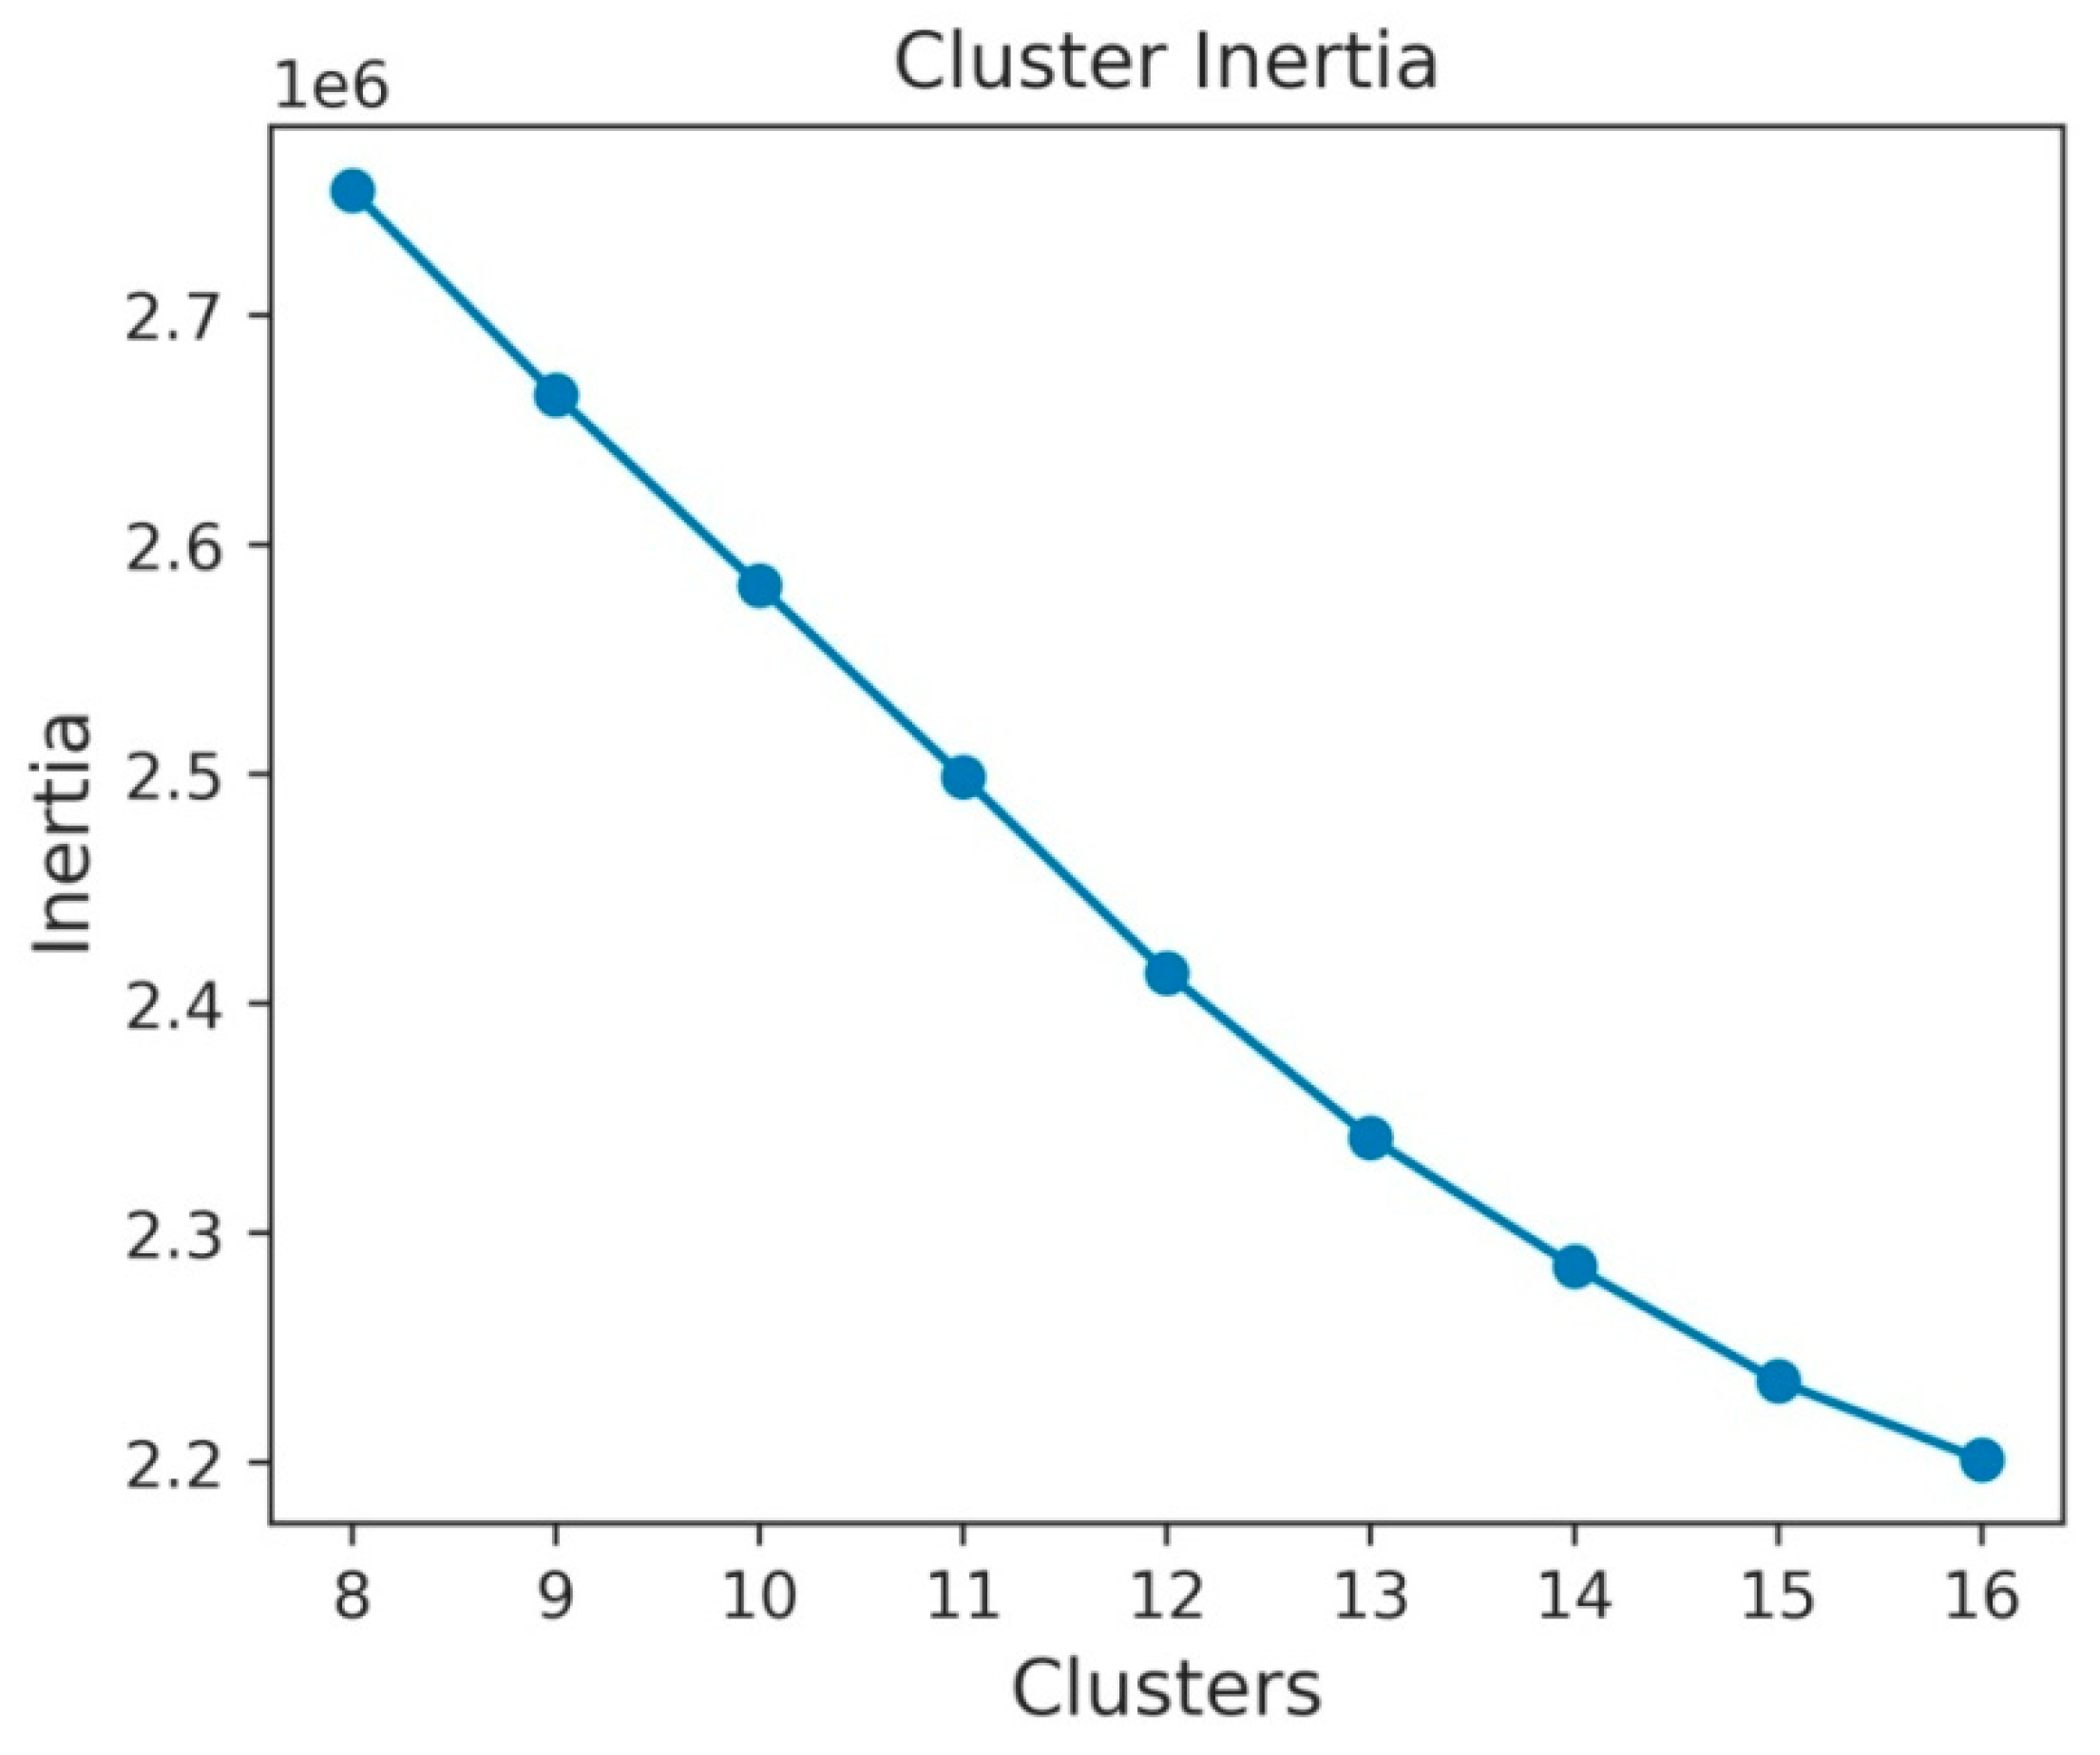
3.3. K-Mean(++) Clustering Approach
3.4. Similar Distance Measure
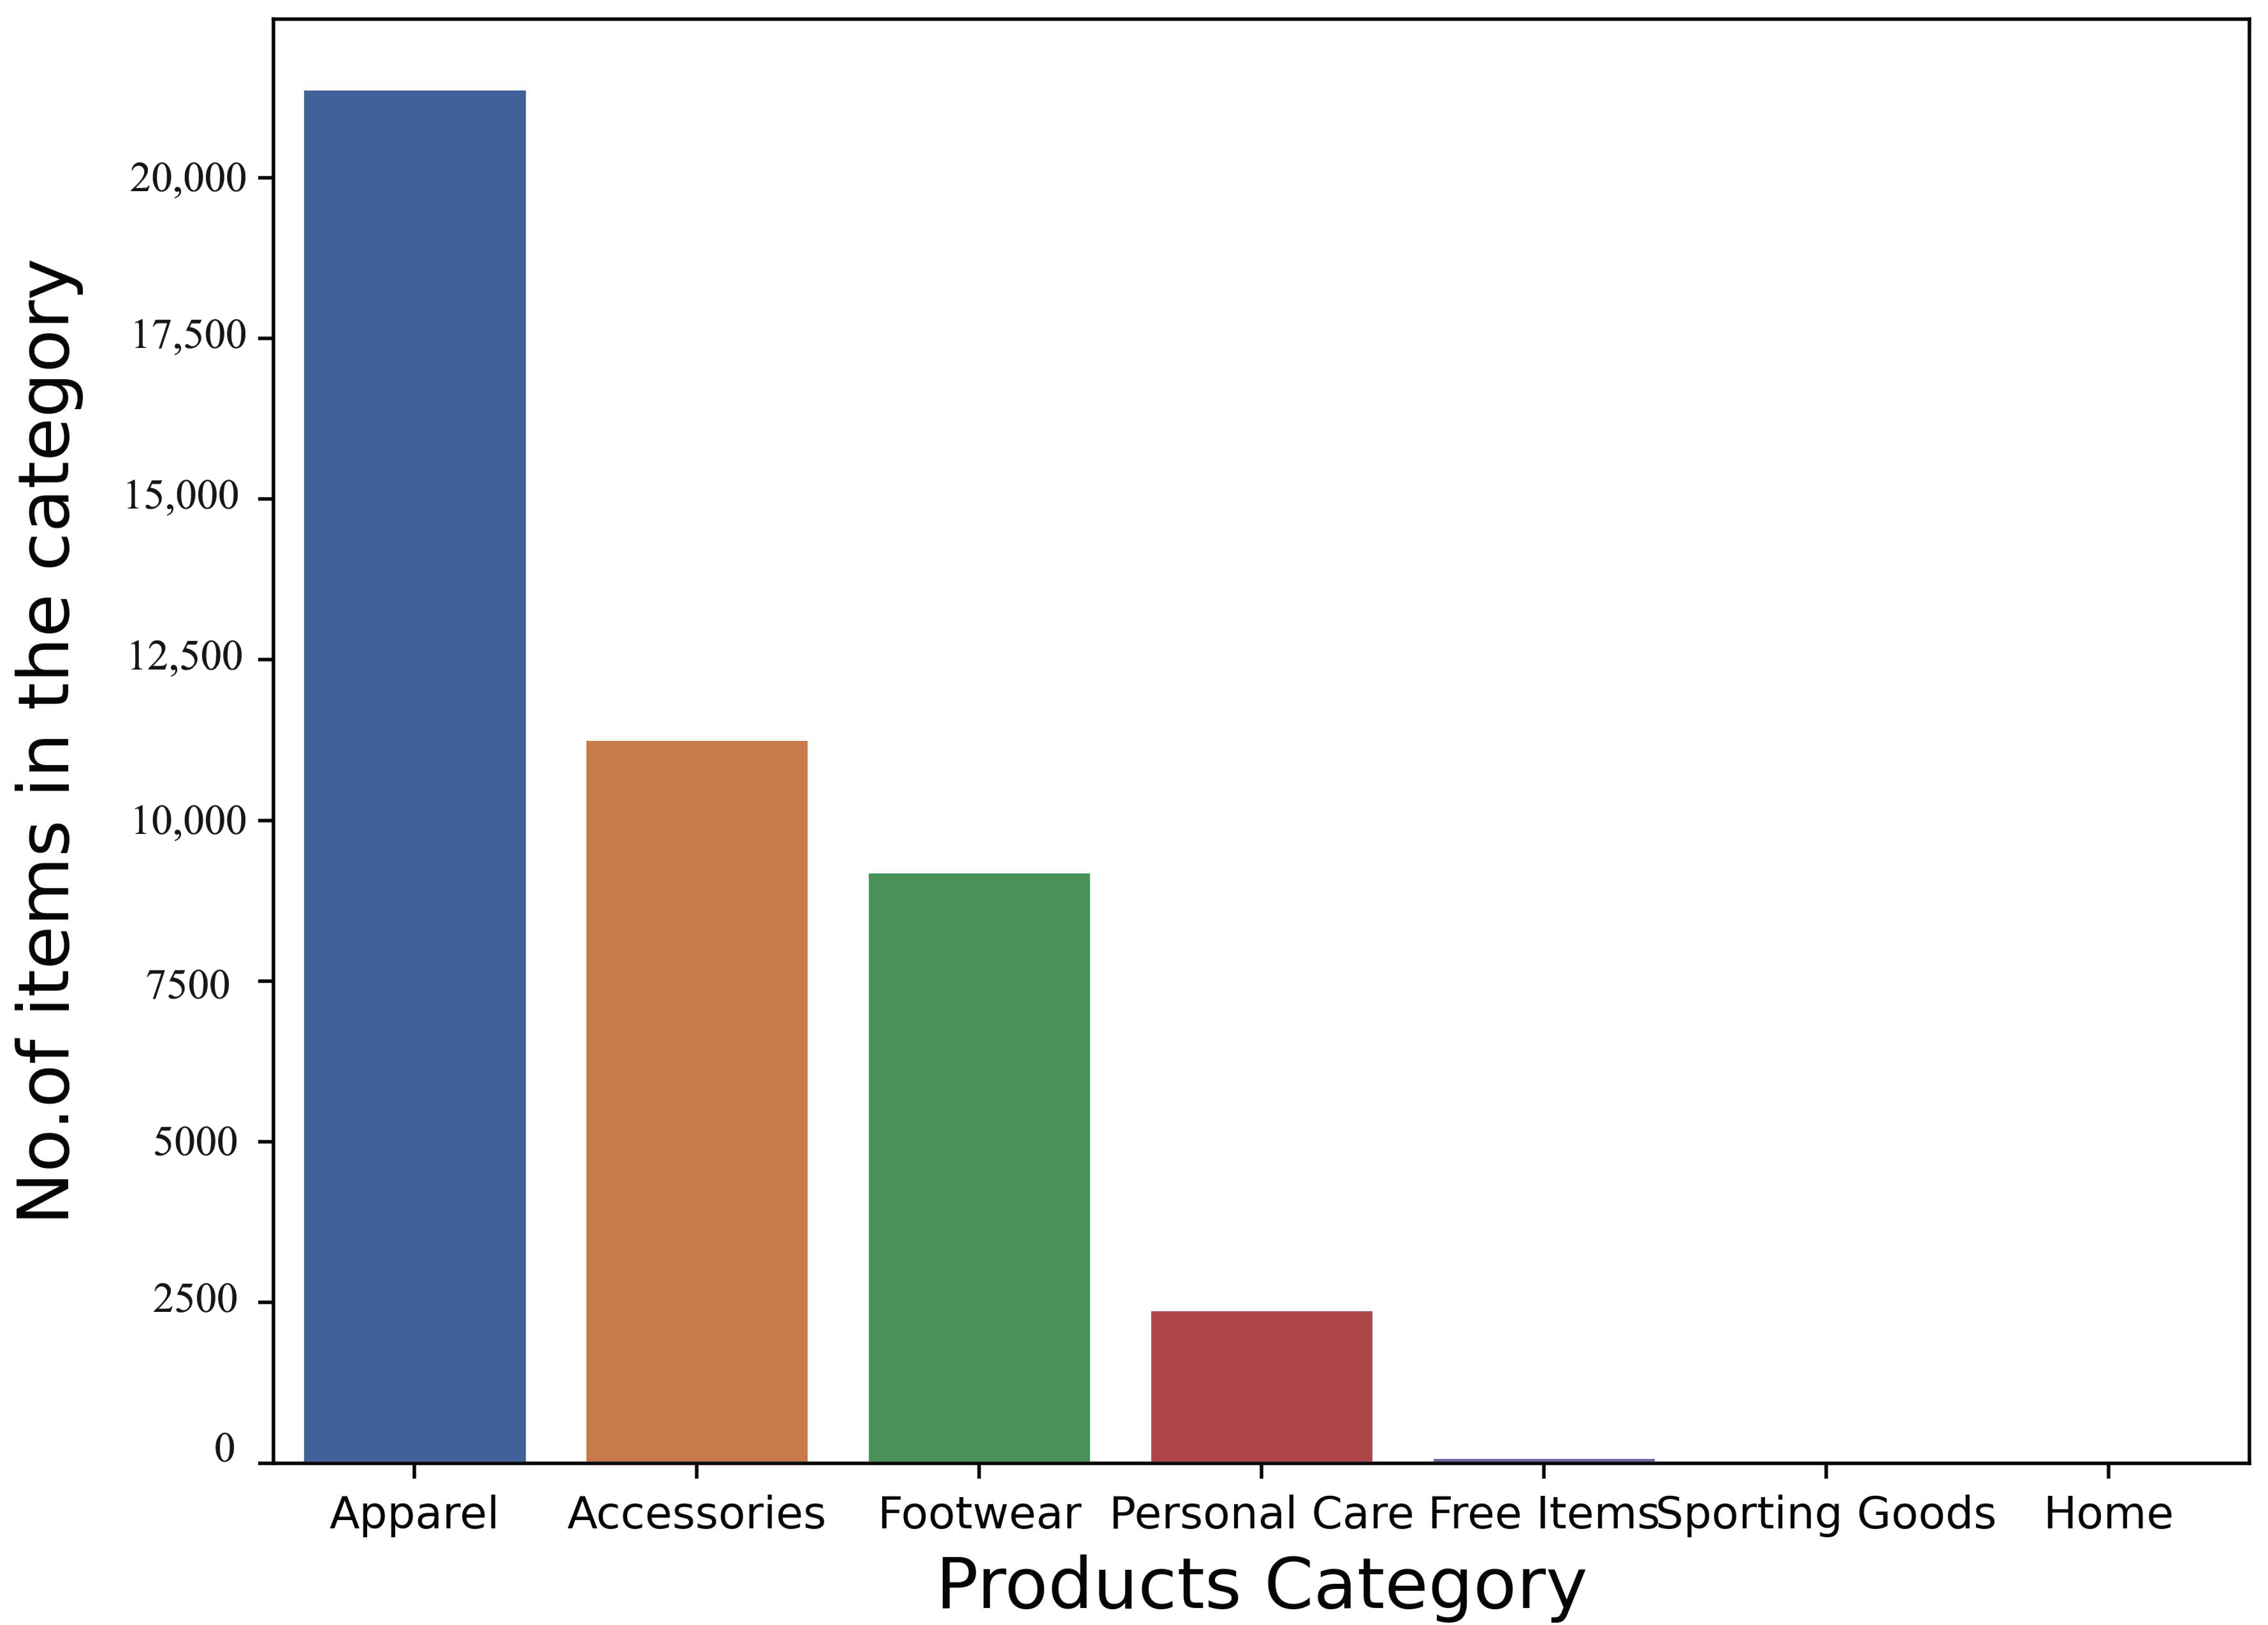
4. Dataset and Experimentation
Experimentation
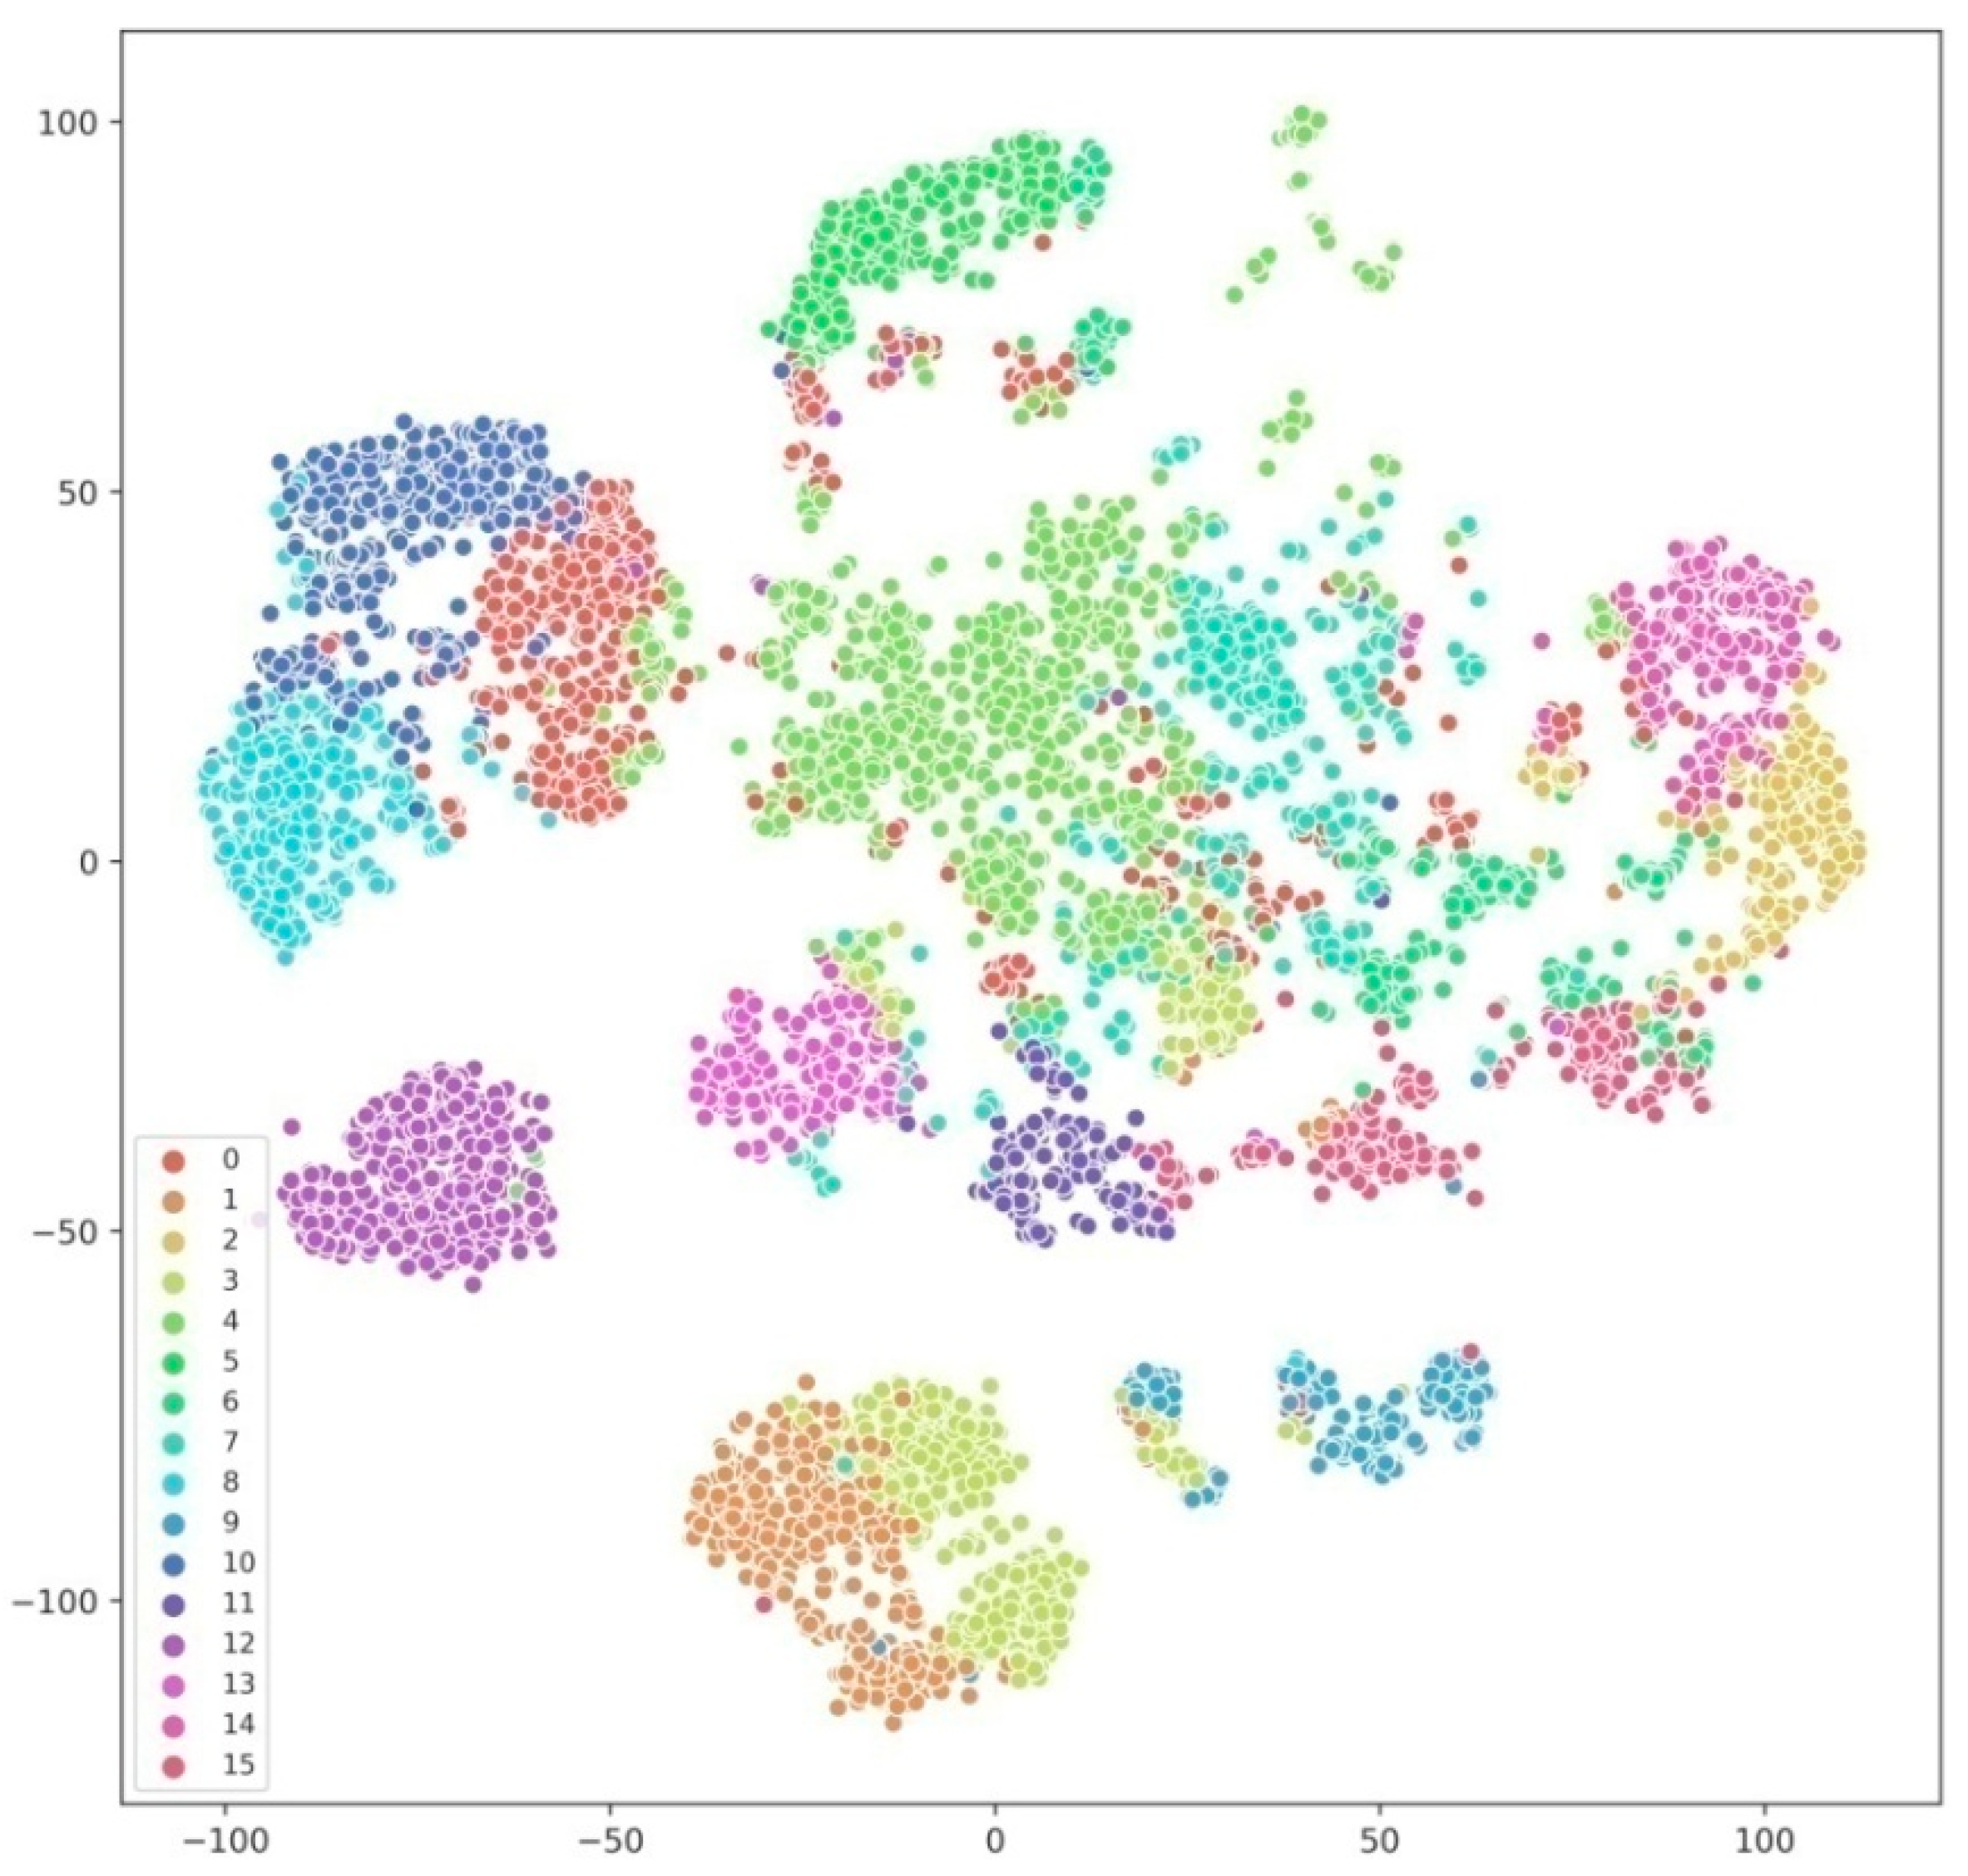
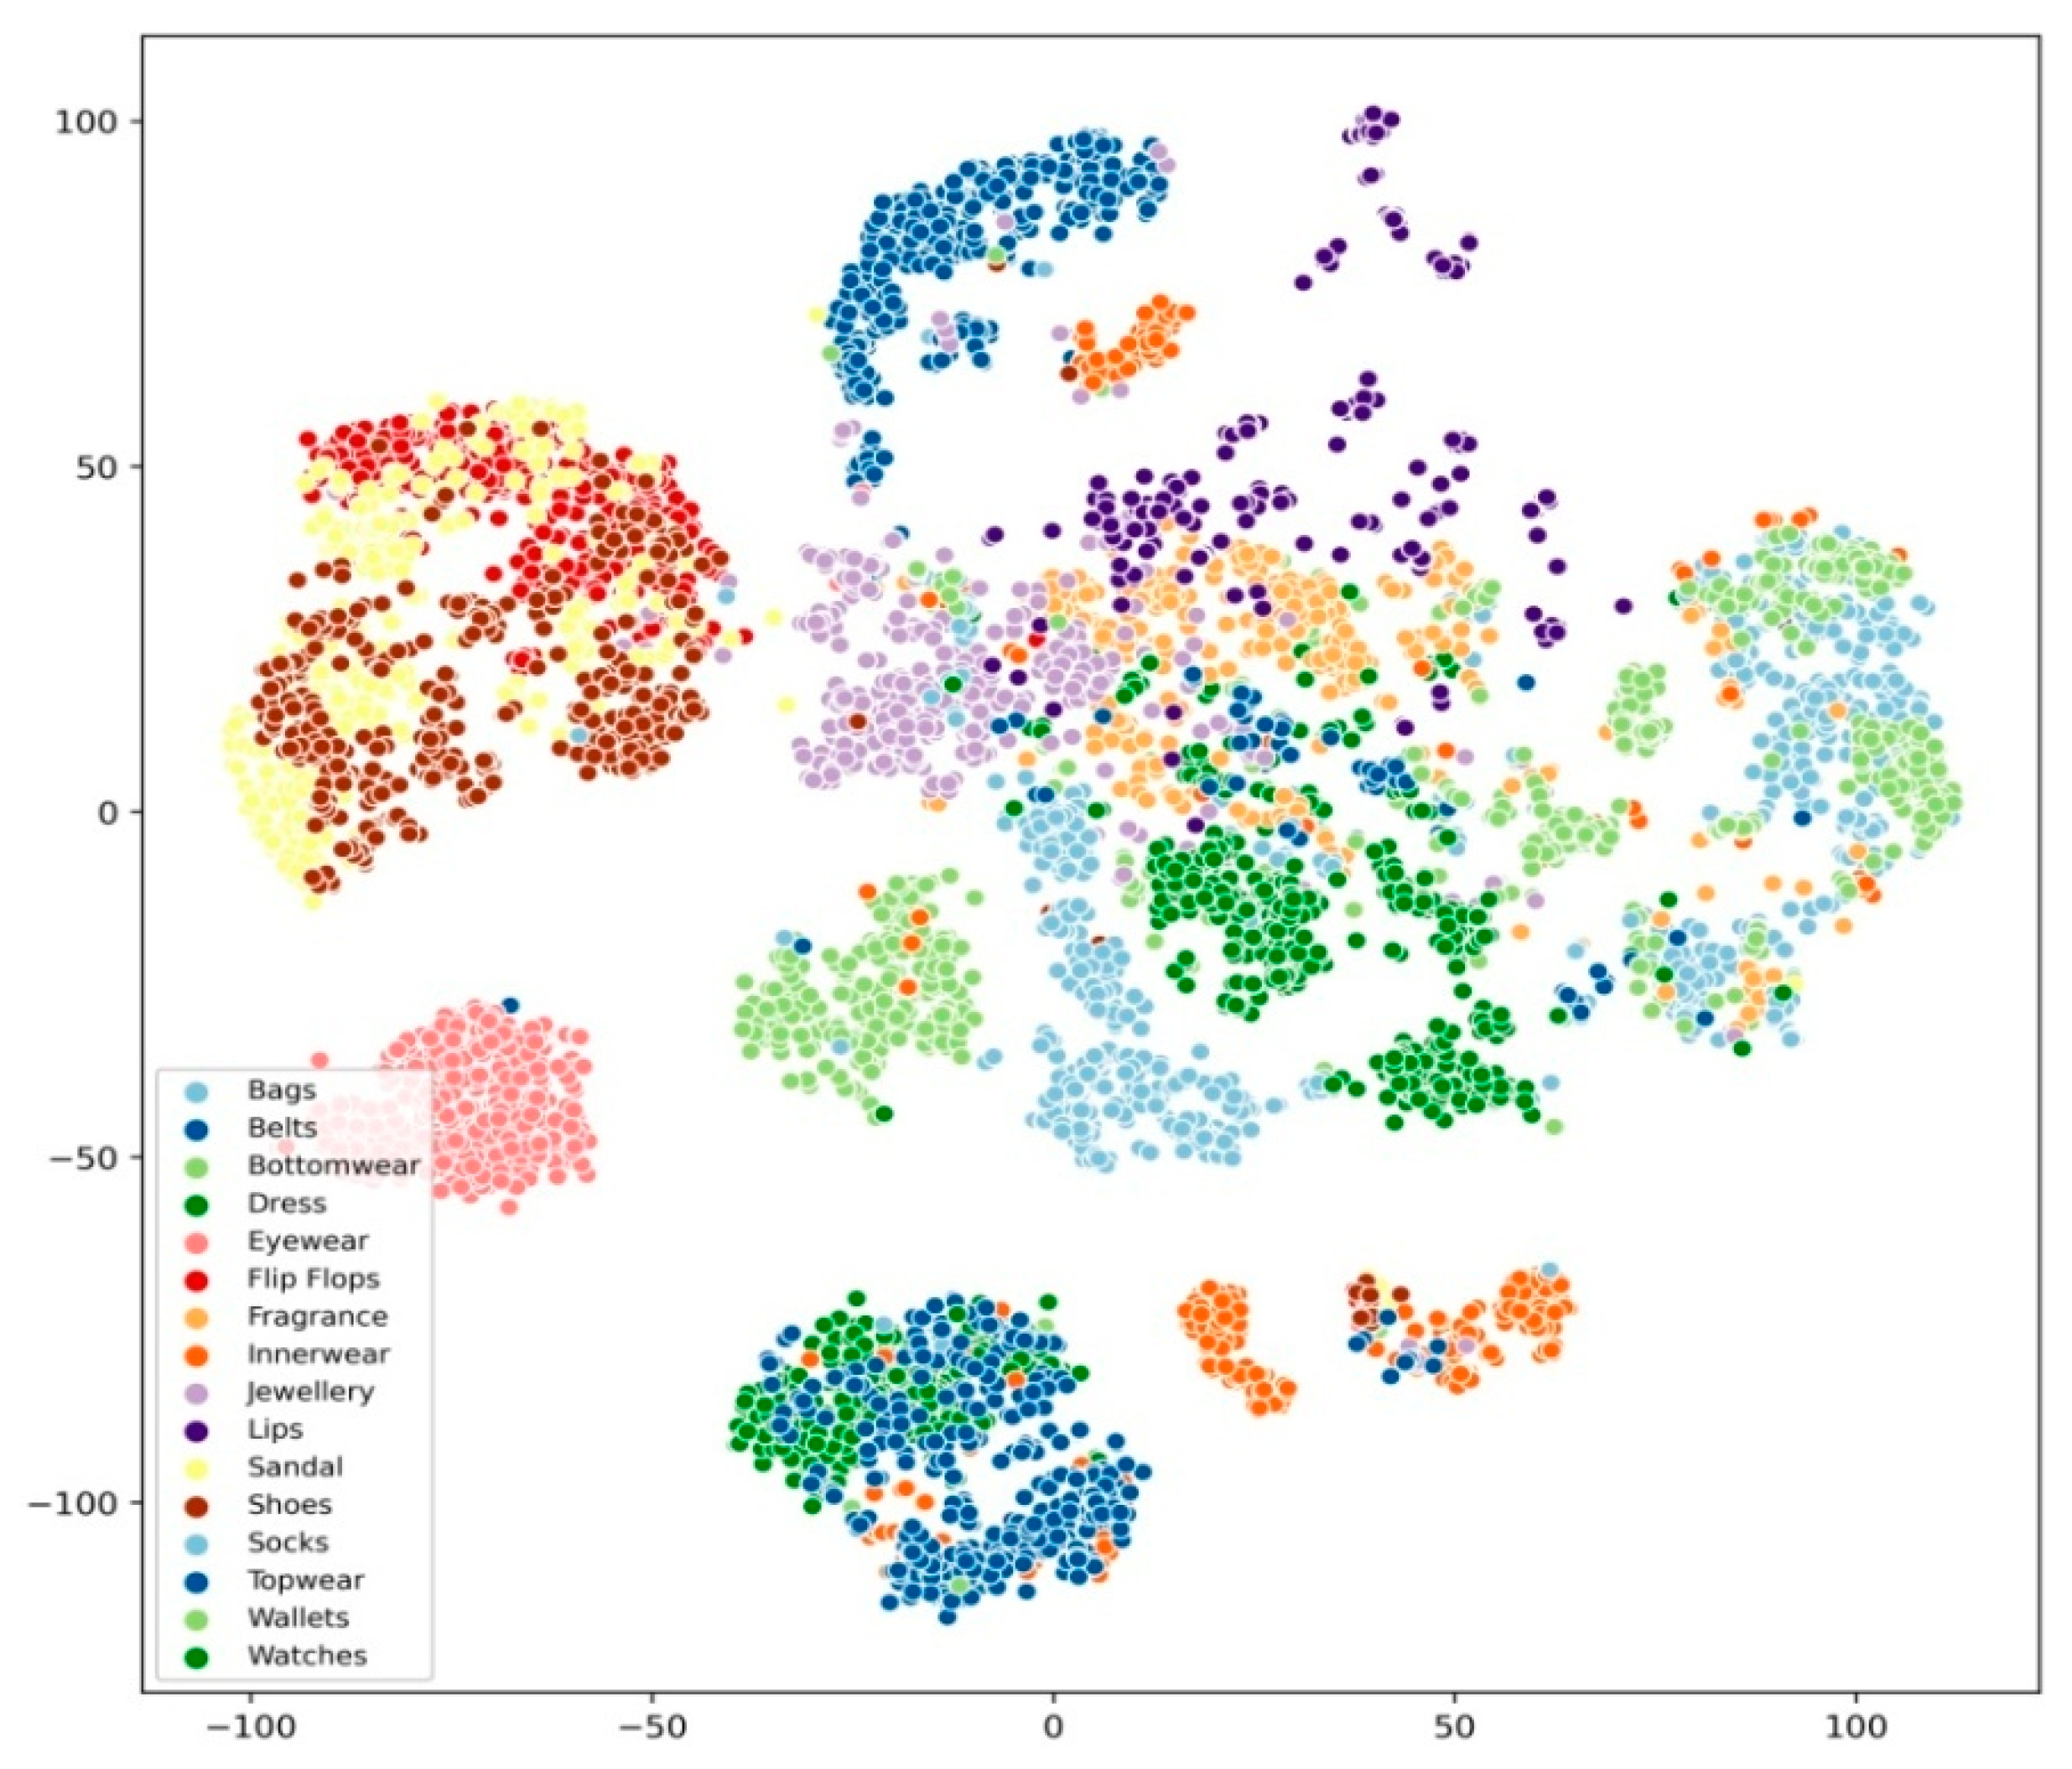
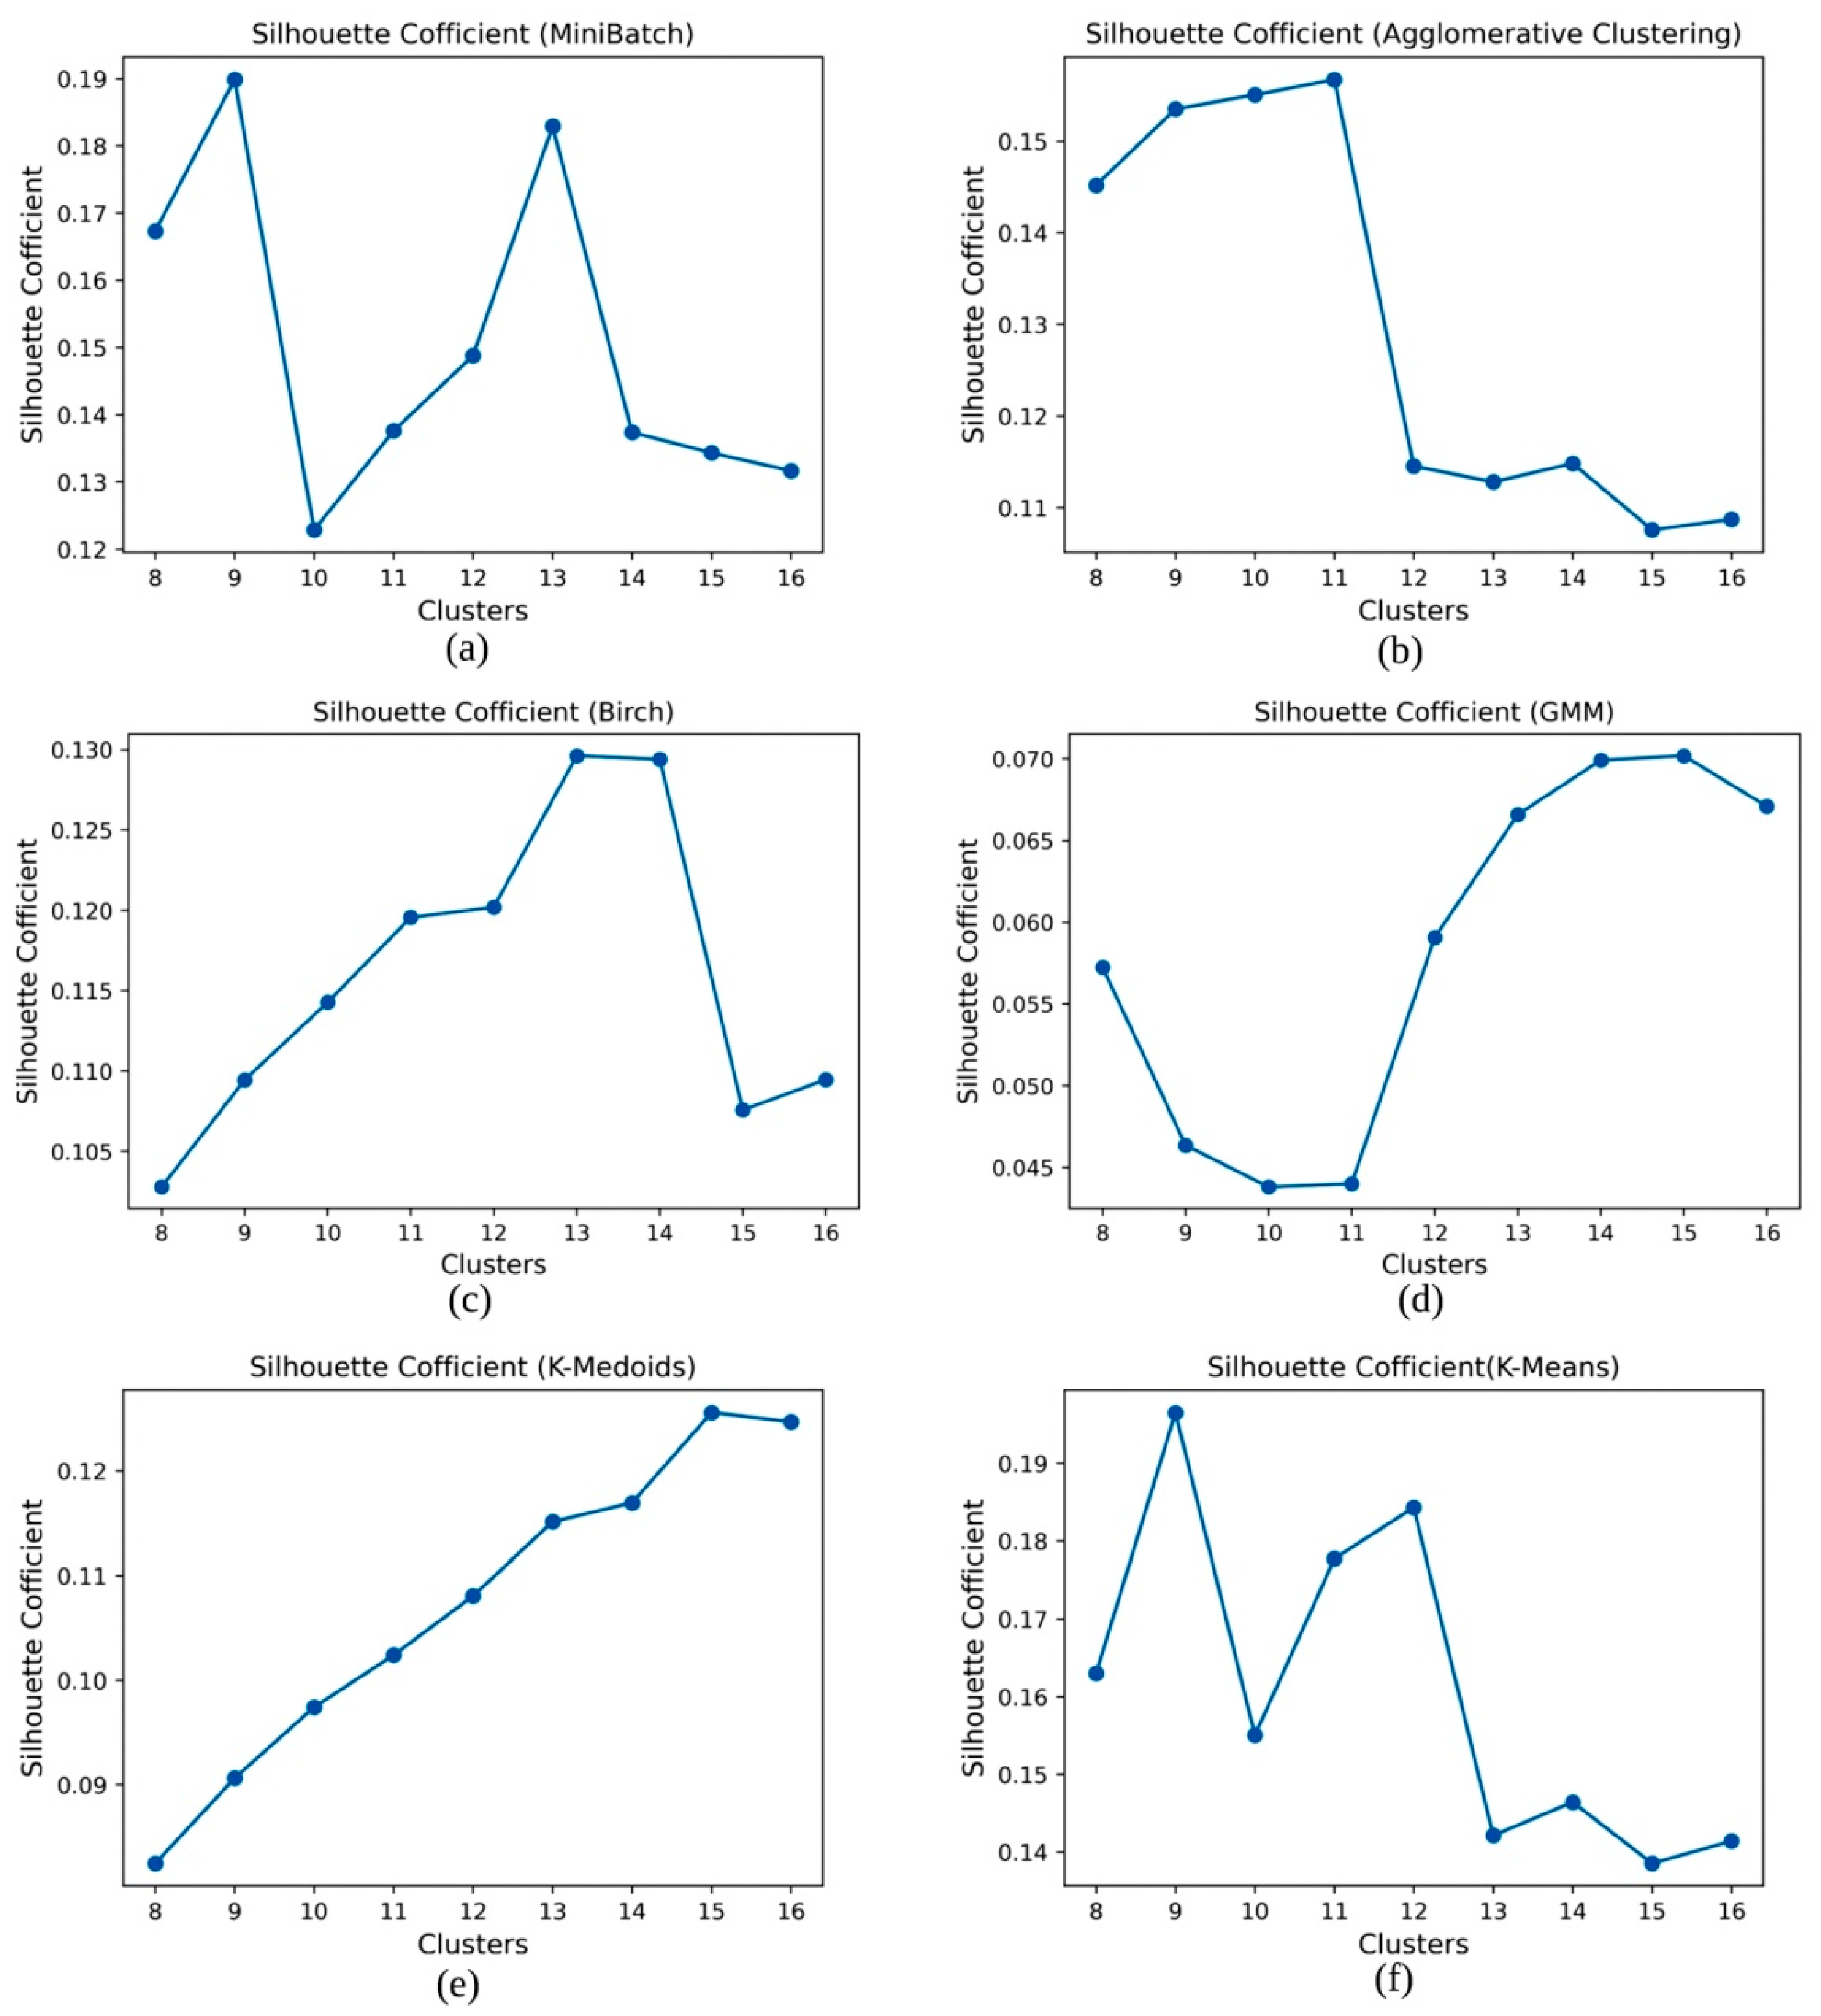
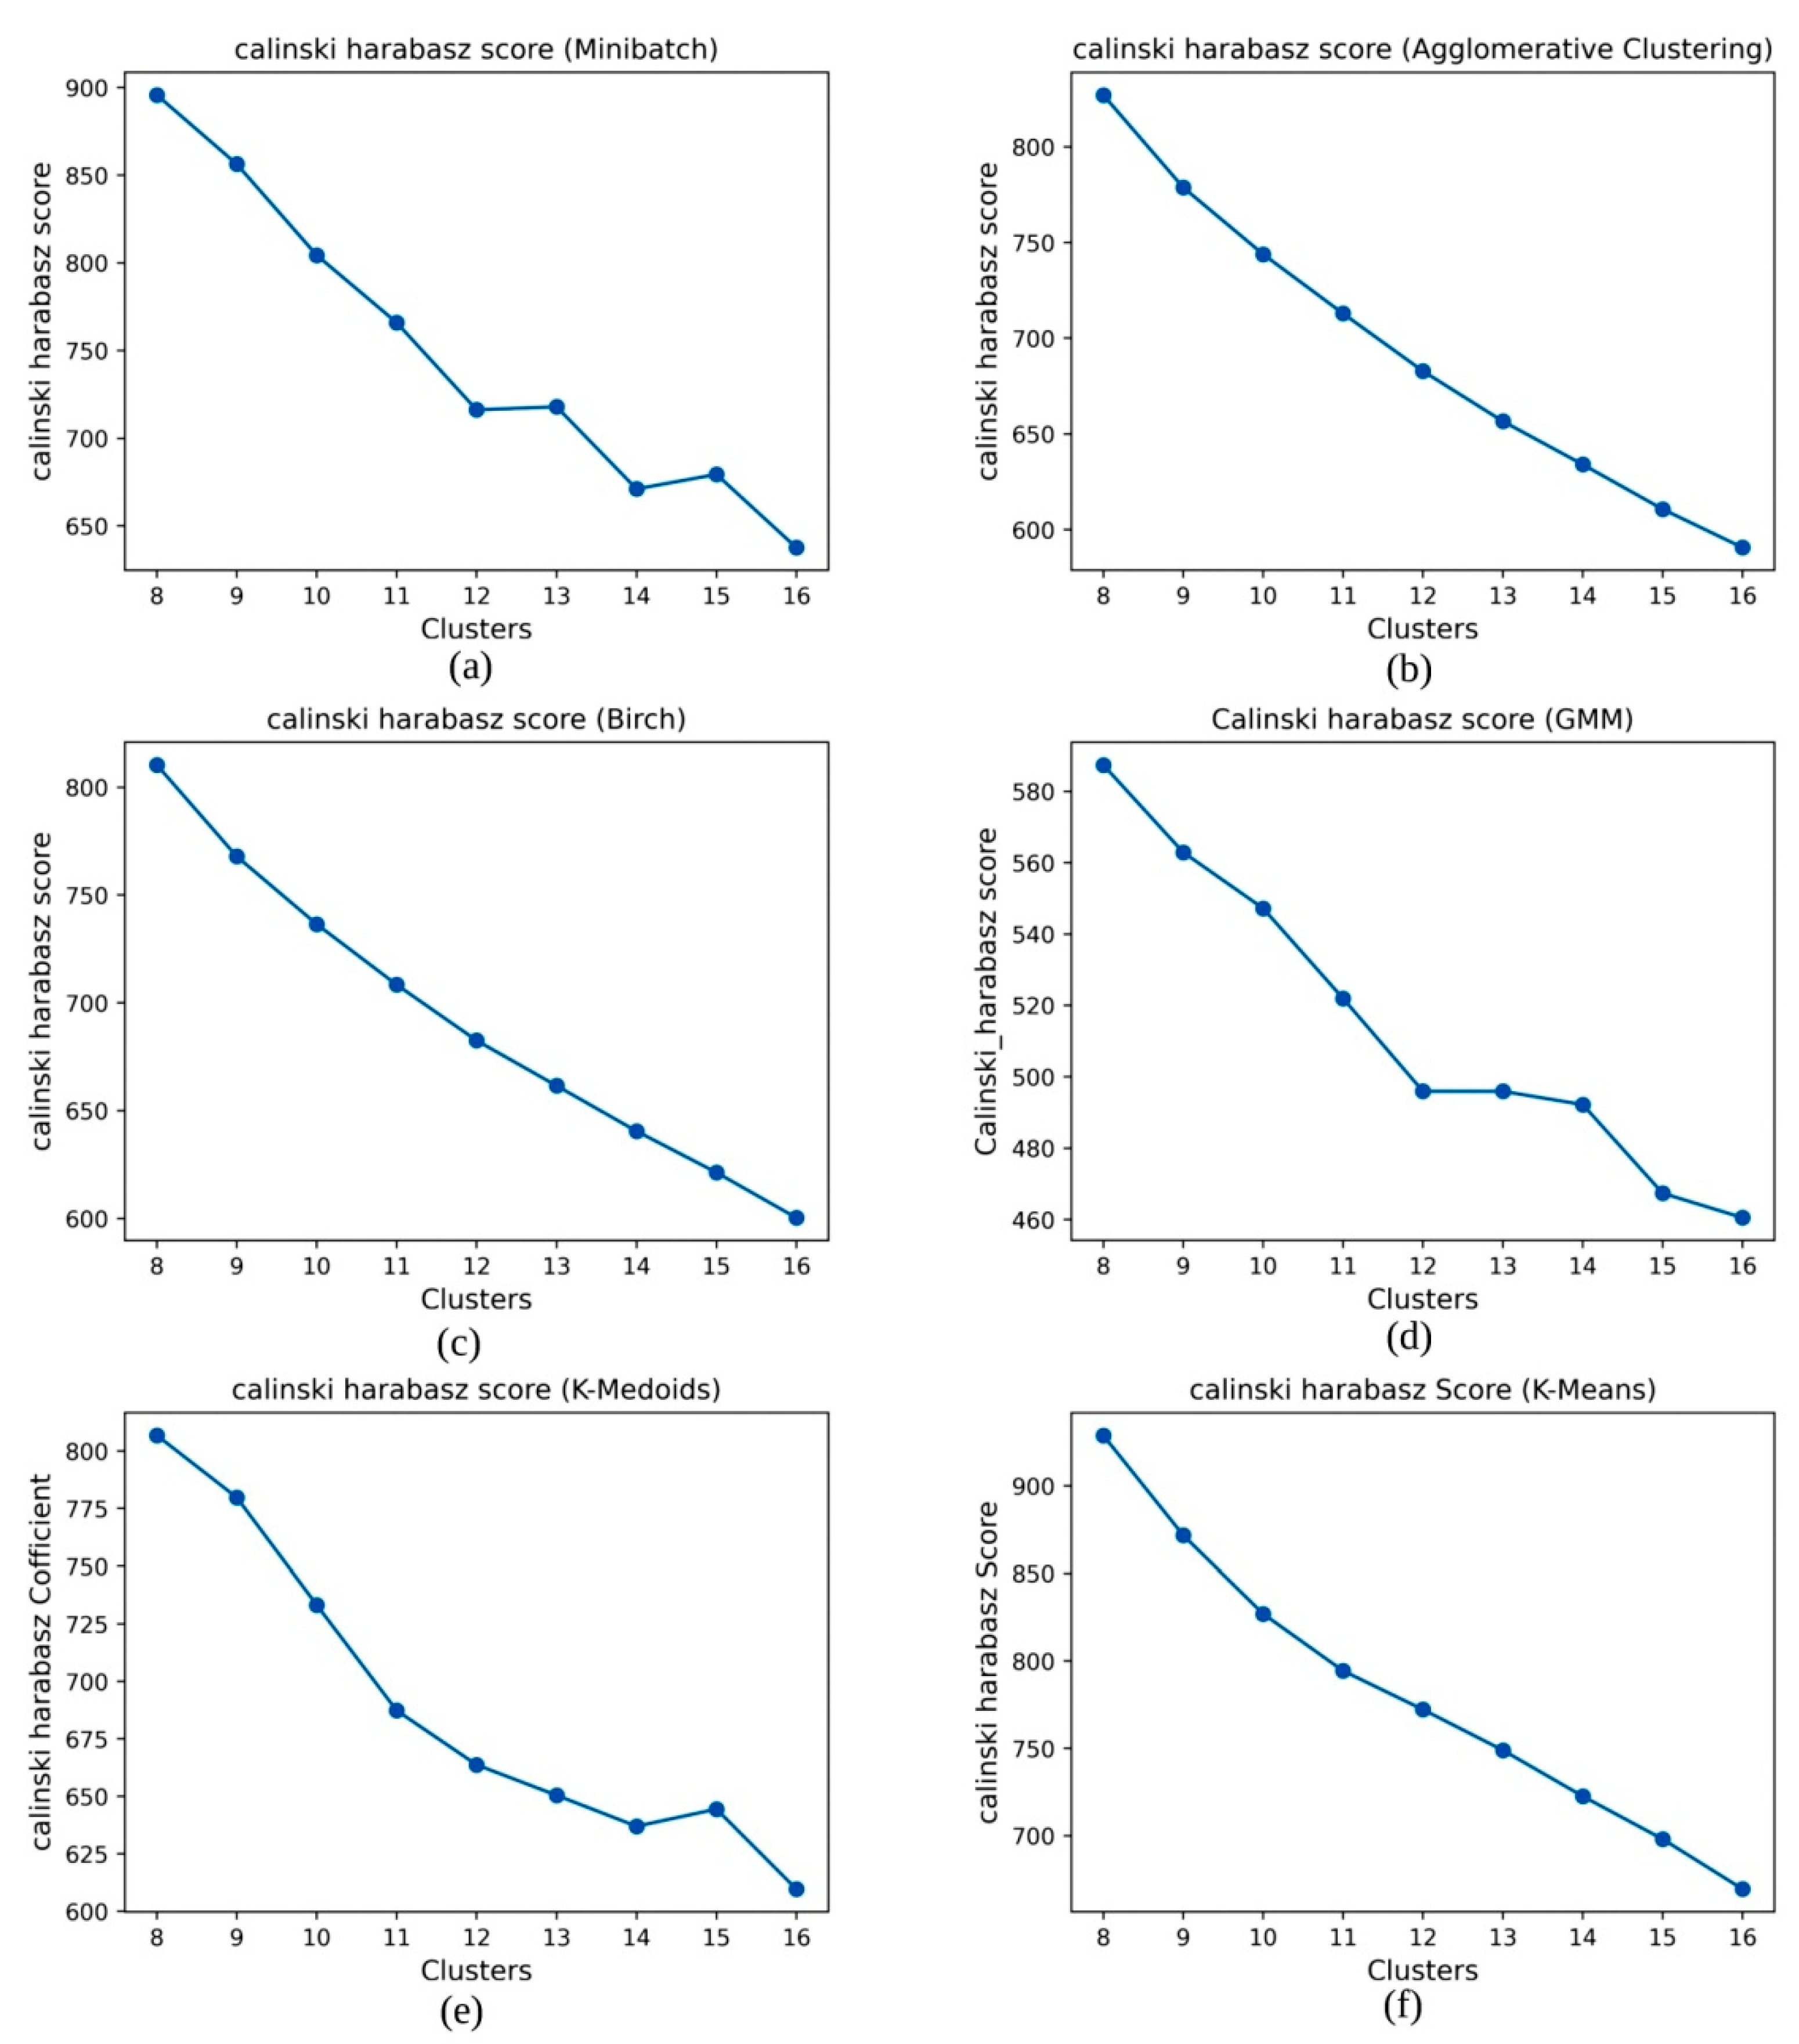
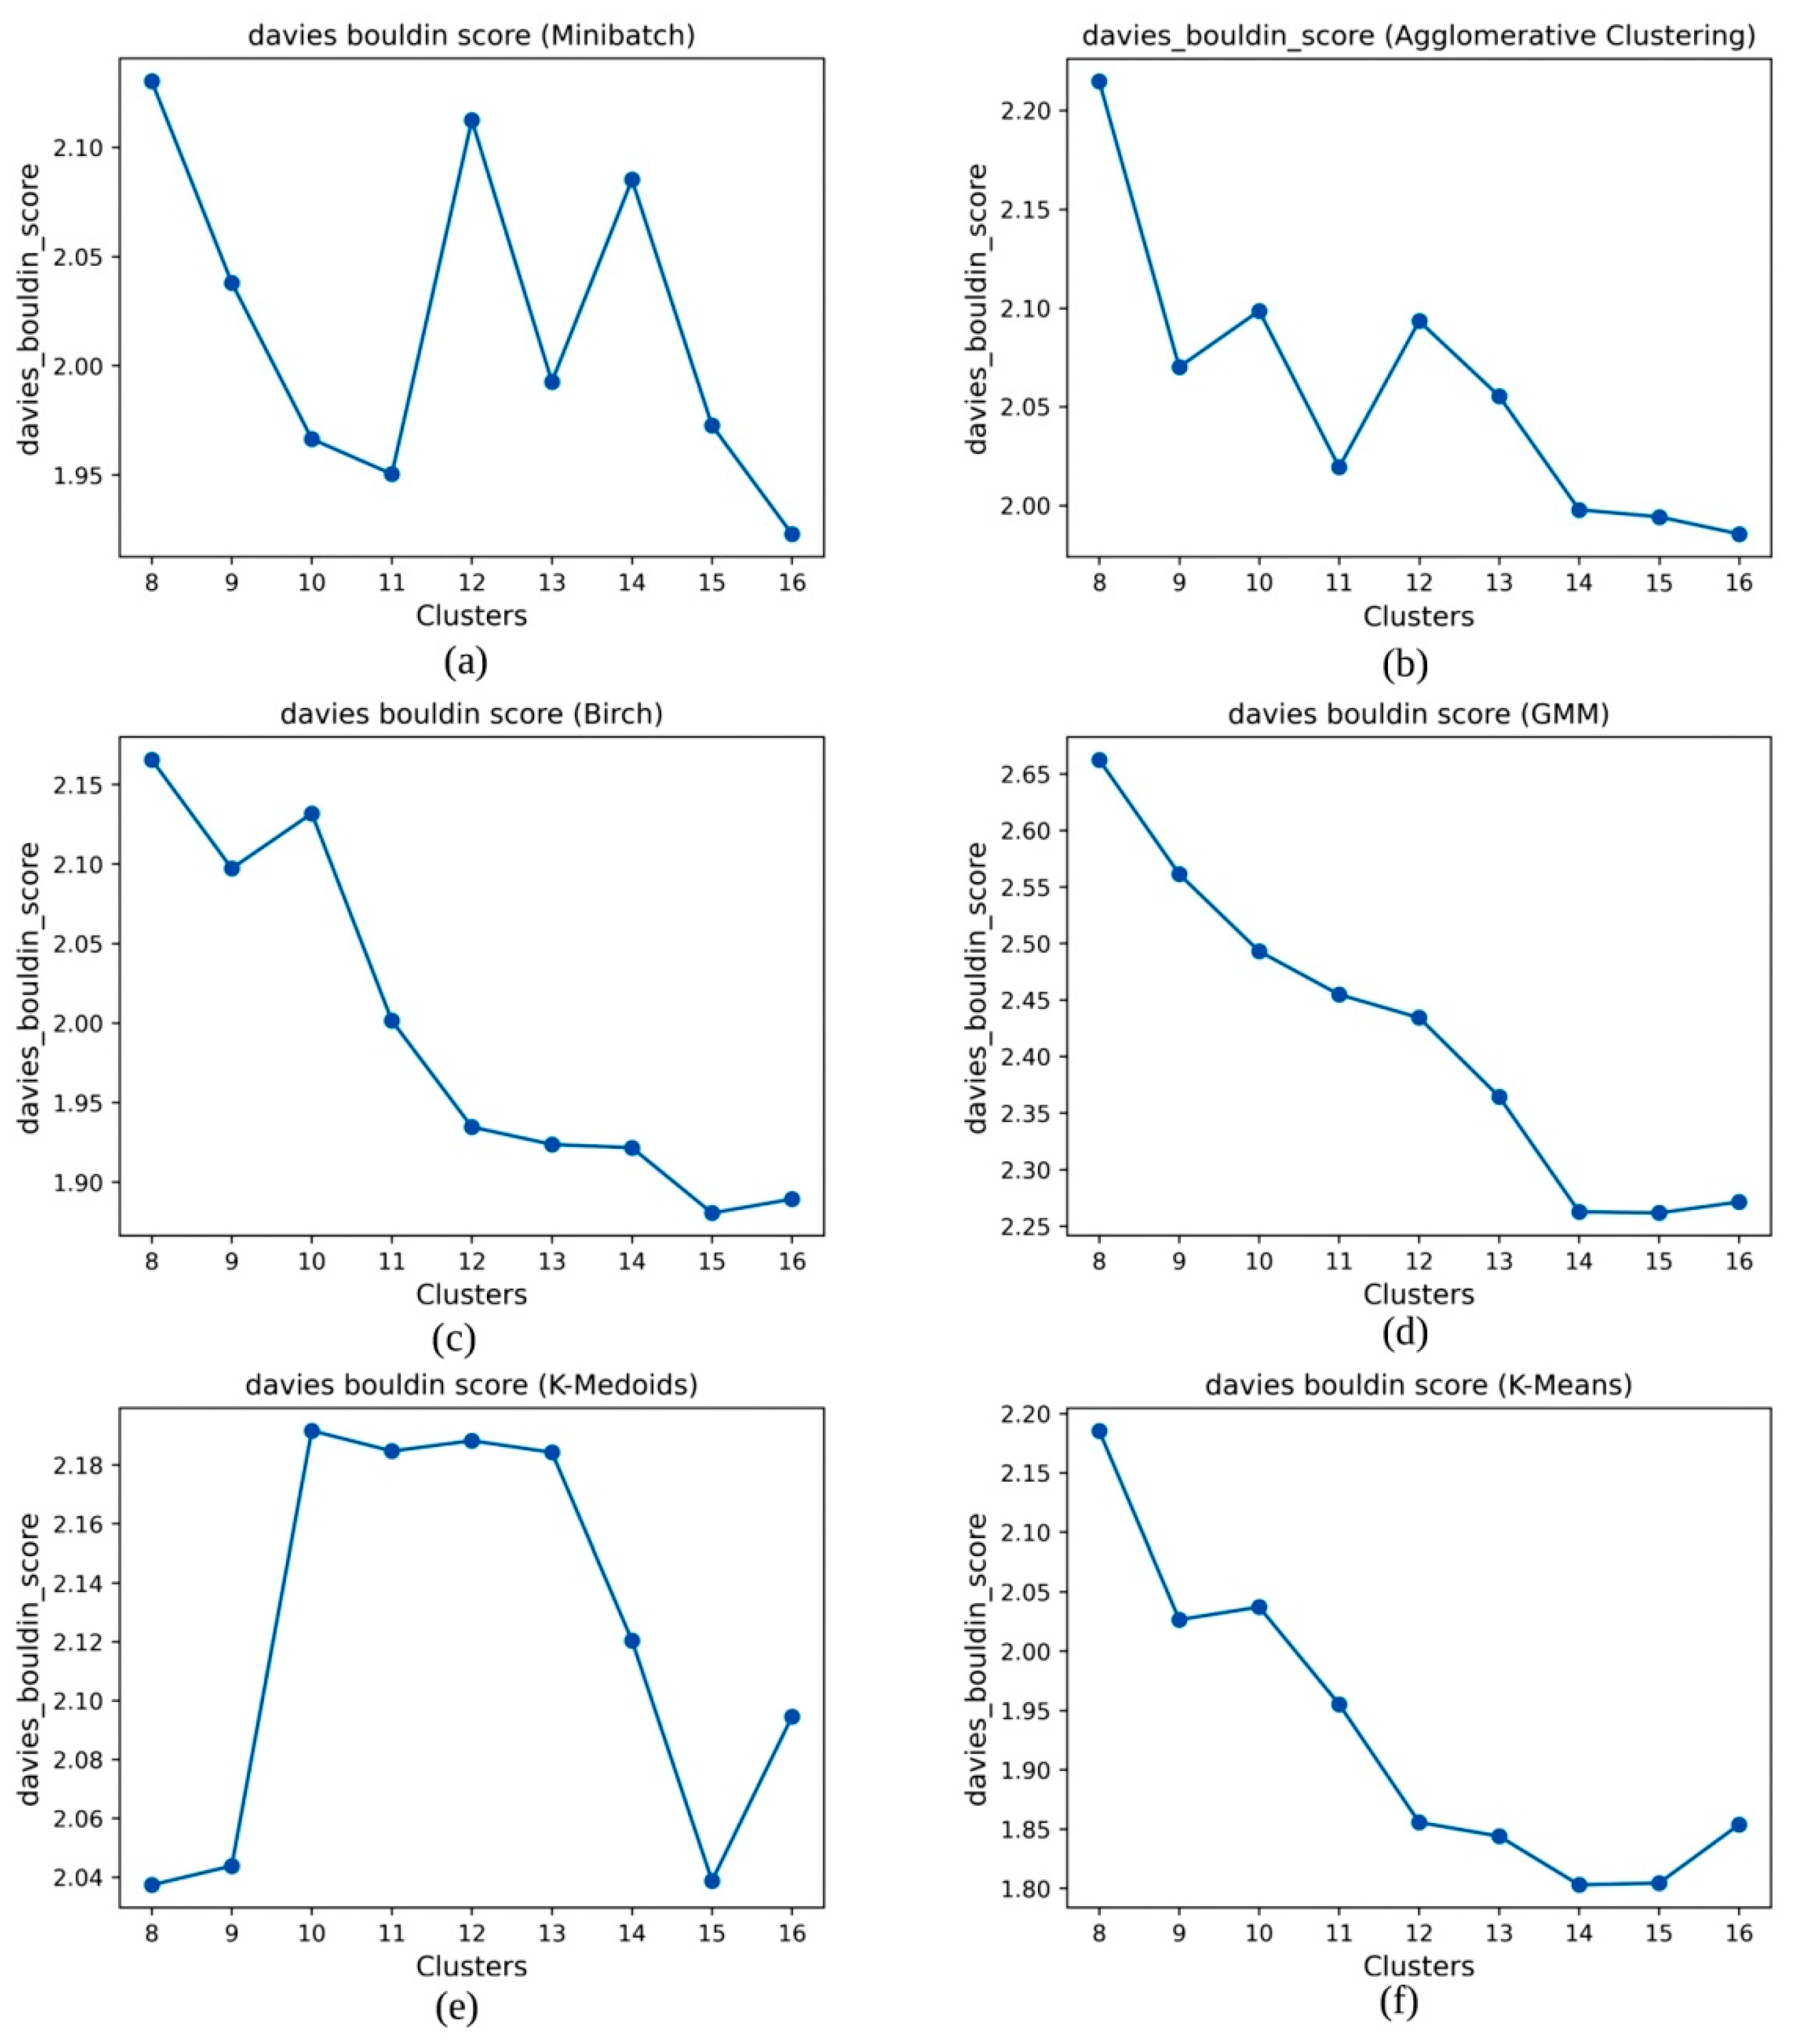
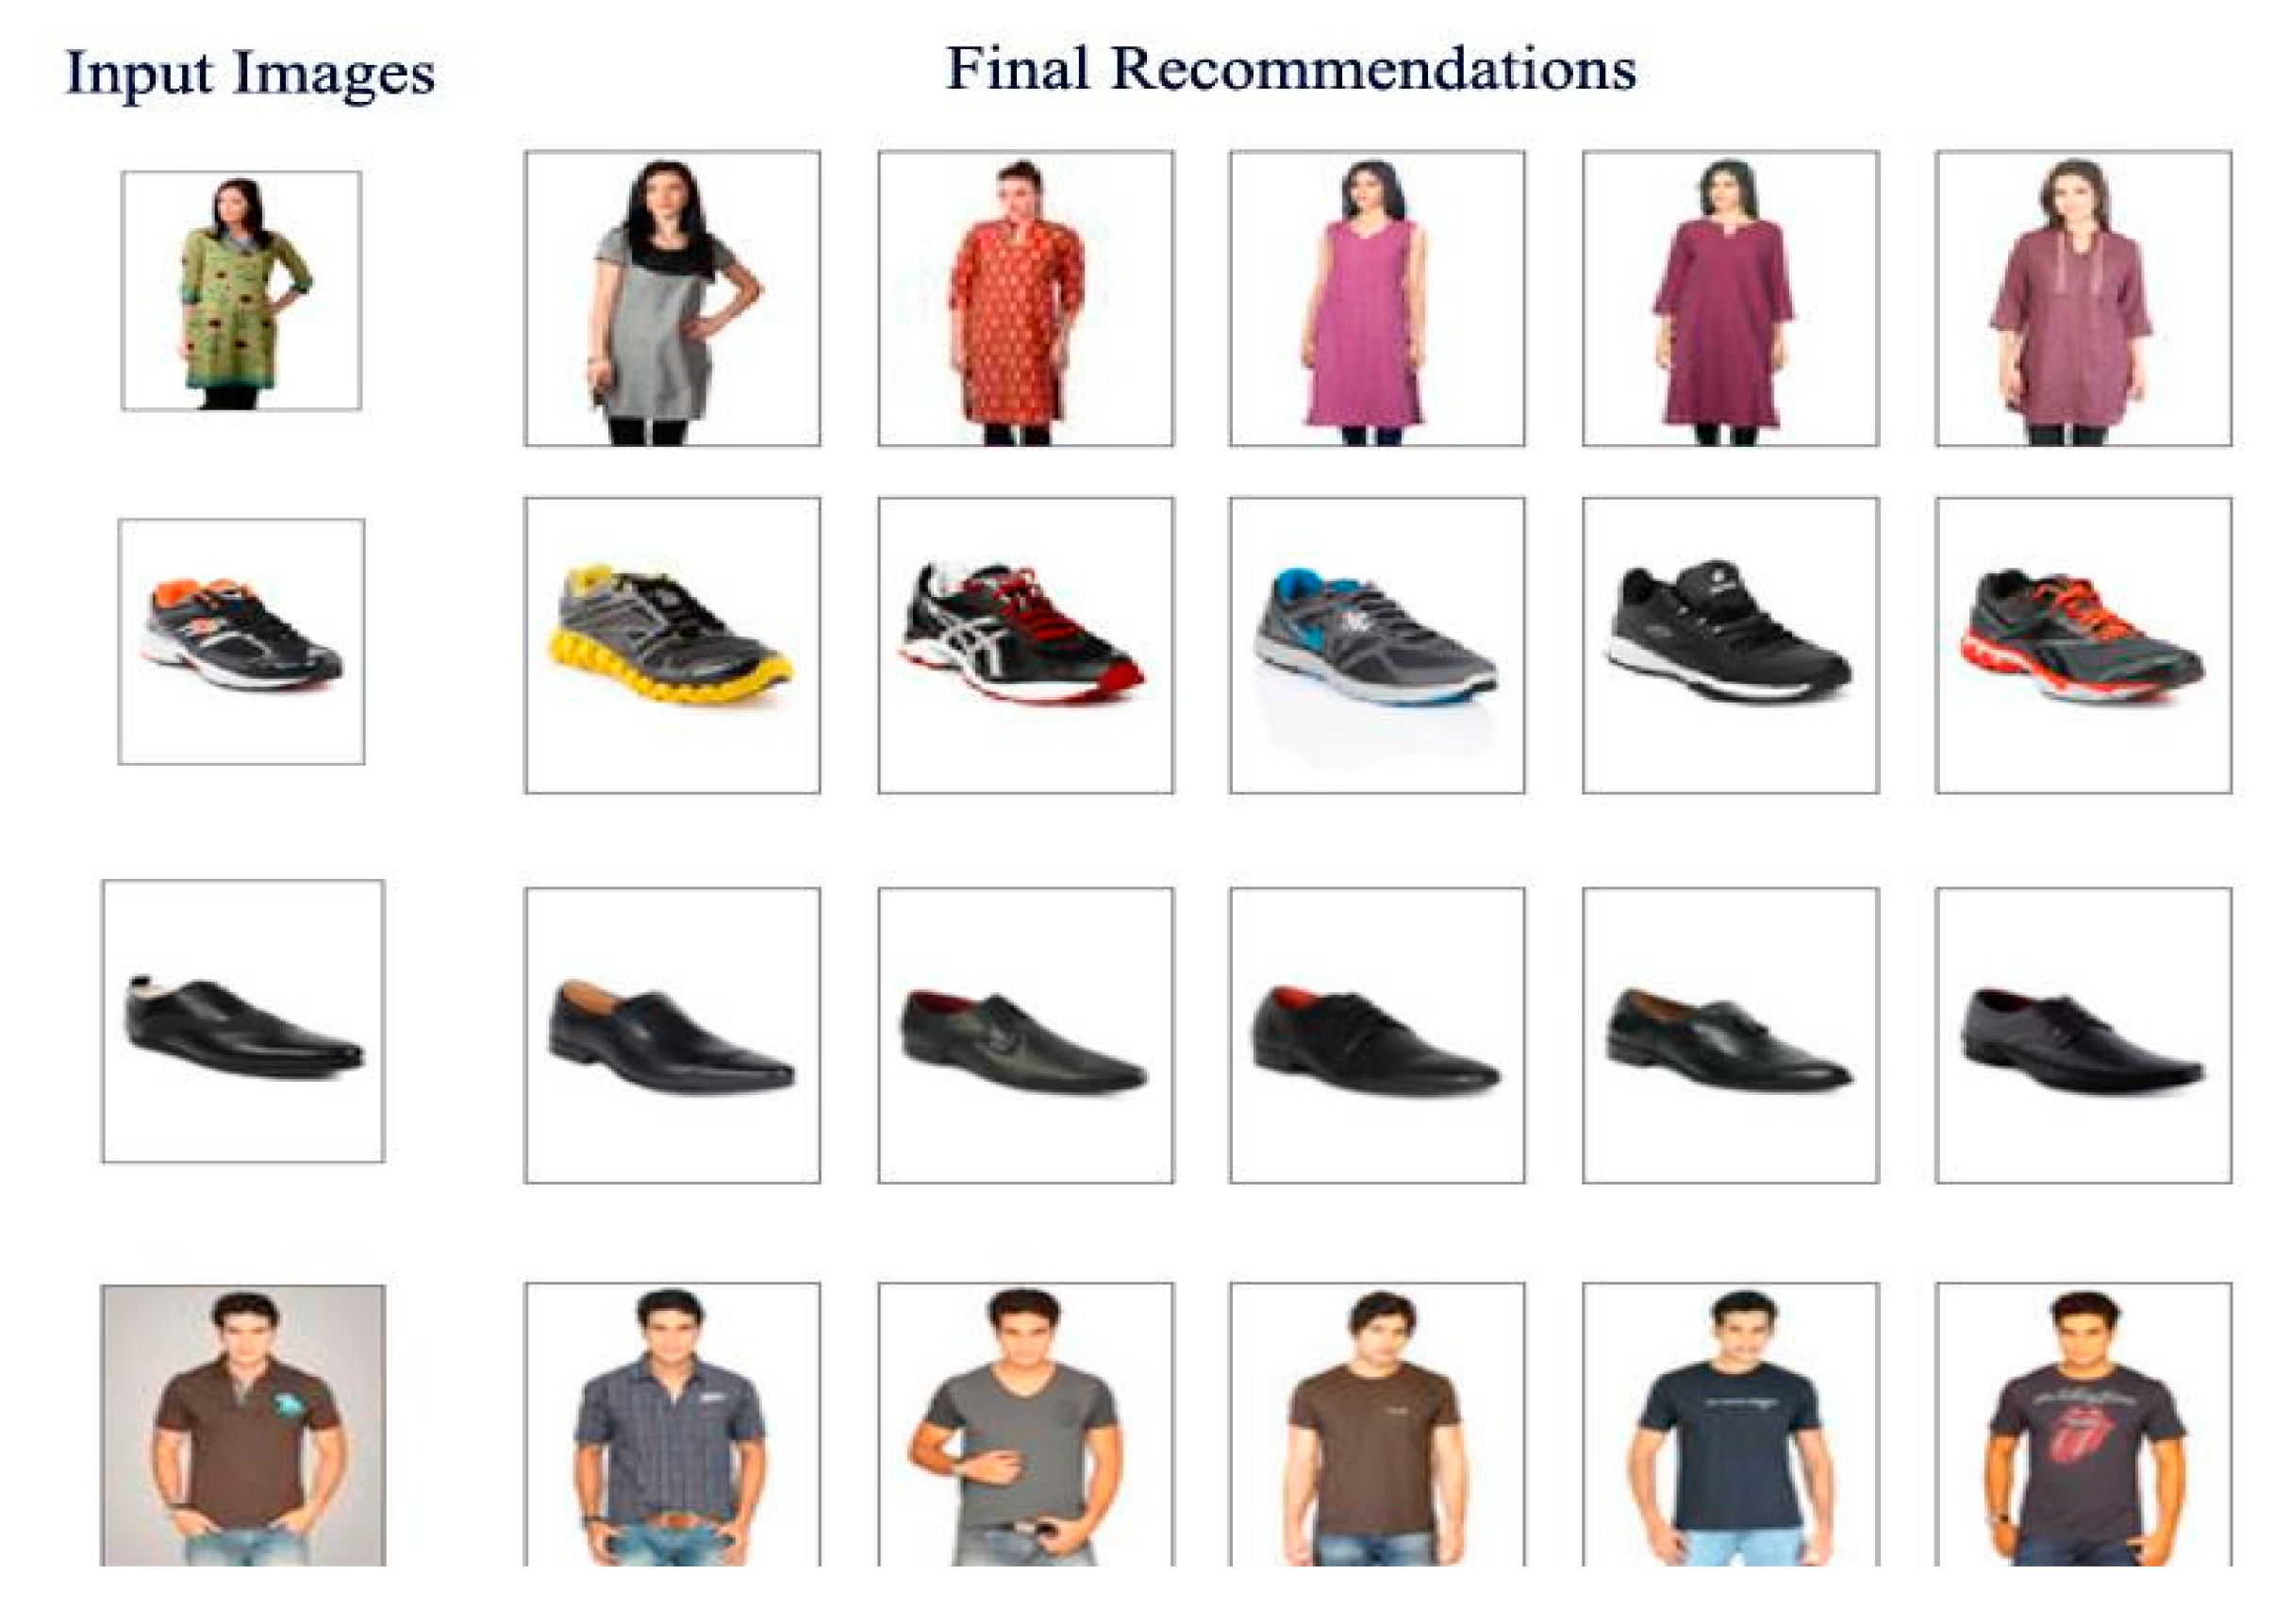
5. Results
6. Conclusions
Author Contributions
Funding
Conflicts of Interest
References
- Wulansaria, I.Y.; Parwantob, N.B. Asian E-Commerce Engages Global Trade Openness: The Role of Information and Communications Technology, Social, and Security Indicators. Int. J. Innov. Creat. Chang. 2020, 11, 12. [Google Scholar]
- eCommerce—Asia | Statista Market Forecast. Available online: https://www.statista.com/outlook/243/101/ecommerce/asia (accessed on 2 February 2020).
- Salau, A.O.; Jain, S. Feature Extraction: A Survey of the Types, Techniques, Applications. In Proceedings of the 2019 International Conference on Signal Processing and Communication (ICSC), Noida, India, 7–9 March 2019; pp. 158–164. [Google Scholar]
- Haji, M.S.; Alkawaz, M.H.; Rehman, A.; Saba, T. Content-Based Image Retrieval: A Deep Look at Features Prospectus. Int. J. Comput. Vis. Robot. 2019, 9, 14–38. [Google Scholar] [CrossRef]
- Kumari, M. Content Based Image Retrieval. Available online: https://papers.ssrn.com/sol3/papers.cfm?abstract_id=3371777 (accessed on 14 May 2019).
- Zhou, J.; Liu, X.; Liu, W.; Gan, J. Image Retrieval Based on Effective Feature Extraction and Diffusion Process. Multimed. Tools Appl. 2019, 78, 6163–6190. [Google Scholar] [CrossRef]
- Pal, M.S.; Garg, D.S.K. Image Retrieval: A Literature Review. Int. J. Adv. Res. Comput. Eng. Technol. 2013, 2, 1323–2278. [Google Scholar]
- Limitations of Text Based Image Retrieval Psychology Essay. Available online: https://www.ukessays.com/essays/psychology/limitations-of-text-based-image-retrieval-psychology-essay.php (accessed on 15 October 2020).
- Wold, S.; Esbensen, K.; Geladi, P. Principal Component Analysis. Chemom. Intell. Lab. Syst. 1987, 2, 37–52. [Google Scholar] [CrossRef]
- Roweis, S.T. EM Algorithms for PCA and SPCA. Advances in Neural Information Processing Systems. pp. 626–632. Available online: http://papers.neurips.cc/paper/1398-em-algorithms-for-pca-and-spca (accessed on 22 October 2020).
- Tharwat, A.; Gaber, T.; Ibrahim, A.; Hassanien, A.E. Linear Discriminant Analysis: A Detailed Tutorial. AI Commun. 2017, 30, 169–190. [Google Scholar] [CrossRef]
- Tipping, M.E.; Bishop, C.M. Probabilistic Principal Component Analysis. J. R. Stat. Soc. Ser. B Stat. Methodol. 1999, 61, 611–622. [Google Scholar] [CrossRef]
- Kaya, I.E.; Pehlivanlı, A.Ç.; Sekizkardeş, E.G.; Ibrikci, T. PCA Based Clustering for Brain Tumor Segmentation of T1w MRI Images. Comput. Methods Programs Biomed. 2017, 140, 19–28. [Google Scholar] [CrossRef]
- Geng, X.; Zhang, H.; Bian, J.; Chua, T.-S. Learning Image and User Features for Recommendation in Social Networks. In Proceedings of the IEEE International Conference on Computer Vision, Santiago, Chile, 7 December 2015; pp. 4274–4282. [Google Scholar]
- Tyagi, V. Similarity Measures and Performance Evaluation. In Content-Based Image Retrieval; Springer: Berlin/Heidelberg, Germany, 2017; pp. 63–83. [Google Scholar]
- Clustering Scikit-Learn 0.23.2 documentation. Available online: https://scikit-learn.org/stable/modules/clustering.html#clustering-performance-evaluation (accessed on 2 February 2020).
- Steinley, D.; Brusco, M.J.; Hubert, L. Properties of the Hubert-Arable Adjusted Rand Index. Psychol. Methods 2004, 21, 261. [Google Scholar] [CrossRef]
- Rosenberg, A.; Hirschberg, J. V-Measure: A Conditional Entropy-Based External Cluster Evaluation Measure. In Proceedings of the 2007 joint conference on empirical methods in natural language processing and computational natural language learning (EMNLP-CoNLL), Prague, Czech Republic, 28–30 June 2007; pp. 410–420. [Google Scholar]
- Hirschberg, J.B.; Rosenberg, A. V-Measure: A Conditional Entropy-Based External Cluster Evaluation. 2007. Available online: http://www.aclweb.org/anthologyy/D07-103 (accessed on 14 August 2020).
- Gholamian, M.; Jahanpour, S.; Sadatrasoul, S. A New Method for Clustering in Credit Scoring Problems. J. Math. Comput. Sci. 2013, 6, 97–106. [Google Scholar] [CrossRef]
- Lu, Y.; Wu, Y.; Liu, J.; Li, J.; Zhang, P. Understanding Health Care Social Media Use from Different Stakeholder Perspectives: A Content Analysis of an Online Health Community. J. Med. Internet Res. 2017, 19, e109. [Google Scholar] [CrossRef] [PubMed]
- Hancer, E.; Ozturk, C.; Karaboga, D. Artificial Bee Colony Based Image Clustering Method. In Proceedings of the 2012 IEEE Congress on Evolutionary Computation, Brisbane, Australia, 10–15 June 2012; pp. 1–5. [Google Scholar] [CrossRef]
- Gong, M.; Liang, Y.; Shi, J.; Ma, W.; Ma, J. Fuzzy C-Means Clustering with Local Information and Kernel Metric for Image Segmentation. IEEE Trans. Image Process. 2012, 22, 573–584. [Google Scholar] [CrossRef] [PubMed]
- Karthikeyan, M.; Aruna, P. Probability Based Document Clustering and Image Clustering Using Content-Based Image Retrieval. Appl. Soft Comput. 2013, 13, 959–966. [Google Scholar] [CrossRef]
- Zeng, K.; Yu, J.; Li, C.; You, J.; Jin, T. Image Clustering by Hyper-Graph Regularized Non-Negative Matrix Factorization. Neurocomputing 2014, 138, 209–217. [Google Scholar] [CrossRef]
- Ozturk, C.; Hancer, E.; Karaboga, D. Improved Clustering Criterion for Image Clustering with Artificial Bee Colony Algorithm. Pattern Anal. Appl. 2015, 18, 587–599. [Google Scholar] [CrossRef]
- Younus, Z.S.; Mohamad, D.; Saba, T.; Alkawaz, M.H.; Rehman, A.; Al-Rodhaan, M.; Al-Dhelaan, A. Content-Based Image Retrieval Using PSO and k-Means Clustering Algorithm. Arab. J. Geosci. 2015, 8, 6211–6224. [Google Scholar] [CrossRef]
- Lin, X.; Li, C.-T. Large-Scale Image Clustering Based on Camera Fingerprints. IEEE Trans. Inf. Forensics Secur. 2016, 12, 793–808. [Google Scholar] [CrossRef]
- Villalba, L.J.G.; Orozco, A.L.S.; Corripio, J.R. Smartphone Image Clustering. Expert Syst. Appl. 2015, 42, 1927–1940. [Google Scholar] [CrossRef]
- Yang, J.; Parikh, D.; Batra, D. Joint Unsupervised Learning of Deep Representations and Image Clusters. In Proceedings of the IEEE Conference on Computer Vision and Pattern Recognition (CVPR), Las Vegas, NV, USA, 27–30 June 2016. [Google Scholar]
- Pandey, S.; Khanna, P. Content-Based Image Retrieval Embedded with Agglomerative Clustering Built on Information Loss. Comput. Electr. Eng. 2016, 54, 506–521. [Google Scholar] [CrossRef]
- L i, S.; Yu, H.; Yuan, L. A Novel Approach to Remote Sensing Image Retrieval with Multi-Feature vp-Tree Indexing and Online Feature Selection. In Proceedings of the 2016 IEEE Second International Conference on Multimedia Big Data (BigMM), Taipei, Taiwan, 20–22 April 2016; pp. 133–136. [Google Scholar] [CrossRef]
- Biradar, M.; Ahmed, M. Visual Based Information Retrieval Using Voronoi Tree. In Proceedings of the 5th International Conference on Frontiers in Intelligent Computing: Theory and Applications, Beijing, China, 2–5 November 2017; pp. 603–609. [Google Scholar]
- Zhu, X.; Li, X.; Zhang, S.; Xu, Z.; Yu, L.; Wang, C. Graph PCA Hashing for Similarity Search. IEEE Trans. Multimed. 2017, 19, 2033–2044. [Google Scholar] [CrossRef]
- Fachrurrozi, M.; Fiqih, A.; Saputra, B.R.; Algani, R.; Primanita, A. Content Based Image Retrieval for Multi-Objects Fruits Recognition Using k-Means and k-Nearest Neighbor. In Proceedings of the 2017 International Conference on Data and Software Engineering (ICoDSE), Palembang, Indonesia, 1–2 November 2017; pp. 1–6. [Google Scholar]
- Yildiz, K. Dimensionality Reduction-Based Feature Extraction and Classification on Fleece Fabric Images. Signal Image Video Process. 2017, 11, 317–323. [Google Scholar] [CrossRef]
- Cui, Y.; Wong, W.K. Textile Image Retrieval Using Joint Local PCA-Based Feature Descriptor. In Applications of Computer Vision in Fashion and Textiles; Elsevier: Amsterdam, The Netherlands, 2018; pp. 253–271. [Google Scholar]
- Chen, Y.; Tang, S.; Bouguila, N.; Wang, C.; Du, J.; Li, H.L. A Fast Clustering Algorithm Based on Pruning Unnecessary Distance Computations in DBSCAN for High-Dimensional Data. Pattern Recognit. 2018, 83, 375–387. [Google Scholar] [CrossRef]
- Singh, V.P.; Srivastava, R. Improved Image Retrieval Using Fast Colour-Texture Features with Varying Weighted Similarity Measure and Random Forests. Multimed. Tools Appl. 2018, 77, 14435–14460. [Google Scholar] [CrossRef]
- Ashraf, R.; Ahmed, M.; Jabbar, S.; Khalid, S.; Ahmad, A.; Din, S.; Jeon, G. Content Based Image Retrieval by Using Color Descriptor and Discrete Wavelet Transform. J. Med. Syst. 2018, 42, 44. [Google Scholar] [CrossRef] [PubMed]
- Jian, M.; Yin, Y.; Dong, J.; Lam, K.-M. Content-Based Image Retrieval via a Hierarchical-Local-Feature Extraction Scheme. Multimed. Tools Appl. 2018, 77, 29099–29117. [Google Scholar] [CrossRef]
- Jafarzadegan, M.; Safi-Esfahani, F.; Beheshti, Z. Combining Hierarchical Clustering Approaches Using the PCA Method. Expert Syst. Appl. 2019, 137, 1–10. [Google Scholar] [CrossRef]
- Mateen, M.; Wen, J.; Nasrullah; Song, S.; Huang, Z. Fundus Image Classification Using VGG-19 Architecture with PCA and SVD. Symmetry 2019, 11, 1. [Google Scholar] [CrossRef]
- Sejal, D.; Rashmi, V.; Venugopal, K.R.; Iyengar, S.S.; Patnaik, L.M. Image Recommendation Based on Keyword Relevance Using Absorbing Markov Chain and Image Features. Int. J. Multimed. Inf. Retr. 2016, 5, 185–199. [Google Scholar] [CrossRef]
- Sha, D.; Wang, D.; Zhou, X.; Feng, S.; Zhang, Y.; Yu, G. An Approach for Clothing Recommendation Based on Multiple Image Attributes. In Proceedings of the International Conference on Web-Age Information Management, Nanchang, China, 3–5 June 2016; pp. 272–285. [Google Scholar]
- Shrivastava, R.; Sisodia, D.S. Product Recommendations Using Textual Similarity Based Learning Models. In Proceedings of the 2019 International Conference on Computer Communication and Informatics (ICCCI), Coimbatore, India, 23–25 January 2019; pp. 1–7. [Google Scholar]
- Aït-Sahalia, Y.; Xiu, D. Principal Component Analysis of High-Frequency Data. J. Am. Stat. Assoc. 2019, 114, 287–303. [Google Scholar] [CrossRef]
- Furnas, G.W.; Deerwester, S.; Durnais, S.T.; Landauer, T.K.; Harshman, R.A.; Streeter, L.A.; Lochbaum, K.E. Information Retrieval Using a Singular Value Decomposition Model of Latent Semantic Structure. ACM SIGIR Forum 2017, 51, 90–105. [Google Scholar] [CrossRef]
- De Lathauwer, L.; De Moor, B.; Vandewalle, J. A Multilinear Singular Value Decomposition. SIAM J. Matrix Anal. Appl. 2000, 21, 1253–1278. [Google Scholar] [CrossRef]
- Parlett, B.N. The QR Algorithm. Comput. Sci. Eng. 2000, 2, 38–42. [Google Scholar] [CrossRef]
- Wall, M.E.; Rechtsteiner, A.; Rocha, L.M. Singular Value Decomposition and Principal Component Analysis. In A Practical Approach to Microarray Data Analysis; Springer: Berlin/Heidelberg, Germany, 2003; pp. 91–109. [Google Scholar]
- Ding, C.; He, X. K-Means Clustering via Principal Component Analysis. In Proceedings of the Twenty-First International Conference on Machine Learning, Banff, AB, Canada, 4–8 July 2004; p. 29. [Google Scholar]
- Arthur, D.; Vassilvitskii, S. K-Means++: The Advantages of Careful Seeding; Stanford University: Stanford, CA, USA, 2006; pp. 1–11. [Google Scholar]
- Aranganayagi, S.; Thangavel, K. Clustering Categorical Data Using Silhouette Coefficient as a Relocating Measure. In Proceedings of the International Conference on Computational Intelligence and Multimedia Applications (ICCIMA 2007), Sivakasi, India, 13–15 December 2007; Volume 2, pp. 13–17. [Google Scholar]
- Fashion Product Images Dataset | Kaggle. Available online: https://www.kaggle.com/paramaggarwal/fashion-product-images-dataset (accessed on 2 February 2020).
- van der Maaten, L.; Hinton, G. Visualizing Data Using T-SNE. J. Mach. Learn. Res. 2008, 9, 2579–2605. [Google Scholar]


| Clustering Algorithm | SC Coefficient | CH Score | DB Score |
|---|---|---|---|
| MiniBatch | 0.131669 | 637.60 | 1.9229 |
| K-Mediod | 0.124709 | 609.61 | 2.0946 |
| Agglomerative | 0.108739 | 590.66 | 1.9856 |
| Brich | 0.109466 | 600.36 | 1.8893 |
| GMM | 0.067083 | 460.55 | 2.2714 |
| K-Means++ | 0.141421 | 669.44 | 1.8538 |
| Clustering Algorithm | Computation Wall Time (Milliseconds (ms)/Seconds (s)/Minutes (min) | |||
|---|---|---|---|---|
| Cluster Fitting | SC Coefficient | CH Score | DB Score | |
| MiniBatch | 2.51 s | 9.09 s | 51.2 ms | 120 ms |
| K-Mediod | 10.9 s | 9.08 s | 60. 4 ms | 108 ms |
| Agglomerative | 40.7 s | 11.6 s | 79.1 ms | 131 ms |
| Brich | 35.4 s | 9.05 s | 48.2 ms | 108 ms |
| GMM | 1 min 4 s | 10.2 s | 1.16 s | 1.12 s |
| K-Means++ | 21.3 s | 48.5 s | 52.5 ms | 1.04 s |
Publisher’s Note: MDPI stays neutral with regard to jurisdictional claims in published maps and institutional affiliations. |
© 2020 by the authors. Licensee MDPI, Basel, Switzerland. This article is an open access article distributed under the terms and conditions of the Creative Commons Attribution (CC BY) license (http://creativecommons.org/licenses/by/4.0/).
Share and Cite
Addagarla, S.K.; Amalanathan, A. Probabilistic Unsupervised Machine Learning Approach for a Similar Image Recommender System for E-Commerce. Symmetry 2020, 12, 1783. https://doi.org/10.3390/sym12111783
Addagarla SK, Amalanathan A. Probabilistic Unsupervised Machine Learning Approach for a Similar Image Recommender System for E-Commerce. Symmetry. 2020; 12(11):1783. https://doi.org/10.3390/sym12111783
Chicago/Turabian StyleAddagarla, Ssvr Kumar, and Anthoniraj Amalanathan. 2020. "Probabilistic Unsupervised Machine Learning Approach for a Similar Image Recommender System for E-Commerce" Symmetry 12, no. 11: 1783. https://doi.org/10.3390/sym12111783
APA StyleAddagarla, S. K., & Amalanathan, A. (2020). Probabilistic Unsupervised Machine Learning Approach for a Similar Image Recommender System for E-Commerce. Symmetry, 12(11), 1783. https://doi.org/10.3390/sym12111783