Article

A Novel Centrality for Finding Key Persons in a Social Network by the Bi-Directional Influence Map

1
Department of Business Administration, Chung Yuan Christian University, No.200 Chung Pei Road, Chung Li District, Taoyuan 320, Taiwan
2
Department of Computer Science & Information Management, SooChow University, No.56 Kueiyang Street, Section 1, Taipei 100, Taiwan
*
Author to whom correspondence should be addressed.
Symmetry 2020, 12(10), 1747; https://doi.org/10.3390/sym12101747
Submission received: 29 September 2020 / Revised: 16 October 2020 / Accepted: 16 October 2020 / Published: 21 October 2020

Abstract

:
Symmetry is one of the important properties of Social networks to indicate the co-existence relationship between two persons, e.g., friendship or kinship. Centrality is an index to measure the importance of vertices/persons within a social network. Many kinds of centrality indices have been proposed to find prominent vertices, such as the eigenvector centrality and PageRank algorithm. PageRank-based algorithms are the most popular approaches to handle this task, since they are more suitable for directed networks, which are common situations in social media. However, the realistic problem in social networks is that the process to find true important persons is very complicated, since we should consider both how the influence of a vertex affects others and how many others follow a given vertex. However, past PageRank-based algorithms can only reflect the importance on the one side and ignore the influence on the other side. In addition, past algorithms only view the transition from one status to the next status as a linear process without considering more complicated situations. In this paper, we develop a novel centrality to find key persons within a social network by a proposed synthesized index which accounts for both the inflow and outflow matrices of a vertex. Besides, we propose different transition functions to represent the relationship from status to status. The empirical studies compare the proposed algorithms with the conventional algorithms and show the differences and flexibility of the proposed algorithm.

Graphical Abstract

1. Introduction

Key person identification within a social network means to find persons who can change the feelings, attitudes, or behaviors of other persons though network relationships [1] and, therefore, this is a critical issue in the fields of viral marketing [2], spread of opinions [3], rumor restraint [3], and innovation dissemination [4]. As we know, one of the major properties within social networks is its symmetry between nodes. Many algorithms have been proposed to identify important persons within a social network based on the concept of vertex centralities.
Vertex centrality measures the importance of persons within a network according to their position relative to others. These measures can be divided into local measures, short path-based measures, and iterative calculation-based measures [5]. The most famous local measure is degree centrality, which is used [6,7] to identify the most influential persons within a social network. However, it only reflects the influence of an ego’s neighbors and ignores the influence of further persons [8] Note that an ego is the vertex which we focus on within a social network.
By contrast, short path-based measures calculate the influence of an ego by considering the shortest paths between any two vertices. These measures include closeness, betweenness, and Katz centralities. The person with the shortest path between vertices is viewed as the most prominent vertex. The short path-based centralities have also been used to identify key persons within a social network, e.g., in the work by Catanese et al. [9] and Zhao et al. [10].
Iterative calculation-based measures account for all network paths to calculate the importance of an ego. Each vertex contributes its ranking value to its output neighbors and updates the value in each iteration round until a steady state is achieved. Two famous measures in this classification are eigenvector centrality and PageRank-based algorithms, e.g., TunkRank (Tunkelang, 2009), TwitterRank [11], and ProfileRank [12]. PageRank-based algorithms are the most popular approach to identify key persons within a social network, e.g., those featured in the work by Jabeur et al. [13], Ding et al. [14], Pei et al. [15].
However, we should consider more important factors which are not accounted for by PageRank-based algorithms to determine which persons are prominent within a social network. For example, conventional PageRank-based algorithms only consider the influence of the authority but ignore the influence of the hub [16]. A similar concept has also been proposed by Fogaras [17], Gyongyi et al. [18], and Bar-Yossef and Mashiach [19] to consider a reverse PageRank algorithm to account for the centrality of the hub. In addition, the iterative process of calculating the centrality in PageRank-based algorithms is a linear transition and ignores the possibility of non-linear functions. Finally, these algorithms usually normalize the centrality by dividing the out-degree of the ego. However, we can describe the details of the normalization method, which should be modified to obtain a more accurate result later.
In this paper, we propose a novel algorithm by considering the above problems of the PageRank algorithm. The distinctions of the proposed algorithm from others are described as follows. First, the proposed algorithm accounts for the both centralities of the authority and hub. Second, the algorithm considers different nonlinear functions to be the transition function of the update status. Third, we consider a different normalization factor instead of the out-degree of the ego to obtain a diversity result. Besides, we consider two social networks, namely, the Marvel University characteristic network and the Facebook social network, to illustrate the proposed algorithm and compare the results with others. The empirical results indicate that the proposed algorithm is flexible and that the derived centrality can be considered as a synthesized index to determine key persons within a social network.

2. Introduction of Centralities

The most common centralities in social network analysis are the degree, closeness, and betweenness to account for key persons. The degree centrality is defined by the number of direct neighbors as an indicator of the influence of a network member’s interconnectedness (Nieminen, 1974). Let a network represented by a graph G(V,E), where V and E denote the sets of vertices and edges, respectively. Then, the degree of the i-th vertex, vi, can be represented as follows:
C D ( v i ) = deg ( v i )
where deg(·) is the degree of the vertex. If the graph is directed, we should account for the in- and out-degrees separately. In-degree centrality measures the popularity/prestige of a person and out-degree, by contrast, accounts for the sociality of a user [20,21].
Next, the thought of the closeness centrality is that a vertex that is closer to others can spread information very productively via the network [22], and therefore it is important. The closeness centrality can be measured by the sum of the vertex’s distance from all others:
C C ( v i ) = 1 j = 1 n d ( v j , v i ) , j i
where d(·) denotes the distance between vertices. Finally, we can define the betweenness centrality as a bridge along the shortest path between two vertices as follows:
C B ( v i ) = i j k V σ v j v k ( v i ) σ v j v k
where σ v j v k denotes the number of shortest paths from vertex vj to vk and σ v j v k ( v i ) is the number of shortest paths from vj to vk that pass through vi. Although the previous three centralities are easily calculated, they only reflect the influence of vertices with respect to others in the topology of a social network without considering the influence of their neighbors/friends and cannot be used as a comprehensive centrality for measuring key persons. Hence, the eigenvector centrality is proposed to reflect the importance of neighbors.

3. Eigenvector Centrality

First, we assume that the importance of a vertex within an undirected network is only determined by the influence of others and that a vertex achieves more centrality if it receives more in-degree flows from others. Hence, let n criteria be considered to determine their weights. The eigenvector centrality of the ith ego can be represented as follows:
E C ( v i ) = 1 λ j = 1 n A j , i E C ( v j )
where Aj,i is the element at the jth row and ith column of the adjacency matrix which indicates the relationship from one vertex (row) to another (column) and λ is a fixed constant. For simplicity, we can represent Equation (4) as a matrix form:
λ E C ( v ) = A T E C ( v )
Equation (5) indicates the eigenvector centrality vector, EC(v), which is an eigenvector of ATand λ is the corresponding eigenvalue. Note that the initial EC(v) can be set as 1, i.e., the all-one vector. Usually, we select the maximum eigenvalue, λmax, to ensure EC(v) is large than the zero vector. According to the Perron–Frobenius theorem [23], for any aij > 0, EC(v) of A with eigenvalue λmax such that ∀EC(vj) > 0.
We can also let AT be a row stochastic matrix, i.e., normalized AT such that all sums of each row exactly equal to one. We can rewrite Equation (5) as follows:
E C ( v ) = A T E C ( v )
The advantage of Equation (6) is that the eigenvector can be easily be derived since λmax = 1. In addition, we can also derive the eigenvector by calculating the limiting power of AT according to Markov chain theory.

4. Katz Centrality

The problem of the eigenvector centrality is that it only suits undirected graphs. In addition, Equation (6) is not always reasonable if a vertex only influences others, i.e., a vertex with no in-degree, and, therefore, its centrality becomes zero, even if it might play an important role in affecting others. Hence, we can introduce a constant, β, to Equation (7) to reflect the extent to which the weight of the centrality of an ego is tied to and add the scaling constant, α, to normalize the score. The method is called the Katz centrality [24]. Hence, we can re-write Equation (6) as follows:
K C ( v i ) = α j = 1 n A j , i K C ( v i ) + β
where α   <   1 λ max to ensure a reliable result.
Or we can present Equation (7) as the matrix form:
K C ( v ) = α A T K C ( v ) + β 1
Then, we can re-formulate Equation (8) and derive the Katz centrality vector by:
K C ( v ) = β ( I α A T ) 1 1
where 1 denotes the one vector.

5. PageRank Algorithm

Although Katz centrality extends eigenvector centrality to account for direct networks, it assumes that the all vertices will pass their flows into the ith vertex. However, if a vertex does not want to pass all of its flow to others, we should restrict the linked vertex so it only gets a fraction of flow from others. Hence, we can use the PageRank algorithm and re-write Equation (9) to represent the above description as follows [25]:
P R ( v i ) = α j = 1 n A j , i d j o u t P R ( v j ) + β
where α is the damping factor and d j o u t denotes the out-degree of the jth vertex. The reason we divide Aj,i over the out-degree is to normalize the adjacency matrix into the stochastic matrix. In addition, we can re-write Equation (10) as the matrix form as follows:
P R ( v ) = β ( I α A T D 1 ) 1 1
where D = diag( d 1 o u t , d 2 o u t , , d n o u t ) denotes a fixed out-degree matrix and ATD1 is a column stochastic matrix. Note that the since ATD1 is a column stochastic matrix, the damping factor α should be less than one to ensure that (Iα ATD1) is invertible. Although many variants of the PageRank have been proposed successively, the cores of the algorithms are similar.

6. HITS Algorithm

Hypertext-induced topic search (HITS) is another popular algorithm that has been proposed by Kleinberg [26] to rank web pages. The major characteristic of HITS is that it divides the influence of a vertex into the authority and hub, where the authority measures the degree that other vertices point to an ego and the hub reflects the degree that an ego points outward to others. The concept of the authority and hub can be represented, respectively, as follows:
a u t h ( v i ) = v j v i h u b ( v j )
h u b ( v i ) = v j v i a u t h ( v j )
where vjv1 indicates that vertex vj points to vi. We can calculate the score vectors of the authority and hub of vertices, respectively, as follows:
v a ( t + 1 ) = c ( t ) A T A v a ( t )
v h ( t + 1 ) = c ( t ) A A T v h ( t )
where ATA and AAT are called authority and hub matrices, respectively, and c(t) and c′(t) are constants which normalize the authority and hub score vectors. From Equations (14) and (15), it can be seen that the HITS algorithm is used to calculate the eigenvectors of ATA and AAT. The HITS algorithm highlights that the centrality of a vertex should consider two different forces, namely, the authority and hub. However, it only proposes indices to measure the centralities of the authority and hub separately without a synthesized centrality.

7. Fuzzy Cognitive Map

The fuzzy cognitive map (FCM) approach was proposed by Kosko [27] to extend cognitive maps [28] by considering the fuzzy degrees of interrelationship between concepts. The FCM is used to reflect the influence of vertices, called concepts here, to others via cause-effect relationships, which are quantified and usually normalized to the [−1, 1] interval.
Let wij ∈ [−1, 1] be the degree of influence from the ith concept, Ci, to the jth concept, Cj, where the sign indicates the positive or negative influence and −1 denotes a full negative impact and 1 expresses a full positive impact. Then, the influence of concept, x, can be calculated by the following equation:
x i ( t + 1 ) = f ( j = 1 , j i n x j ( t ) w j , i )
where n is the number of concepts and f(·) denotes the transfer function to squeeze the result of the multiplication into a specific range, e.g., [0, 1] or [−1, 1]. Usually, bivalent, trivalent, and sigmoid functions are used in the FCM.
A modified Kosko’s version of the FCM was proposed by Stylios and Groumpos [29] to consider the previous value of each concept, i.e., observing the self-loop effect. Hence, Equation (16) can be modified and extended as follows:
x i ( t + 1 ) = f ( j = 1 , j i n x j ( t ) w j , i + x i ( t ) )
Another variant of the FCM is that which is used for rescale inference and is presented as follows:
x i ( t + 1 ) = f ( j = 1 , j i n ( 2 x j ( t ) 1 ) w j , i + ( 2 x i ( t ) 1 ) )
The positive and negative influences in the FCM indicate that the centrality of a vertex within a graph should consider two opposite forces to aggregate the final centrality.
Let us consider an example to illustrate the above concept. Assume a graph is given as shown in Figure 1.
The influences between the concepts are quantified by an expert and are shown in Table 1.
In order to show the different centralities of positive and negative influences, we consider all positive and negative influences, respectively, in the influence matrix. Then, we use the modified Kosko’s inference rule and logistic function to derive the influences and ranks of the concepts, as shown in Table 2.
Table 2 shows that the positive and negative influences from concept to concept exert two opposite forces on the synthesized centrality of a concept in the FCM. In addition, the transform functions squash the influence of vertices into a specific range with the nonlinear function. However, the FCM is not adequate in handing the problem directly here because the influence matrix in a social network is usually unavailable. The only information we can get is the graph of a social network, i.e., the adjacency matrix. In addition, negative influences between vertices are not considered due to the lack of the information. However, the concept of transform functions could be incorporated into the proposed algorithm.

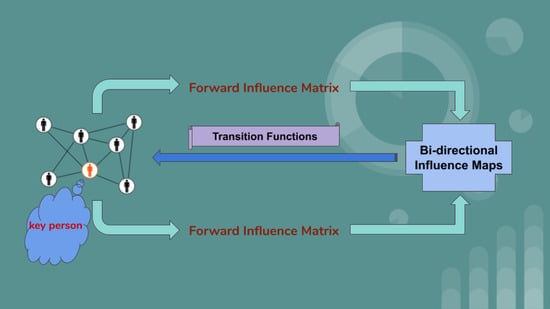
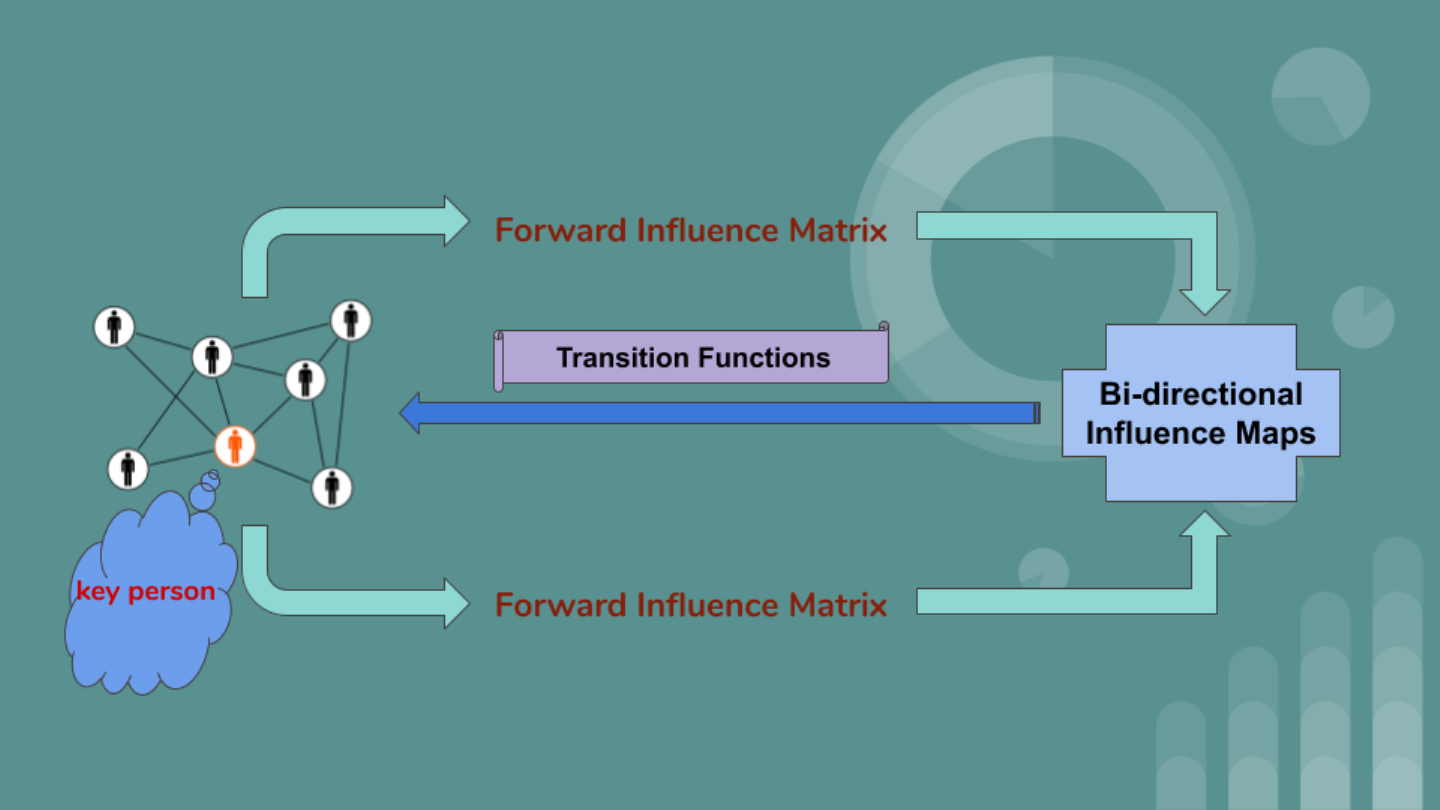
8. Bi-Directional Influence Maps (BIM)

After viewing the previous research, we can conclude that two types of importance of a node should be identified, namely, the authority and hub [16]. An authority can be defined by other vertices inflow to an ego and a hub can be measured by the total outflow points to others. However, previous models only focus on the one side and we can incorporate both forms of information to form the centrality of a vertex here as follows:
M ( v i ( t + 1 ) ) = α j = 1 n ( γ A ^ j , i i n M ( v j ( t ) ) + ( 1 γ ) A ^ j , i o u t M ( v j ( t ) ) ) + 1 α n
where A ^ j , i i n and A ^ j , i o u t denote the inflow and outflow influence matrices which have been normalized to stochastic matrices and γ and (1 − γ) denote the weights of the authority and hub. Note that we use the influence matrix above rather than the adjacency matrix because we will consider another method to modify the conventional adjacency matrix for more rational results. This is described in detail below.
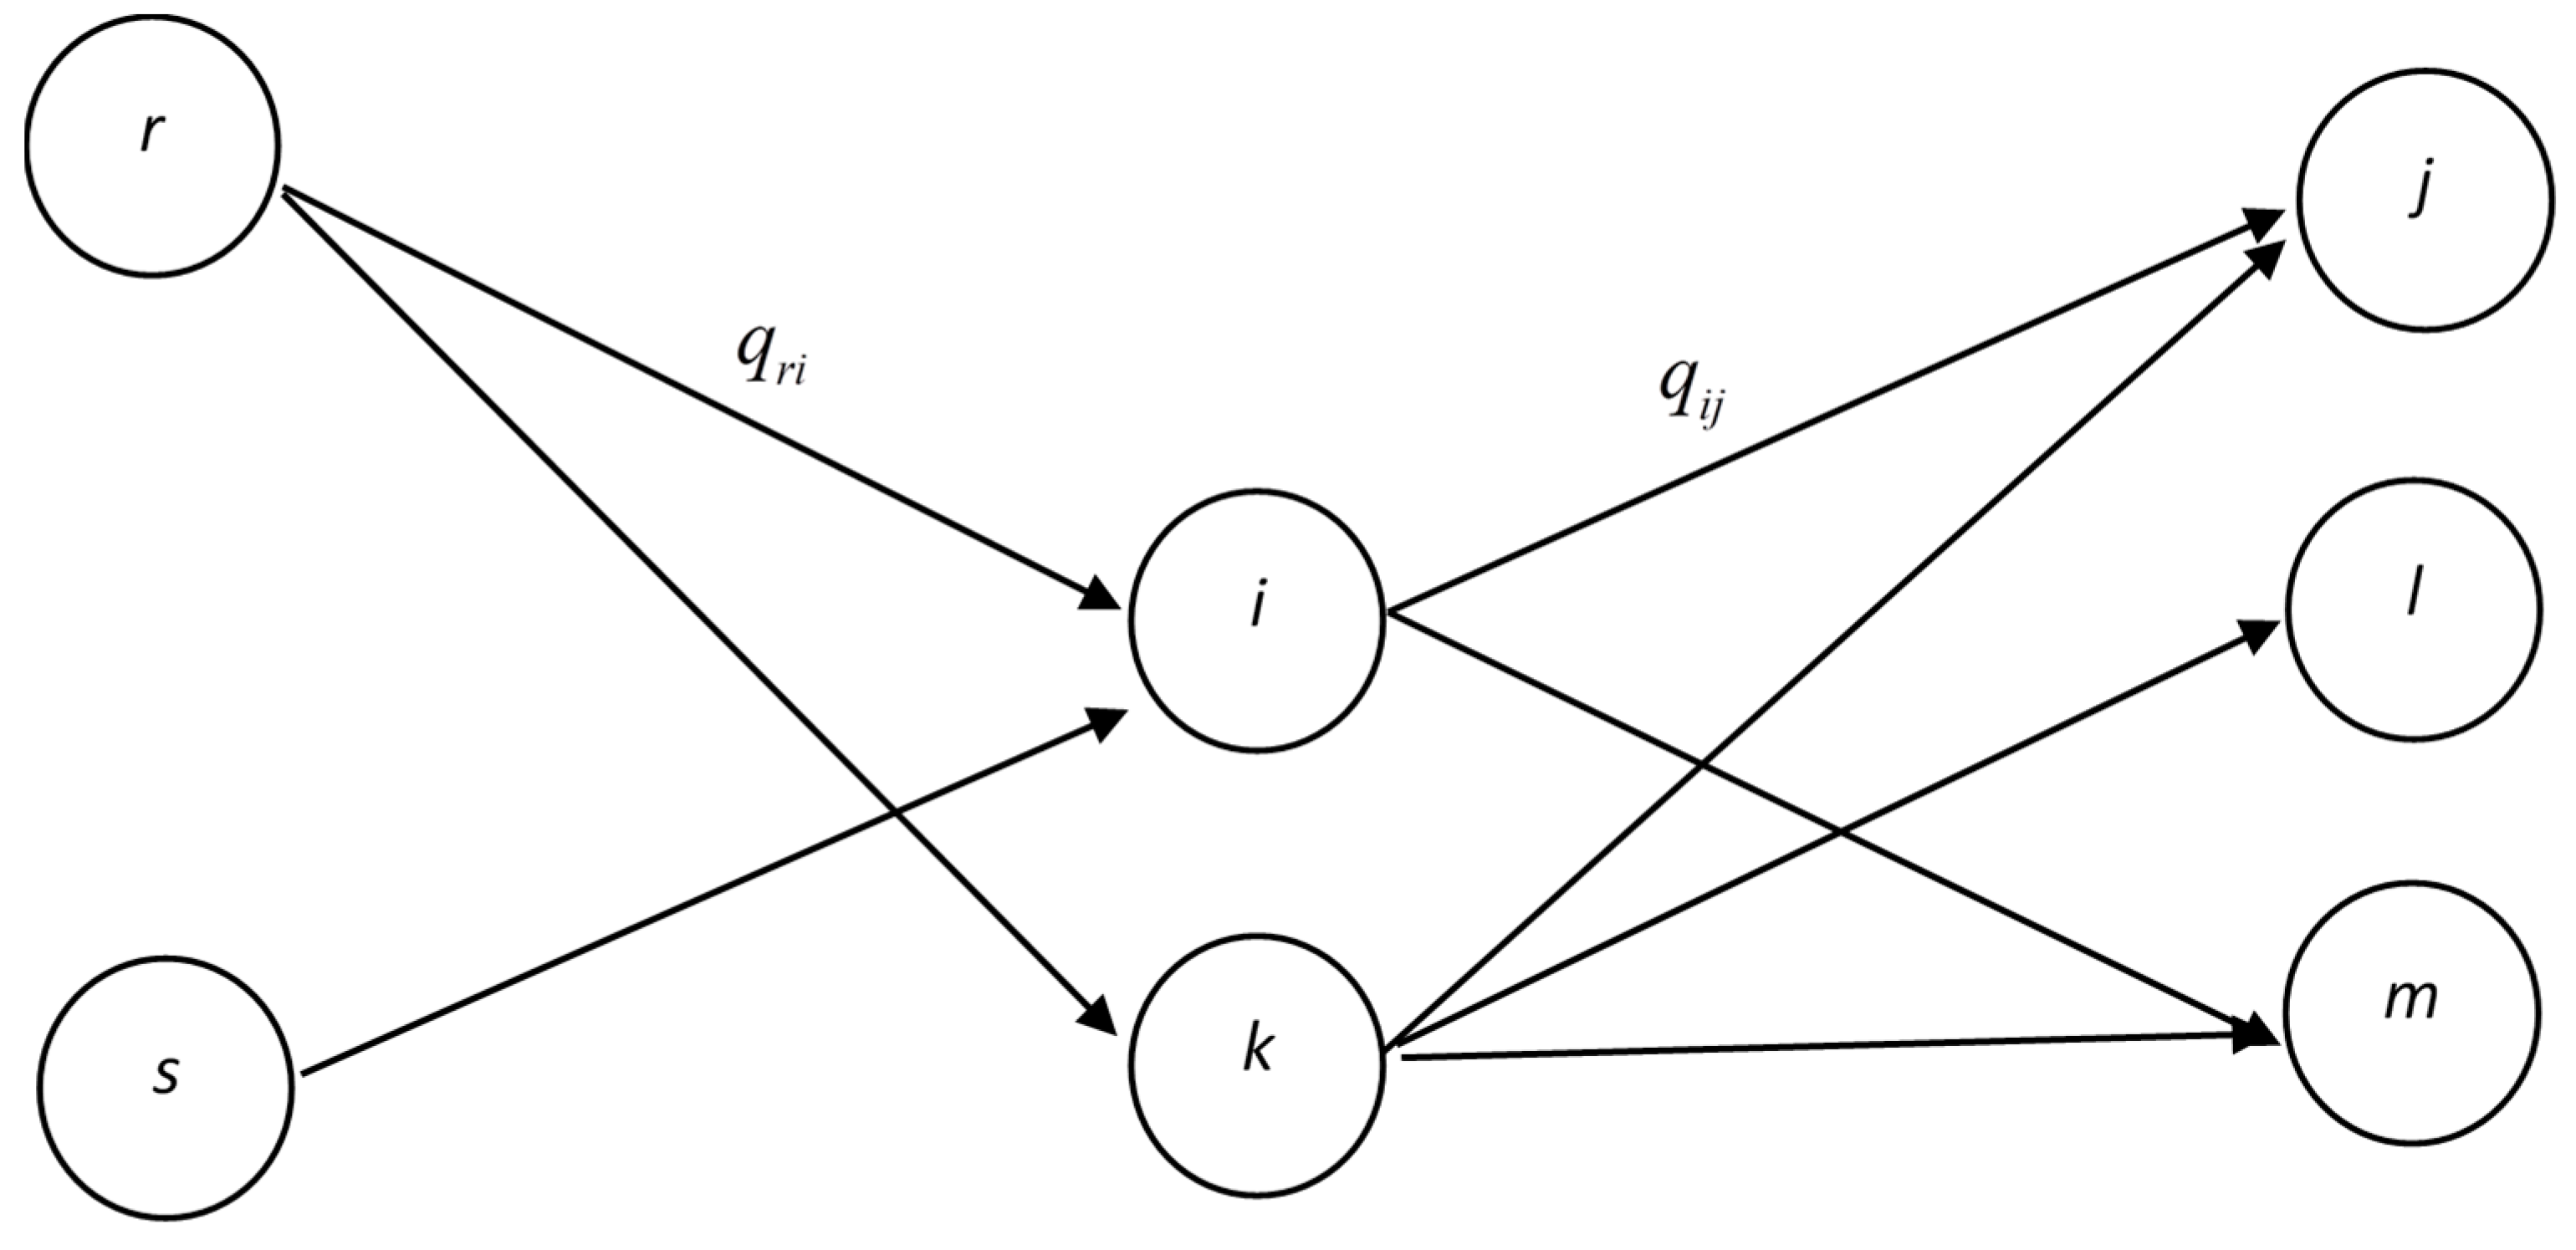
Assume that a network structure is depicted as shown in Figure 2, where the circles denote different vertices, and values qri denote the flows from vertex r to vertex i. We consider the centrality of a vertex in terms of two factors, namely, the amounts of inflow and outflow. In addition, we also define the reference of vertex i, R, as the vertex which link to vertex i (e.g., vertices r and s). For example, in the path from r to i, denoted by ri, vertex r is the reference of vertex i.
The inflow from vertex r to vertex i at time t in this paper can be defined by the following equation:
A ^ r , i i n = I i r p I p , r i , r p , r i
where A ^ j , i i n ( 0 , 1 ] and Ii indicates the input degree (number of inflows) of vertex i. Then, the outflow vertex from vertex i to vertex j at time t can be calculated as follows here:
A ^ i , j o u t = O j p i O p , i j , p i
where A ^ j , i o u t ( 0 , 1 ] and Oi indicates the output degree (number of outflows) of vertex i.
After obtaining the above indices, we can construct the inflow and outflow matrices, respectively, as follows:
A ^ i n = [ A ^ 1 , 1 i n A ^ 1 , 2 i n A ^ 1 , n i n A ^ 2 , 1 i n A ^ 2 , 2 i n A ^ 2 , n i n A ^ n , 1 i n A ^ n , 2 i n A ^ n , n i n ] ;   A ^ o u t = [ A ^ 1 , 1 o u t A ^ 1 , 2 o u t A ^ 1 , n o u t A ^ 2 , 1 o u t A ^ 2 , 2 o u t A ^ 2 , n o u t A ^ n , 1 o u t A ^ n , 2 o u t A ^ n , n o u t ] ,
where we reflect the influence of the feedback flows in the inflow and outflow matrices. We use the following example to demonstrate the indices defined here. This example has six vertices that contain directed and feedback links between vertices, as shown in Figure 3.
The inflow and outflow matrices can be derived, respectively, as follows:
A ^ i n = [ 0.00 0.00 0.29 0.29 0.42 0.00 0.40 0.00 0.00 0.00 0.60 0.00 0.00 0.00 0.00 0.40 0.00 0.60 0.40 0.00 0.00 0.00 0.00 0.60 0.00 0.25 0.00 0.00 0.00 0.75 0.00 0.00 0.40 0.00 0.60 0.00 ] ;   A ^ o u t = [ 0.00 0.50 0.00 0.50 0.00 0.00 0.00 0.00 0.00 0.00 1.00 0.00 0.60 0.00 0.00 0.00 0.00 0.40 0.60 0.00 0.40 0.00 0.00 0.00 0.42 0.29 0.00 0.00 0.00 0.29 0.00 0.00 0.33 0.33 0.33 0.00 ]
Next, if we consider the update process from one status to the next status, this can be represented by a transition function. We propose the final model here as follows:
M ( v i ( t + 1 ) ) = f ( α j = 1 n ( ( γ A ^ j , i i n + ( 1 γ ) A ^ j , i o u t ) M ( v j ( t ) ) ) + 1 α n )
where f(·) is a transition function, e.g., a sigmoid or linear function.
Sigmoid functions, e.g., logistic or hyperbolic-tangent functions, are widely used in many methods, e.g., neural networks and fuzzy cognitive maps, to squash values into a specific range. For example, the logistic function can squash any real number into (0, 1) and the hyperbolic-tangent function can squash a real number into (−1, 1). Sigmoid functions are popular because they can reflect situations of the real world. However, conventional sigmoid functions are not suitable here, since the centrality of a vertex is always positive and falls into the range of [0, 1] instead of a real number. Note that M(vi(t + 1)) in Equation (22) satisfies M(vi(t + 1)) ∈ (0, 1) and i = 1 n M ( v i ( t + 1 ) ) = 1 . Hence, in this paper, we introduce two sigmoid functions, namely, the smoothstep and inverted smoothstep functions, to reflect the s-shape situation of updated centralities and restrict the input range between [0, 1], as shown in Figure 4.
In addition, we also consider the softmax and restricted logistic functions to see the distinct from the linear function. The transition functions used in this paper are summarized in Table 3.
Next, for simplicity, we can let the following be true:
A ¯ j , i = γ A ^ j , i i n + ( 1 γ ) A ^ j , i o u t
Since A ^ j , i i n and A ^ j , i o u t are column stochastic matrices, we can ensure the linear combination of two column stochastic matrices, A ¯ j , i i n , is also a column stochastic matrix. Then, we can rewrite Equation (22) as follows:
M ( v i ( t + 1 ) ) = f ( α j = 1 n A ¯ j , i M ( v i ( t ) ) + 1 α n )
The matrix form is written as follows:
M ( v ) = f ( α A ¯ T M ( v ) + 1 α n 1 )
where we set α = 0.85 as the suggestion of the PageRank algorithm. Note that in large-scale networks, we can first set A ¯ T = softmax ( A ¯ T ) to avoid the convergent problem of the proposed algorithm before processing in Equation (24).
We can highlight the difference between the PageRank and bi-directional influence map (BIM) algorithms as follows. First, the PageRank algorithm considers the importance of a vertex as the all paths from others, i.e., the inflow matrix. However, the BIM algorithm considers the inflow and outflow matrices to balance the influences of both powers. In addition, taking the above graph as example, the inflow matrices of two algorithms ( A D , PageRank algorithm; ( A ^ i n ) T , BIM algorithm) also show distinct differences:
A D = [ 0.000 0.500 0.000 0.500 0.000 0.000 0.000 0.000 0.000 0.000 0.500 0.000 0.333 0.000 0.000 0.000 0.000 0.500 0.333 0.000 0.500 0.000 0.000 0.000 0.333 0.500 0.000 0.000 0.000 0.500 0.000 0.000 0.500 0.500 0.500 0.000 ]
( A ^ i n ) T = [ 0.000 0.400 0.000 0.400 0.000 0.000 0.000 0.000 0.000 0.000 0.250 0.000 0.286 0.000 0.000 0.000 0.000 0.400 0.286 0.000 0.400 0.000 0.000 0.000 0.429 0.600 0.000 0.000 0.000 0.600 0.000 0.000 0.600 0.600 0.750 0.000 ]
Next, we can use the proposed algorithm to handle the example in Figure 3 and rank the vertices with different settings of the parameters, i.e., transition functions and γ, and compare the results with the PageRank algorithm, as shown in Table 4.
The results of Table 5 indicate that the weights between the inflow and outflow matrices play different forces in regard to affecting the importance of a vertex. If we only consider the inflow matrix, the ranking result is similar to that of the PageRank algorithm. By contrast, if only the outflow matrix is used, the ranking result is just the reverse of that of the PageRank algorithm. However, we think both forms of information should be considered to be the centrality of a vertex. In addition, the different functions here show the consistent results and indicates the robustness of the proposed algorithm.
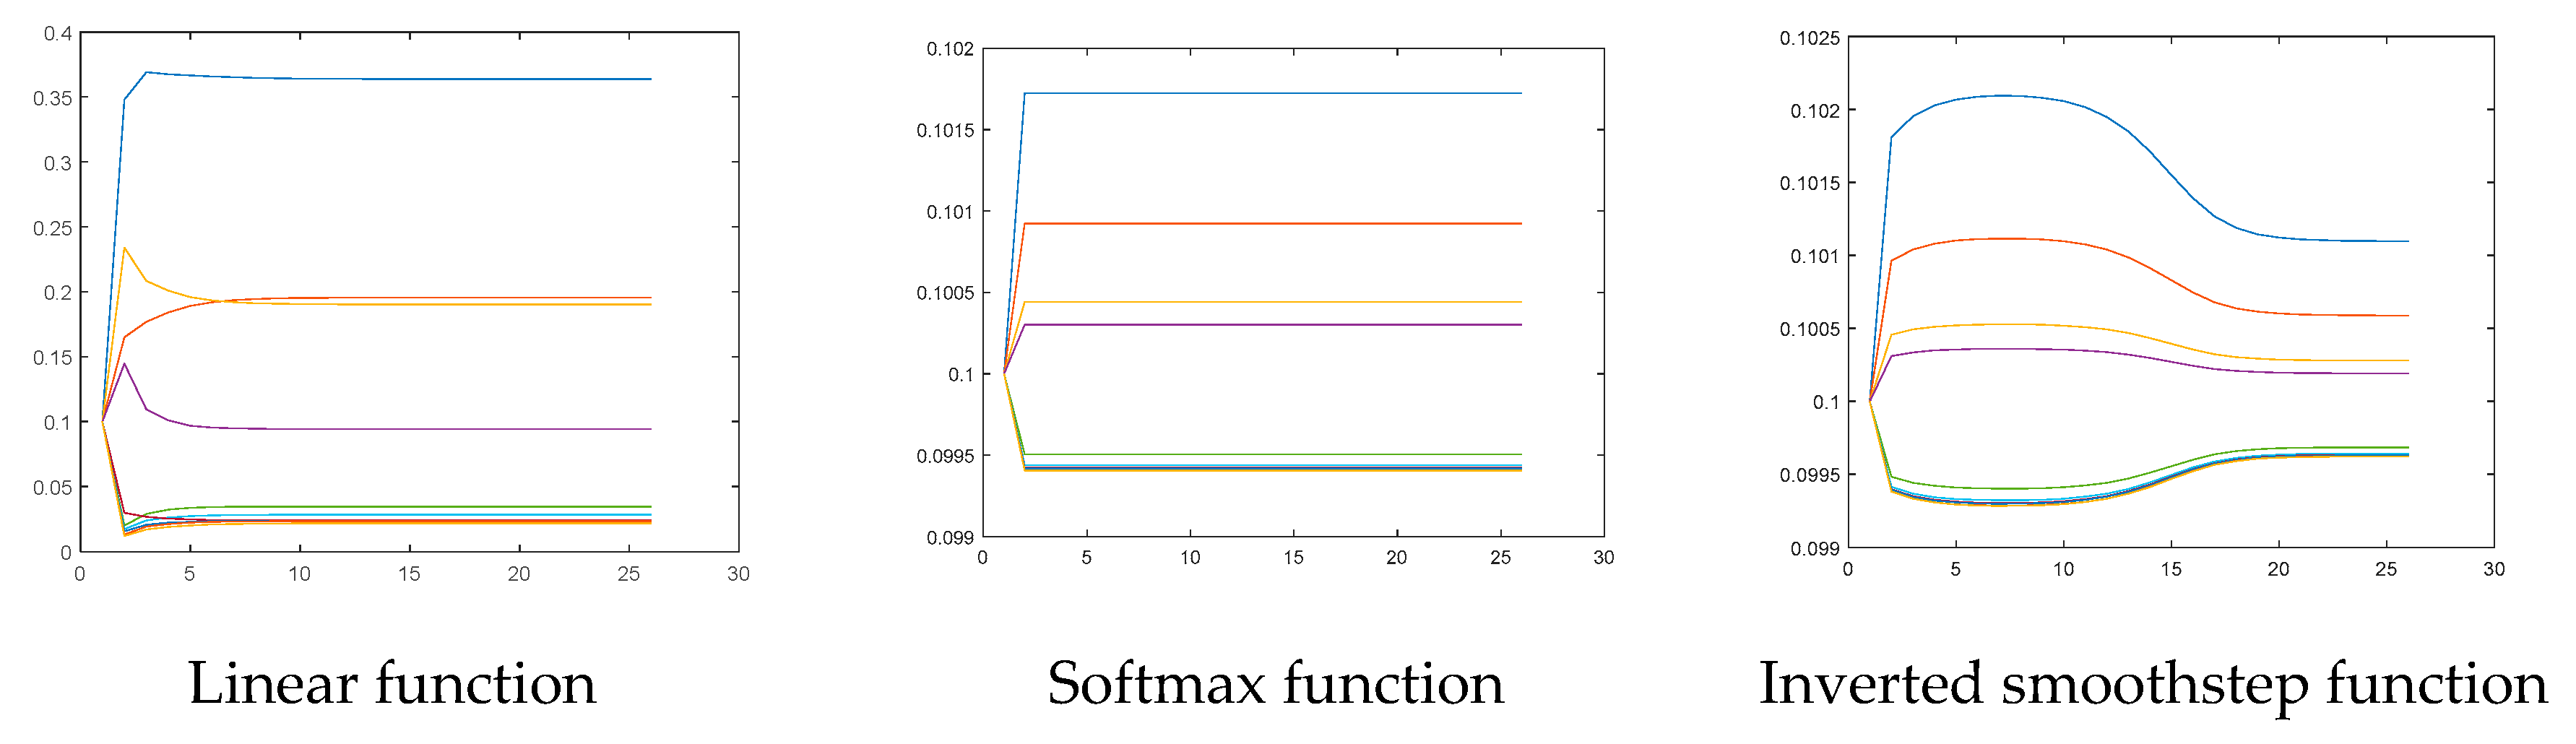
Next, we can examine the transition functions to understand the convergence and influence on the centralities and ranking of vertices. First, the centralities of the vertices in each iteration are normalized to the sum of them as one. Then, we can depict the iterative processes of all transition functions here with γ = 0.5 , as shown in Figure 5.
The convergence status of the proposed model is very quick, no matter which transition functions are considered, and the softmax and inverted smoothstep functions seem to be better choices here because the centralities of the vertices are more significantly different than those of others. By contrast, the restricted sigmoid and smoothstep functions find it hard to clearly separate the centralities. We should highlight that although the linear function also shows an acceptable property, the different transition functions do play an important role to determine the ranking of vertices and might not be the same.

9. Empirical Studies

In the empirical studies detailed below, we prepare two datasets to demonstrate the proposed algorithm and compare the results with the eigenvector centrality and PageRank algorithms.

9.1. Marvel Universe Dataset

The first dataset used here is the Marvel universe character network, which was proposed by Alberich in 2002 to investigate the structure of the collaboration network. Two Marvel characters are considered linked if they join in the same comic book or movie. There are 7219 characters and 574,467 edges with 50 connected components in this graph. We can plot the giant connected component (GCC) to see the main structure of the social network, as shown in Figure 6.
Then, we can depict the degree distribution of the graph to see if the power law relationship of the small world principle is satisfied, as shown in Figure 7.
Figure 7 shows a less significant shape for the power law relationship. Next, we can calculate the descriptive statistics of the network to understand the insight of the network, as shown in Table 5.
To analyze and calculate the centrality of vertices within the network, we first simplified the network to avoid loops and multiple edges and then set different parameters in our algorithm to see the variety of the ranking results. The ranking results of the PageRank algorithm are also presented to show the differences among the algorithms, shown in Table 6.
Next, we can check the convergent status of the centralities derived by the proposed algorithm to understand the robustness of the method. Taking the example of the BIM (softmax, γ = 0.1) model, we can depict the convergent status of the top 5 centralities, as shown in Figure 8.
The above result indicates that the proposed algorithm quickly converges.

9.2. Facebook Dataset

The Facebook dataset demonstrated here was provided by Sharma in Kaggle (https://www.kaggle.com/sheenabatra/facebook-data). The graph contains 4039 nodes and 88,234 edges with an average degree of 43.6910. The task here is to find the top 10 key persons within the social network by the proposed algorithm and compare the results with other conventional algorithms. First, we can depict the social network as shown in Figure 9.
The social network indicates several main subgroups and only one connected component can be identified. Next, we can depict the degree distribution of the graph to see if the graph satisfies the power law principle, as shown in Figure 10. The graph shows a slight shape of the power law principle to justify the dataset, and as such can be viewed as a small-world network.
Then, we can calculate the descriptive statistics of the graph to understand the basic insight of the network, as shown in Table 7.
Here, we select several conventional centralities which are commonly used for directed networks to determine the top 10 key persons within the Facebook social network. Next, we set our algorithm with three different functions, namely, linear, softmax, and smoothstep, and three different values of γ, namely, 1, 0.5, and 0, respectively. We retrieved the top 10 persons and normalized their centralities to see the transition changes of the centralities. Taking the linear, softmax, and inverted smoothstep with γ = 0.5 as examples, we can depict the transition changes of the centralities, as shown in Figure 11.
The result of Figure 11 shows the good convergence of the top 10 centralities. Finally, we can derive the top 10 key persons within the Facebook social network by the popular centrality algorithms which are used for the directed graph and compare the results with the proposed algorithm (i.e., the BIM algorithm), shown in Table 8. Note that in this experiment we only consider the linear, softmax, and inverted smoothstep functions, since they can derive more distinct centralities of the vertices.
Here, we use the BIM models with γ = 0.5 to highlight the advantages of the proposed algorithm and to compare with others. The reason for this is that the model with γ = 0.5 considers both the in-degree and out-degree influences of a vertex, which reflects the differences of the proposed algorithm from others. First, the proposed results of the softmax and smoothstep functions are the same, whereas they are somewhat different than the linear function. Hence, we can conclude that transition functions indeed play an important role to reflect the results and should be further discussed. Second, our algorithm captures the part of the key persons from all different viewpoints. For example, we have shaded the person IDs of the other algorithms which were also captured by the proposed algorithm. It can be seen that our algorithm captures parts of all the other algorithms. Hence, the proposed algorithm can be considered as a synthesized centrality to find key vertices.
We can highlight the insufficiency of PageRank-based algorithms in this Facebook social network. First, we can see that although the social network contains only one component, several significant subgroups can be found. Hence, persons who hold higher centrality usually have some importance influence. However, PageRank cannot reflect this situation. In addition, the key persons found by PageRank only have one common person, i.e., ID 1373, found by the in-degree centrality. Hence, we can view the results of PageRank as another perspective to find key persons rather a synthesized centrality.

10. Discussion

Centrality measures the importance of a vertex within a network and has been applied to various applications, e.g., information diffusion [30], leader roles [31], and psychological network [32]. Nowadays, the technologies of social media link people into a huge network and more companies access social networks of people as an important tool for marketing and diffusion strategies [33,34]. Key person identification within a social network is one of the important issues of a successful social network strategy. Hence, many kinds of centrality have been proposed based on different considerations and theories to measure the importance of a vertex within a social network. However, human sociality usually is complicated and needs more sophisticated algorithms to achieve the above purpose.
Among the various algorithms of centrality, PageRank-based algorithms are the most popular because they can consider the influence from all the paths of vertices to an ego. However, they only consider one kind of influence of an ego, i.e., either an in-flow or out-flow matrix, rather than a comprehensive perspective. In this paper, we propose a novel centrality which accounts for both in-flow and out-flow influence matrices to balance the different influences of an ego. In addition, we extend the transition function from the linear type to a non-linear status, including softmax, restricted sigmoid, smoothstep, and inverted smoothstep functions to consider more complicated situations.
The empirical results show several advantages of the proposed algorithms. First, the proposed algorithm can derive a synthesized centrality which can reflect different perspectives of a key vertex based on the results of the Facebook network. Second, the results of the Marvel universe network are consistent with the results of the PageRank algorithm and the top five key characters are rational, even when considering different parameters. Third, the transition functions show the usefulness and diversity to find key persons within a social network. Finally, the proposed algorithm shows a good property to converge under an acceptable number of iterations.
The limitations of the algorithm can be described as follows. The social networks used in this paper are artificial datasets. Although the results found in the Marvel universe network seem to be reasonable, it is hard to confirm if it is also useful for application to real data. Hence, further research may consider a real and large network to carefully test the proposed algorithm with different parameters. In addition, the proposed algorithm can also be used to compare some new centrality measures, e.g., Rodríguez-Velázquez & Balaban [35].

11. Conclusions

In this paper, we have proposed a new algorithm to calculate the centrality of a vertex based on the in-flow from others and out-flow to others of an ego to obtain a synthesized index. In addition, we also have incorporated non-linear transition functions to account for complicated social relationships. The empirical studies here show that the proposed algorithms are more flexible and comprehensive than others, justifying the usefulness of the proposed algorithm. Besides, the convergence status of the centralities can reflect the robust results of the proposed algorithm.

Author Contributions

Data curation, C.-Y.C.; Methodology, J.-J.H.; Writing—review & editing, C.-Y.C. and J.-J.H. All authors have read and agreed to the published version of the manuscript.

Funding

This research received no external funding.

Conflicts of Interest

The authors declare no conflict of interest.

References

  1. Ahmed, H.M.S. A Proposal Model for Measuring the Impact of Viral Marketing through Social Networks on Purchasing Decision: An Empirical Study. Int. J. Cust. Relatsh. Mark. Manag. (IJCRMM) 2018, 9, 13–33. [Google Scholar] [CrossRef] [Green Version]
  2. Al-Garadi, M.A.; Varathan, K.D.; Ravana, S.D.; Ahmed, E.; Mujtaba, G.; Khan, M.U.S.; Khan, S.U. Analysis of online social network connections for identification of influential users: Survey and open research issues. ACM Comput. Surv. (CSUR) 2018, 51, 1–37. [Google Scholar] [CrossRef]
  3. Alkemade, F.; Castaldi, C. Strategies for the diffusion of innovations on social networks. Comput. Econ. 2005, 25, 3–23. [Google Scholar] [CrossRef]
  4. Axelord, R. Structure of Decision: The Cognitive Maps of Political Elites; Princeton University Press: Princeton, NJ, USA, 1976. [Google Scholar]
  5. Bar-Yossef, Z.; Mashiach, L.T. Local Approximation of Pagerank and Reverse Pagerank. In Proceedings of the 17th ACM Conference on Information and Knowledge Management, Napa Valley, CA, USA, 26–30 October 2008. [Google Scholar]
  6. Beauchamp, M.A. An improved index of centrality. Behav. Sci. 1965, 10, 161–163. [Google Scholar] [CrossRef]
  7. Bringmann, L.F.; Elmer, T.; Epskamp, S.; Krause, R.W.; Schoch, D.; Wichers, M.; Wigman, J.T.; Snippe, E. What do centrality measures measure in psychological networks? J. Abnorm. Psychol. 2019, 128, 892. [Google Scholar] [CrossRef] [Green Version]
  8. Catanese, S.; De Meo, P.; Ferrara, E.; Fiumara, G.; Provetti, A. Extraction and analysis of facebook friendship relations. In Computational Social Networks; Springer: London, UK, 2012; pp. 291–324. [Google Scholar]
  9. Cha, M.; Benevenuto, F.; Haddadi, H.; Gummadi, K. The world of connections and information flow in twitter. IEEE Trans. Syst. Man Cybern. Part A Syst. Hum. 2012, 42, 991–998. [Google Scholar]
  10. Cha, M.; Haddadi, H.; Benevenuto, F.; Gummadi, K.P. Measuring user influence in twitter: The million follower fallacy. In Proceedings of the Fourth International AAAI Conference on Weblogs and Social Media, Washington, DC, USA, 23–26 May 2010. [Google Scholar]
  11. Ding, C.; Chen, Y.; Fu, X. Crowd crawling: Towards collaborative data collection for large-scale online social networks. In Proceedings of the First ACM Conference on Online Social Networks, Boston, MA, USA, 7–8 October 2013; pp. 183–188. [Google Scholar]
  12. Easley, D.; Kleinberg, J. Networks, Crowds, and Markets; Cambridge University Press: Cambridge, UK, 2010. [Google Scholar]
  13. Fogaras, D. Where to start browsing the web? In International Workshop on Innovative Internet Community Systems; Springer: Berlin/Heidelberg, Germany, 2003; pp. 65–79. [Google Scholar]
  14. Gyongyi, Z.; Garcia-Molina, H.; Pedersen, J. Combating web spam with trustrank. In Proceedings of the 30th International Conference on Very Large Data Bases (VLDB), Toronto, ON, Canada, 31 August–3 September 2004. [Google Scholar]
  15. Jabeur, L.B.; Tamine, L.; Boughanem, M. Active microbloggers: Identifying influencers, leaders and discussers in microblogging networks. In International Symposium on String Processing and Information Retrieval; Springer: Berlin/Heidelberg, Germany, 2012; pp. 111–117. [Google Scholar]
  16. Jiang, J.; Wilson, C.; Wang, X.; Sha, W.; Huang, P.; Dai, Y.; Zhao, B.Y. Understanding latent interactions in online social networks. ACM Trans. Web (TWEB) 2013, 7, 1–39. [Google Scholar] [CrossRef]
  17. Katz, L. A new status index derived from sociometric analysis. Psychometrika 1953, 18, 39–43. [Google Scholar] [CrossRef]
  18. Keener, J.P. The Perron–Frobenius theorem and the ranking of football teams. SIAM Rev. 1993, 35, 80–93. [Google Scholar] [CrossRef]
  19. Kempe, D.; Kleinberg, J.; Tardos, É. Maximizing the spread of influence through a social network. In Proceedings of the Ninth ACM SIGKDD International Conference on Knowledge Discovery and Data Mining, Washington, DC, USA, 24–27 August 2003; pp. 137–146. [Google Scholar]
  20. Kim, E.S.; Han, S.S. An analytical way to find influencers on social networks and validate their effects in disseminating social games. In Proceedings of the 2009 International Conference on Advances in Social Network Analysis and Mining, Athens, Greece, 20–22 July 2009; IEEE: Piscataway, NJ, USA, 2009; pp. 41–46. [Google Scholar]
  21. Kleinberg, J.M. Authoritative sources in a hyperlinked environment. In Proceedings of the Ninth Annual ACM-SIAM Symposium on Discrete Algorithms, San Francisco, CA, USA, 25–27 January 1998; pp. 668–677. [Google Scholar]
  22. Chakrabarti, S.; Dom, B.; Raghavan, P.; Rajagopalan, S.; Gibson, D.; Kleinberg, J. Automatic resource compilation by analyzing hyperlink structure and associated text. Comput. Netw. ISDN Syst. 1998, 30, 65–74. [Google Scholar] [CrossRef] [Green Version]
  23. Kosko, B. Fuzzy cognitive maps. Int. J. Man Mach. Studies 1986, 24, 65–75. [Google Scholar] [CrossRef]
  24. Kwok, N.; Hanig, S.; Brown, D.J.; Shen, W. How leader role identity influences the process of leader emergence: A social network analysis. Leadersh. Q. 2018, 29, 648–662. [Google Scholar] [CrossRef] [Green Version]
  25. Mislove, A.; Marcon, M.; Gummadi, K.P.; Druschel, P.; Bhattacharjee, B. Measurement and analysis of online social networks. In Proceedings of the 7th ACM SIGCOMM Conference on Internet Measurement, San Diego, CA, USA, 24–26 October 2007; pp. 29–42. [Google Scholar]
  26. Nieminen, J. On the centrality in a graph. Scand. J. Psychol. 1974, 15, 332–336. [Google Scholar] [CrossRef] [PubMed]
  27. Page, L.; Brin, S.; Motwani, R.; Winograd, T. The Pagerank Citation Ranking: Bringing Order to the Web; Stanford InfoLab: Stanford, CA, USA, 1999. [Google Scholar]
  28. Pei, S.; Muchnik, L.; Andrade, J.S., Jr.; Zheng, Z.; Makse, H.A. Searching for superspreaders of information in real-world social media. Sci. Rep. 2014, 4, 5547. [Google Scholar] [CrossRef] [PubMed] [Green Version]
  29. Saito, K.; Kimura, M.; Ohara, K.; Motoda, H. Super mediator–A new centrality measure of node importance for information diffusion over social network. Inf. Sci. 2016, 329, 985–1000. [Google Scholar] [CrossRef] [Green Version]
  30. Shelton, R.C.; Lee, M.; Brotzman, L.E.; Crookes, D.M.; Jandorf, L.; Erwin, D.; Gage-Bouchard, E.A. Use of social network analysis in the development, dissemination, implementation, and sustainability of health behavior interventions for adults: A systematic review. Soc. Sci. Med. 2019, 220, 81–101. [Google Scholar] [CrossRef] [PubMed]
  31. Silva, A.; Guimarães, S.; Meira, W., Jr.; Zaki, M. ProfileRank: Finding relevant content and influential users based on information diffusion. In Proceedings of the 7th Workshop on Social Network Mining and Analysis, Chicago, IL, USA, 11 August 2013; pp. 1–9. [Google Scholar]
  32. Stylios, C.D.; Groumpos, P.P. Mathematical formulation of fuzzy cognitive maps. In Proceedings of the 7th Mediterranean Conference on Control and Automation, Akko, Israel, 1–4 July 2019; pp. 2251–2261. [Google Scholar]
  33. Tunkelang, D. TunkRank: A Twitter Analog to PageRank. 2009. Available online: http.thenoisychannel.com/2009/01/13/atwitter-analog-to-pagerank (accessed on 20 September 2020).
  34. Weng, J.; Lim, E.P.; Jiang, J.; He, Q. Twitterrank: Finding topic-sensitive influential twitterers. In Proceedings of the Third ACM International Conference on Web Search and Data Mining, New York, NY, USA, 3–6 February 2010; pp. 261–270. [Google Scholar]
  35. Rodríguez-Velázquez, J.A.; Balaban, A.T. Two new topological indices based on graph adjacency matrix eigenvalues and eigenvectors. J. Math. Chem. 2019, 57, 1053–1074. [Google Scholar] [CrossRef] [Green Version]
Figure 1. Example of a fuzzy cognitive map (FCM).
Symmetry 12 01747 g001
Figure 2. An example network to illustrate the concept of the centrality of a vertex.
Symmetry 12 01747 g002
Figure 3. A network structure.
Symmetry 12 01747 g003
Figure 4. Smoothstep and inverted smoothstep functions.
Symmetry 12 01747 g004
Figure 5. Comparison between different functions.
Symmetry 12 01747 g005
Figure 6. Network relationship of Marvel universe heroes.
Symmetry 12 01747 g006
Figure 7. Degree distribution of the Marvel universe social network.
Symmetry 12 01747 g007
Figure 8. Convergent status of the top five centralities of the Marvel universe heroes.
Symmetry 12 01747 g008
Figure 9. Graph of the Facebook social network.
Symmetry 12 01747 g009
Figure 10. Degree distribution of the Facebook dataset.
Symmetry 12 01747 g010
Figure 11. Transition changes of the centralities.
Symmetry 12 01747 g011
Table 1. Influence matrix of the concepts.
Influence MatrixC1C2C3C4C5
C1±0.3±0.50±0.4±0.1
C20±0.2±0.60±0.5
C30±0.300±0.2
C40±0.4±0.70±0.7
C5000±0.30
Table 2. The influences and ranks of the concepts.
Equilibrium InfluenceC1C2C3C4C5
All Positive Influence0.71770.88040.87660.7940.8945
Rank52341
All Negative Influence0.60420.42070.45580.5440.42
Rank14325
Table 3. Transition functions and mathematical equations.
Transition FunctionMathematical Equation
Linear f ( x ) = x
Softmax f ( x i ) = e x i j = 1 n e x j , i = 1 , , n
Restricted logistic f ( x ) = 1 1 + e 10 ( x 0.5 )
Smoothstep f ( x ) = ( 3 2 x ) x 2
Inverted smoothstep f ( x ) = x ( 2 x 2 3 x + 2 )
Table 4. Centrality comparisons between different algorithms in the toy example. BIM: Bi-directional influence map.
CentralityABCDEF
PageRank0.13040.11610.16490.13210.21420.2423
Rank563421
BIM (linear, γ = 1)0.08580.08040.15470.09840.26050.3202
Rank563421
BIM (linear, γ = 0)0.23690.17580.11050.15760.20640.1127
Rank136425
BIM (linear, γ = 0.5)0.17780.11270.13710.13810.21930.2150
Rank365412
BIM (softmax, γ = 0.5)0.17090.15600.16010.16110.17760.1742
Rank365412
BIM (restricted, γ = 0.5)0.16920.16060.16300.16360.17280.1708
Rank365412
BIM (smoothstep, γ = 0.5)0.17080.15650.16050.16150.17690.1738
Rank365412
BIM (inverted, γ = 0.5)0.17950.12850.14830.15160.19810.1940
Rank365412
Table 5. Descriptive statistics of the Marvel universe social network.
Statistics of the NetworkValue
Average number of neighbors37.333
Network diameter8
Characteristic path length2.937
Clustering coefficient0.400
Network density0.003
Multi-edge node pairs64,216
Number of self-loops2232
Table 6. Top 5 key persons in the Marvel universe social network.
Top 5 Key Persons1st Place2nd Place3rd Place4th Place5th Place
PageRankSpider ManCaptain AmericaIron ManWolverineThor
BIM (linear, γ = 0.5)Spider ManCaptain AmericaIron ManWolverineThing
BIM (softmax, γ = 0.5)Spider ManCaptain AmericaIron ManWolverineThing
BIM (restricted, γ = 0.5)Spider ManCaptain AmericaIron ManWolverineThing
BIM (smoothstep, γ = 0.5)Spider ManCaptain AmericaIron ManWolverineThing
BIM (inverted, γ = 0.5)Spider ManCaptain AmericaIron ManWolverineThing
BIM (linear, γ = 0.1Spider ManIron ManWolverineThingScarlet Witch
BIM (softmax, γ = 0.1Spider ManIron ManWolverineThingScarlet Witch
BIM (restricted, γ = 0.1Spider ManIron ManWolverineThingScarlet Witch
BIM (smoothstep, γ = 0.1Spider ManIron ManWolverineThingScarlet Witch
BIM (inverted, γ = 0.1Spider ManIron ManWolverineThingScarlet Witch
Table 7. Descriptive statistics of the Facebook network.
Statistics of the NetworkValue
Average number of neighbors43.691
Network diameter17
Characteristic path length4.368
Clustering coefficient0.303
Network density0.005
Multi-edge node pairs0
Number of self-loops0
Table 8. Top 10 key persons in the Facebook social network.
Centrality1st2nd3rd4th5th6th7th8th9th10th
Out-degree10735135218210348212629953662944
In-degree1373149012853445131212153443131834393441
Betweenness3513521203371891114257217101821119
Out-closeness100758034835035936215393661573
In-closeness2173150314971501149014951504149622322168
Hubs352300229952944299329622964305829763044
Authorities3441344534313443343834073456343934573429
PageRank1396293334781387137315031392397534771395
BIM (linear, γ = 1)1373149012851312344513181215125313201289
BIM (softmax, γ = 1)1373149012851312344512151318125313201289
BIM (inverted, γ = 1)1373149012851312344512151318125313201289
BIM (linear, γ = 0.5)107352351182113731490348128521263445
BIM (softmax, γ = 0.5)1073513521821348137336614901285349
BIM (inverted, γ = 0.5)1073513521821348137336614901285349
BIM (linear, γ = 0)107352351182134810632944212629622964
BIM (softmax, γ = 0)1073513521821348366349212621301
BIM (inverted, γ = 0)1073513521821348366349212621301
Publisher’s Note: MDPI stays neutral with regard to jurisdictional claims in published maps and institutional affiliations.

