Article

User Behavior on Online Social Networks: Relationships among Social Activities and Satisfaction

by
Daniel Mican
,
Dan-Andrei Sitar-Tăut
* and
Ioana-Sorina Mihuţ
Faculty of Economics and Business Administration, Babeş-Bolyai University, 400591 Cluj-Napoca, Romania
*
Author to whom correspondence should be addressed.
Symmetry 2020, 12(10), 1656; https://doi.org/10.3390/sym12101656
Submission received: 8 September 2020 / Revised: 2 October 2020 / Accepted: 2 October 2020 / Published: 10 October 2020
(This article belongs to the Special Issue Recent Advances in Social Data and Artificial Intelligence 2019)

Abstract

:
Social networking sites (SNSs) are now ubiquitous communities for constant online interpersonal interactions that trigger symmetric or asymmetric effects on our everyday life. Recent studies advocate in favor of the significant role that SNSs have in promoting well-being and, more importantly, in disseminating reliable information during a global crisis, such as the current COVID-19 pandemic. Based on the growing importance of SNSs to the global framework, the main purpose of this study is to empirically assess the link between the use of symmetric social networks such as Facebook, or asymmetric social networks, like Instagram, and the level of satisfaction, employing the methodology of structural equation modeling. The results of the research validate the hypothesis that SNS activities increase the level of satisfaction, and therefore, that there is a direct link between the number of posts and comments and the level of satisfaction. Furthermore, based on the reversible and significant link between the level of satisfaction and the importance attributed to SNSs, the main conclusion of the study is that the higher the importance of the SNS, the greater the level of dissatisfaction experienced by users. Also, public activities on social networks positively affect social network satisfaction, while private activities have a direct negative relationship with the importance of social networks.

1. Introduction

Currently, economies around the world are being challenged by massive asymmetric shocks generated by the COVID-19 outbreak, even though its symmetric character is well recognized in the literature in the field [1]. Due to the high degree of existing interdependencies between countries, mediated through the flow of goods, services, technologies, people, and ideas, the negative effects of this critical public health emergency have spread at an unimaginable speed. The responses of various countries have been aligned with a multitude of information disseminated by institutions and governments, using both traditional methods of communication, as well as the new, revolutionary channel of social networks. Previous articles in this area have recognized the powerful role social media plays in sharing and obtaining information, especially during the COVID-19 pandemic [2]. Moreover, social networking sites (SNSs) have become extremely popular, not only during critical global situations but also more broadly, due to their general communication features that allow both online interpersonal interactions to occur, as well as providing the opportunity to engage in conversations with people who share the same interests. Many scientists from the fields of sociology, communication, informatics, and so on have been focused on online social network research [3]. In recent years, SNSs have expanded from computer sites to smart-phone applications, beginning to exert an even more profound influence on the social lives and economic activities of many people [4]. The use of social networking sites has seen a significant increase, both among adolescents and adults. As indicated by Lenhart et al. [5], 73% of American teenagers use social networks, with an upward trend from year to year. According to Ilakkuvan et al. [6], young people spend an average of three hours per day on SNSs. There are several advantages to using social networks; most notably, the opportunity to share information with a large audience at a low cost [7]. Also, especially when it comes to the young generation, there is a strong need for acceptance and a powerful desire to be considered valuable and worthy by other members of the community; these urges can be satisfied through the use of SNSs [8].
With the rapid development of information networking technology, social networks such as Facebook, Twitter, and YouTube have emerged as an alternative to the traditional, face-to-face communication, especially in the case of young individuals, enriching and broadening people’s social activities. Since the popularity of social networks is reaching a peak [9], the theories developed around this topic are becoming more and more complex [10]. Using matrix theory in social network analysis, Paul and Friginal [11] established a dichotomy concerning the two most widely used online platforms, namely Facebook and Twitter, i.e., considering Facebook as a symmetric social network and Twitter as an asymmetric one. This view was shared by the study of Conejero et al. [12], who consider Facebook and LinkedIn as symmetric social networks and Instagram and Twitter as asymmetric ones.
SNSs permit users to connect to each other by creating profiles through which they can provide a variety of personal information. Personal profiles can include a series of information and information types, including photos or videos. According to Kaplan and Haenlein [13], “the higher the social presence, the larger the social influence that the communication partners have on each other’s behavior”. Moreover, many organizations use SNSs to build communities for professional collaborations to share knowledge and learning materials among their employees [14]. SNSs represent nowadays a new innovative trend [13] whose framework is characterized by complexity, continuous transformation, and adjustment to world dynamics.
Understanding the components of the architecture of this system requires panoramic introspection. The “social” aspect invokes its existence in a social space that can be used for individual, professional, and/or entertainment purposes, and can be linked to the level of satisfaction an individual may experience. Furthermore, social networks have allowed users to be permanently connected, engage in content creation, or be updated with the most relevant information, without having to take a closer look at them. According to Kaplan and Haenlein [13], there are two key elements that social media embodies, namely, self-presentation and self-disclosure. The concept of self-presentation states that regardless of the type of social interaction, people manifest the tendency to seek to control the impressions others develop about them. In a study elaborated by Schlosser [15], it was acknowledged that to manage others’ perception about themselves, individuals often present an edited version of their life on social media, that might, contrary to their expectations, reduce the level of enjoyment they actually experience in their daily life. This action is triggered by the desire to create an image that is consistent with personal identity. Usually, such a presentation is by self-disclosure, namely, the conscious or unconscious disclosure of personal information (for example, thoughts, feelings, pleasures, and dislikes). Self-disclosure is consistent with the image of themselves that people want to present and is an essential step in the development of close relationships.
In light of the increasing impact that social networking sites are having on our lives, especially among young people, it is important to acknowledge the fact that SNSs make a valuable contribution in shaping individuals’ beliefs and to the construction of self-identity [16]. Taking these points into consideration, the main objective of the current study was to investigate the relationships among user online activities (looking at what friends have posted, posting different things, commenting on other users’ photos or posts, receiving updates, chatting with others), usage intensity (number of friends or hours spent on SNSs) on specific social networks (Facebook, Instagram, Twitter, LinkedIn, and YouTube), importance, and level of satisfaction. First, the study extensively investigates all possible lower-level associations among items (correlation analysis). Second, several conceptual links among compound factors (constructs) are examined via SEM analysis. Even though the influence of social media on individuals’ behavior has captured the attention of researchers for many years [17], the novelty of the current study consists of its developing a relational model for a better assessment of users’ social activities and their influence on the level of satisfaction users experience with SNSs.
The conceptual model includes constructs that reflect private activities on social networks, public activities on social networks, and the perceived importance of various social network sites. To our knowledge, this model has not been previously examined by other researchers in this respect. All correlations were studied both from professional (e.g., job/internship searching, or looking for instructive videos) and personal points of view (chatting, connecting with other people that share the same interests). Moreover, a relational model was developed to assess user social activities and their influence on the level of satisfaction experienced by SNS users.
The remainder of the paper is structured as follows: Section 2 offers a comprehensive presentation of the related literature in the field; Section 3 details the research methodology, providing a short description of the survey framework and research model, and continuing with the elaborated hypotheses, as well as describing the data collection and measurement process. Section 4 presents the data analysis and results, while Section 5 comprises a discussion and notes the main limitations of the present study. The final part of the paper presents the main conclusions.

2. Literature Review

According to the definition elaborated by Boyd and Ellison [18], social networking sites are web-based services where individuals may create different public or semipublic profiles in order to find and interact with other users. Since SNSs emerged, numerous studies have been published to provide a more in-depth understanding of user behavior. The research conducted by Shane-Simpson et al. [19] examined the social network framework by exploring questions such as who is attracted to social media sites, why they prefer a given site, and what are the social consequences of each site preference. After analyzing data collected from 663 students, Instagram was found to be the most frequently used platform among students, especially women. It was also found that most participants who preferred Twitter had both a public profile and a private one, and reported higher levels of self-disclosure. Participants who favor Facebook reported lower levels of self-disclosure, but a higher level of social ties.
Uses and gratifications theory (UGT) was put forward by Phua et al. [20], and the main SNS platforms like Facebook, Twitter, Instagram, and Snapchat were examined. The influence of several variables on the relationship between frequent use of each SNS and the bonding of social capital was analyzed. It was found that Twitter users had the largest bridging social capital, followed by Instagram, Facebook, and Snapchat users, while Snapchat users had the largest social-equity bonding, followed by Facebook, Instagram, and Twitter users. The effects of engaging in different SNS activities (broadcasting activities, directed communication including private messaging, commenting) by older users, compared to younger adults, were studied in an article by Kim and Shen [21]. The authors found that compared to younger adults, older adults benefit less from having a large network and more from engaging in directed communication activities.
Although the literature in the field describes a multitude of advantages associated with the use of social networking sites, some studies also emphasize the negative aspects these platforms may embody. SNSs are seen—especially by adolescents—as a universal solution for the vast majority of dilemmas. They are a continuous source of enjoyment, entertainment, social support, and well-being, even while humanity is facing a severe global health emergency threat, like the COVID-19 outbreak [22]. Moreover, it is important to note that SNSs give rise to negative behaviors. Paradoxically, SNSs are considered the point of origin for a wide variety of disorders like anxiety, loneliness, depression [23], and anger [24]. Therefore, there seems to be a growing number of social networking users who feel overwhelmed by the use of social networks [4], and it was found that social interaction overload and intrusion into work and private life were significant contributors to technology stress. Consequently, using a group of 180 college students, the study of Tafesse [25] confirmed the hypothesis according to which the use of social networking sites negatively affects students’ performance. Also, the perceived satisfaction with SNSs and technostress have been found to have a significant positive impact on rational use. The relationship between consumer socialization within SNSs, the consumer’s need for uniqueness, and consumer satisfaction was examined by Abosag et al. [26]. Their findings showed that satisfaction with SNSs is enhanced by friend liking and is undermined by the need among users for uniqueness.
The dynamics of employee behavior and motives for using a variety of social media platforms, for personal and professional reasons, were explored by Lee [27]. The results demonstrated that employee communicative behaviors on social networking are unique, i.e., individual, interpersonal, and organizational-level factors collectively and jointly affect employees’ positive and negative intentions. Also, social interaction overload negatively impacts performance perception, and the intrusion of private life affects performance and happiness. More and more studies similar to that of Moqbel and Kock [28] reveal that the degree of SNS dependence is growing and that this may have consequences on personal and work environments. SNS dependence reduces positive emotions that enhance performance and improve health. Also, it stimulates distraction, which is a performance inhibitor.
The relationship between social media and employee innovation via the mediation of organizational learning and knowledge sharing was studied by Khan and Khan [29]. Their results provided insights by demonstrating that knowledge sharing and social media can help facilitate employee innovation in the public sector.

3. Research Methodology

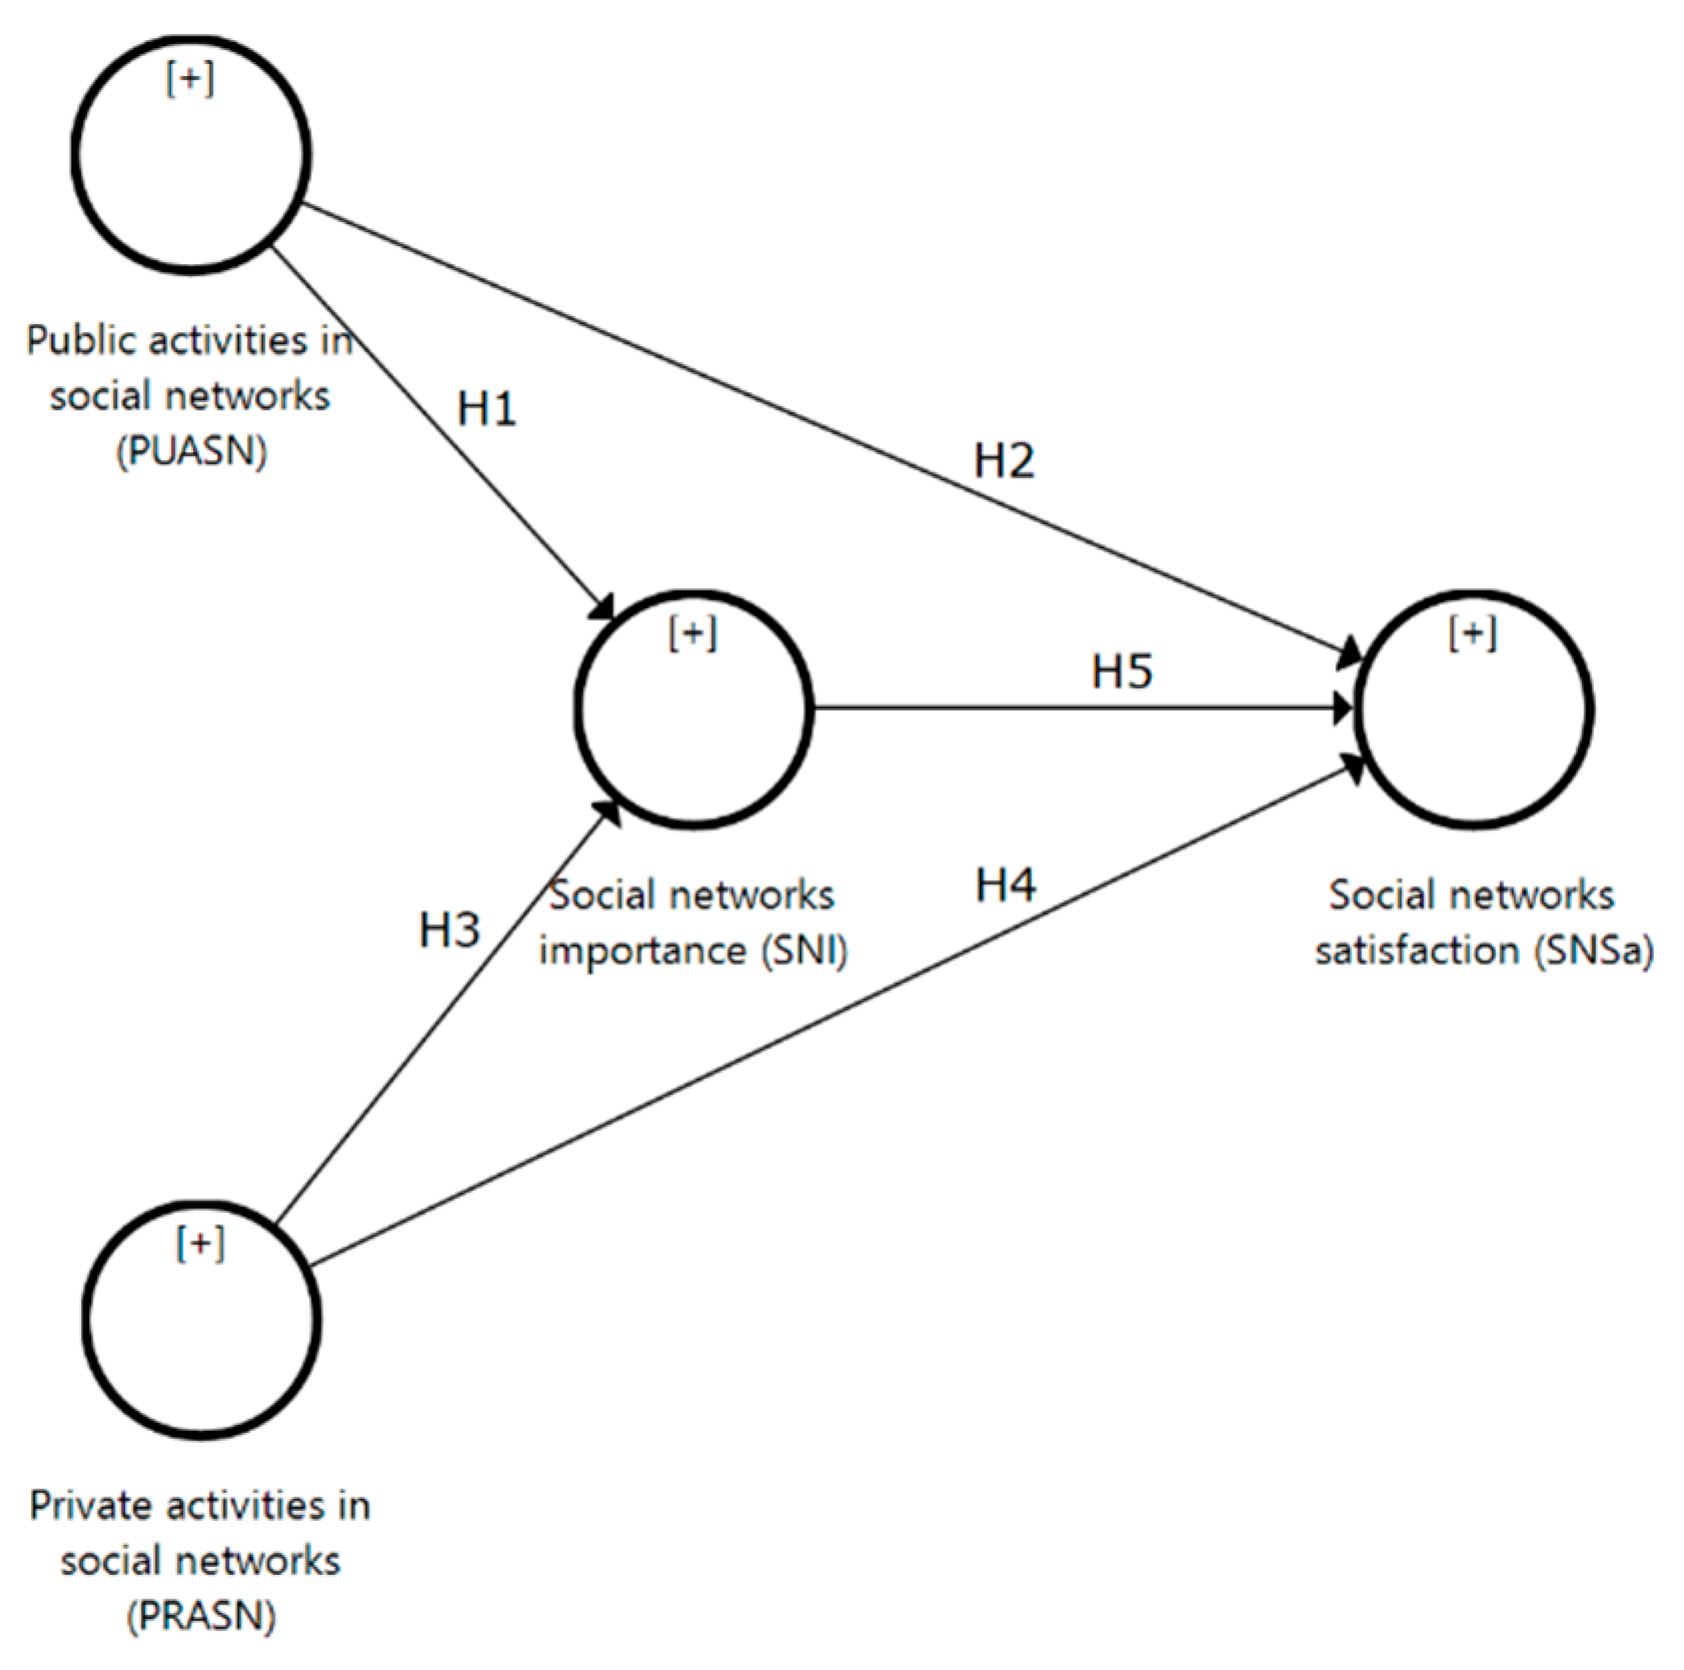
3.1. Research Model and Hypotheses Development

The research methodology applied in this paper is based on exploratory studies, with primary and secondary research being anchored on data collected through questionnaires, a literature review, and on specific statistical analyses and tests. The study investigates different aspects, e.g., how individuals are using SNSs for professional purposes vs. personal reasons. For each category, some examples were provided in the introduction section. Moreover, the correlations between the number of friends, hours spent, SNS usage and the level of satisfaction, importance, and SNS activities are assessed. Also, a relational model that evaluates social behavior, the impact of SNS activities on SNS importance and the level of satisfaction, is developed. A graphical representation of the model is illustrated in Figure 1. The logical assumption that drives the research hypotheses is that user activities on social networks influence the importance of, and satisfaction with, social networks. The popularity of SNSs and their use have increased in recent years, especially among young people [5]. Engagement with SNSs provides satisfaction, social support, and increased perceived importance [30]; however, exaggerated behavior in this direction or a selfish attitude [31] regarding peers (i.e., using chat instead of broadcasting opinions or just looking for “like” updates, having poor reactions or no reactions at all) may have the opposite effect on satisfaction [28] and can lead to negative mental outcomes [4,23,24]. Based on these considerations and an intensive literature review, the following hypotheses are put forward:
Hypothesis 1(H1). 
Private activities on social networks (PRASN) positively impact the importance of the social network (SNI).
Hypothesis 2(H2). 
Public activities on social networks (PUASN) have a positive influence on the importance of social networks (SNI).
Hypothesis 3(H3). 
Private activities on social networks (PRASN) are correlated inversely with satisfaction with social networks (SNSa).
Hypothesis 4(H4). 
Public activities on social networks (PUASN) have a negative influence on satisfaction with social networks (SNSa).
Hypothesis 5(H5). 
The importance of social networks (SNI) alters the degree of perceived satisfaction with social networks (SNSa).
Private activities on social networks (PRASN) largely comprise two items (e.g., “I spend a lot of time receiving updates from liked pages”). Public activities on social networks (PUASN) were measured using three items (e.g., “I spend a lot of time commenting on other users’ posts”). Perceived social networks importance (SNI) was measured using two items, taking into consideration professional and personal life (e.g., “Social networks are important for my professional life”). The overall perceived satisfaction with social networks (SNSa) was measured using two items, taking professional and personal life (e.g., “Social networks bring professional satisfaction”) into consideration. The constructs used in the model, as well as the used items, are detailed in Table 1.

3.2. Data Collection and Measurements

In order to fulfill the main objectives of the current research, an anonymous online questionnaire was developed and disseminated via Google Forms in November 2018 to nontechnical students enrolled in the e-learning platform at one of the most prestigious faculties in Central and Eastern Europe. The questionnaire integrated a total of 26 items of various types, i.e., short answer questions, multiple-choice questions with one or n answers, or single or two-dimensional questions; all items were measured using a five-point Likert scale. To capture behaviors that could be extrapolated to a wider user community, we avoided respondents with technical profiles.
Using students as a sample group is a widely applied practice in academic research. Nonetheless, Sitar and Mican used managers and site owners [32]. Student sampling, also used in our research, is a reliable technique, as observed by Pollet and Saxton [33]. Since our potential subjects have different backgrounds in terms of family, environment, and previous exposure to SNSs, they were deemed to be sufficiently diverse to provide generalized results. Acknowledging that a 100% response rate is unrealistic, a sample was used. The representativeness aspect was not neglected; thus, the minimum sample size was computed with Cochran’s formula [34], based on a confidence interval of 5% and a confidence level of 95%. The simple random sampling method was used to ensure the same probability of being chosen during the entire sampling process for each individual [35]. Each student was chosen randomly, but that student could then choose to respond or not. Our survey pool consisted of 153 subjects enrolled in our courses, and the size of the computed representative sample was 111. The survey was distributed randomly and gradually to a subset from which 111 students ultimately agreed to fill in the questionnaire.
This sample size is above the minimal threshold described by Bonett and Wright [36] for correlation analyses and is satisfactory for PLS-SEM [37]. A total of 111 individuals responded to this questionnaire, all of whom were undergraduate students, aged 18–22. The gender distribution was as follows: 67.6% women and 32.4% men. They connect to the Internet through the following types of mobile devices: smartphone 83.8%, tablet 22.5%, notebook/ultrabook 11.7%, laptop 52.3%, and desktop 55.86%. The average reported weekly social networking time is 12.847 h, i.e., 110 min per day.
The descriptive statistics (mean and standard deviation which shows the spread of the values) of the items related to the constructs from the questionnaire included in the model are presented in Table 1. The rest of the variables included in our survey are illustrated in Table 2, Table 3, Table 4, Table 5 and Table 6.

4. Data Analysis and Results

The collected data were analyzed using the statistical software SPSS to measure the correlations that describe the relationship between the variables. Before performing the correlations, the normality Kolmogorov-Smirnov test was used with the quantitative data to decide whether parametric or nonparametric tests needed to be further applied. Because data series do not follow a normal distribution, Spearman’s rho coefficients were computed. Also, ANOVA tests were considered to identify or reject behavior similarities among groups.
For the second analysis type, SmartPLS [38] was considered. This approach employs partial least squares structural equation modeling (PLS-SEM) and has become a quasi-standard method used in marketing and management research for analyses of the cause-effect relationships between latent constructs [39]. PLS-SEM is appropriate when the research goal is prediction oriented and/or when the research is exploratory in nature, i.e., researchers developing theories by doing multivariate analyses and focusing on explaining variance in the dependent variables [37]. PLS-SEM was suitable for the present research because the authors evaluated the relationships among several latent variables; this method combines the advantages of path analysis, factor analysis, and multiple regression analysis, and at the same time, helps researchers to examine relationships among variables in terms of explained variation. Due to the exploratory nature of the present study and the scarcity of previous research on the topic, and considering the predictive nature of the current research goals, PLS-SEM was considered a suitable and adequate data analysis method.

4.1. Correlation Analysis

The analysis of the correlations among the activities carried out on SNSs is presented in Table 2. There is a strong direct correlation between posting things and commenting on other users’ content (e.g., photos, posts) (rho = 0.519, p < 0.001), and between looking at what friends have posted and commenting on other users’ content (photos, posts), (rho = 0.509, p < 0.001). Both are highly significant. In the case of receiving updates from pages you like, there are three correlations, namely, a weak one with looking at what friends have posted (rho = 0.237, p < 0.05), another with posting things (rho = 0.379, p < 0.001), and a third with comments on other users’ content (photos, posts), (rho = 0.292, p < 0.001). Between chatting with others and receiving updates from pages you like, there is a weak but significant link (rho = 0.324, p < 0.001). The ANOVA test did not confirm any significant gender differences regarding chatting or receiving updates. Additionally, the same analysis type indicated that even if the younger users spend more time on social networks, no significant age or gender variances in this behavior were observed.
The data regarding correlations between time spent on social media sites for professional and personal purposes are presented in Table 3. Even if, in general terms, there are no significant differences between the time allocated to private and professional activities, there is a slight distinction between each used SNS. Thus, there is a good correlation between the frequency of Facebook usage in professional activities and use in personal activities (rho = 0.501, p < 0.001). As for Instagram, there is a very high and highly significant correlation between the two usage types (rho = 0.786, p < 0.001). In the case of Twitter, we observed a strong link between the two usage types (rho = 0.647, p < 0.001), and a weak link between using Twitter for personal purposes and Instagram (rho = 0.200, p < 0.05) or LinkedIn for professional activities (rho = 0.295, p < 0.05). In the case of LinkedIn, there was a correlation between the two sides of LinkedIn use (rho = 0.755, p < 0.001) and a weak link between using LinkedIn for personal purposes and using Twitter for professional purposes (rho = 0.238, p < 0.05). For YouTube, there was a strong correlation between the frequency of use for the two domains (rho = 0.400, p < 0.001) and a weak one between using YouTube for personal use and LinkedIn at work (rho = 0.233, p < 0.05).
Table 4 illustrates the correlations between the number of current friends, the number of hours spent on SNSs, and the frequency of SNS use for professional and personal purposes. There are several weak and highly significant inverse correlations between the number of current friends and the frequency of Facebook use for professional purposes (rho = −0.325, p < 0.001), Facebook for personal purposes (rho = −0.249, p < 0.01), or Twitter for personal purposes (rho = −0.265, p < 0.01), and a weak and inverse relationship with the frequency of Twitter use for professional purposes (rho = −0.237, p < 0.05).
In terms of the number of hours spent on SNSs, three weak but significant inverse relationships were found with frequent use of LinkedIn for professional activities (rho = −0.249, p < 0.01), frequency of use LinkedIn for personal activities (rho = −0.195, p < 0.05), and the frequency of YouTube usage for personal purposes (rho = −0.203, p < 0.05).
The correlations between the current number of friends, the number of hours spent on SNSs, and satisfaction, importance, and SNS activities are presented in Table 5. Two weak and inverse correlations were observed between the current number of friends and comments on other users’ pages (rho = −0.245, p < 0.01) and receiving updates from pages you like (rho = −0.198, p < 0.05). Regarding the number of hours spent on SNSs, there was a weak but significant link with chatting with others (rho = −0.246, p < 0.01).
Observed correlations between professional and personal satisfaction and importance are presented in Table 6. Concerning satisfaction with SNSs for professional reasons, there were three correlations. The first one is a strong and highly significant correlation with satisfaction with SNSs for personal use (rho = 0.611, p < 0.001). The other two correlations were weak and negatively correlated with SNS importance for personal reasons (rho = −0.278, p < 0.01) and SNS importance for professional reasons (rho = −0.194, p < 0.05). In terms of satisfaction with SNSs for personal use, this was correlated weakly, but with high significance, with SNS importance for personal use (rho = −0.326, p < 0.001). We also noticed that SNS importance for professional use is strongly correlated with SNS importance for personal use (rho = 0.713, p < 0.001).
Regarding the mechanisms through which satisfaction with SNSs is influenced by SNS activities, the following correlations were established. Satisfaction with SNSs for professional reasons correlated poorly, but significantly, with posting things (rho = 0.252, p < 0.01) and comments to other users’ (photos, posts) (rho = 0.233, p < 0.05). In the case of satisfaction with SNSs for personal use, the same weak and significant correlations with posting things (rho = 0.259, p < 0.01) and commenting on other users’ material (photos, posts) (rho = 0.258, p < 0.01) was identified.
SNSs importance for professional reasons correlates poorly, inversely, and significantly with chatting with others (rho = −0.242, p < 0.01). Also, SNSs importance for personal reasons correlates poorly, inversely, and significantly with posting things (rho = −0.192, p < 0.05) and comment on other users’ (photos, posts) (rho = −0.225, p < 0.05).

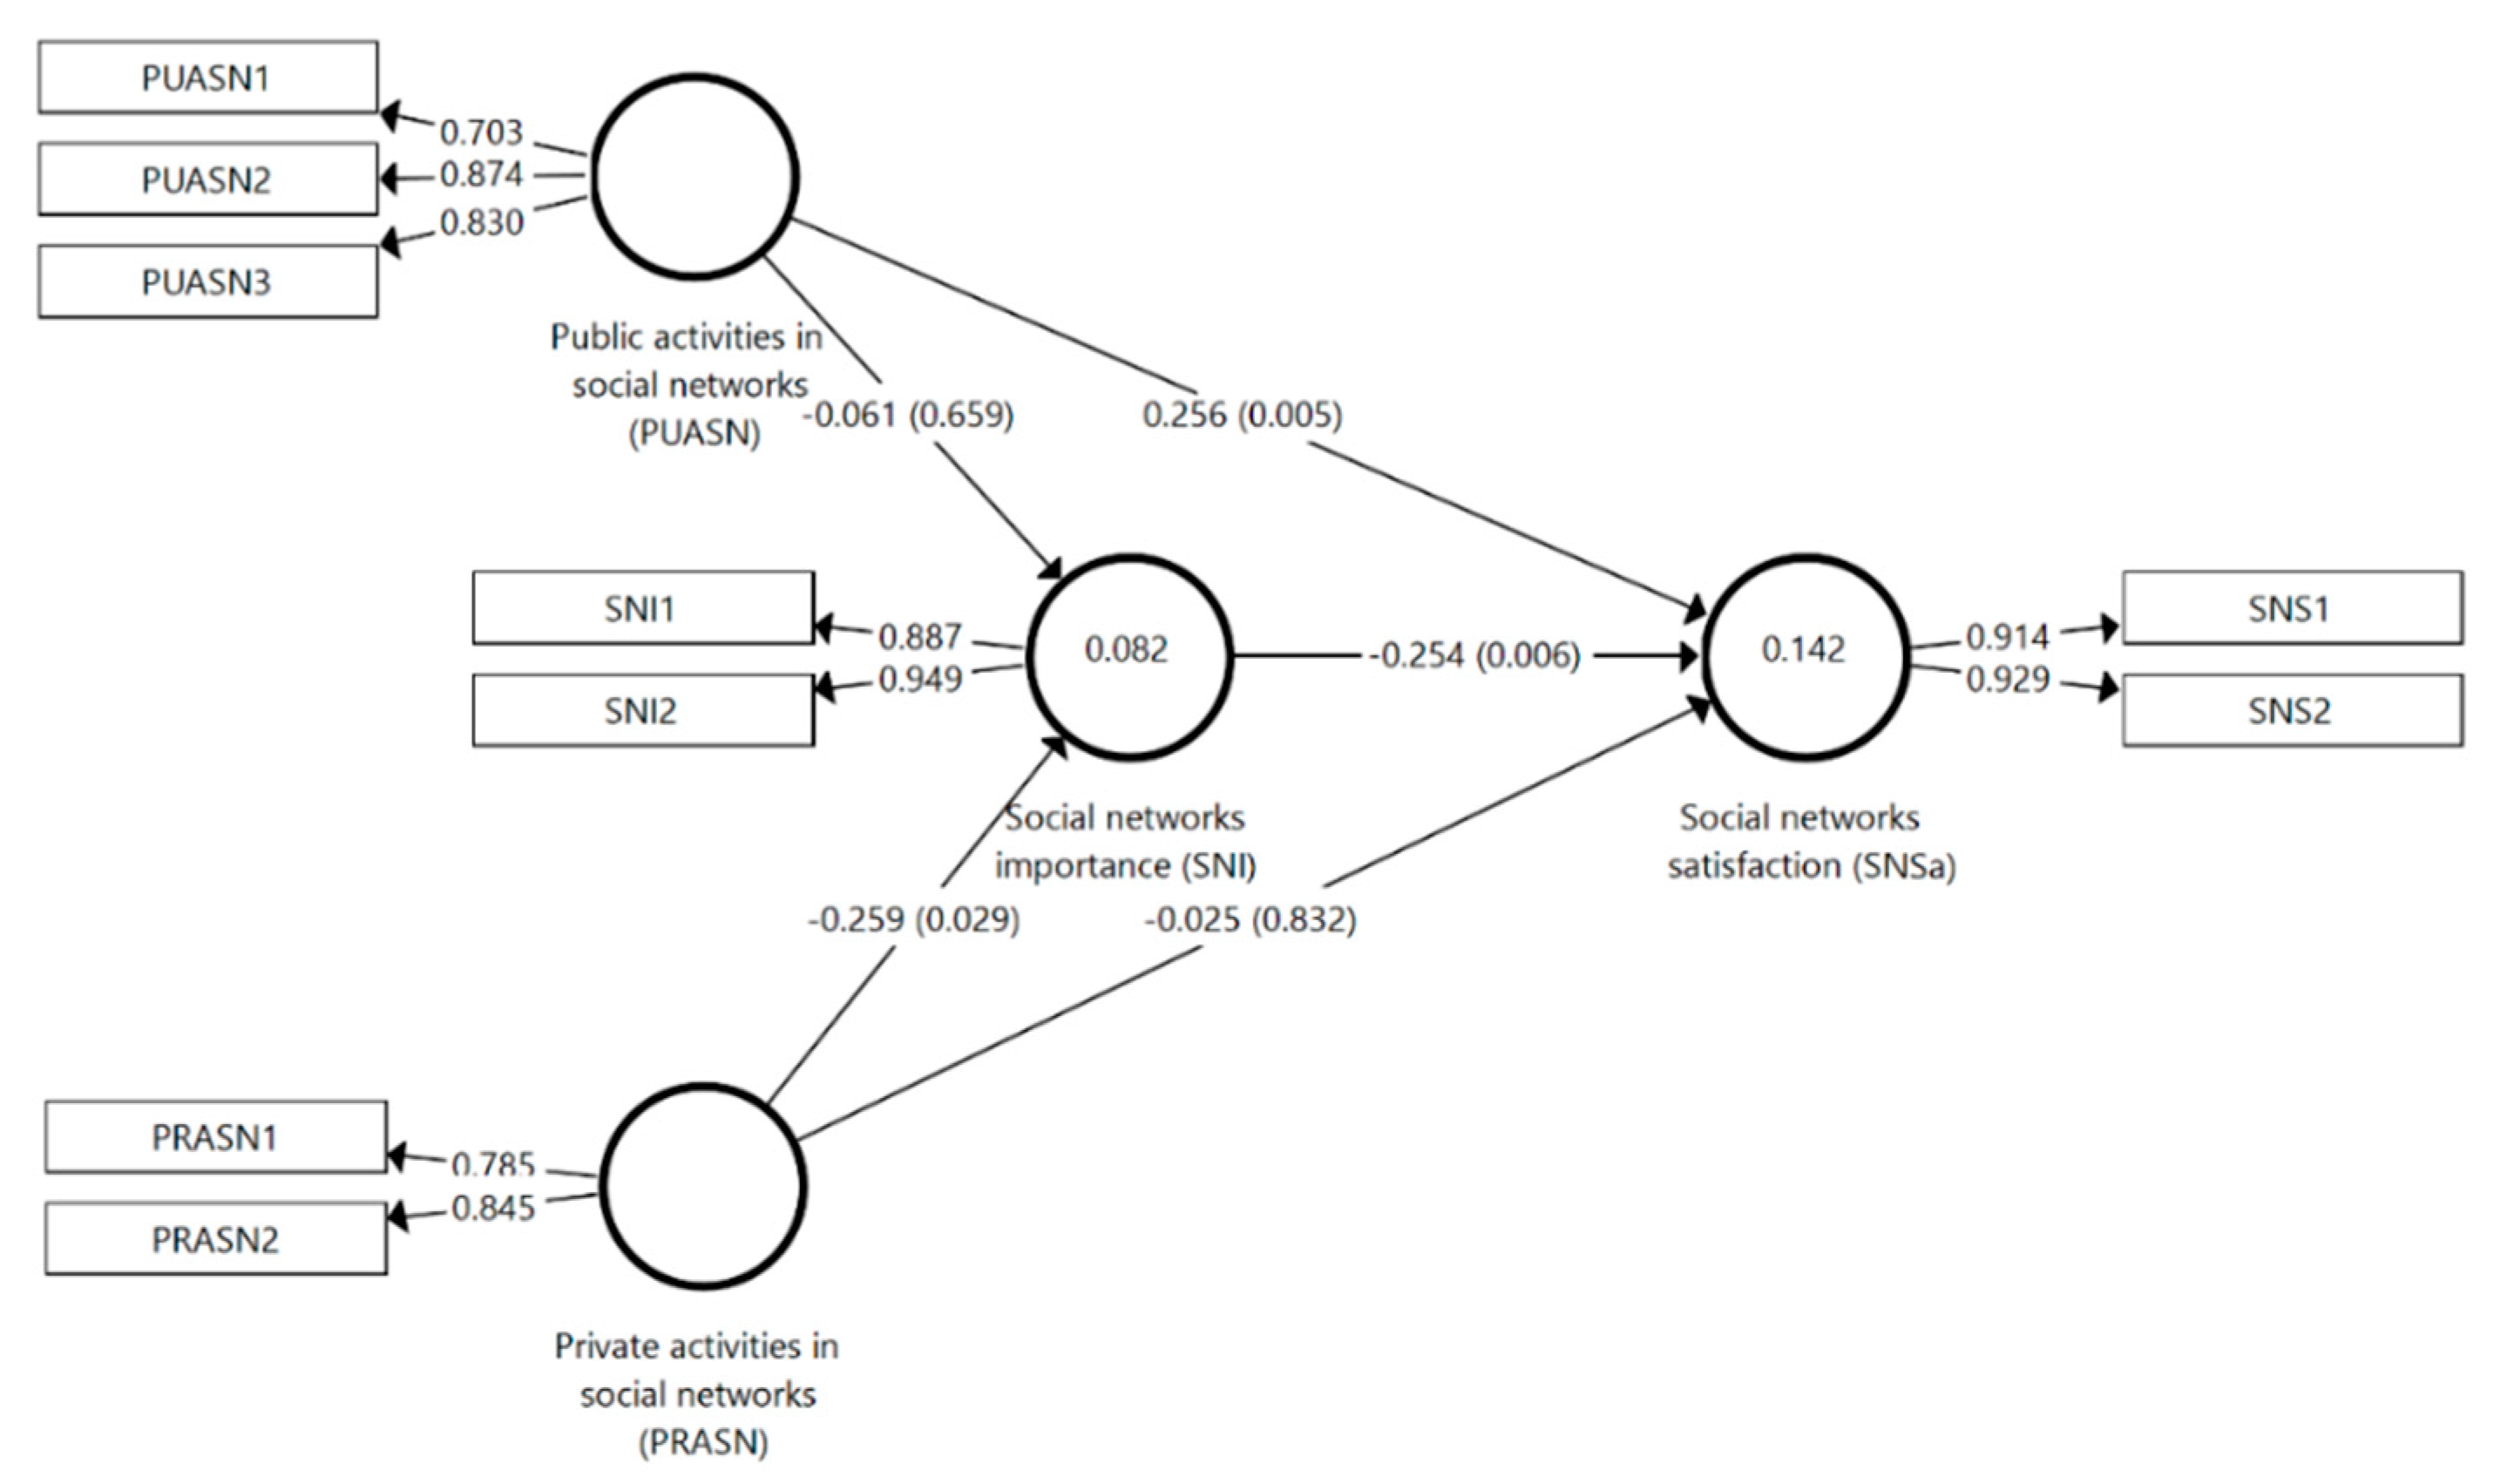
4.2. Structural Equation Modeling Analysis

In order to reveal more regarding the immense complexity of the social network phenomenon and user behavior, a new approach is proposed. The degrees of importance and satisfaction with social networks were analyzed concerning activity types, i.e., public or private. To build the model and test the research hypotheses, the statistical software SmartPLS version 3.3.2 (SmartPLS GmbH, Boenningstedt, Germany) was used [38], which applies modeling using the partial structural equation with the smallest squares PLS-SEM, also called PLS path modeling. It requires two sets of validation procedures, i.e., for the outer and also for the inner/structural model.

4.2.1. Reflective Measurements Assessment

An assessment of the reflective measurements is presented in Table 7, which contains the model constructs with latent reflective variables and reflective indicators. The reliability and convergent validity results of the model can be observed by looking at the outer loadings, Cronbach’s alpha, composite reliability, and average variance extracted (AVE). The outer loadings indicate the relationships between constructs and indicator variables in reflective measurement models and are computed for all measurement model constructs. For the outer loadings indicator, the values were higher than the minimum score of 0.70 [40], which infers adequate levels of indicator reliability. The indicators SNI2 (outer loading: 0.949) and SNSa2 (outer loading: 0.929) had the highest reliability, while the indicators ISN1 (outer loading: 0.712) and PUASN1 (outer loading: 0.703) had the lowest reliability.
Regarding the internal consistency reliability, Cronbach’s alpha was considered as the lower bound and composite reliability as the upper bound [41]. In this respect, almost all the values for the Cronbach’s alpha coefficient were considerably above the recommended value of 0.70 [41]. The highest values were for SNSa (0.822) and SNI (0.821). On the other hand, for composite reliability, all the values could be considered adequate. In this case, the highest values were for the same constructs as in the case of Cronbach’s alpha coefficient.
The average variance extracted (AVE) is a traditional measure to prove the convergent efficacy of the construct level. It is calculated as the grand mean value of the squared loadings of the indicators linked with the construct [42]. Regarding the convergent validity, the AVE was far above the minimum threshold of 0.5 [42], which indicates that convergent validity was confirmed for all the constructs. In this model, the highest values were for constructs SNSa (0.849) and SNI (0.844).
The heterotrait-monotrait ratio (HTMT) has been proven to be a reliable basis for the statistical discriminant validity test [43]. For the current case, as presented in Table 8, all HTMT values were lower than the conservative threshold value of 0.85 [43], and discriminant validity was confirmed among all pairs of constructs.

4.2.2. Collinearity Issues Assessment

To further evaluate the structural model, a collinearity assessment was needed among the values of all sets of predictor constructs (Inner VIF values) [40]. Table 9 shows the inner VIF values of all combinations of endogenous constructs and their corresponding exogenous constructs. As can be observed, all values were below the ideal conditions threshold value of 3 [40], which means that collinearity between the predictor constructs did not represent an issue in the present structural model.

4.2.3. Structural Model Relationships

To evaluate the structural model, the significance level of the relationships established between the constructs was analyzed. Figure 2 shows a graphic representation of the structural model, while Table 10 presents a summary of the results. We can see that 3 out of the 5 hypotheses that we developed were confirmed by this custom model. According to the p-values, H2 and H5 were supported with p < 0.01, and H3 with p < 0.05.

4.2.4. Predictive Relevance

To evaluate the predictive relevance [40] of the current model, R2 and Q2 values for the target variables were calculated and the PLSpredict algorithm was employed. The R2 value for the final dependent variable in the model (SNSa) had a value of 0.142, which denotes a low predictive accuracy. Similarly, regarding the Q2 value, the final dependent variable in the model (SNSa) had a value of 0.0824, which equally denotes a weak predictive power.
The PLSpredict algorithm [44] was employed to achieve a better assessment of the model’s predictive power. The method uses training and holdout samples to generate and evaluate predictions from PLS path model estimations. As the data included in Table 11 reveal, all the Q² values were positive and the prediction error of the PLS-SEM results (RMSE and MAE) was smaller than that obtained by simply using the mean values; this indicates that this model offers better predictive performance. Taking into account the RMSE and MAE, in comparison with the LM results, the PLS-SEM results had lower prediction errors in terms of RMSE and MAE than the LM for all the items, which indicates that the model has high predictive power.

5. Discussion and Limitations

5.1. Discussion

Existing studies by economists, psychologists, or sociologists agree on the significant role that the quality and quantity of social relationships have on the well-being of individuals [45]. Previous work confirmed the positive correlation between the density of social networks and the level of life satisfaction [46]. This link is explained by the fact that a larger number of social networks is positively correlated with a high degree of stability and security, and therefore, with a high level of life satisfaction [47]. As we experience a continuous evolution in the area of social networks, new forms of interconnections with other people are emerging day by day. The appearance of social media has substantially modified the range of criteria people use to evaluate their own well-being and life satisfaction [48]. Increasing the level of life satisfaction is an overall goal people want to achieve; such an undertaking reflects a subjective and global evaluation of the personal quality of life [49].
In this research, we investigated the link between the use of SNSs by students and the level of satisfaction they experience, both professionally and personally. The elaborated research model took into consideration the fact that SNS use by young people is increasing exponentially, day by day, and therefore, that it requires a further assessment of the channels of dissemination regarding the attributed importance or the satisfaction/dissatisfaction it may provide. The purpose of social networks is to extend the general framework of traditional communication channels. Many scholars have expressed concern regarding the fact that online interaction techniques, such as the use of SNSs, are slowly becoming a substitute for face-to-face connections, and as a result, we may be confronted with a decline in individual social capital [18,50].
Moreover, it was argued that online interactions are less social than face-to-face ones; many studies in the field have confirmed this assumption. In particular, Kross et al. [51] observed that an increase in the number of hours spent on SNSs such as Facebook correlates with a decline in the level of life satisfaction over a certain period. These results were also supported by a study of Sabatini and Sarracino [52], which argued that the effect of SNSs, especially Facebook and Twitter, on individual well-being is negative. Interesting results are to be found in the work of Burke and Kraut [53], which suggests a positive link between online communication and well-being, as long as such communication includes people who are significantly important in the individual’s life, or it incorporates characteristics which the individual considers to be suitable to their personality.
In the current research, the correlation coefficients denote positive significant relationships among all of the SNS activities depicted in Table 2, with the most powerful being between posting and commenting on other users’ posts or photos. The behavior of students may also be transposed in the consumer community, where peers are strongly connected to a specific cause—like sharing food safety information—and trust each other [54]. Concerning these activities, we found there were no significant gender differences in terms of chatting or receiving updates, contrary to other studies that confirmed a higher involvement in this respect among males than females [55]. The time spent on social media sites for professional use is highly correlated with the related time spent for personal use on the same platform for the case of Instagram, followed by LinkedIn, and Facebook. The correlation among time spent on the same SNS but for different purposes is always positive; however, if both SNSs and purpose are different, inverse associations may be observed (e.g., Twitter for work and Instagram for private use). Overall social media intensity—i.e., number of friends and time spent on SNSs—is not quite a straight indicator for the time spent on a given SNS for professional/personal activities. In fact, our study indicates that this intensity correlates inversely with each of these times. The most prominent gap is between the number of friends on SNSs and the time spent on Twitter. Surprisingly, similar or inconclusive behavior was observed between social media intensity and satisfaction with SNSs, SNS importance, and activity type. There is an inverse correlation between the hours spent and chat activities, followed closely by number of friends and receiving updates from the liked pages. Going further, we noted a highly positive interdependence between the importance of SNSs (for professional and personal uses) and satisfaction. Surprisingly, importance was shown to correlate inversely with satisfaction, and possibly—although most were not significant—with all SNS activity types. Satisfaction was is positively impacted by public SNS activities (posting, commenting, and looking at posts) and indefinitely so by private ones (chatting and receiving updates from favorite pages). Since these results were not quite conclusive, they were studied further at a higher conceptual level by using a different technique.
After applying structural equation modeling, our results showed that public activities on social networks positively affect user satisfaction with social networks. Also, private activities on social networks have a direct negative relationship with the perceived importance of social networks. The perceived importance of social networks has a direct negative relationship with user satisfaction.
Socialization mediated through technology means that bidirectional social capital is exchanged between individuals and the network. Active public behavior on SNs contributes positively to increased perceived satisfaction (H2) since it is considered irrelevant for perceived importance (H1 infirmed). Selfish behavior on a SN, i.e., using it purely as a private communication channel (chatting) or to obtain only personal benefits (receiving updates from favorite pages), alters the perceived importance of the social network, since the obtained satisfaction is unquantifiable (H4 infirmed). Even if the social networks appear to be a panacea for both personal and professional concerns, their misuse may generate the opposite effect [23]. A higher level of perceived importance regarding a social network tends to yield lower perceived satisfaction (H5 confirmed). This relationship may look paradoxical, but it was also confirmed by Yao and Cao [4]. The proposed model confirmed three relationships with similar strengths in terms of effect, but only one, i.e., between public activities and satisfaction, was positive.
Social networks offer social support, satisfaction, and a sense of well-being in day to day life, but also during word emergencies, like the current one created by the COVID-19 virus [56]. On the other hand, they may play a negative role by creating or reinforcing mental health problems or radical ideas [57]. These contradictory aspects reveal how vast, complex, and unpredictable this phenomenon is, and how far the literature has to go to completely understand it. Moderation, as in anything with addictive potential, may be the key to optimizing the positive-negative balance.

5.2. Limitations and Future Directions of Research

Despite the overall implications of this study, certain research limitations should be mentioned. First of all, even though the number of students that participated in the survey fulfills the minimum size requirements of both the analysis methods and the representativeness of the studied population, the sample could have been extended to students enrolled in other programs of study for more complex analysis. However, we must acknowledge that this sample size was severely reduced due to the GDPR constraints regarding the number of students enrolled in our e-learning system. Even if the student sampling method is widely used in research, our model and analyses may lack generalization. Region, gender, age, timing, profession are the main factors to be considered in larger samples relying on a multi-strata sampling method. Nevertheless, sophisticated models/analyses may fail during emergency crises, such as the COVID-19 lockdown, social distancing, or post-social distancing.
Considering the current crisis, one future direction would be to study and model the effects of the media during periods in which social distancing measures are implemented. Another would be to investigate more deeply how the complexity of the magnitude of social network use and social capital types facilitate transitional social support/satisfaction during lockdown for all involved parties [17].

6. Conclusions

Social networks are part of the everyday lives of people around the world; they are used for a multitude of purposes, considering the typology of the industry, from communication to informatics, and other fields [3]. As mentioned, the primary objective of this study was to assess, by using structural equation modeling, the link between SNS use and the level of satisfaction, in particular among young people. The obtained results indicate that the average amount of time students spend weekly on SNSs is 12.85 h, with no significant discrepancies between men and women. The dominant positions in terms of usage are attributed to Facebook and YouTube, with LinkedIn and Twitter being situated at the opposite end of the pole. Generally, there are no significant differences in terms of time spent for professional activities versus personal ones. The most popular and time-consuming activities that users carry out within SNSs are talking privately to others and tracking the news posted on their favorite pages, without revealing any significant differences between males and females.
The present study provides insights into social networking site use and the effects that this may have on an individual’s life, in particular, in the case of students. As users spend more time looking at their friends’ posts, they also spend more time posting things themselves and commenting on other users’ content (photos, posts). Therefore, the current research also contributes to the existing literature by identifying correlations between these three activities. Similarly, as users spend more time receiving updates from pages they like, they spend more time chatting with others. SNS activities bring satisfaction, both in the professional and personal lives of most of the respondents. Of all the activities, posting things and commenting on other users’ content (photos, posts) are statistically significant and correlated, i.e., the higher the number of posts and comments, the higher is the level of satisfaction, both professionally and personally. Similar results can be found in the work of Valenzuela et al. [58]. Paradoxically, following the analysis of the correlation between importance and satisfaction, it turned out that there is a reversible and significant link between these two. Therefore, if the importance of SNSs increases, satisfaction decreases. In other words, the higher the importance, the more the discontent grows.
The model derived from structural equation modeling analysis confirms more intuitively a part of the correlation analysis findings. Public activities (posting things, commenting on other users’ posts, and looking at posts) positively impact satisfaction, but the effect on the importance of SNSs is inconclusive. On the other hand, the output offered by the private activities (chatting with friends and receiving updates from favorite pages) is asymmetric; these variables have an indefinite effect on satisfaction and a negative one on importance. SEM analysis confirmed the negative effect that importance has upon satisfaction due to the overuse of social networks.
Nowadays, the young generation, which is permanently exposed to social media, has to distinguish between the positive and negative effects that this channel of communication may engender. Despite some mainstream opinions on this topic, the role and use of social networks is an endless subject of discussion and the literature is far from reaching a consensus.

Author Contributions

Conceptualization, D.M. and D.-A.S.-T.; methodology, D.M. and D.-A.S.-T.; validation, D.M.; formal analysis, D.M.; investigation, D.M., D.-A.S.-T., and I.-S.M.; resources, D.M., D.-A.S.-T., and I.-S.M.; data curation, D.M., D.-A.S.-T., and I.-S.M.; writing—Original draft preparation, D.M.; writing—Review and editing, D.M., D.-A.S.-T., and I.-S.M.; visualization, D.M.; supervision, D.-A.S.-T. All authors have read and agreed to the published version of the manuscript.

Funding

This research received no external funding

Conflicts of Interest

The authors declare no conflict of interest.

References

  1. Celi, G.; Guarascio, D.; Simonazzi, A. A fragile and divided European Union meets Covid-19: Further disintegration or ‘Hamiltonian moment’? J. Ind. Bus. Econ. 2020, 47, 411–424. [Google Scholar] [CrossRef]
  2. Pérez-Escoda, A.; Jiménez-Narros, C.; Perlado-Lamo-de-Espinosa, M.; Pedrero-Esteban, L.M. Social Networks’ Engagement During the COVID-19 Pandemic in Spain: Health Media vs. Healthcare Professionals. Int. J. Environ. Res. Public Health 2020, 17, 5261. [Google Scholar] [CrossRef] [PubMed]
  3. Chen, B.; Chen, H.; Ning, D.; Zhu, M.; Ai, C.; Qiu, X.; Dai, W. A Two-Tier Partition Algorithm for the Optimization of the Large-Scale Simulation of Information Diffusion in Social Networks. Symmetry 2020, 12, 843. [Google Scholar] [CrossRef]
  4. Yao, J.; Cao, X. The balancing mechanism of social networking overuse and rational usage. Comput. Hum. Behav. 2017, 75, 415–422. [Google Scholar] [CrossRef]
  5. Lenhart, A.; Purcell, K.; Smith, A.; Zickuhr, K. Social Media & Mobile Internet Use among Teens and Young Adults. Pew Internet Am. Life Proj. 2010. [Google Scholar] [CrossRef]
  6. Ilakkuvan, V.; Johnson, A.; Villanti, A.C.; Evans, W.D.; Turner, M. Patterns of Social Media Use and Their Relationship to Health Risks Among Young Adults. J. Adolesc. Health 2019, 64, 158–164. [Google Scholar] [CrossRef]
  7. Hruska, J.; Maresova, P. Use of Social Media Platforms among Adults in the United States—Behavior on Social Media. Societies 2020, 10, 27. [Google Scholar] [CrossRef] [Green Version]
  8. Toma, C.L.; Hancock, J.T. Self-Affirmation Underlies Facebook Use. Personal. Soc. Psychol. Bull. 2013, 39, 321–331. [Google Scholar] [CrossRef]
  9. Dhir, A.; Kaur, P.; Chen, S.; Lonka, K. Understanding online regret experience in Facebook use%Effects of brand participation, accessibility & problematic use. Comput. Hum. Behav. 2016, 59, 420–430. [Google Scholar] [CrossRef]
  10. Liao, C.-H.; Chen, L.-X.; Yang, J.-C.; Yuan, S.-M. A Photo Post Recommendation System Based on Topic Model for Improving Facebook Fan Page Engagement. Symmetry 2020, 12, 1105. [Google Scholar] [CrossRef]
  11. Paul, J.Z.; Friginal, E. The effects of symmetric and asymmetric social networks on second language communication. Comput. Assist. Lang. Learn. 2019, 32, 587–618. [Google Scholar] [CrossRef]
  12. Conejero, J.; Sánchez-Figueroa, F.; Rodríguez-Echeverría, R.; Preciado, J. SCPL: A Social Cooperative Programming Language to Automate Cooperative Processes in (A)Symmetric Social Networks. Symmetry 2016, 8, 71. [Google Scholar] [CrossRef] [Green Version]
  13. Kaplan, A.M.; Haenlein, M. Users of the world, unite! The challenges and opportunities of Social Media. Bus. Horiz. 2010, 53, 59–68. [Google Scholar] [CrossRef]
  14. Kavianpour, S.; Tamimi, A.; Shanmugam, B. A privacy-preserving model to control social interaction behaviors in social network sites. J. Inf. Secur. Appl. 2019, 49, 102402. [Google Scholar] [CrossRef]
  15. Schlosser, A.E. Self-disclosure versus self-presentation on social media. Curr. Opin. Psychol. 2020, 31, 1–6. [Google Scholar] [CrossRef]
  16. Villanti, A.C.; Johnson, A.L.; Ilakkuvan, V.; Jacobs, M.A.; Graham, A.L.; Rath, J.M. Social media use and access to digital technology in US Young Adults in 2016. J. Med. Internet Res. 2017, 19, e196. [Google Scholar] [CrossRef]
  17. Valkenburg, P.M.; Peter, J.; Walther, J.B. Media Effects: Theory and Research. Annu. Rev. Psychol. 2016, 67, 315–338. [Google Scholar] [CrossRef] [Green Version]
  18. Boyd, D.M.; Ellison, N.B. Social network sites: Definition, history, and scholarship. J. Comput. Commun. 2007, 13, 210–230. [Google Scholar] [CrossRef] [Green Version]
  19. Shane-Simpson, C.; Manago, A.; Gaggi, N.; Gillespie-Lynch, K. Why do college students prefer Facebook, Twitter, or Instagram? Site affordances, tensions between privacy and self-expression, and implications for social capital. Comput. Hum. Behav. 2018, 86, 276–288. [Google Scholar] [CrossRef] [Green Version]
  20. Phua, J.; Jin, S.V.; Kim, J.J. Uses and gratifications of social networking sites for bridging and bonding social capital: A comparison of Facebook, Twitter, Instagram, and Snapchat. Comput. Hum. Behav. 2017, 72, 115–122. [Google Scholar] [CrossRef]
  21. Kim, C.; Shen, C. Connecting activities on Social Network Sites and life satisfaction: A comparison of older and younger users. Comput. Hum. Behav. 2020, 105, 106222. [Google Scholar] [CrossRef]
  22. Nabity-Grover, T.; Cheung, C.M.K.; Thatcher, J.B. Inside out and outside in: How the COVID-19 pandemic affects self-disclosure on social media. Int. J. Inf. Manag. 2020, 102188. [Google Scholar] [CrossRef] [PubMed]
  23. Qi, M.; Zhou, S.J.; Guo, Z.C.; Zhang, L.G.; Min, H.J.; Li, X.M.; Chen, J.X. The Effect of Social Support on Mental Health in Chinese Adolescents During the Outbreak of COVID-19. J. Adolesc. Health 2020, 67, 514–518. [Google Scholar] [CrossRef]
  24. Tang, C.S.; Koh, Y.Y.W. Online social networking addiction among college students in Singapore: Comorbidity with behavioral addiction and affective disorder. Asian J. Psychiatr. 2017, 25, 175–178. [Google Scholar] [CrossRef] [PubMed]
  25. Tafesse, W. The effect of social networking site use on college students’ academic performance: The mediating role of student engagement. Educ. Inf. Technol. 2020. [Google Scholar] [CrossRef]
  26. Abosag, I.; Ramadan, Z.B.; Baker, T.; Jin, Z. Customers’ need for uniqueness theory versus brand congruence theory: The impact on satisfaction with social network sites. J. Bus. Res. 2020, 117, 862–872. [Google Scholar] [CrossRef]
  27. Lee, Y. Motivations of employees’ communicative behaviors on social media: Individual, interpersonal, and organizational factors. Internet Res. 2020, 30, 971–994. [Google Scholar] [CrossRef]
  28. Moqbel, M.; Kock, N. Unveiling the dark side of social networking sites: Personal and work-related consequences of social networking site addiction. Inf. Manag. 2018, 55, 109–119. [Google Scholar] [CrossRef]
  29. Khan, N.A.; Khan, A.N. What followers are saying about transformational leaders fostering employee innovation via organisational learning, knowledge sharing and social media use in public organisations? Gov. Inf. Q. 2019, 36, 101391. [Google Scholar] [CrossRef]
  30. Verswijvel, K.; Heirman, W.; Hardies, K.; Walrave, M. Designing and validating the friendship quality on social network sites questionnaire. Comput. Hum. Behav. 2018, 86, 289–298. [Google Scholar] [CrossRef]
  31. Abdul Malik, K.A.; Ahmad, A. The Effect of Use of Social Media on Prosocial Behavior. Open J. Sci. Technol. 2019, 2, 14–20. [Google Scholar] [CrossRef]
  32. Sitar-Tăut, D.A.; Mican, D. MRS OZ: Managerial recommender system for electronic commerce based on Onicescu method and Zipf’s law. Inf. Technol. Manag. 2020, 21, 131–143. [Google Scholar] [CrossRef]
  33. Pollet, T.V.; Saxton, T.K. How Diverse Are the Samples Used in the Journals ‘Evolution & Human Behavior’ and ‘Evolutionary Psychology’? Evol. Psychol. Sci. 2019, 5, 357–368. [Google Scholar] [CrossRef] [Green Version]
  34. Cochran, W.G. Sampling Techniques, 3rd ed.; Wiley, Ed.; Wiley: Hoboken, NJ, USA, 1977; ISBN 978-0-471-16240-7. [Google Scholar]
  35. Starnes, D.S.; Yates, D.; Moore, D.S. The Practice of Statistics, 4th ed.; W. H. Freeman: New York, NY, USA, 2010; ISBN 142924559X. [Google Scholar]
  36. Bonett, D.G.; Wright, T.A. Sample size requirements for estimating Pearson, Kendall and Spearman correlations. Psychometrika 2000, 65, 23–28. [Google Scholar] [CrossRef]
  37. Hair, J.F.; Hult, G.T.M.; Ringle, C.M.; Sarstedt, M. A Primer on Partial Least Squares Structural Equation Modeling (PLS-SEM); SAGE Publications: Thousand Oaks, CA, USA, 2016; ISBN 9781483377445. [Google Scholar]
  38. Ringle, C.M.; Wende, S.; Becker, J.-M. SmartPLS 3. Available online: http://www.smartpls.com (accessed on 9 October 2020).
  39. Hair, J.F.; Ringle, C.M.; Sarstedt, M. PLS-SEM: Indeed a Silver Bullet. J. Mark. Theory Pract. 2011, 19, 139–152. [Google Scholar] [CrossRef]
  40. Hair, J.F.; Risher, J.J.; Sarstedt, M.; Ringle, C.M. When to use and how to report the results of PLS-SEM. Eur. Bus. Rev. 2019, 31, 2–24. [Google Scholar] [CrossRef]
  41. Hair, J.F.; Anderson, R.E.; Tatham, R.L. Multivariate Data Analysis with Readings; Macmillan: New York, NY, USA, 1987; ISBN 0023489804. [Google Scholar]
  42. Fornell, C.; Larcker, D.F. Evaluating Structural Equation Models with Unobservable Variables and Measurement Error. J. Mark. Res. 1981, 18, 39. [Google Scholar] [CrossRef]
  43. Henseler, J.; Ringle, C.M.; Sarstedt, M. A new criterion for assessing discriminant validity in variance-based structural equation modeling. J. Acad. Mark. Sci. 2015, 43, 115–135. [Google Scholar] [CrossRef] [Green Version]
  44. Shmueli, G.; Ray, S.; Velasquez Estrada, J.M.; Chatla, S.B. The elephant in the room: Predictive performance of PLS models. J. Bus. Res. 2016, 69, 4552–4564. [Google Scholar] [CrossRef]
  45. Zou, X.; Ingram, P.; Higgins, E.T. Social networks and life satisfaction: The interplay of network density and regulatory focus. Motiv. Emot. 2015, 39, 693–713. [Google Scholar] [CrossRef] [Green Version]
  46. Reis, H.T.; Gable, S.L. Toward a Positive Psychology of Relationships. In Flourishing: Positive Psychology and the Life Well-Lived; American Psychological Association: Washington, DC, USA, 2004; pp. 129–159. [Google Scholar]
  47. Baumeister, R.F.; Leary, M.R. The Need to Belong: Desire for Interpersonal Attachments as a Fundamental Human Motivation. Psychol. Bull. 1995, 117, 497–529. [Google Scholar] [CrossRef]
  48. Zhan, L.; Sun, Y.; Wang, N.; Zhang, X. Understanding the influence of social media on people’s life satisfaction through two competing explanatory mechanisms. Aslib J. Inf. Manag. 2016, 68, 347–361. [Google Scholar] [CrossRef]
  49. Diener, E.; Emmons, R.A.; Larsem, R.J.; Griffin, S. The Satisfaction with Life Scale. J. Pers. Assess. 1985, 49, 71–75. [Google Scholar] [CrossRef] [PubMed]
  50. Arampatzi, E.; Burger, M.J.; Novik, N. Social Network Sites, Individual Social Capital and Happiness. J. Happiness Stud. 2018, 19, 99–122. [Google Scholar] [CrossRef] [Green Version]
  51. Kross, E.; Verduyn, P.; Demiralp, E.; Park, J.; Lee, D.S.; Lin, N.; Shablack, H.; Jonides, J.; Ybarra, O. Facebook Use Predicts Declines in Subjective Well-Being in Young Adults. PLoS ONE 2013, 8, e69841. [Google Scholar] [CrossRef] [PubMed] [Green Version]
  52. Sabatini, F.; Sarracino, F. Online Networks and Subjective Well-Being. Kyklos 2017, 70, 456–480. [Google Scholar] [CrossRef]
  53. Burke, M.; Kraut, R.E. The Relationship Between Facebook Use and Well-Being Depends on Communication Type and Tie Strength. J. Comput. Commun. 2016, 21, 265–281. [Google Scholar] [CrossRef]
  54. Seo, S.; Almanza, B.; Miao, L.; Behnke, C. The Effect of Social Media Comments on Consumers’ Responses to Food Safety Information. J. Foodserv. Bus. Res. 2015, 18, 111–131. [Google Scholar] [CrossRef]
  55. Alnjadat, R.; Hmaidi, M.M.; Samha, T.E.; Kilani, M.M.; Hasswan, A.M. Gender variations in social media usage and academic performance among the students of University of Sharjah. J. Taibah Univ. Med. Sci. 2019, 14, 390–394. [Google Scholar] [CrossRef]
  56. Sahni, H.; Sharma, H. Role of social media during the COVID-19 pandemic: Beneficial, destructive, or reconstructive? Int. J. Acad. Med. 2020, 6, 70–75. [Google Scholar]
  57. Bettmann, J.E.; Anstadt, G.; Casselman, B.; Ganesh, K. Young Adult Depression and Anxiety Linked to Social Media Use: Assessment and Treatment. Clin. Soc. Work J. 2020. [Google Scholar] [CrossRef]
  58. Valenzuela, S.; Park, N.; Kee, K.F. Is There Social Capital in a Social Network Site?: Facebook Use and College Students’ Life Satisfaction, Trust, and Participation. J. Comput. Commun. 2009, 14, 875–901. [Google Scholar] [CrossRef] [Green Version]
Figure 1. Research model depicting the influence of SNS activities on SN importance and satisfaction.
Symmetry 12 01656 g001
Figure 2. Graphic representation of structural model relationships.
Symmetry 12 01656 g002
Table 1. Questionnaire (model) items, constructs, and descriptive statistics.
Latent Reflective VariableReflective IndicatorsDescriptionMeanStandard Deviation
Private activities on social networks (PRASN)PRASN1I spend a lot of time receiving updates from liked pages3.1171.168
PRASN2I spend a lot of time chatting with others2.9101.119
Public activities on social networks (PUASN)PUASN1I spend a lot of time looking at other users’ posts3.2341.031
PUASN2I spend a lot of time posting things3.6220.987
PUASN3I spend a lot of time commenting on other users’ posts3.7660.958
Social networks importance (SNI)SNI1Social networks are important for my professional life3.5051.106
SNI2Social networks are important for my personal life3.5591.096
Social networks satisfaction (SNSa)SNSa1Social networks bring professional satisfaction1.9730.716
SNSa2Social networks bring personal satisfaction1.8920.752
Table 2. Spearman’s rho correlation between social networking activities.
Private ActivitiesPublic Activities
DimensionLookChatUpdatesPostComment
Look1.0000.1460.237 *0.465 ***0.509 ***
Chat0.1461.0000.324 ***0.1700.109
Updates0.237 *0.324 ***1.0000.379 ***0.292 **
Post0.465 ***0.1700.379 ***1.0000.519 ***
Comment0.509 ***0.1090.292 **0.519 ***1.000
Note: Look = looking at what friends have posted; Chat = chatting with others; Updates = receiving updates from pages you like; Post = posting things; Comment = comments on other users’(photos, posts); Correlation is significant at the * = 0.05/** = 0.01/*** = 0.001 level (2-tailed).
Table 3. The use of SNSs for professional vs. personal reasons.
Dimension FWIWTWLWYW
FP0.501 ***−0.0110.083−0.0110.082
IP−0.0660.786 ***−0.177−0.0920.059
TP0.122−0.200*0.647 ***0.295 **0.115
LP−0.067−0.0200.238 *0.755 ***0.120
YP0.004−0.1600.0630.233 *0.400 ***
Note: F = Facebook; I = Instagram; T = Twitter; L = LinkedIn; Y = YouTube; W = work/professional reasons; P = personal reasons; Correlation is significant at the * = 0.05/** = 0.01/*** = 0.001 level (2-tailed).
Table 4. Correlation among the current number of friends, hours spent and SNS usage.
DimensionFWIWTWLWYWFPIPTPLPYP
FR−0.325 *** 0.082−0.237 *−0.128−0.059−0.249 **0.166−0.265 **−0.110 0.093
HR−0.085−0.004−0.074−0.249 **−0.183−0.1380.007−0.034−0.195 *−0.203 *
Note: FR = how many “friends” you currently have on SNSs; HR = hours spent on SNSs; F = Facebook; I = Instagram; T = Twitter; L = LinkedIn; Y = YouTube; W = work /professional reasons; P = personal reasons; Correlation is significant at the * = 0.05/** = 0.01/*** = 0.001 level (2-tailed).
Table 5. Correlation among the current number of friends, hours spent and satisfaction, importance, and SNS activities.
DimensionSWSPIWIPLookUpdatesPostCommentChat
FR−0.115−0.0250.0920.075−0.162−0.198 *−0.067−0.245 **−0.088
HR−0.018−0.0850.0290.122 0.098−0.066 0.108−0.020−0.246 **
Note: FR = how many “friends” you currently have on SNSs; HR = hours spent on SNSs; SW = SNSs satisfaction for professional reasons; SP = satisfaction for personal reasons; IW = SNSs importance for professional reasons; IP = SNSs importance for personal reasons; Correlation is significant at the * = 0.05/** = 0.01 level (2-tailed).
Table 6. Spearman’s rho correlation between satisfaction, importance, and SNS activities.
Private ActivitiesPublic Activities
DimensionSWSPIWIPLookChatUpdatesPostComment
SW1.0000.611 ***−0.194 *−0.278 **0.0720.1140.0720.252 **0.233 *
SP0.611 ***1.000−0.149−0.326 ***0.1090.0660.1090.259 **0.258 **
IW−0.194 *−0.1491.0000.713 ***−0.164−0.242 *−0.164−0.1270.031
IP−0.278 **−0.326 ***0.713 ***1.000−0.186−0.186−0.186−0.192 *−0.225 *
Note: SW = SNSs satisfaction for professional reasons; SP = satisfaction for personal reasons; IW = SNSs importance for professional reasons; IP = SNSs importance for personal reasons; Correlation is significant at the * = 0.05/** = 0.01/*** = 0.001 level (2-tailed).
Table 7. Convergent validity and internal consistency assessment of the reflective variables.
Latent Reflective VariableReflective IndicatorsOuter LoadingsCronbach’s AlphaComposite ReliabilityAverage Variance Extracted (AVE)
Private activities on social networks
(PRASN)
PRASN10.7470.4980.7960.662
PRASN20.875
Public activities on social networks
(PUASN)
PUASN10.7030.7460.8460.649
PUASN20.874
PUASN30.830
Social networks importance
(SNI)
SNI10.8870.8210.9150.844
SNI20.949
Social networks satisfaction
(SNSa)
SNSa10.9140.8220.9180.849
SNSa20.929
Table 8. Discriminant validity assessment for the reflective variables (HTMT criterion).
PRASNPUASNSNISNSa
Private activities on social networks (PRASN)
Public activities on social networks (PUASN)0.5704
Social networks importance (SNI)0.43670.1983
Social networks satisfaction (SNSa)0.20920.33830.3283
Table 9. Collinearity assessment among the predictor constructs (Inner VIF values).
PRASNPUASNSNISNSa
Private activities on social networks (PRASN) 11,32512,055
Public activities on social networks (PUASN) 11,32511,366
Social networks importance (SNI) 10,888
Social networks satisfaction (SNSa)
Table 10. Direct and total effects.
EffectDeviationT StatisticsP ValuesHypothesis
H1: PUASN → SNI−0.07570.13820.44160.6590Infirmed
H2: PUASN → SNSa 0.26120.09182.78970.0055Confirmed
H3: PRASN → SNI−0.26120.11862.18410.0294Confirmed
H4: PRASN → SNSa−0.02260.11610.21200.8322Infirmed
H5: SNI → SNSa−0.25770.09252.74650.0062Confirmed
Table 11. Predictive power assessment using the PLSpredict procedure.
IndicatorPLSLMRMSE PLS < RMSE LMMAE PLS < MAE LMPredictive Power
RMSEMAEQ²_predictRMSEMAE
SNSa10.71860.49850.01340.73100.5122YesYesHigh
SNSa20.74940.53980.02620.76190.5601YesYes
Note: PLS = prediction using PLS-SEM; LM = prediction using a linear model; RMSE = root mean squared error; MAE = mean absolute error.

