1. Introduction
Criteria weighting is an integral part of the multicriteria decision making (MCDM) models, that are widely applied in economics [
1], service quality [
2], talent identification process [
3], robotics [
4], healthcare [
5], social studies [
6], and other areas. Differences in the preference elicitations methodologies, transparency of the evaluation process, diversity of the opinions, and the competence of the decision-makers (DM) are the important factors affecting the final values of the criteria weights [
7]. People participating in the decision-making processes tend to have not only a different understanding of the problem addressed but also to the factors associated with it. Moreover, the increasing interest in public participation activities enlightened differences between expert evaluations and public opinion [
8]. Community involvement in the decision-making processes is particularly important when social, educational, environmental, and economic issues are addressed [
9]. Non-symmetry in the reflection of the public opinion might cause not only inaccuracies in the preference elicitation results but also the repulsive reactions to the decisions based on them. In these circumstances, the increased interest in the criteria weighting approaches that respect opinions of the wider audience was recently observed.
1.1. Survey-Based Data Collection
Face-to-face interviews and workshops are the most common practices to collect opinions of the target groups. When it is impossible or too expensive to interview respondents through the direct meeting, online surveys might be especially helpful [
10,
11]. However, survey-based preference elicitation should be carefully organized, since criteria weighting results might be meaningfully affected by the survey structure, construction of the questions, or even by the visual means of the measurement scales. When contrasting unrelated questions are assessed, different survey items should be presented on separate pages [
12,
13]. If the respondents are asked to give ratings concerning the different aspects of a single latent variable, all the survey items should be intentionally presented on the same (web) page [
14]. This particular way to present multiple, related items is called semantic differentials [
15].
Semantic differentials are typically expressed as the matrix questions, where preferences are presented on the matrix side, and the response scale is presented on the top of it. Due to the ability to place multiple estimates on a single page, these structures are commonly used to collect public opinions on the quality, satisfaction, and the importance of the analyzed items [
14]. Moreover, since humans are much better at making comparative judgments than the absolute ones [
16,
17], matrix questions might be valuable to increase the accuracy of the direct weighting techniques.
1.2. Matrix Questions and the Response Scales
Matrix questions are usually constructed when several questions about a similar idea should be assessed using the chosen measurement scale. Likert-type scales are typically expressed as the set of radio buttons, representing five or more discrete categories dedicated to revealing respondents’ current state, feelings, or traits [
18]. Since Likert-type scales are easily understandable, they are frequently met in the online surveys. However, the ambiguous number of response categories is the important disadvantage of these scales. Moreover, intervals between values cannot be presumed to be equal, and the biases induced by the ordinal data points might cause adversative effects on the calculations of the statistical measures like mean, covariance, correlations, or the reliability coefficients [
19].
Issues inherent from the Likert-type measurement increased scientists’ interests in the alternative scales [
17]. Research on the historical origin of the semantic differentials revealed that they were initially made from the continuous scales, also known as the visual analogue scales (VAS). A VAS is typically presented as a horizontal line, anchored with two verbal descriptors at the extremes. A respondent indicates his opinion by placing a marker at the most appropriate point. Since VAS uses a line continuum to measure latent traits and to obtain data measurements, they are able to present weighting results without the constraints raised by the limited number of the response categories [
20,
21]. Fine-grained responses aid in reducing measurement error for both the value-based and the rank-based valuations. Since VAS scales produce interval-level measurement data, they are also better suited for statistical and mathematical algorithms [
22].
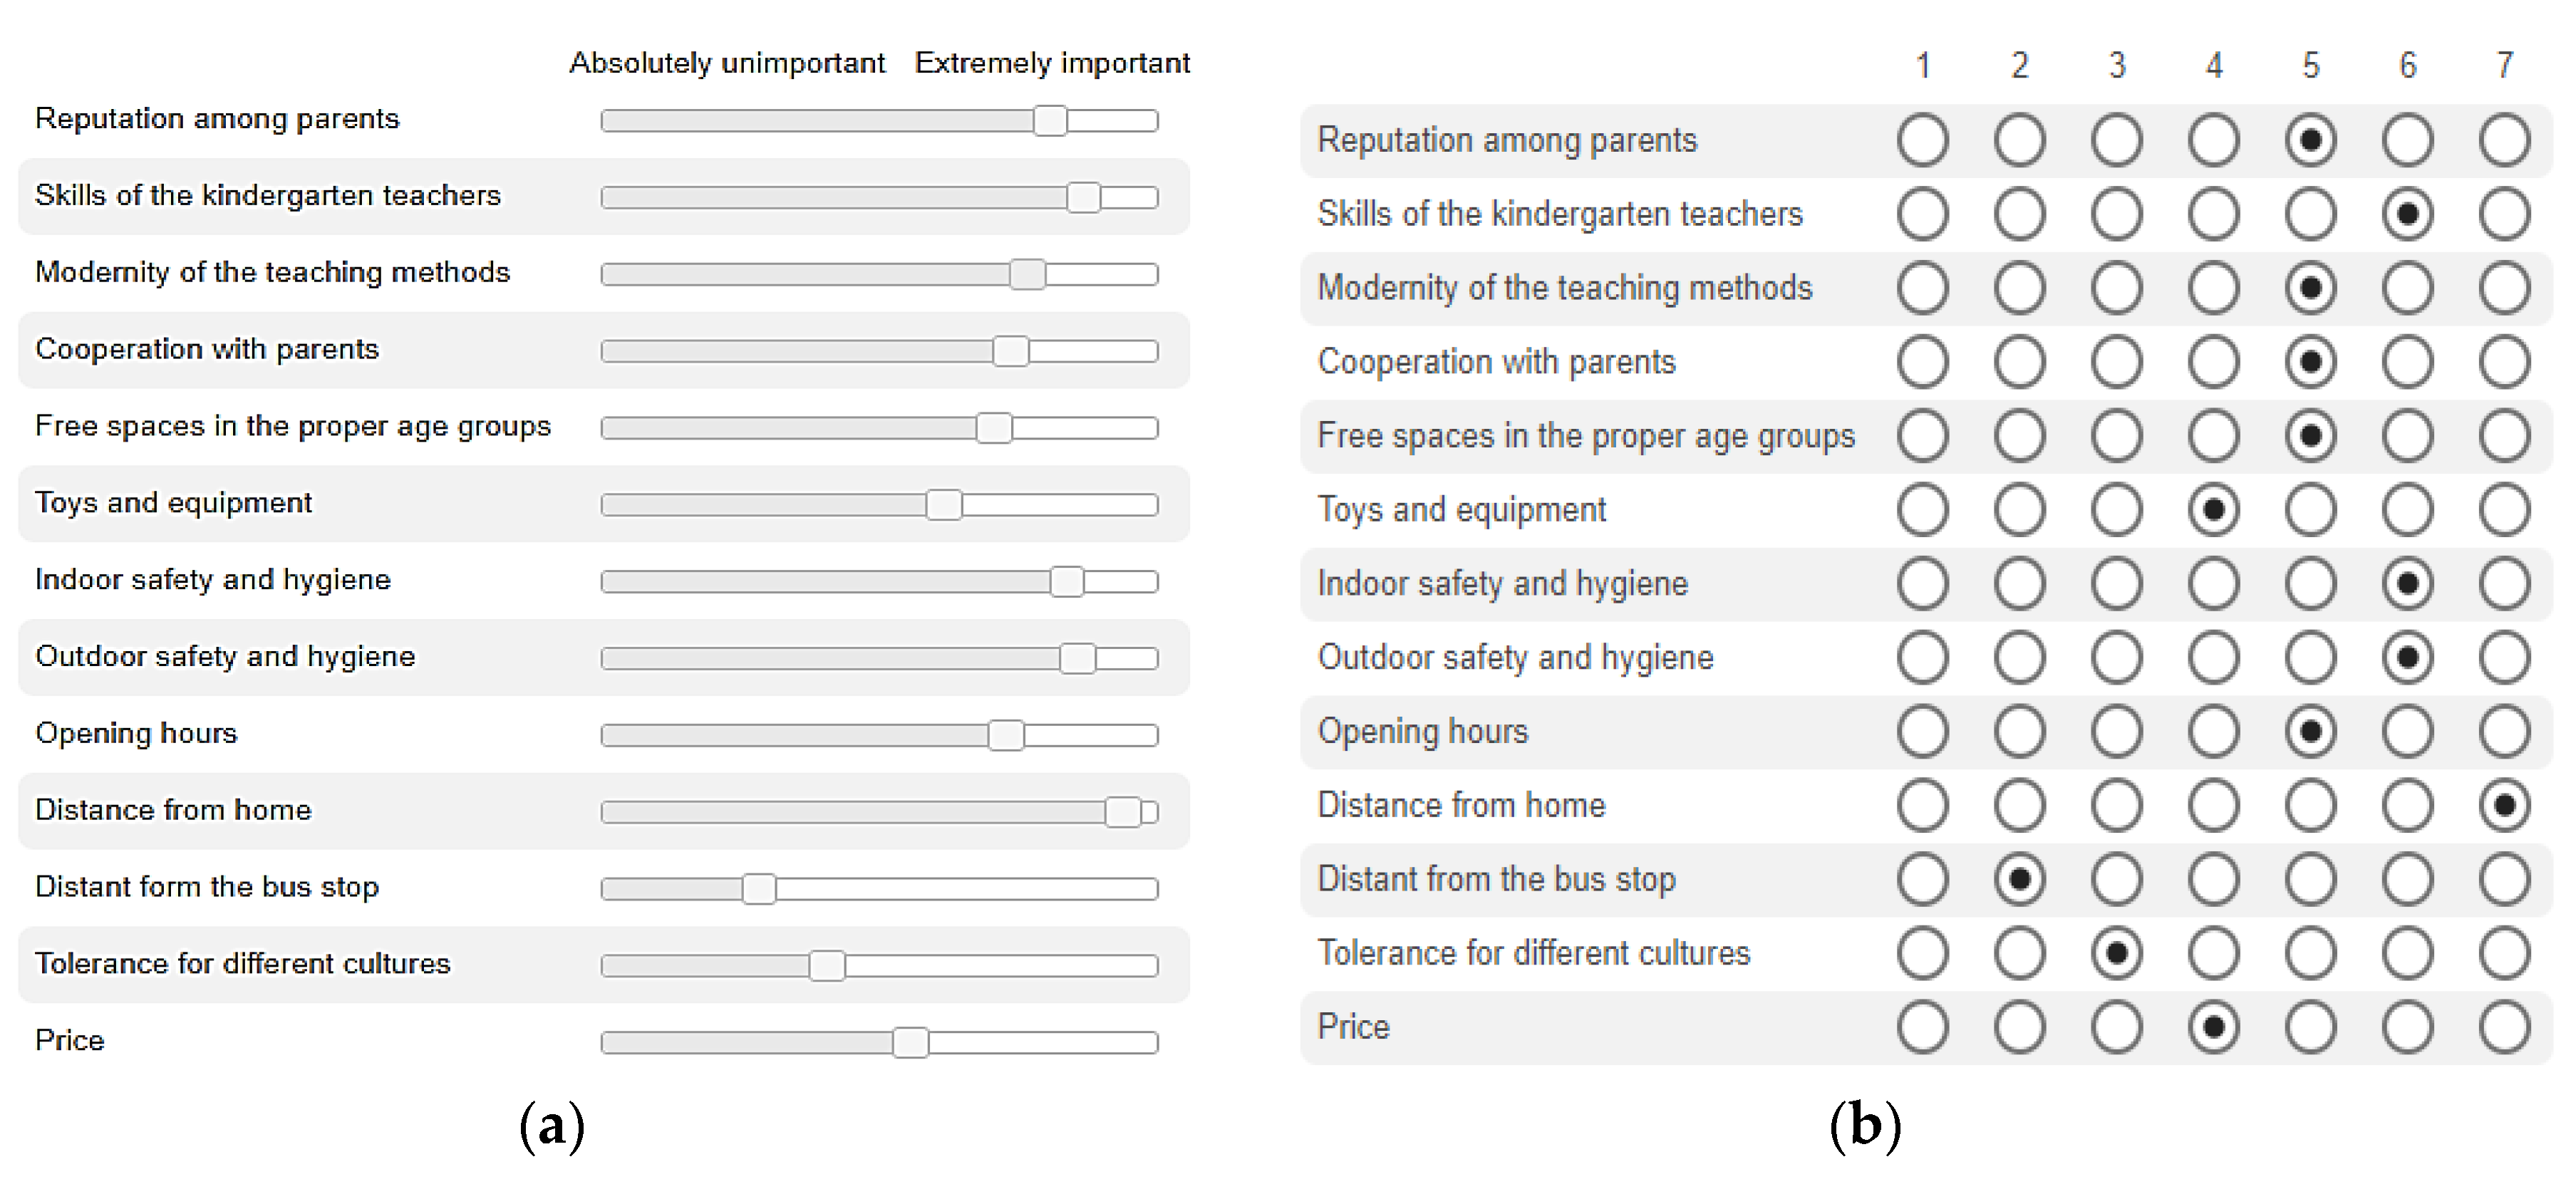
VAS matrix is a set of the VAS scales placed in a single question. Since twofold data like the importance value and the ranking information can be gathered from a single VAS matrix, it might be successfully exploited for the preference elicitation tasks [
23]. Besides, the high degree of details in the VAS scales is exceptionally beneficial when small differences can be detected between the evaluated subjects [
24]. For instance, if 13 criteria ought to be assessed on the 7-point Likert scales, criteria of the different importance might fall into the same category making them indistinguishable from one another (
Figure 1).
As can be seen, VAS scales are highly sensitive to the respondent’s opinion. Due to this sensitivity, VAS scales are widely applied in medical studies and other areas where small differences might be significant.
1.3. Uncertainty of the Collected Data
VAS scales are easy to understand, administer, and score when implemented in online surveys [
25]. Survey-based weighting processes are typically accompanied by the biases of the evaluators and the uncertainty of the experimental conditions. End-aversion bias and the positive skew are also the companions of the VAS scales [
26]. End-aversion bias refers to the respondents’ reluctance to use extreme categories such as “extremely important” or “absolutely unimportant”. It does not affect the mean values of the respondent group, but it reduces the variance of the recorded scores [
27]. Positive skew refers to the data distribution situation when the responses are not evenly distributed over the range of the scale but show a positive skew towards the favorable end [
28].
Both the end-aversion bias and the positive skew suppose that data points belonging to the different ranges of the VAS scales should be treated unequally. Cautious attitude toward the psychometric features of the response scales and the uncertainty of the collected data is required to ensure the accuracy of the criteria weighting results. A new preference elicitation technique that uses the VAS Matrix for the survey-based data collection and employs the appropriate data processing approach to reduce the uncertainties of the collected data is going to be presented in this paper.
2. Criteria Weighting Approaches
Determination of the criteria weights is an important step of the decision-making processes related to the current state of the economic, social, or environmental aspects [
5,
29]. Since there is no unique classification of the criteria weighting methods, preference elicitation can be divided into statistical and algebraic, direct and indirect, subjective and objective, compensatory and non-compensatory techniques [
30].
2.1. Subjective and Objective Techniques
Subjective, objective, and integrated approaches are widely used for preference elicitation. Subjective weights are determined solely according to the preference of the decision-makers. This type of preference elicitation is mostly based on pairwise comparison methods like AHP (Analytic Hierarchy Process) [
31], DEMATEL (Decision-making Trial and Evaluation Laboratory) [
32], SWARA (Step-Wise Weight Assessment Ratio Analysis) [
33], or PIPRECIA (Pivot Pairwise Relative Criteria Importance Assessment) [
34]. Objective weights are typically applied then the influence of the individual decision-makers should be reduced. The most well-known objective weighting approaches are the entropy method [
35], CRITIC (Criteria Importance Through Intercriteria Correlation) [
36], FANMA methods [
37].
Since the subjective judgments are noticeably affected by the knowledge and experience of the decision-makers, most of the time, weights determined by subjective approaches neglect the objective information [
38]. The integrated preference elicitation approaches can be used to achieve the more accurate values of the criteria weights [
39]. These approaches focus on the principle of integrating the subjective weights based on the expert’s opinion and the information gathered from the criteria data in a mathematical form. For instance, Wang and Lee [
40] proposed to integrate objective weights calculated by Shannon’s entropy [
35] and the subjective weights determined directly by the decision-makers. Saad et al. [
41] proposed to weight the criteria combining the Fuzzy Shannon entropy and the subjective weights calculated as the averages of the direct valuations gathered from three decision-makers. The integrated approach that combines objective and subjective weights calculated from the same survey data will be presented in this paper.
2.2. Direct Weighting Approaches
Most of the currently used subjective approaches are based on the opinions of the specially trained experts [
39]. Subjective weights calculation from the survey data is much rarer.
Theoretically, the VAS matrix might be exploited to collect data for the preference elicitation based on the pairwise comparisons. PIPRECIA-E [
34] is an example of the pairwise comparison technique that might be used to obtain the attitudes of the respondents that were not specially trained for the criteria weighting. However, it should be mentioned that pairwise comparison is highly sensitive to the data loss caused by the respondent’s unwillingness to assess all the criteria. Since a high level of the missing data is normally generated in the survey-based preference elicitation, application of the pairwise comparisons techniques might be especially challenging. Due to the nature of the pairwise comparison, responses, where at least one criterion is not weighed, should be omitted. Such a data cleaning procedure drastically reduces the number of responses; therefore, it might be an important disadvantage of its exploitation for the survey-based criteria weighting.
Direct weighting techniques are the most commonly used for online preference elicitation. In the direct methods, the decision-maker compares criteria by using a ratio scale, whereas, in indirect methods, criteria weights are calculated based on the preferences of the decision-maker [
30]. Direct weighting approaches like the SWING [
42], SMARTS [
43], SMARTER [
43], direct rating [
44], and the point allocation [
44] were recently used in a survey-based preference elicitation [
9,
45,
46].
SWING method implies the construction of the extreme hypothetical scenarios, where initially a hypothetical worst-case scenario is presented, and then the criterion that might be enhanced to improve the overall situation the most is identified as the most important criterion which gets 100 points. All other criteria are weighted in a similar manner and get the point values less than 100 points.
In SMART (Simple Multi-Attribute Rating Technique) the order of the criteria importance is determined primarily and then, starting from the least important criterion, the relative importance of the criteria is assigned in the ascending order. SMARTS and SMARTER are elaborated versions of SMART [
43]. SMARTS imply the procedure for determining criteria weights by comparing criteria with the best and the worst criterion from a defined set of criteria. SMARTER (SMART Exploiting Ranks) uses the centroid method to determine criteria weights [
47].
Point allocation (PA) and direct rating (DR) are two relatively simple techniques that have lots in common but produce systematically different weighting results [
44]. Decision-makers are asked to allocate 100 points among the analyzed criteria when the PA is applied. In the DR methodology, each object is separately assessed on a scale from 0 to 100. Since DR weights do not add up to 1 (100%), they should be normalized at the final stage of the preference elicitation. Direct rating is highly recommended when the performance evaluation relies on a large number of the criteria and when a respondent does not feel comfortable using complex weighting methods. Moreover, the weights elicited by DR are more reliable than those elicited by PA [
44]. However, a little variation of the averaged weights is repeatedly identified as the downside of the straightforward DR technique [
48].
2.3. VAS Matrix for the Criteria Weighting
VAS matrix can be used as the data collection tool in the survey-based decision. For instance, VAS scales are implemented in the SEIQoL methodology, which is widely used to nominate, weight, and rate different aspects of life quality [
49]. SEIQoL with a direct weighting technique (SEIQoL-DW) is an interview-based tool that involves the interviewer to manage the evaluation process. The respondents are asked to nominate the five most important areas of their life (domains) in these semistructured interviews. For the evaluation of the importance of these domains, point allocation weighting is applied. Vertical VAS matrix with five adjacent VAS scales is used to assess the current functioning in the chosen domains. Finally, five separate indexes are calculated summing up the products of the functioning level and the relative weights.
Such a methodology is widely applied in various studies [
50]. However, experiments with the SEIQoL-DW revealed that looking at the VAS matrix respondents comprehends the task as the assessment of the domain importance rather than the scoring of their functioning at the research moment [
49].
Burckhardt et al. [
46] proposed to employ VAS scales and the direct weighting for both the scoring and the weighting of the chosen domains. He also excluded the interviewer from the experiment and used a self-explanatory paper questionnaire to collect the data. In total, 100 participants were involved in this research. Since the averaged values of the VAS based DR technique showed a tendency toward the low variability of the domain weights, the usefulness of the improved methodology was highly questioned. Nevertheless, it must be noted that neither the subjectivity of the respondents nor the psychometric features of the VAS scales were analyzed in the domain importance assessments. We strongly believe that these aspects should be cautiously analyzed when the survey-based criteria weighting is performed.
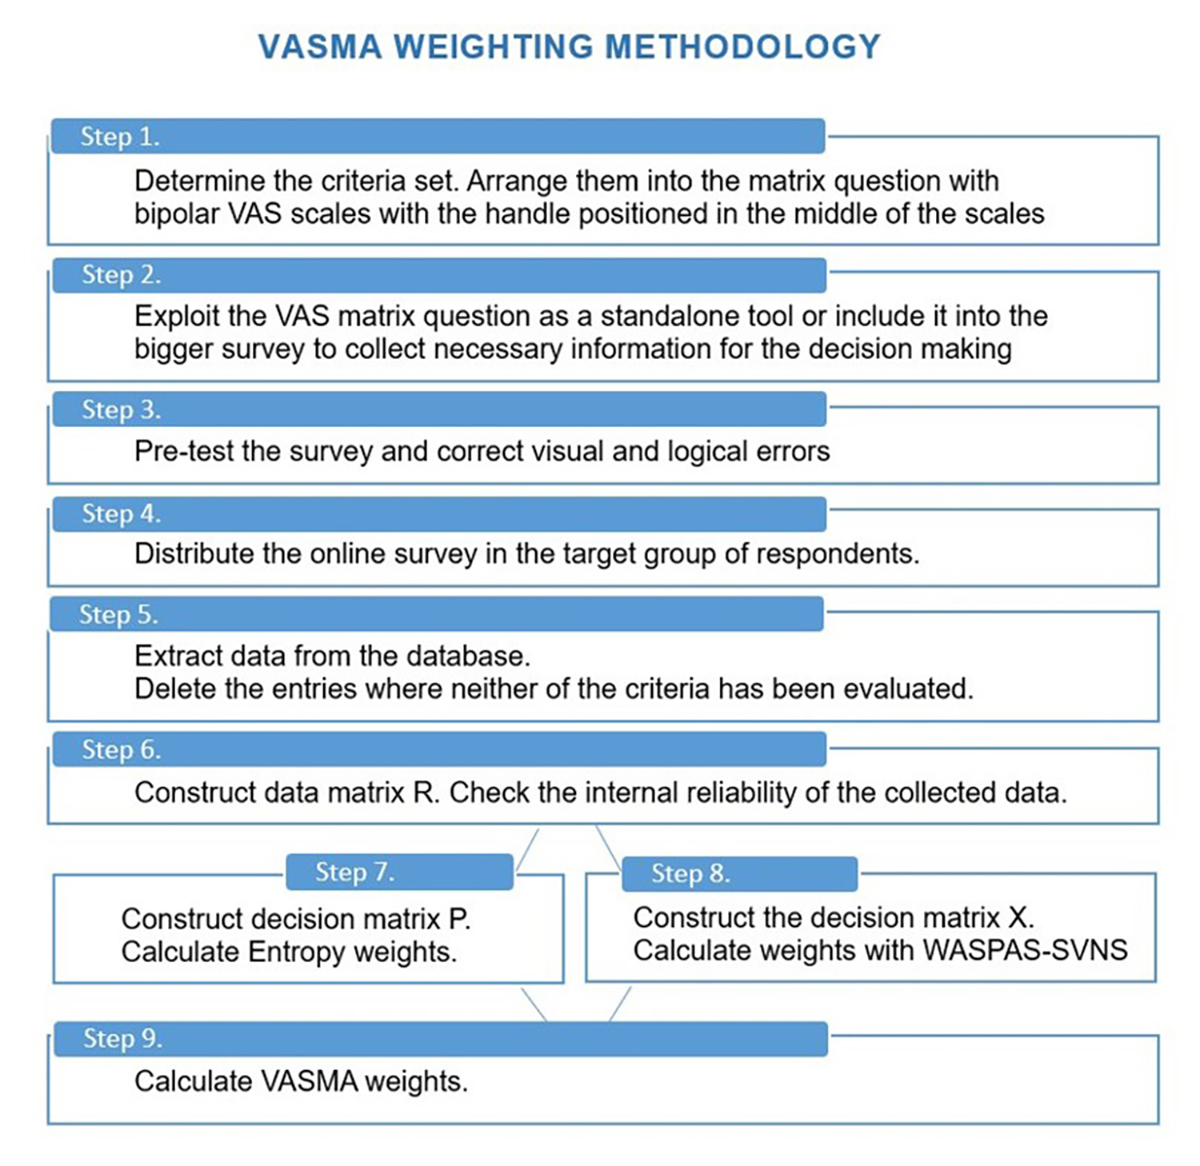
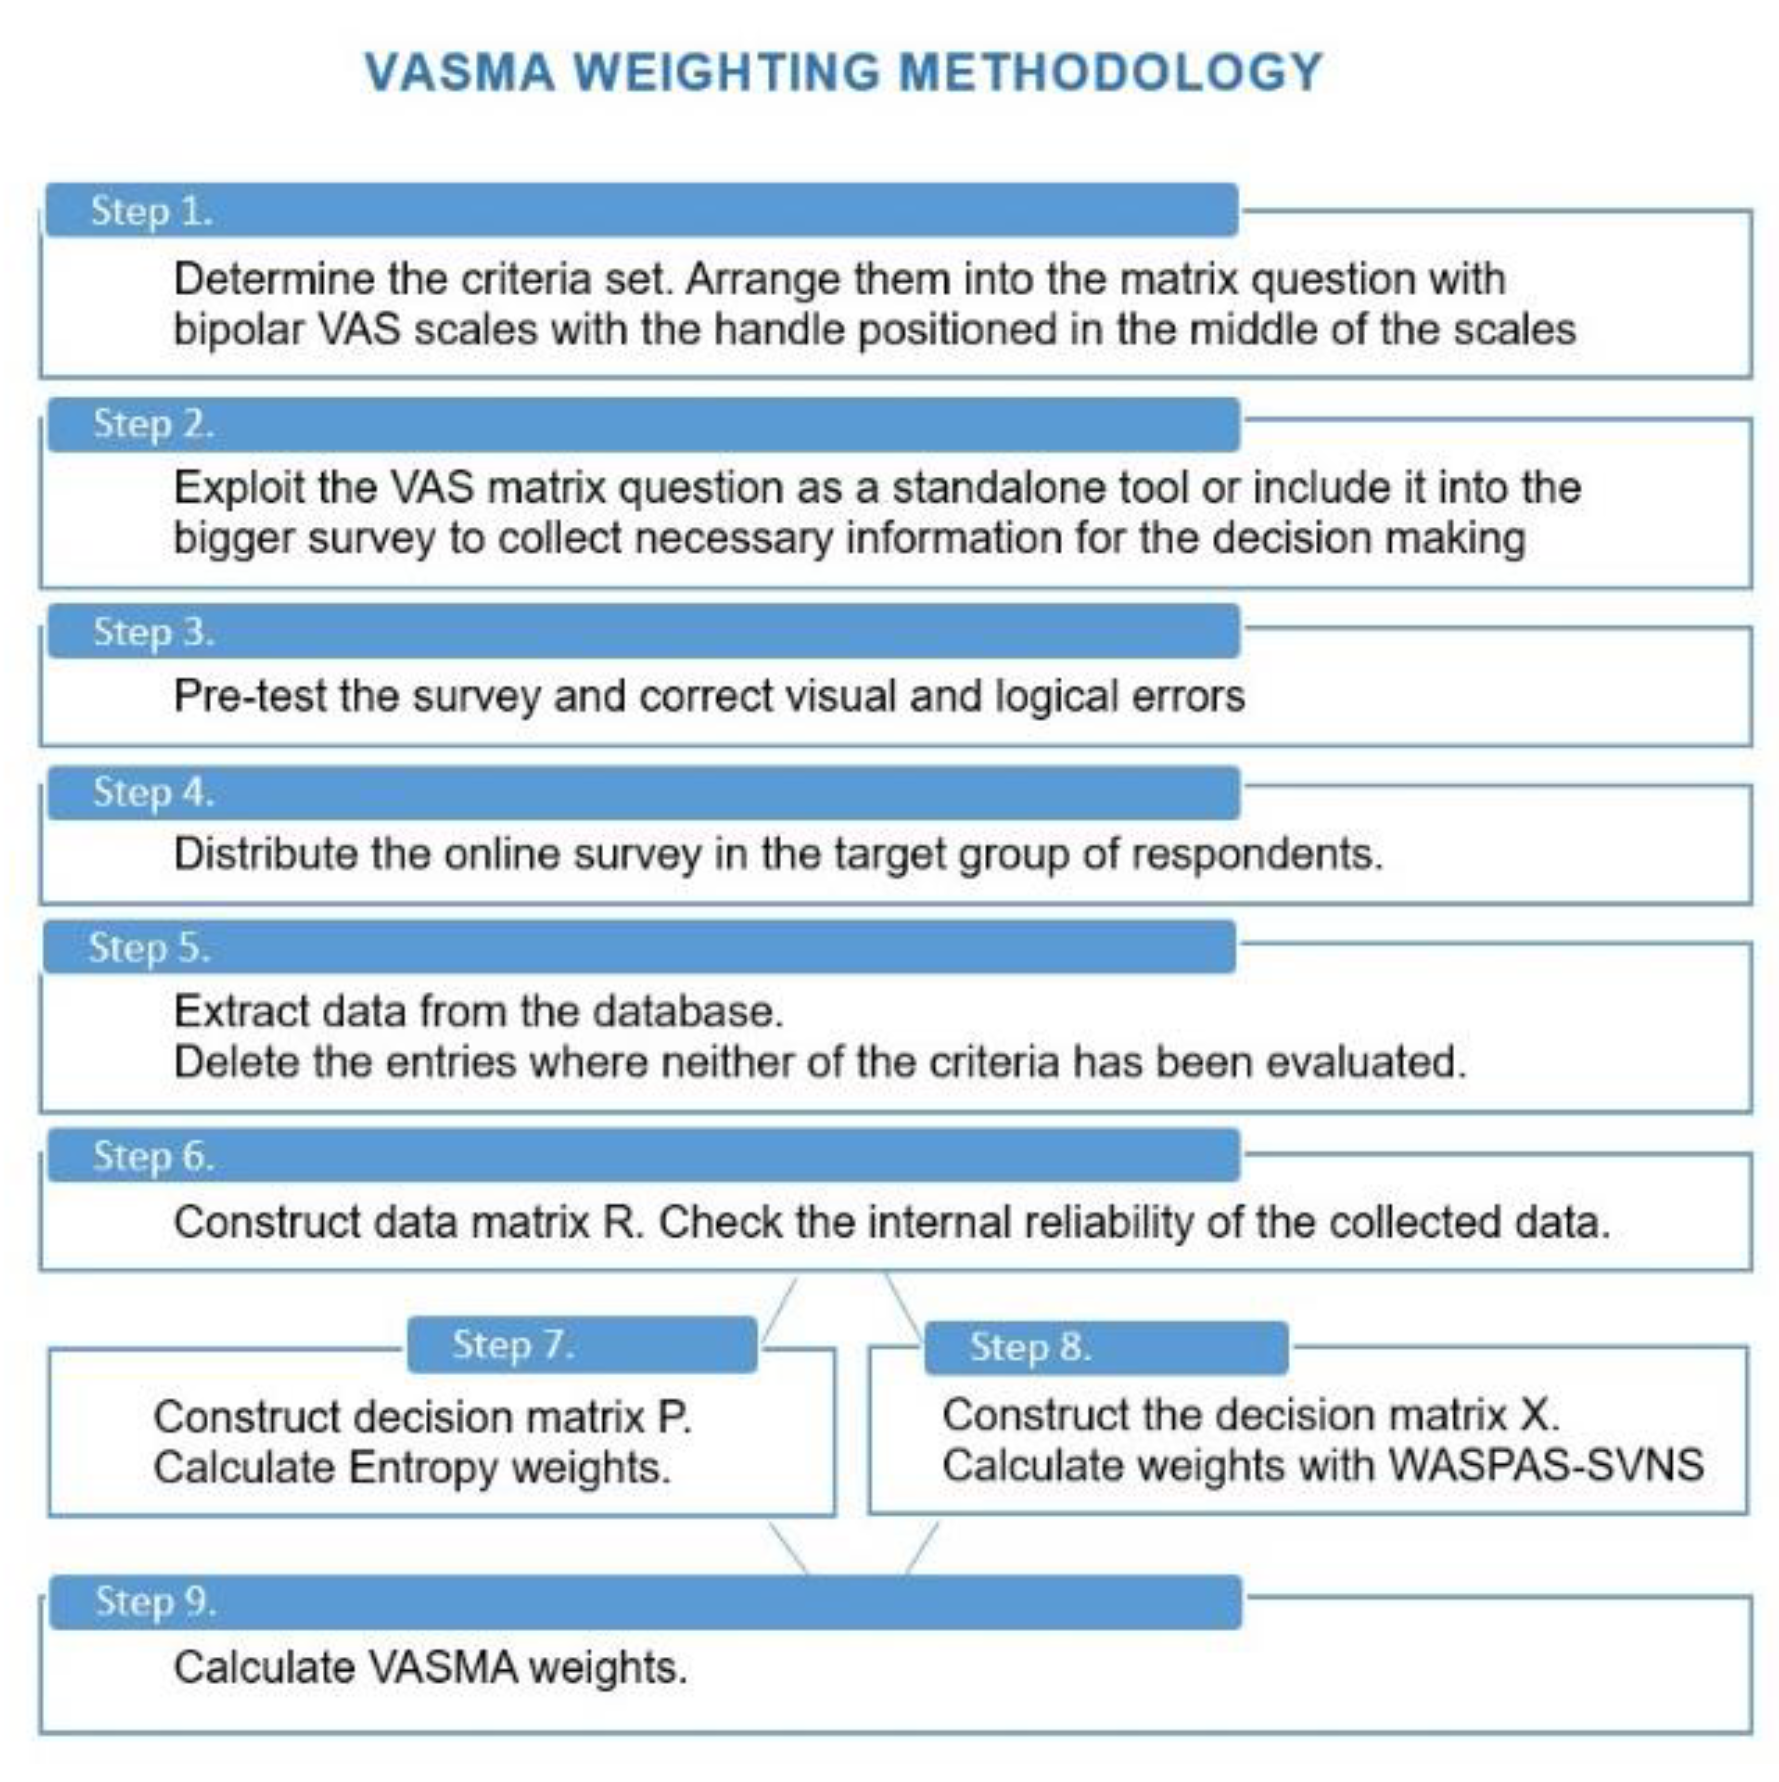
3. VASMA Weighting Methodology
VASMA weighting (VAS Matrix for criteria weighting) is an easy to apply survey-based criteria weighting technique. It employs WASPAS-SVNS for the determination of the subjective weights and analyzes information entropy for the determination of the objective weights. VASMA weighting is constructed to decrease the uncertainties noticed in the survey-based criteria evaluation preserving the simplicity of the DR alike data collection. The overall VASMA weighting methodology is presented in
Figure 2.
Answers provided by the respondents of the online survey are extracted from the survey database and saved in the data matrix
consisting of the values
:
Here denote the number of the criteria and denote the number of the respondents.
All the evaluations are automatically transformed from the VAS scales to the integer numbers. The linguistic value at the negative anchor (“Absolutely unimportant”) is determined as 1, and the linguistic value at the positive anchor (“Extremely important”) is determined as 100. Other values are calculated as the distance between these two values. If the respondent did not move a marker from the default position and left it in the middle of the VAS scales, we assume that he did not express his opinion on the specific criterion , therefore the . Finally, the simple data cleaning procedure must be done deleting the entries where the respondent did not evaluate either of the criteria .
Data saved in the matrix is later exploited to construct two different matrixes and . Decision matrix is used to calculate the entropy weights; the decision matrix is constructed to calculate subjective weights via the WASPAS-SVNS approach. The matrixes and and their usage for the VASMA weighting will be explicitly described in the following subsections.
3.1. Entropy Weights Calculation
In most of the survey-based research, respondent characteristics are assumed to be constant across respondents. This assumption should be critically accepted since it is just hypothetically possible that all the respondents would be able to read and interpret survey items unanimously. Since such uncertainty might meaningfully affect the quantity of information in the responses, VASMA weighting is constructed in a specific way, ensuring that valuations providing different amounts of information would be treated differently [
51]. In 2016, Friesner et al. [
52] made an extensive analysis of how entropy-based information theory might be applied to evaluate survey items with multiple-choice responses. A similar methodology is going to be applied to calculate entropy weights and to deal with the ambiguity among respondents.
3.1.1. Construction of the Decision Matrix
Data from the data matrix
should be transformed into the decision matrix
, where
is the proportion of response
for the criteria
:
For each of the possible responses
,
is calculated by Equation (3):
Here is the number of the non-zero assessments for the criterion . is a binary indicator that gives a value of 1 if the respondent gave the response for the criteria , otherwise . Consistent with most statistical principles, the proportions of the responses should follow three rules: and and .
3.1.2. The Degree of the Information Entropy
Information entropy
is calculated for each of the
elements and aggregated through the set of possible responses:
Normalization of the
is performed dividing the
by the maximum entropy attainable over the
possible survey items. For every value
entropy is maximized when
. Therefore, the normalized entropy is calculated by Equation (5):
3.1.3. The Entropy Weights
Finally, the entropy weights
are calculated as the level of change in each criterion
l:
By focusing on the distribution of responses, the entropy measure simultaneously encompasses measures of central tendency and the data variability.
3.2. WASPAS-SVNS for the Calculation of Subjective Weights
The uncertainty caused by the psychometric features of the VAS scales is going to be reduced, employing the Weighted Aggregated Sum Product Assessment extended by single-valued neutrosophic sets (WASPAS-SVNS). WASPAS was initially presented by Zavadskas et al. [
53] and later extended by single-valued neutrosophic sets (WASPAS-SVNS) that are the extension of the intuitionistic fuzzy sets. WASPAS and its modifications are widely used for various multicriteria decision-making tasks [
29,
54,
55,
56]. We believe that WASPAS-SVNS also might be valuable to deal with the uncertainty caused by the end aversion and the positive skew of the VAS based preference elicitation. To the best of our knowledge, there is not any research where WASPAS would be applied in the criteria weighting process.
3.2.1. Construction of the Decision Matrix
Decision matrix
, where
is the number of
variable and
is the number of the criteria
has to be constructed prior to the other steps of the WASPAS-SVNS approach:
Six variables are determined to assess each of the preferences . Five variables analyze the nominal aspects of the collected data, and the sixth of them examines the ordinal information extracted from the matrix .
Nominal variables. Nominal variable for the criterion
l is expressed as the frequency of the values
belonging to the predefined interval [a,b].
is a binary indicator that gives a value of 1 if
. Otherwise,
Nominal variables V1–V5 for each of the criterions
l are determined as the matrix
X elements
via the Equation (8).
here
is the total number of the respondents participated in the survey,
is the amount of the non-zero assessments
for the criterion
.
Ranges [a,b] for the nominal variables V1–V5 were determined based on the medical research where VAS scales are widely used in pain studies. The physical manifestation of the pain is measured as the linear distance in the VAS scales of 100 mm length. It was revealed that VAS ratings of 0–4 mm might be considered as no pain; 5–44 mm—mild pain; 45–74 mm—moderate pain; 75–100 mm—severe pain, and 100 mm means the worst imaginable pain [
57]. Similar intervals were determined as the five importance groups of the VAS scales (
Table 1).
Ordinal variable. VAS matrix provides a possibility to rank the several latent criteria visually. Scientific research proved that respondents actively use this feature and increase the precision of their answers. For instance, if the pointer of the VAS scales presenting the criterion
is moved to the right side more comparing with the others (
Figure 1), it can be understood as criterion
is the most important for the respondent
. This concept can be used to determine the new variable called Overanking level (OVL). The OVL level for the criterion
is calculated individually for all the respondents
by the following algorithm:
The ordinal variable V6 of the criterion
l (
Table 1) is calculated as the average of the
aggregated through the total amount of respondents:
here
is the amount of the non-zero values
for the criterion
.
The final set of the predefined variables and their optimums for the MCDM process is presented in
Table 1.
3.2.2. The Weighting of the Predefined Variables
Three experts working as the data analysts were introduced with the different aspects of the VAS matrix. Then they were asked to weight all the variables according to the SMARTS methodology. At first, all the experts found a consensus that both the cardinal and ordinal information is equally important for the final decision, therefore the sum of the weights for the variables V1–V5 should be equal to the variable V6.
At the next step, experts ranked all the cardinal variables according to their importance for the criteria weighting and the psychometric features of the VAS scales. Due to the positive skew that can be typically observed in the VAS based valuations, the lowest importance was set to the preference valuations where . The highest importance was determined for the VAS values when . Due to the tendency towards the positive assessment, critical opinions encountered in the variables V1 and V2 were considered more important than the positive ones (V3, V4). The final ranking order of the nominal variables was determined as V3 < V4 < V2 < V1 < V5. The relative scores were assigned to V4, V2, and V1 considering their trade-off to the variables V3 and V5.
3.2.3. Preference elicitation by the WASPAS-SVNS Approach
The WASPAS-SVNS approach can be deconstructed into several steps [
54]:
- 1.
Construction of the decision matrix where is the value of the of variable for the ithalternative (criteria).
- 2.
Vector normalization of the element
:
- 3.
The neutrosophication and calculation of the neutrosophic decision matrix
. Matrix
is composed of the single-valued neutrosophic numbers
, where
means the membership degree,
is indeterminacy degree, and
is a non-membership degree. Standard conversion between crisp normalized values
and neutrosophic numbers
was applied [
29].
- 4.
Calculation of the first decision component
is done by formula:
The sum of the total relative importance of the
alternative is used to calculate
. The
and
are the values related with the criteria that should be maximized;
and
are associated to the criteria that should be minimized. Criteria weights
and
are the arbitrary positive real numbers,
and
are the amount of the maximized and minimized criteria. The following algebra operations should be applied for the single-valued neutrosophic numbers:
here
and
.
- 5.
Calculation of the second decision component
is done by the formula:
value is based on the product of total relative importance in the ith alternative
- 6.
Joint generalized criteria is computed by:
- 7.
The final weights of the criteria importance are determined considering the descending order of the score function
which is used for the deneutrosophication of the joint generalized criteria:
3.3. VASMA Weights
VASMA weights
are calculated as the combination of the entropy weights
and the WASPAS-SVNS weights
:
here
1, 2 …,
l is the index of the analyzed criterion.
4. Numeric Example
Children’s care always has been the focus of governmental institutions since early childhood education is recognized as the basis for lifelong learning and development. Nowadays, kindergartens not only provide childcare but also perform protective, emotional, socializing, and educational functions [
58]. Since parent’s contribution to their child’s education is increasingly growing, parental opinion and understanding of the kindergarten quality is becoming an important topic. Besides, a clear understanding of parents’ opinions might help public authorities not only to improve the provision of services but also to ensure proper distribution of the public investments. Since organizing of the parental meetings is a time-consuming and human-intensive process, online surveys are the easiest way to find out what parents think.
4.1. Survey Construction and Distribution
The online survey consisting of 15 separate questions was prepared to find out parents’ opinions on the quality of state kindergartens operating in Vilnius (capital of Lithuania). VAS Matrix was placed as the sixth question, where respondents were asked to indicate how important the analyzed criteria are for the search of the most suitable kindergarten for their children. Thirteen criteria adapted from the research of Malović [
58] were presented in the VAS matrix. Continuous bipolar VAS scales with the single tick mark at the center of the scales were used. The anchors were named as
“Extremely important” and
“Absolutely unimportant” (
Figure 1). All the texts were provided in Lithuanian, which is the national language of most of the respondents. The target audience was reached through the parents’ groups already existing in the social networks. The survey took place just before the start of the new school year (at the end of August 2019). Since the survey had to be completed online, respondents were free to choose at what time of day to conduct the survey.
A total of 133 individuals completed the online survey. The results of three respondents were excluded from further study because they did not move any of the sliders in the VAS matrix. The demographic profile of all the rest of the respondents is presented in
Table 2.
4.2. Data Extraction from the Survey Database
Data collected with the VAS matrix was automatically converted to the data matrix
, where columns denote the set of criteria, and rows denote the ID of the respondent (
Table 3). Records where
depict situations when neither of the VAS markers were moved from their default position. We assumed these cases as non-response values.
Descriptive statistics of the data collected via the preference elicitation process performed by the VAS Matrix are presented in
Table 4. None of the criteria were assessed by all of the 130 respondents analyzed in the study.
4.3. Reliability of the Collected Data
Analysis of the collected data also revealed that only a quarter (27.16%) of the respondents moved all 13 sliders provided in the VAS matrix. It means that three-quarters of the respondents evaluated less than 13 criteria during the experiment. Since all the responses where single and more criteria are assessed contribute in the construction of the data matrix (Equation (1)), it is necessary to make sure that the data collected during the survey can be trusted.
Both the Cronbach’s Alpha and the Split-Half techniques (with Spearman and Brown correction) were employed to determine the internal reliability of the collected data. The calculated value for the
Split-Half technique was 0.9772, and the total
Cronbach’s Alpha reliability coefficient was 0.9861 (
Table 4). It means that the overall internal reliability of the collected data is very high. Cronbach’s Alpha for all the 13 criteria also showed very high reliability (0.9189 to 0.9494). It is assumed that internal data reliability is appropriate if the value of the Alpha coefficient/ is at least 0.7.
4.4. Calculation of the Entropy Weights
The objective part of the VASMA weights was calculated applying the principles of the information entropy. Decision matrix
, where columns denote the set of criteria and rows denote the possible values k of the VAS scales
was constructed from the data matrix
(
Table 3).
Values
presented in
Table 5 describe the proportion of responses
for the analyzed criterion
(
and
). The calculation of the entropy weights presented in
Table 6 is explicitly described in
Section 3.2.
4.5. Calculation of the WASPAS-SVNS Weights
The subjective part of the VASMA weights was calculated as the MCDM task where WASPAS-SVNS is involved for the preference elicitation. Decision matrix
(
Table 7), where columns denote variables V1–V6 and rows denote the analyzed preferences, was also constructed from the data matrix
(
Table 3). Construction of the decision matrix
and the variables V1–V6 are explicitly described in the
Section 3.2.
WASPAS-SVNS weights calculated as the score function for deneutrosophication of the joint generalized criteria are presented in
Table 8.
4.6. Calculation of the VASMA Weights
VASMA weights were calculated from the entropy weights
and the subjective weights
by the Equation (23). The final VASMA weights and their ranks are presented in
Table 9.
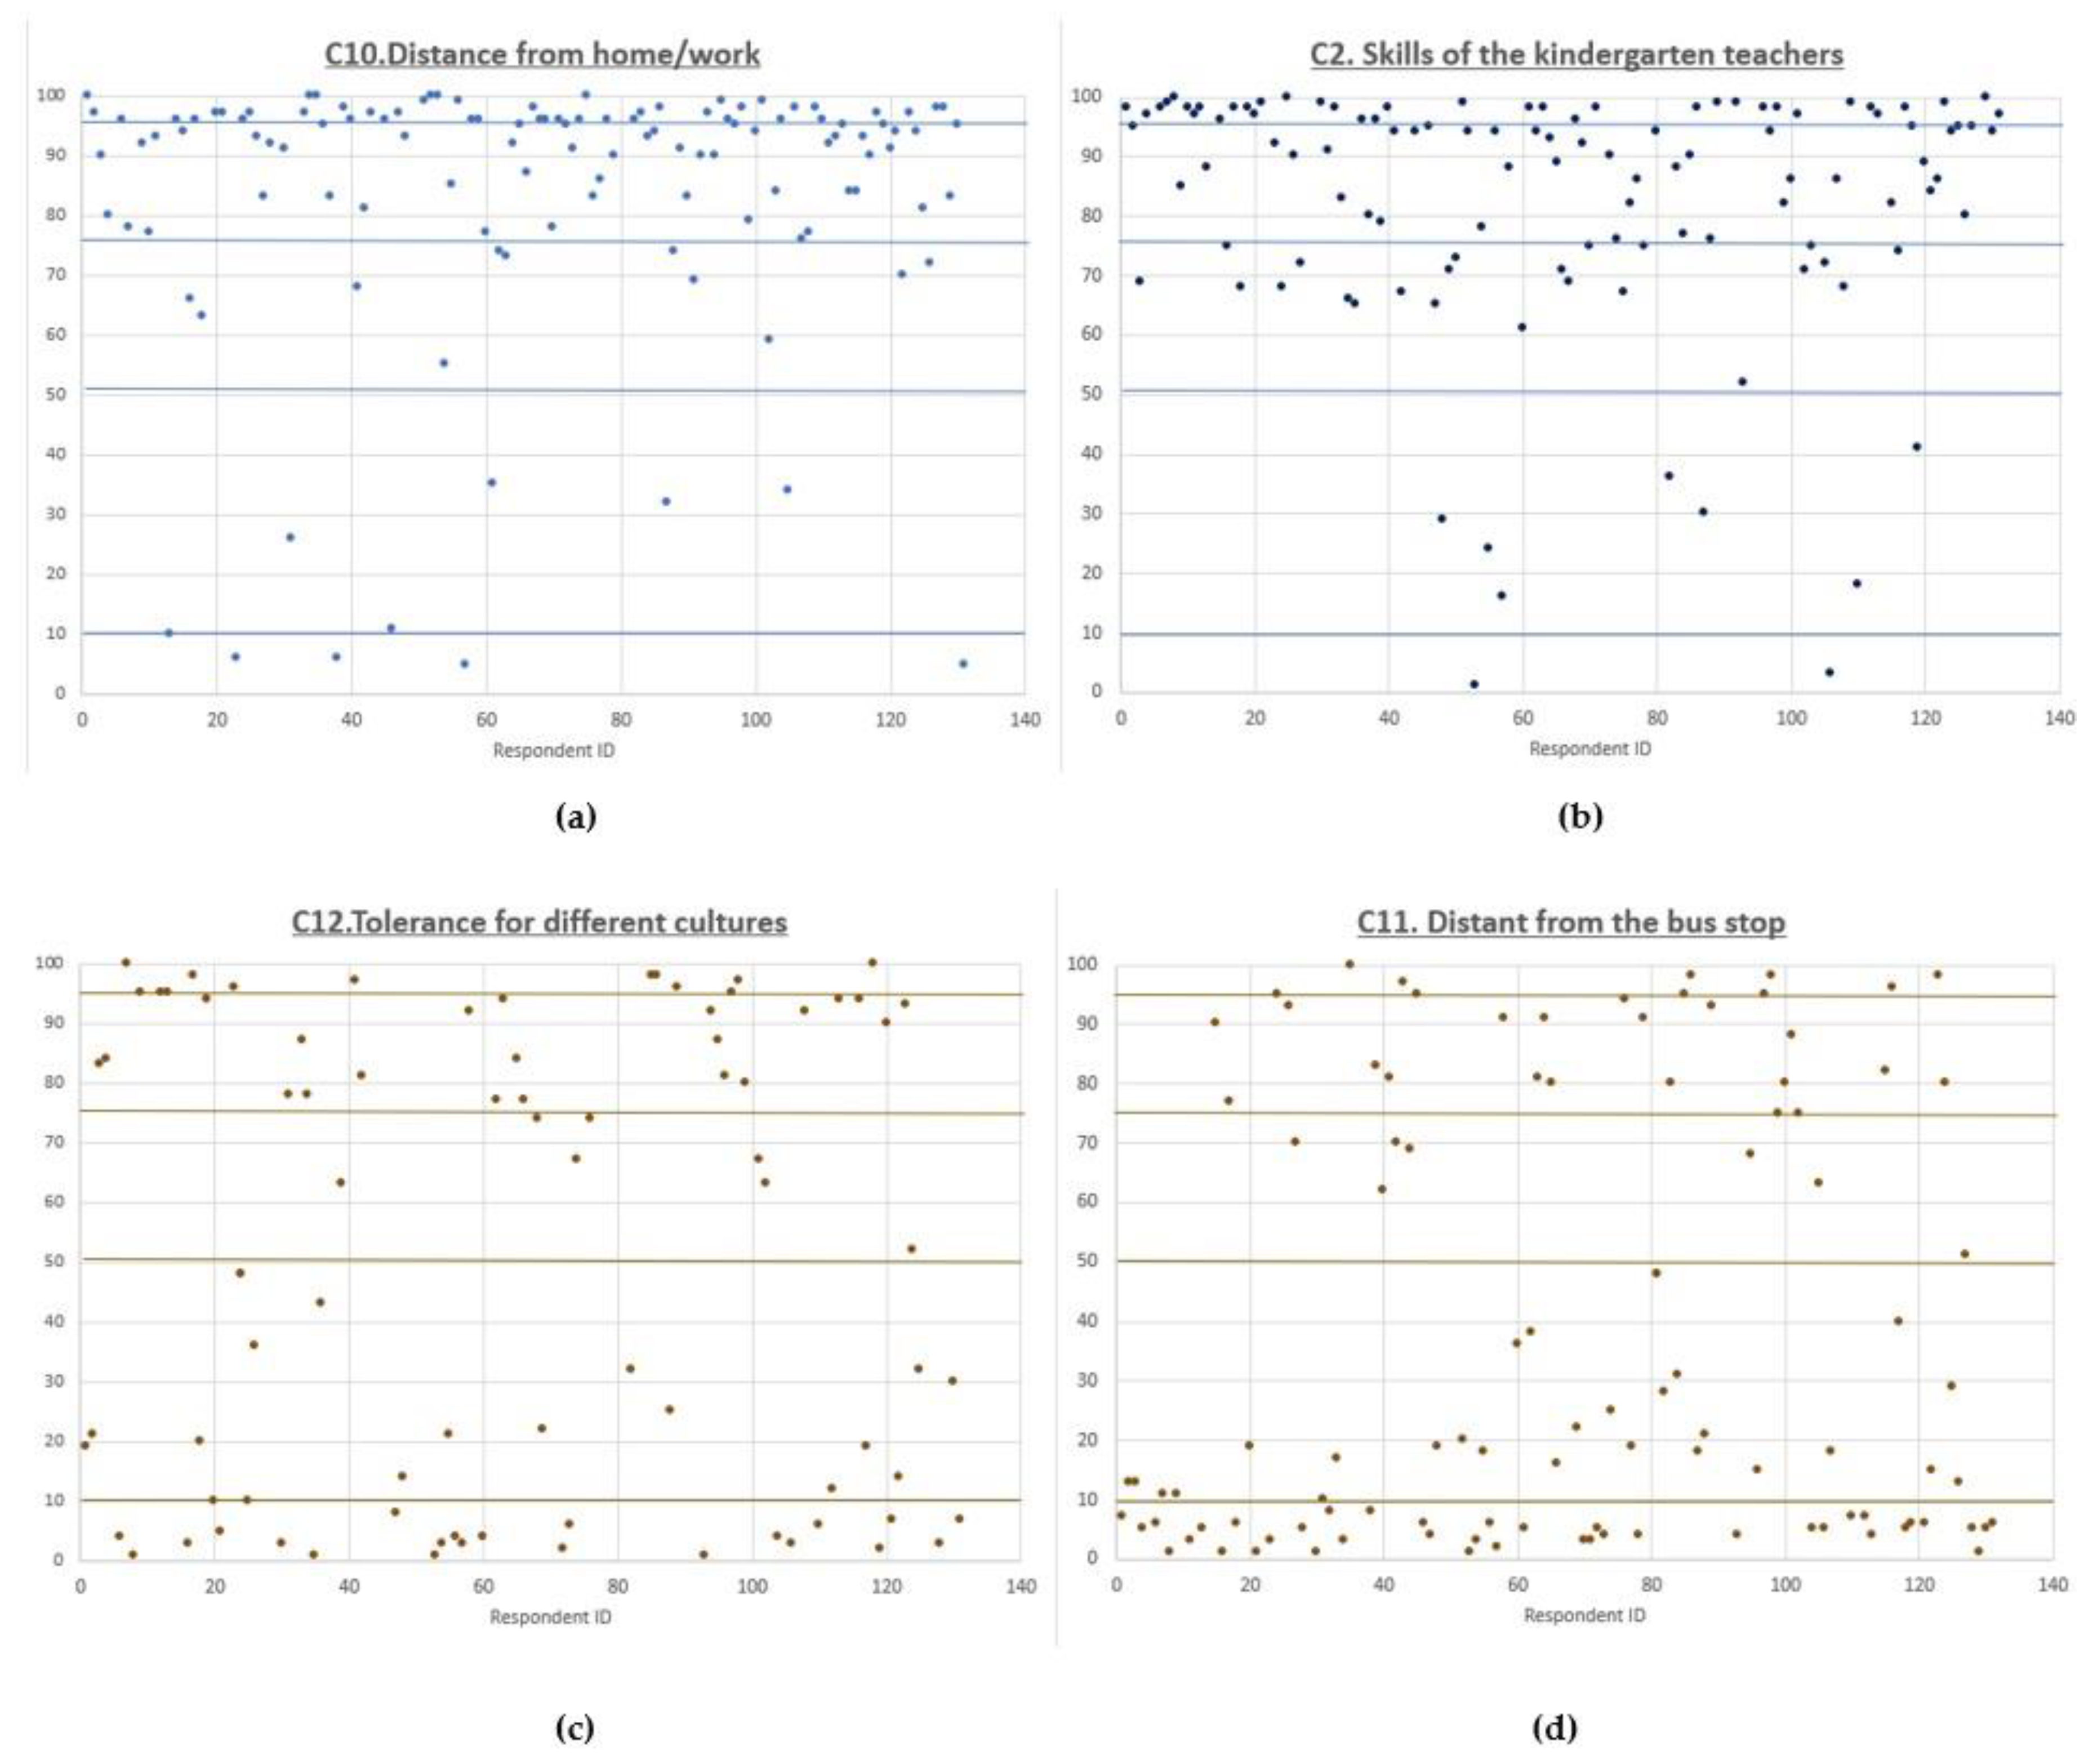
As can be seen, Distance from home (C10) and the Skills of the kindergarten teachers (C2) were detected as the most important aspects of the kindergarten selection process in Vilnius. Tolerance for different cultures (C12) and the Distance from the bus stop (C11) were identified as the least important criteria.
5. Results and Discussion
VAS matrix is a set of the VAS scales placed in a single question. Since multiple data like the importance value and the ranking information can be gathered from a single survey question, the VAS matrix might be successfully exploited for the survey-based criteria weighting tasks. However, biases of the respondents and the psychometric features of the VAS scales should be carefully treated to avoid uncertainties in the preference elicitation results.
Scatterplots of the two criteria with the highest mean value and with the lowest mean value were generated to illustrate the tendencies in the data collected with the VAS matrix (
Figure 3). Analysis of the data distribution shows that the majority of estimates are in the range of 60–100. This is in line with the research showing that direct weighting performed with the Likert-scales or the VAS-scales shows a tendency towards the positive skew of the collected data. On the cognitive side, this may also suppose that parents have a tendency to say that most of the analyzed aspects are important for assessing the quality of kindergartens.
It is also noteworthy to observe that assessments ranging from 40 to 60 were hardly ever provided by the respondents. It might be related to the design of the VAS scales, where the default position of the marker is placed in the middle between the two linguistic anchors. A non-moved marker can be understood either as the non-response situation, or as the cognitive answer that the criteria is neither important nor unimportant (value = 50). To prevent the uncertainties caused by the erroneous interpretation, we consider this situation as the missing data.
In the numerical example presented in this paper, missing data is noticed in 72.84% of the answers. The accuracy of the survey results is usually sought to be improved by ensuring an appropriate sample of the responses. However, recently the significant decrease in the response rate of the online polls can be noticed [
59]. In these circumstances, the opinion of each respondent becomes increasingly important. Pairwise comparison approaches like AHP or SWARA are not able to deal with the missing data, but it is not an issue for the VASMA weighting. On the contrary, VASMA weighting exploits the non-response values to achieve the greater accuracy of the preference elicitation results.
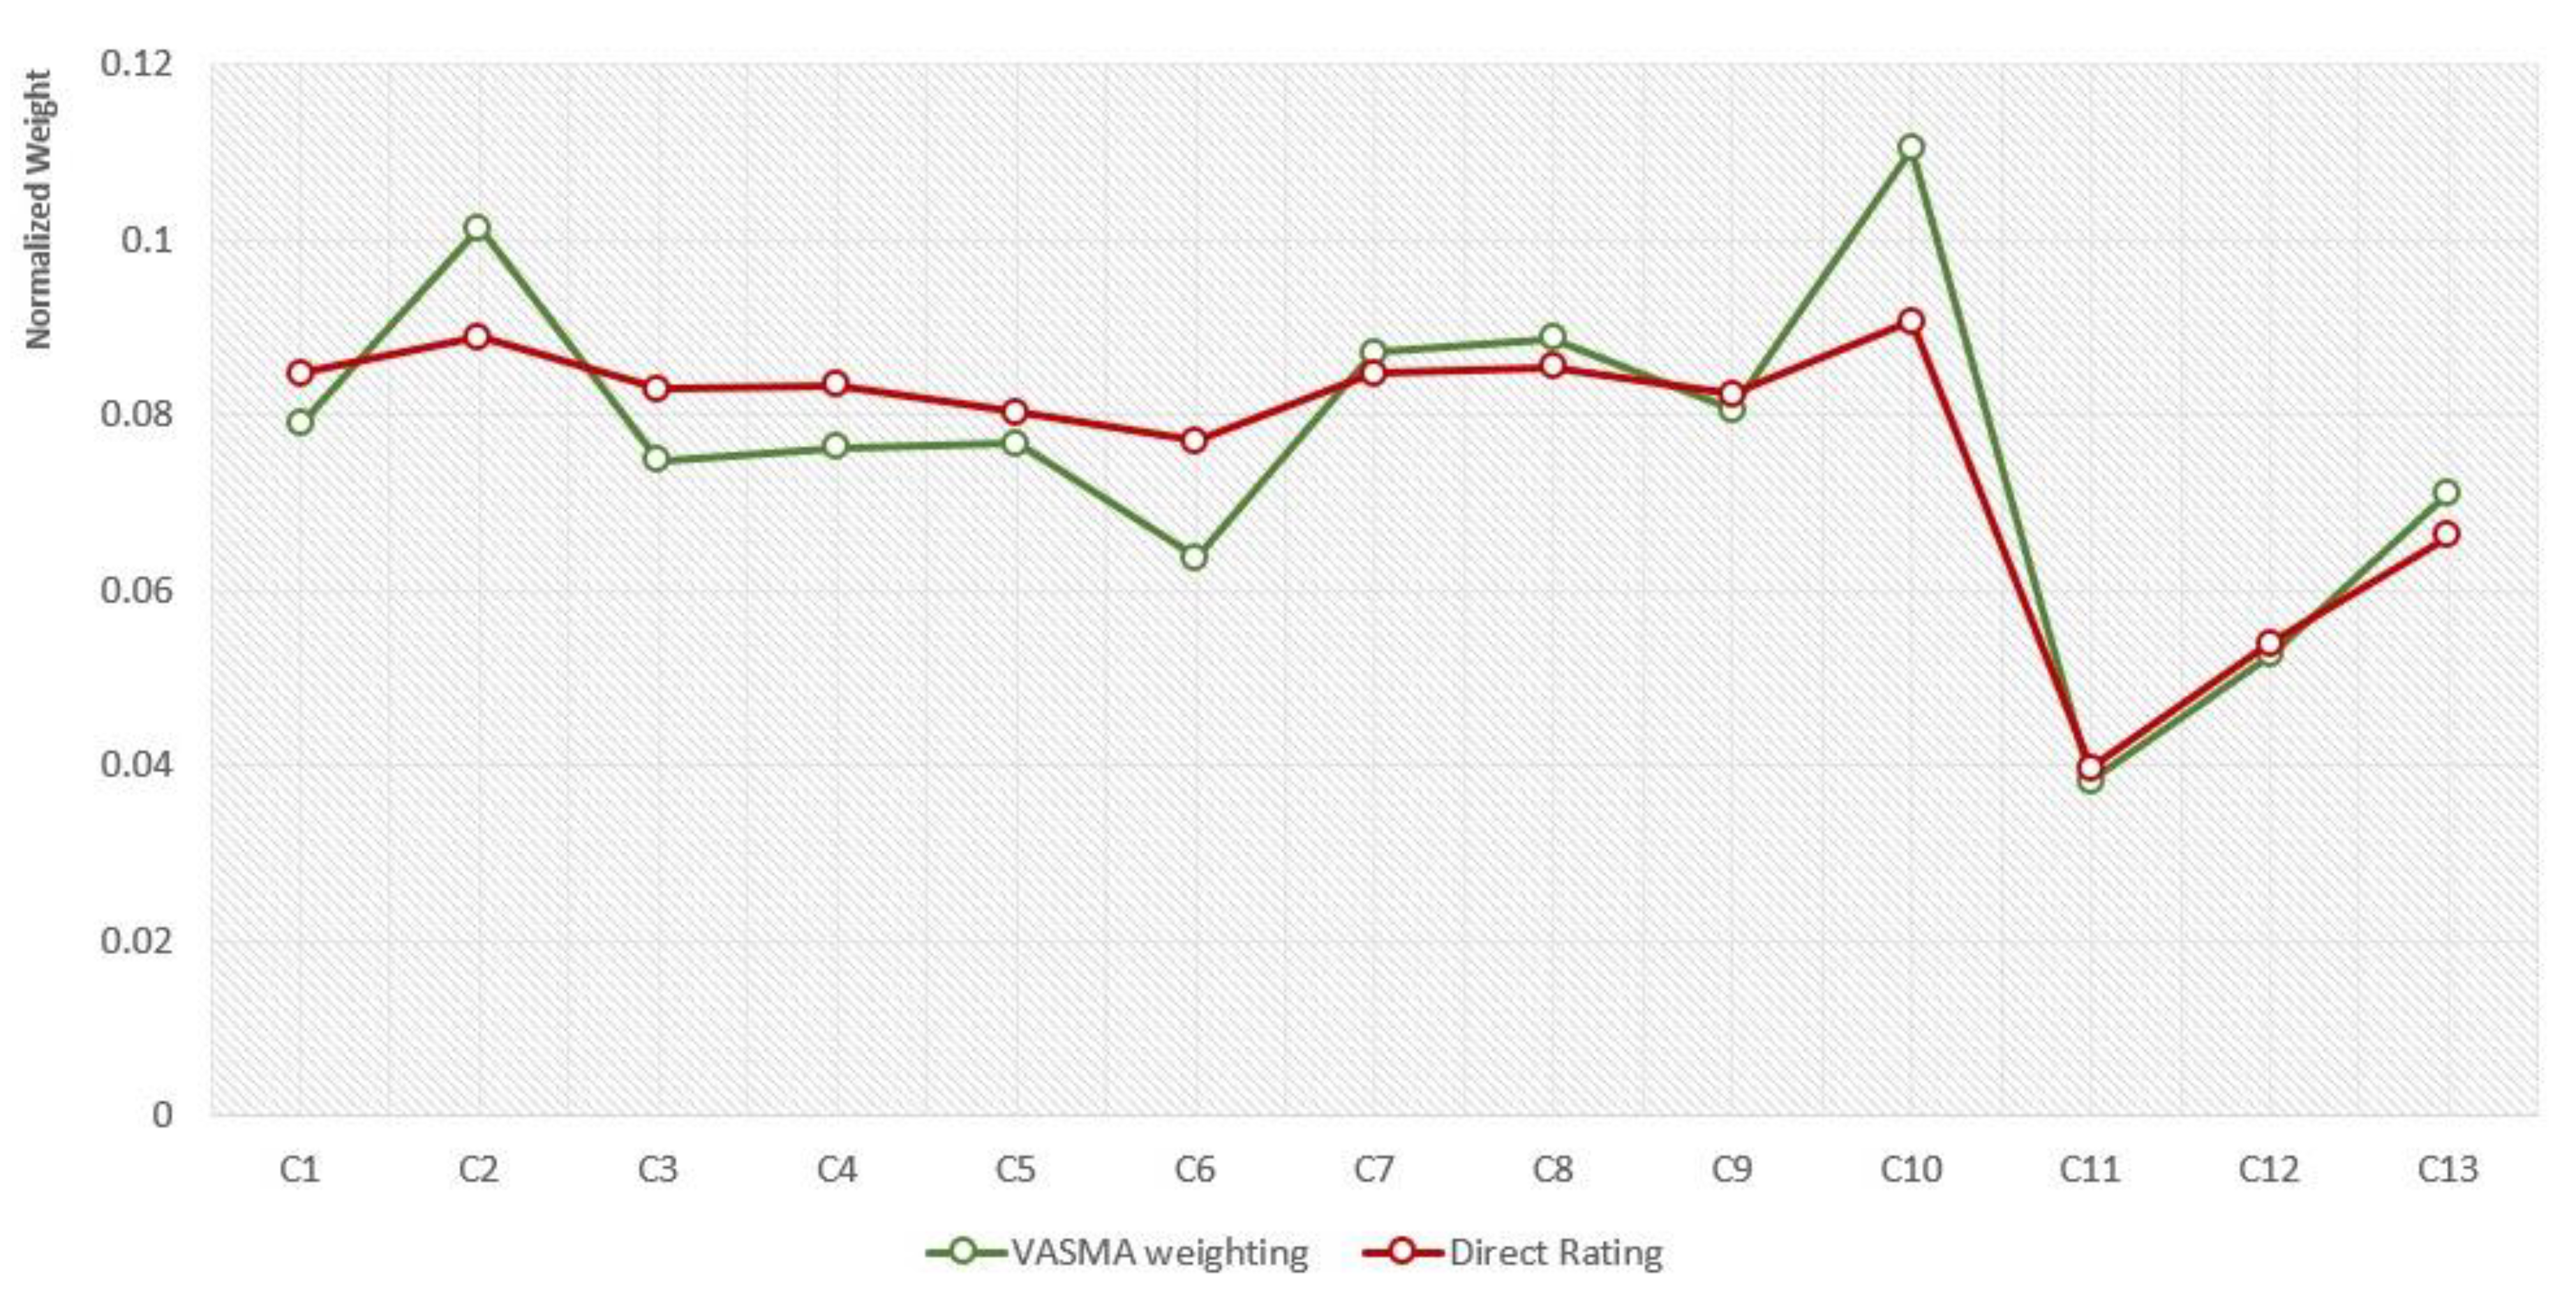
5.1. Comparison of the Direct Rating and VASMA Weights
Direct weighting approaches like point allocation, direct rating, SMART, and SMARTER might be considered as the simplest criteria elicitation methods [
48]. Direct rating (DR) is probably the easiest of them since criteria weights are assessed by purely asking the respondents to assign absolute values of the criteria. Since DR does not require any prior learning on the preference elicitation process, it might also be easily applied for the survey-based criteria weighting [
9]. However, two important disadvantages are recurrently associated with the direct rating methodology: the high potential for biased information [
46] and the tendency towards the low variance of the criteria weights [
9,
44]. A comparison of the DR and VASMA approaches was performed to reveal how the data processing technique integrated into the VASMA weighting methodology affects both the variability and the accuracy of the criteria weights. Both the direct rating and the VASMA weighting techniques employ VAS Matrix as the data collection technique, but the distinctive data processing procedures. While DR simply calculates the averages of the criteria weights proposed by the respondents, VASMA calculates both the subjective and objective weights for the preference elicitation. The criteria weights calculated with the direct rating and VASMA weighting approaches are compared in
Figure 4.
Results presented in
Figure 4 support the idea that DR is typically associated with the low variation of the criteria weights. DR weights calculated for the criteria C1–C10 slightly vary in the interval (0.0770, 0.0906), while the range of the VASMA weights is much wider (0.0637, 0.1104). Respect for the psychometric properties of the VAS scales and the awareness on the uncertainty of the collected data showed that VASMA weighting demonstrates the positive effect for both the equal weighting and the high bias issues that are the vast disadvantages of the DR technique.
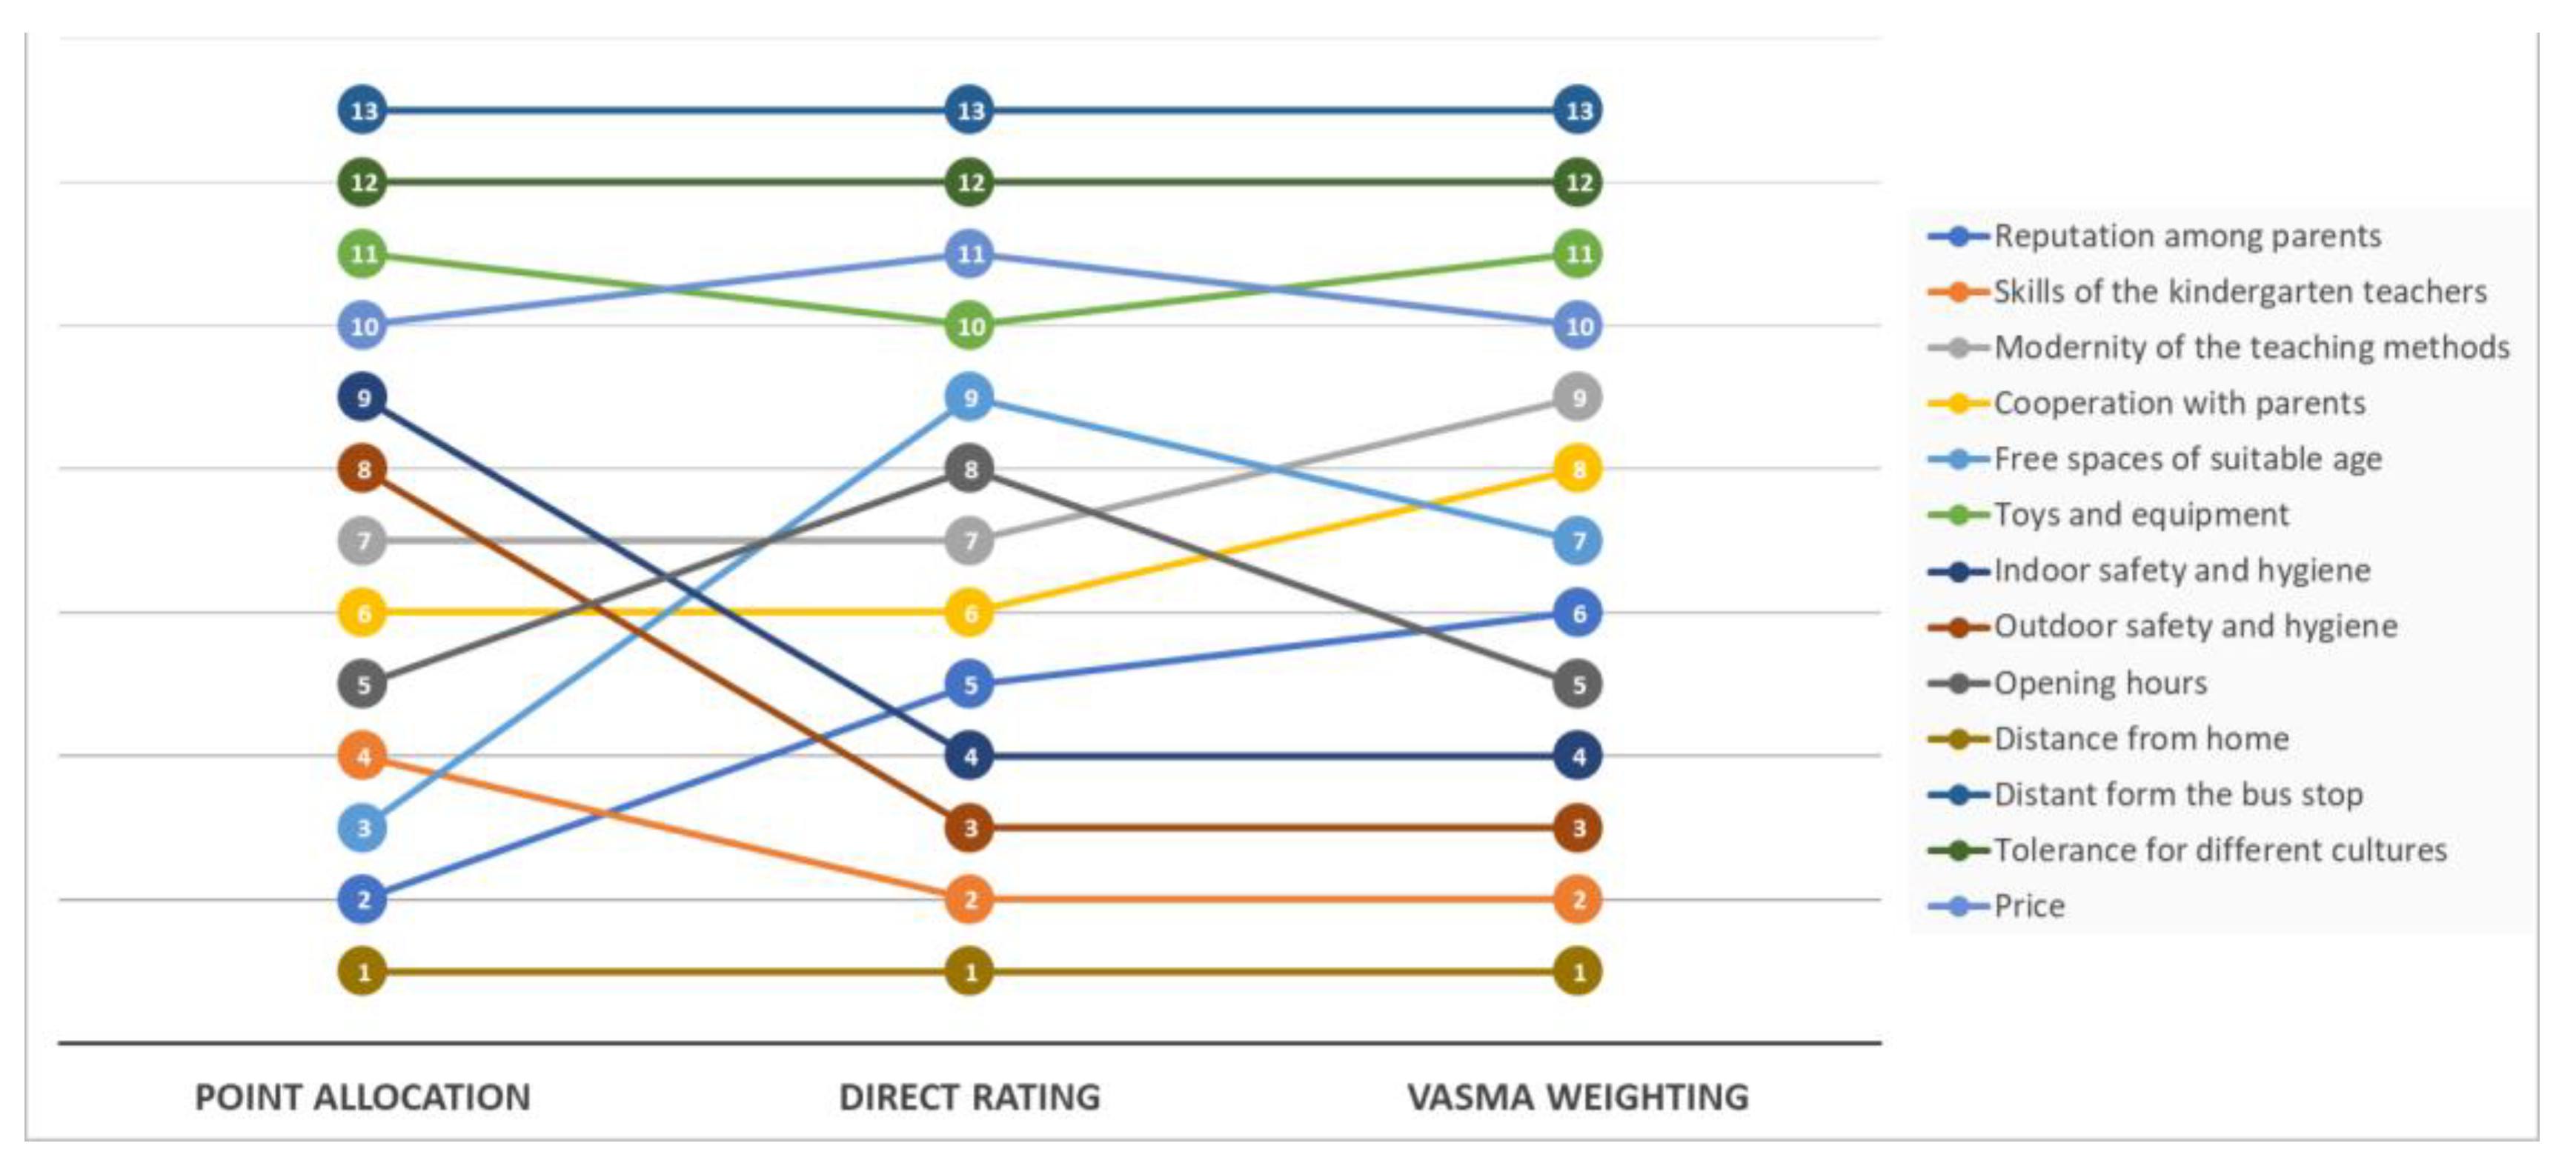
5.2. Sensitivity Analysis
The sensitivity analysis was performed to study the consistency of the obtained ranking. Ranks of the two direct weighting techniques (point allocation and direct rating) and VASMA weighting were determined and compared (
Figure 5). Two popular direct weighting techniques SMART and SWING were not included in the comparison because of the methodological differences in the data collection procedure [
9].
A comparison of the criteria ranks reveals differences between the point allocation (PA), direct rating (DR), and the VASMA weighting approaches (
Figure 5). Due to the different direct weighting methodologies, PA and DR techniques give significantly different results. Greater stability can be observed between the criteria ranks determined by the direct rating and the VASMA weighting approaches. However, the weight values calculated by the DR and VASMA weighting techniques noticeably differ. Since a little variation of the weight values is repeatedly identified as the downside of the straightforward DR technique, VASMA weighting can be chosen as the solution to this issue. Results presented in the
Figure 4 prove that the variance of the weighting values for the criterions C10 (Distance from home), C2 (Skills of kindergarten teachers), C8 (Outdoor safety and hygiene), and C7 (Indoor safety and hygiene) are considerably wider when the novel preference elicitation technique VASMA weighting is applied.
6. Conclusions
Criteria weighting is an integral part of the multicriteria decision-making process. When the opinions of the wider audience are needed, electronic surveys may be successfully employed to collect data for the preference elicitation procedure. Since both the psychologists and psychometricians agree that humans are much better at making comparative judgments than at making absolute judgments, visual analogue scales (VAS) have been proposed as the affective data collection tool for the assessment of the respondents’ traits. However, survey-based criteria weighting processes are typically accompanied by the biases of the evaluators and the uncertainty of the experimental conditions. Besides, end-aversion bias and the positive skew are also the companions of the VAS based preference elicitation. The novel criteria weighting technique VASMA weighting respects the psychometric features of the VAS scales and analyzes the uncertainties caused by the survey-based criteria weighting. It is achieved by integrating the WASPAS-SVNS multicriteria decision making approach for the determination of the subjective weights and Shannon entropy for the calculation of the objective weights.
A numerical example analyzing the importance of the criteria that affect parents’ decisions regarding the choice of the kindergarten institution was performed to reveal the practicalities of the proposed methodology. The experiment presented in this paper revealed that the data processing technique integrated into the VASMA weighting methodology is able to overcome the main disadvantages of the direct rating technique—the high biases of the collected data and the low variation of the criteria weights.
In the future, it would be interesting to analyze why the last three criterions presented in the VAS matrix got significantly lower weights than the rest of them. Is it an accidental situation, or is it associated with their position in the VAS Matrix? An optimal number of the criteria that can be weighted with the VASMA weighting methodology also should be analyzed in the future. It would be also interesting to disclose how the number of respondents and their homogeneity affects VASMA weighting values.
Author Contributions
Conceptualization, I.L., E.K.Z., R.B. and B.J.; methodology, I.L., E.K.Z., R.B. and B.J.; software, I.L.; validation, I.L., E.K.Z., R.B. and B.J.; formal analysis, I.L. and R.B.; investigation, I.L. and B.J.; resources, I.L. and B.J.; data curation, I.L.; writing—original draft preparation, I.L. and B.J.; writing—review and editing, I.L., E.K.Z., R.B. and B.J.; visualization, I.L.; supervision, R.B.; project administration, I.L. and R.B. All authors have read and agreed to the published version of the manuscript.
Funding
This research received no external funding.
Conflicts of Interest
The authors declare no conflict of interest.
References
- He, T.; Zhang, S.; Wei, G.; Wang, R.; Wu, J.; Wei, C. CODAS method for 2-tuple linguistic Pythagorean fuzzy multiple attribute group decision making and its application to financial management performance assessment. Technol. Econ. Dev. Econ. 2020, 26, 920–932. [Google Scholar] [CrossRef]
- Mishra, A.R.; Rani, P.; Pardasani, K.R.; Mardani, A.; Stević, Ž.; Pamučar, D. A novel entropy and divergence measures with multi-criteria service quality assessment using interval-valued intuitionistic fuzzy TODIM method. Soft Comput. 2020, 24, 11641–11661. [Google Scholar] [CrossRef]
- Lai, Y.; Ishizaka, A. The application of multicriteria decision analysis methods into talent identification process: A social psychological perspective. J. Bus. Res. 2019, 109, 637–647. [Google Scholar] [CrossRef]
- Semenas, R.; Bausys, R. Modelling of Autonomous Search and Rescue Missions by Interval-Valued Neutrosophic WASPAS Framework. Symmetry 2020, 12, 162. [Google Scholar] [CrossRef]
- Stević, Ž.; Pamučar, D.; Puška, A.; Chatterjee, P. Sustainable supplier selection in healthcare industries using a new MCDM method: Measurement of alternatives and ranking according to Compromise solution (MARCOS). Comput. Ind. Eng. 2020, 140, 106231. [Google Scholar] [CrossRef]
- Lo, W.C.; Lu, C.H.; Chou, Y.C. Application of Multicriteria Decision Making and Multi-Objective Planning Methods for Evaluating Metropolitan Parks in Terms of Budget and Benefits. Mathematics 2020, 8, 1304. [Google Scholar] [CrossRef]
- Shukla, V.; Auriol, G. Methodology for determining stakeholders’ criteria weights in system engineering. In Proceedings of the Poster Workshop at the 2013 Complex Systems Design and Management Conference, Paris, France, 4 December 2013; CSDM: Paris, France, 2013; pp. 1–12. Available online: http://ceur-ws.org/Vol-1085/02-paper.pdf (accessed on 30 August 2020).
- Metzger, M.J.; Flanagin, A.J. Credibility and trust of information in online environments: The use of cognitive heuristics. J. Pragmat. 2013, 59 Pt B, 210–220. [Google Scholar] [CrossRef]
- Aubert, A.H.; Esculier, F.; Lienert, J. Recommendations for online elicitation of swing weights from citizens in environmental decision-making. Oper. Res. Perspect. 2020, 7, 100156. [Google Scholar] [CrossRef]
- Saris, W.E.; Gallhofer, I.N. Design, Evaluation, and Analysis of Questionnaires for Survey Research; John Wiley & Sons: New York, NY, USA, 2014. [Google Scholar]
- Molléri, J.S.; Petersen, K.; Mendes, E. An empirically evaluated checklist for surveys in software engineering. Inform. Softw. Technol. 2020, 119, 106240. [Google Scholar] [CrossRef]
- Sudman, S.; Bradburn, N.M.; Schwarz, N. Thinking about Answers: The Application of Cognitive Processes to Survey Methodology; Jossey-Bass: New York, NY, USA, 1996. [Google Scholar]
- Reips, U.D. Standards for Internet-based experimenting. Exp. Psychol. 2002, 49, 243–256. [Google Scholar] [CrossRef]
- Dillman, D.A.; Smyth, J.D.; Christian, L.M. Internet, Mail, and Mixed-Mode Surveys: The Tailored Design Method, 3rd ed.; John Wiley & Sons, Inc.: Hoboken, NJ, USA, 2009. [Google Scholar]
- Osgood, C.E.; Suci, G.J.; Tannenbaum, P.H. The Measurement of Meaning; University of Illinois Press: Urbana, IL, USA, 1957. [Google Scholar]
- Laming, D. Understanding Human Motivation: What Makes People Tick; Blackwells: Malden, MA, USA, 2004. [Google Scholar] [CrossRef]
- Sung, Y.T.; Wu, J.S. The Visual Analogue Scale for Rating, Ranking and Paired-Comparison (VAS-RRP): A new technique for psychological measurement. Behav. Res. Methods 2018, 50, 1694–1715. [Google Scholar] [CrossRef] [PubMed]
- Likert, R. A technique for the measurement of attitudes. Arch. Psychol. 1932, 22, 140–155. Available online: https://psycnet.apa.org/record/1933-01885-001 (accessed on 30 August 2020).
- Chang, R.; Little, T. Innovations for Evaluation Research: Multiform Protocols, Visual Analog Scaling, and the Retrospective Pretest–Posttest Design. Eval. Health Prof. 2018, 41, 246–269. [Google Scholar] [CrossRef] [PubMed]
- Musangu, L.M.; Kekwaletswe, R.M. Comparison of likert scale with visual analogue scale for strategic information systems planning measurements: A preliminary study. In Proceedings of the IADIS International Conference Information Systems, Lisbon, Portugal, 17–19 July 2012; Nunes, M.B., Isaias, P., Powell, P., Eds.; IADIS: Lisbon, Portugal, 2012; pp. 108–115. Available online: http://www.iadisportal.org/digital-library/comparison-of-likert-scale-with-visual-analogue-scale-for-strategic-information-systems-planning-measurements-a-preliminary-study (accessed on 30 August 2020).
- Kuhlmann, T.; Dantlgraber, M.; Reips, U. Investigating measurement equivalence of visual analogue scales and Likert-type scales in Internet-based personality questionnaires. Behav. Res. Methods 2017, 49, 2173–2181. [Google Scholar] [CrossRef] [PubMed]
- Reips, U.-D.; Funke, F. Interval-level measurement with visual analogue scales in Internet-based research: VAS Generator. Behav. Res. Methods 2008, 40, 699–704. [Google Scholar] [CrossRef] [PubMed]
- Stanley, N.; Jenkins, S. Watch what I do: Using graphical input controls in web surveys. In The Challenges of a Changing World, Proceedings of the Fifth International Conference of the Association for Survey Computing, Southampton, UK, 12–14 September 2007; ASC: Berkeley, CA, USA, 2007; pp. 81–92. [Google Scholar]
- Funke, F.; Reips, U.-D. Why semantic differentials in web-based research should be made from visual analogue scales and not from 5-point scales. Field Methods 2012, 24, 310–327. [Google Scholar] [CrossRef]
- Yusoff, R.; Janor, R.M. Generation of an Interval Metric Scale to Measure Attitude. SAGE Open 2014, 4, 1–16. [Google Scholar] [CrossRef]
- Rashidi, A.A.; Anis, A.H.; Marra, C.A. Do visual analogue scale (VAS) derived standard gamble (SG) utilities agree with Health Utilities Index utilities? A comparison of patient and community preferences for health status in rheumatoid arthritis patients. Health Qual. Life Outcomes 2006, 4, 25. [Google Scholar] [CrossRef]
- Schmitt, D.P.; Allik, J. Simultaneous Administration of the Rosenberg Self-Esteem Scale in 53 Nations: Exploring the Universal and Culture-Specific Features of Global Self-Esteem. J. Personal. Soc. Psychol. 2005, 89, 623–642. [Google Scholar] [CrossRef]
- Streiner, D.L.; Norman, G.R.; Cairney, J. Health Measurement Scales: A Practical Guide to Their Development and Use, 5th ed.; Oxford University Press: Oxford, UK, 2014. [Google Scholar]
- Zavadskas, E.K.; Bausys, R.; Mazonaviciute, I. Safety evaluation methodology of urban public parks by multicriteria decision making. Landsc. Urban Plan. 2019, 189, 372–381. [Google Scholar] [CrossRef]
- Pamučar, D.; Stević, Ž.; Sremac, S. A new model for determining weight coefficients of criteria in MCDM models: Full consistency method (FUCOM). Symmetry 2018, 10, 393. [Google Scholar] [CrossRef]
- Saaty, T.L. A scaling method for priorities in hierarchical structures. J. Math. Psychol. 1977, 15, 234–281. [Google Scholar] [CrossRef]
- Gabus, A.; Fontela, E. World Problems an Invitation to Further Thought within the Framework of DEMATEL; Battelle Geneva Research Centre: Geneva, Switzerland, 1972; pp. 1–8. [Google Scholar]
- Kersuliene, V.; Zavadskas, E.K.; Turskis, Z. Selection of rational dispute resolution method by applying new step-wise weight assessment ratio analysis (SWARA). J. Bus. Econ. Manag. 2010, 11, 243–258. [Google Scholar] [CrossRef]
- Stanujkic, D.; Zavadskas, E.K.; Karabasevic, D.; Smarandache, F.; Turskis, Z. The use of the pivot pairwise relative criteria importance assessment method for determining the weights of criteria. Rom. J. Econ. Forecast 2017, 20, 116–133. [Google Scholar] [CrossRef]
- Shannon, C.E.; Weaver, W. The Mathematical Theory of Communication; University Illinois Press: Urbana, IL, USA, 1963. [Google Scholar]
- Diakoulaki, D.; Mavrotas, G.; Papayannakis, L. Determining objective weights in multiple criteria problems: The CRITIC method. Comput. Oper. Res. 1995, 22, 763–770. [Google Scholar] [CrossRef]
- Srdjevic, B.; Medeiros, Y.; Srđevic, Z.; Schaer, M. Evaluating management strategies in Paraguacu river basin by analytic hierarchy process. In Proceedings of the First Biennial Meeting of the International Environmental Modeling and Software Society, Lugano, Switzerland, 1 July 2002; pp. 42–47. [Google Scholar]
- Odu, G. Weighting methods for multicriteria decision making technique. J. Appl. Sci. Environ. Manag. 2019, 23, 1449–1457. [Google Scholar] [CrossRef]
- Vinogradova, I.; Podvezko, V.; Zavadskas, E.K. The recalculation of the weights of criteria in MCDM methods using the bayes approach. Symmetry 2018, 10, 205. [Google Scholar] [CrossRef]
- Wang, T.C.; Lee, H.D. Developing a fuzzy TOPSIS approach based on subjective weights and objective weights. Expert Syst. Appl. 2009, 36, 8980–8985. [Google Scholar] [CrossRef]
- Md Saad, R.; Ahmad, M.Z.; Abu, M.S.; Jusoh, M.S. Hamming Distance Method with Subjective and Objective Weights for Personnel Selection. Sci. World J. 2014, 2014, 865495. [Google Scholar] [CrossRef]
- Von Winterfeldt, D.; Edwards, W. Decision Analysis and Behavioral Research; Cambridge University Press: Cambridge, UK, 1986. [Google Scholar]
- Edwards, W.; Barron, F.H. SMARTS and SMARTER: Improved simple methods for multiattribute utility measurement. Organ. Behav. Hum. Decis. 1994, 60, 306–325. [Google Scholar] [CrossRef]
- Bottomley, P.; Doyle, J.; Green, R. Testing the Reliability of Weight Elicitation Methods: Direct Rating versus Point Allocation. J. Mark. Res. 2000, 37, 508–513. [Google Scholar] [CrossRef]
- Van Til, J.A.; Dolan, J.G.; Stiggelbout, A.M.; Groothuis, K.C.; Ijzerman, M.J. The use of multi-criteria decision analysis weight elicitation techniques in patients with mild cognitive impairment: A pilot study. Patient 2008, 1, 127–135. [Google Scholar] [CrossRef]
- Burckhardt, M.; Fleischer, S.; Berg, A. Agreement between the Schedule for the Evaluation of Individual Quality of Life-Direct Weighting (SEIQoL-DW) interview and a paper-administered adaption. BMC Med. Res. Methodol. 2020, 20, 80. [Google Scholar] [CrossRef] [PubMed]
- Mustajoki, J.; Hämäläinen, R.P.; Salo, A. Decision Support by Interval SMART/SWING—Incorporating Imprecision in the SMART and SWING Methods. Decis. Sci. 2005, 36, 317–339. [Google Scholar] [CrossRef]
- Németh, B.; Molnár, A.; Bozóki, S.; Wijaya, K.; Inotai, A.; Campbell, J.D.; Kaló, Z. Comparison of weighting methods used in multicriteria decision analysis frameworks in healthcare with focus on low-and middle-income countries. J. Comp. Eff. Res. 2019, 8, 195–204. [Google Scholar] [CrossRef] [PubMed]
- Stiggelbout, A.M.; de Vogel-Voogt, E.; Noordijk, E.M.; Vliet Vlieland, T.P. Individual quality of life: Adaptive conjoint analysis as an alternative for direct weighting? Qual. Life Res. 2008, 17, 641–649. [Google Scholar] [CrossRef] [PubMed][Green Version]
- Hamidou, Z.; Baumstarck, K.; Chinot, O.; Barlesi, F.; Salas, S.; Leroy, T.; Auquier, P. Domains of quality of life freely expressed by cancer patients and their caregivers: Contribution of the SEIQoL. Health Qual. Life Outcomes 2017, 15, 99. [Google Scholar] [CrossRef]
- Dahl, F.; Osteras, N. Quantifying information content in survey data by entropy. Entropy 2010, 12, 161–163. [Google Scholar] [CrossRef]
- Friesner, D.; Valente, F.; Bozman, C.S. Using Entropy-Based Information Theory to Evaluate Survey Research. J. Mark. Dev. Compet. 2016, 10, 32–48. [Google Scholar]
- Zavadskas, E.K.; Turskis, Z.; Antucheviciene, J.; Zakarevicius, A. Optimization of Weighted Aggregated Sum Product Assessment. Electron. Elektrotech. 2012, 6, 3–6. [Google Scholar] [CrossRef]
- Bausys, R.; Kazakeviciute-Januskeviciene, G.; Cavallaro, F.; Usovaite, A. Algorithm Selection for Edge Detection in Satellite Images by Neutrosophic WASPAS Method. Sustainability 2020, 12, 548. [Google Scholar] [CrossRef]
- Mardani, A.; Saraji, M.K.; Mishra, A.R.; Rani, P. A novel extended approach under hesitant fuzzy sets to design a framework for assessing the key challenges of digital health interventions adoption during the COVID-19 outbreak. Appl. Soft Comput. 2020, 96, 106613. [Google Scholar] [CrossRef] [PubMed]
- Baušys, R.; Juodagalvienė, B.; Žiūrienė, R.; Pankrašovaitė, I.; Kamarauskas, J.; Usovaitė, A.; Gaižauskas, D. The residence plot selection model for family house in Vilnius by neutrosophic WASPAS method. Int. J. Strateg. Prop. Manag. 2020, 24, 182–196. [Google Scholar] [CrossRef]
- Altaim, A.A.; LeRoux, A.A. The use of box-counting method in the interpretation of Visual Analogue Scale scores. JAPER 2019, 9, 1–6. [Google Scholar]
- Malović, M.; Malović, S. Parents’ perspective on the quality of kindergarten. Res. Pedagog. 2017, 7, 200–220. [Google Scholar] [CrossRef]
- Beullens, K.; Loosveldt, G.; Vandenplas, C.; Stoop, I. Response rates in the European Social Survey: Increasing, decreasing, or a matter of fieldwork efforts? Surv. Methods Insights Field 2018. Available online: https://surveyinsights.org/?p=9673 (accessed on 30 August 2020). [CrossRef]
© 2020 by the authors. Licensee MDPI, Basel, Switzerland. This article is an open access article distributed under the terms and conditions of the Creative Commons Attribution (CC BY) license (http://creativecommons.org/licenses/by/4.0/).

 ,
, 


